CN115067976A - Estimation device, method, and computer-readable storage medium - Google Patents
Estimation device, method, and computer-readable storage mediumDownload PDFInfo
- Publication number
- CN115067976A CN115067976ACN202210213756.9ACN202210213756ACN115067976ACN 115067976 ACN115067976 ACN 115067976ACN 202210213756 ACN202210213756 ACN 202210213756ACN 115067976 ACN115067976 ACN 115067976A
- Authority
- CN
- China
- Prior art keywords
- image
- bone
- bone density
- subject
- neural network
- Prior art date
- Legal status (The legal status is an assumption and is not a legal conclusion. Google has not performed a legal analysis and makes no representation as to the accuracy of the status listed.)
- Pending
Links
Images


Classifications
- A—HUMAN NECESSITIES
- A61—MEDICAL OR VETERINARY SCIENCE; HYGIENE
- A61B—DIAGNOSIS; SURGERY; IDENTIFICATION
- A61B6/00—Apparatus or devices for radiation diagnosis; Apparatus or devices for radiation diagnosis combined with radiation therapy equipment
- A61B6/50—Apparatus or devices for radiation diagnosis; Apparatus or devices for radiation diagnosis combined with radiation therapy equipment specially adapted for specific body parts; specially adapted for specific clinical applications
- A61B6/505—Apparatus or devices for radiation diagnosis; Apparatus or devices for radiation diagnosis combined with radiation therapy equipment specially adapted for specific body parts; specially adapted for specific clinical applications for diagnosis of bone
- A—HUMAN NECESSITIES
- A61—MEDICAL OR VETERINARY SCIENCE; HYGIENE
- A61B—DIAGNOSIS; SURGERY; IDENTIFICATION
- A61B6/00—Apparatus or devices for radiation diagnosis; Apparatus or devices for radiation diagnosis combined with radiation therapy equipment
- A61B6/02—Arrangements for diagnosis sequentially in different planes; Stereoscopic radiation diagnosis
- A61B6/03—Computed tomography [CT]
- A61B6/032—Transmission computed tomography [CT]
- A—HUMAN NECESSITIES
- A61—MEDICAL OR VETERINARY SCIENCE; HYGIENE
- A61B—DIAGNOSIS; SURGERY; IDENTIFICATION
- A61B6/00—Apparatus or devices for radiation diagnosis; Apparatus or devices for radiation diagnosis combined with radiation therapy equipment
- A61B6/48—Diagnostic techniques
- A61B6/482—Diagnostic techniques involving multiple energy imaging
- A—HUMAN NECESSITIES
- A61—MEDICAL OR VETERINARY SCIENCE; HYGIENE
- A61B—DIAGNOSIS; SURGERY; IDENTIFICATION
- A61B6/00—Apparatus or devices for radiation diagnosis; Apparatus or devices for radiation diagnosis combined with radiation therapy equipment
- A61B6/48—Diagnostic techniques
- A61B6/483—Diagnostic techniques involving scattered radiation
- A—HUMAN NECESSITIES
- A61—MEDICAL OR VETERINARY SCIENCE; HYGIENE
- A61B—DIAGNOSIS; SURGERY; IDENTIFICATION
- A61B6/00—Apparatus or devices for radiation diagnosis; Apparatus or devices for radiation diagnosis combined with radiation therapy equipment
- A61B6/52—Devices using data or image processing specially adapted for radiation diagnosis
- A61B6/5211—Devices using data or image processing specially adapted for radiation diagnosis involving processing of medical diagnostic data
- A61B6/5217—Devices using data or image processing specially adapted for radiation diagnosis involving processing of medical diagnostic data extracting a diagnostic or physiological parameter from medical diagnostic data
- A—HUMAN NECESSITIES
- A61—MEDICAL OR VETERINARY SCIENCE; HYGIENE
- A61B—DIAGNOSIS; SURGERY; IDENTIFICATION
- A61B6/00—Apparatus or devices for radiation diagnosis; Apparatus or devices for radiation diagnosis combined with radiation therapy equipment
- A61B6/52—Devices using data or image processing specially adapted for radiation diagnosis
- A61B6/5211—Devices using data or image processing specially adapted for radiation diagnosis involving processing of medical diagnostic data
- A61B6/5223—Devices using data or image processing specially adapted for radiation diagnosis involving processing of medical diagnostic data generating planar views from image data, e.g. extracting a coronal view from a 3D image
- A—HUMAN NECESSITIES
- A61—MEDICAL OR VETERINARY SCIENCE; HYGIENE
- A61B—DIAGNOSIS; SURGERY; IDENTIFICATION
- A61B6/00—Apparatus or devices for radiation diagnosis; Apparatus or devices for radiation diagnosis combined with radiation therapy equipment
- A61B6/52—Devices using data or image processing specially adapted for radiation diagnosis
- A61B6/5211—Devices using data or image processing specially adapted for radiation diagnosis involving processing of medical diagnostic data
- A61B6/5229—Devices using data or image processing specially adapted for radiation diagnosis involving processing of medical diagnostic data combining image data of a patient, e.g. combining a functional image with an anatomical image
- A61B6/5235—Devices using data or image processing specially adapted for radiation diagnosis involving processing of medical diagnostic data combining image data of a patient, e.g. combining a functional image with an anatomical image combining images from the same or different ionising radiation imaging techniques, e.g. PET and CT
- G—PHYSICS
- G06—COMPUTING OR CALCULATING; COUNTING
- G06N—COMPUTING ARRANGEMENTS BASED ON SPECIFIC COMPUTATIONAL MODELS
- G06N3/00—Computing arrangements based on biological models
- G06N3/02—Neural networks
- G06N3/04—Architecture, e.g. interconnection topology
- G06N3/0464—Convolutional networks [CNN, ConvNet]
- G—PHYSICS
- G06—COMPUTING OR CALCULATING; COUNTING
- G06N—COMPUTING ARRANGEMENTS BASED ON SPECIFIC COMPUTATIONAL MODELS
- G06N3/00—Computing arrangements based on biological models
- G06N3/02—Neural networks
- G06N3/08—Learning methods
- G—PHYSICS
- G06—COMPUTING OR CALCULATING; COUNTING
- G06N—COMPUTING ARRANGEMENTS BASED ON SPECIFIC COMPUTATIONAL MODELS
- G06N3/00—Computing arrangements based on biological models
- G06N3/02—Neural networks
- G06N3/08—Learning methods
- G06N3/084—Backpropagation, e.g. using gradient descent
- G—PHYSICS
- G06—COMPUTING OR CALCULATING; COUNTING
- G06N—COMPUTING ARRANGEMENTS BASED ON SPECIFIC COMPUTATIONAL MODELS
- G06N3/00—Computing arrangements based on biological models
- G06N3/02—Neural networks
- G06N3/08—Learning methods
- G06N3/09—Supervised learning
- G—PHYSICS
- G06—COMPUTING OR CALCULATING; COUNTING
- G06T—IMAGE DATA PROCESSING OR GENERATION, IN GENERAL
- G06T7/00—Image analysis
- G06T7/0002—Inspection of images, e.g. flaw detection
- G06T7/0012—Biomedical image inspection
- G—PHYSICS
- G06—COMPUTING OR CALCULATING; COUNTING
- G06V—IMAGE OR VIDEO RECOGNITION OR UNDERSTANDING
- G06V10/00—Arrangements for image or video recognition or understanding
- G06V10/70—Arrangements for image or video recognition or understanding using pattern recognition or machine learning
- G06V10/77—Processing image or video features in feature spaces; using data integration or data reduction, e.g. principal component analysis [PCA] or independent component analysis [ICA] or self-organising maps [SOM]; Blind source separation
- G06V10/778—Active pattern-learning, e.g. online learning of image or video features
- G06V10/7784—Active pattern-learning, e.g. online learning of image or video features based on feedback from supervisors
- G06V10/7792—Active pattern-learning, e.g. online learning of image or video features based on feedback from supervisors the supervisor being an automated module, e.g. "intelligent oracle"
- G—PHYSICS
- G06—COMPUTING OR CALCULATING; COUNTING
- G06N—COMPUTING ARRANGEMENTS BASED ON SPECIFIC COMPUTATIONAL MODELS
- G06N3/00—Computing arrangements based on biological models
- G06N3/02—Neural networks
- G06N3/04—Architecture, e.g. interconnection topology
- G06N3/045—Combinations of networks
- G—PHYSICS
- G06—COMPUTING OR CALCULATING; COUNTING
- G06T—IMAGE DATA PROCESSING OR GENERATION, IN GENERAL
- G06T2207/00—Indexing scheme for image analysis or image enhancement
- G06T2207/10—Image acquisition modality
- G06T2207/10072—Tomographic images
- G06T2207/10081—Computed x-ray tomography [CT]
- G—PHYSICS
- G06—COMPUTING OR CALCULATING; COUNTING
- G06T—IMAGE DATA PROCESSING OR GENERATION, IN GENERAL
- G06T2207/00—Indexing scheme for image analysis or image enhancement
- G06T2207/10—Image acquisition modality
- G06T2207/10116—X-ray image
- G—PHYSICS
- G06—COMPUTING OR CALCULATING; COUNTING
- G06T—IMAGE DATA PROCESSING OR GENERATION, IN GENERAL
- G06T2207/00—Indexing scheme for image analysis or image enhancement
- G06T2207/20—Special algorithmic details
- G06T2207/20081—Training; Learning
- G—PHYSICS
- G06—COMPUTING OR CALCULATING; COUNTING
- G06T—IMAGE DATA PROCESSING OR GENERATION, IN GENERAL
- G06T2207/00—Indexing scheme for image analysis or image enhancement
- G06T2207/20—Special algorithmic details
- G06T2207/20084—Artificial neural networks [ANN]
- G—PHYSICS
- G06—COMPUTING OR CALCULATING; COUNTING
- G06T—IMAGE DATA PROCESSING OR GENERATION, IN GENERAL
- G06T2207/00—Indexing scheme for image analysis or image enhancement
- G06T2207/30—Subject of image; Context of image processing
- G06T2207/30004—Biomedical image processing
- G06T2207/30008—Bone
- G—PHYSICS
- G06—COMPUTING OR CALCULATING; COUNTING
- G06V—IMAGE OR VIDEO RECOGNITION OR UNDERSTANDING
- G06V2201/00—Indexing scheme relating to image or video recognition or understanding
- G06V2201/03—Recognition of patterns in medical or anatomical images
- G06V2201/033—Recognition of patterns in medical or anatomical images of skeletal patterns
Landscapes
- Engineering & Computer Science (AREA)
- Health & Medical Sciences (AREA)
- Life Sciences & Earth Sciences (AREA)
- Medical Informatics (AREA)
- Physics & Mathematics (AREA)
- General Health & Medical Sciences (AREA)
- Biophysics (AREA)
- Molecular Biology (AREA)
- Biomedical Technology (AREA)
- Theoretical Computer Science (AREA)
- Radiology & Medical Imaging (AREA)
- Nuclear Medicine, Radiotherapy & Molecular Imaging (AREA)
- Veterinary Medicine (AREA)
- Heart & Thoracic Surgery (AREA)
- Optics & Photonics (AREA)
- Surgery (AREA)
- Animal Behavior & Ethology (AREA)
- High Energy & Nuclear Physics (AREA)
- Public Health (AREA)
- Pathology (AREA)
- General Physics & Mathematics (AREA)
- Computer Vision & Pattern Recognition (AREA)
- Artificial Intelligence (AREA)
- Evolutionary Computation (AREA)
- Software Systems (AREA)
- Computing Systems (AREA)
- Mathematical Physics (AREA)
- General Engineering & Computer Science (AREA)
- Computational Linguistics (AREA)
- Data Mining & Analysis (AREA)
- Orthopedic Medicine & Surgery (AREA)
- Oral & Maxillofacial Surgery (AREA)
- Dentistry (AREA)
- Quality & Reliability (AREA)
- Pulmonology (AREA)
- Physiology (AREA)
- Databases & Information Systems (AREA)
- Toxicology (AREA)
- Multimedia (AREA)
- Apparatus For Radiation Diagnosis (AREA)
Abstract
Translated fromChinese
Description
Translated fromChinese技术领域technical field
本发明涉及一种推定装置、方法及程序。The present invention relates to an estimation device, method and program.
背景技术Background technique
在骨质疏松症等骨系统疾病中,作为用于诊断骨密度的代表性的骨盐定量方法之一,已知有DXA法(Dual X-ray Absorptiometry:双能X射线吸收测定法)。DXA法为如下方法:利用入射到人体并透射人体的放射线受到由依赖于构成人体的物质(例如,骨)的衰减系数μ(cm2/g)和其密度ρ(g/cm3)及厚度t(cm)表征的衰减,根据用两种能量的放射线拍摄而得到的放射线图像的像素值来计算骨盐量。In bone system diseases such as osteoporosis, a DXA method (Dual X-ray Absorptiometry: dual energy X-ray absorptiometry) is known as one of the representative bone mineral quantitative methods for diagnosing bone density. The DXA method is a method in which radiation incident on the human body and transmitted through the human body is subjected to attenuation coefficient μ (cm2 /g) and its density ρ (g/cm3 ) and thickness depending on the substance (for example, bone) constituting the human body. The attenuation represented by t (cm) is calculated from the pixel value of a radiographic image obtained by imaging with radiation of two energies.
并且,提出有用于使用通过拍摄被摄体而获取的放射线图像来评价骨密度的各种方法。例如,在专利文献1、2中提出有通过使用学习完毕神经网络,根据照有骨的图像推定与骨密度有关的信息的方法,该学习完毕神经网络通过对神经网络进行学习而构建。在专利文献1中所记载的方法中,将通过单纯拍摄而获取的照有骨的图像及骨密度作为教师数据来进行神经网络的学习。并且,在专利文献1中所记载的方法中,将通过单纯拍摄而获取的照有骨的图像、骨密度及与骨密度相关的信息(例如,年龄、性别、体重、饮酒习惯、吸烟习惯、骨折史、体脂肪率及皮下脂肪率等)作为教师数据来进行神经网络的学习。Also, various methods have been proposed for evaluating bone density using a radiographic image acquired by imaging a subject. For example,
另外,单纯拍摄是向被摄体照射一次放射线来获取作为被摄体的透射图像的一张二维图像的摄影方法。在以后的说明中,将通过单纯拍摄而获取的放射线图像称为单纯放射线图像。In addition, simple imaging is an imaging method of irradiating a subject once with radiation to acquire one two-dimensional image that is a transmission image of the subject. In the following description, a radiographic image acquired by simple imaging will be referred to as a simple radiographic image.
专利文献1:美国专利第6064716号说明书Patent Document 1: Specification of US Patent No. 6064716
专利文献2:国际公开第2020/054738号Patent Document 2: International Publication No. 2020/054738
然而,期望进一步高精度地推定骨密度。However, it is desired to estimate the bone density with further high accuracy.
发明内容SUMMARY OF THE INVENTION
本发明是鉴于上述情况而完成的,其目的在于使得能够高精度地推定骨密度。The present invention has been made in view of the above-mentioned circumstances, and an object thereof is to enable accurate estimation of bone density.
基于本发明的推定装置具备至少一个处理器,The estimation device according to the present invention includes at least one processor,
处理器作为学习完毕神经网络发挥作用,所述学习完毕神经网络根据通过单纯拍摄包含骨部的被摄体而获取的单纯放射线图像或通过利用DXA法拍摄被摄体而获取的DXA扫描图像来导出与骨部的骨密度相关的推定结果,The processor functions as a learned neural network derived from a simple radiographic image obtained by simply photographing a subject including a bone portion or a DXA scan image obtained by photographing the subject using the DXA method The estimated result related to the bone density of the bone,
学习完毕神经网络是将以下用作教师数据进行学习而成的:通过合成被摄体的三维CT图像而导出的表示被摄体的合成二维图像;及与被摄体的骨密度相关的信息。After learning, the neural network is learned by using the following as teacher data: a synthetic two-dimensional image representing the subject derived by synthesizing the three-dimensional CT image of the subject; and information related to the bone density of the subject .
另外,在基于本发明的推定装置中,合成二维图像可以通过导出关于三维空间上的各位置处的组成的放射线的衰减系数,并根据衰减系数在预先规定的方向上投影CT图像来导出。In addition, in the estimation device according to the present invention, the composite two-dimensional image can be derived by deriving the attenuation coefficient of the radiation composition about the composition at each position in the three-dimensional space, and projecting the CT image in a predetermined direction according to the attenuation coefficient.
并且,在基于本发明的推定装置中,可为如下:就与骨密度相关的信息而言,确定CT图像中的骨部区域,导出骨部区域中的放射线的衰减系数,并根据基于放射线的衰减系数及骨部区域中的质量衰减系数导出的、骨部区域的各位置处的骨密度来导出与所述骨密度相关的信息。Furthermore, in the estimating device according to the present invention, the information related to the bone density may be determined as follows: the bone region in the CT image is determined, the attenuation coefficient of radiation in the bone region is derived, and the radiation-based attenuation coefficient may be derived. The information about the bone density is derived from the attenuation coefficient and the bone density at each position of the bone region, which is derived from the mass attenuation coefficient in the bone region.
并且,在基于本发明的推定装置中,与骨密度相关的信息可以通过将骨部区域的各位置处的骨密度投影在预先规定的方向上来导出。Furthermore, in the estimation device according to the present invention, the information on the bone density can be derived by projecting the bone density at each position of the bone region in a predetermined direction.
并且,在基于本发明的推定装置中,与骨密度相关的信息可以包含每单位面积的骨密度、每单位体积的骨密度、被摄体的骨折风险的评价值、表示骨部的治疗后的治愈状态的信息中的至少一者。Furthermore, in the estimating device according to the present invention, the information related to the bone density may include the bone density per unit area, the bone density per unit volume, the evaluation value of the fracture risk of the subject, and the bone density after the treatment of the bone. At least one of the information on the healing state.
并且,在基于本发明的推定装置中,可为如下:所述处理器作为学习完毕神经网络发挥作用,所述学习完毕神经网络根据所述DXA扫描图像来导出与所述骨部的骨密度相关的推定结果,Furthermore, in the estimating device according to the present invention, the processor may function as a learned neural network that derives a correlation between the bone density of the bone portion based on the DXA scan image. the presumed result,
所述学习完毕神经网络是将以下用作教师数据进行学习而成的:对所述合成二维图像实施降低分辨率的处理而得到的低分辨率合成二维图像;及与所述被摄体的骨密度相关的信息。The learned neural network is learned by using the following as teacher data: a low-resolution synthetic two-dimensional image obtained by performing a resolution reduction process on the synthetic two-dimensional image; information on bone density.
并且,在基于本发明的推定装置中,可为如下:低分辨率合成二维图像为将所述合成二维图像的相邻的多个像素的像素值的平均值作为所述相邻的多个像素的像素值的图像,所述相邻的多个像素的尺寸对应于所述DXA扫描图像的一个像素尺寸。In addition, in the estimation device according to the present invention, the low-resolution composite two-dimensional image may be such that the average value of the pixel values of a plurality of adjacent pixels of the composite two-dimensional image is used as the adjacent multi-dimensional image. An image of pixel values of pixels, the size of the adjacent plurality of pixels corresponds to the size of one pixel of the DXA scanned image.
并且,在基于本发明的推定装置中,可为如下:低分辨率合成二维图像为在所述合成二维图像的一方向上实施移动平均处理而得到的图像,所述一方向对应于所述DXA扫描图像的扫描方向。Furthermore, in the estimation device according to the present invention, the low-resolution composite two-dimensional image may be an image obtained by performing moving average processing in one direction of the composite two-dimensional image, and the one direction corresponds to the The scan direction of the DXA scanned image.
并且,在基于本发明的推定装置中,可为如下:低分辨率合成二维图像为生成将所述合成二维图像的相邻的多个像素的像素值的平均值作为所述相邻的多个像素的像素值的第1低分辨率图像,并对所述第1低分辨率图像在一方向上进行移动平均处理而生成的图像,所述相邻的多个像素的尺寸对应于所述DXA扫描图像的一个像素尺寸,所述一方向对应于所述DXA扫描图像的扫描方向。Furthermore, in the estimation device according to the present invention, the low-resolution composite two-dimensional image may be generated by using an average value of pixel values of a plurality of adjacent pixels of the composite two-dimensional image as the adjacent pixel value. A first low-resolution image of pixel values of a plurality of pixels, and an image generated by subjecting the first low-resolution image to moving average processing in one direction, and the size of the adjacent plurality of pixels corresponds to the size of the One pixel size of the DXA scan image, the one direction corresponds to the scan direction of the DXA scan image.
基于本发明的推定方法使用学习完毕神经网络,根据单纯放射线图像或DXA扫描图像来导出与骨密度相关的推定结果,所述学习完毕神经网络根据通过单纯拍摄包含骨部的被摄体而获取的单纯放射线图像或通过利用DXA法拍摄被摄体而获取的DXA扫描图像来导出与骨部的骨密度相关的推定结果,其中,The estimation method according to the present invention derives an estimation result related to bone density from a simple radiographic image or a DXA scan image using a learned neural network obtained by simply photographing a subject including a bone portion. A simple radiographic image or a DXA scan image obtained by photographing a subject using the DXA method derives an estimation result related to the bone density of the bone portion, wherein,
学习完毕神经网络是将以下用作教师数据进行学习而成的:通过合成被摄体的三维CT图像而导出的表示被摄体的合成二维图像;及与所述被摄体的骨密度相关的信息。After learning, the neural network is learned by using the following as teacher data: a synthetic two-dimensional image representing the subject derived by synthesizing the three-dimensional CT image of the subject; and correlation with the bone density of the subject Information.
另外,也可以以用于使计算机执行的程序的形式提供基于本发明的推定方法。In addition, the estimation method according to the present invention may be provided in the form of a program for causing a computer to execute.
发明效果Invention effect
根据本发明,能够高精度地推定骨密度。According to the present invention, the bone density can be estimated with high accuracy.
附图说明Description of drawings
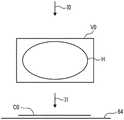
图1是表示适用基于本发明的第1实施方式的推定装置的放射线图像摄影系统的结构的概略框图。FIG. 1 is a schematic block diagram showing the configuration of a radiographic imaging system to which an estimation device according to a first embodiment of the present invention is applied.
图2是表示基于第1实施方式的推定装置的概略结构的图。FIG. 2 is a diagram showing a schematic configuration of an estimation device according to the first embodiment.
图3是表示基于第1实施方式的推定装置的功能性结构的图。FIG. 3 is a diagram showing a functional configuration of an estimation device according to the first embodiment.
图4是表示在本实施方式中使用的神经网络的概略结构的图。FIG. 4 is a diagram showing a schematic configuration of a neural network used in this embodiment.
图5是表示教师数据的图。FIG. 5 is a diagram showing teacher data.
图6是表示基于第1实施方式的信息导出装置的概略结构的图。FIG. 6 is a diagram showing a schematic configuration of an information derivation apparatus according to the first embodiment.
图7是表示基于第1实施方式的信息导出装置的功能性结构的图。FIG. 7 is a diagram showing a functional configuration of the information derivation apparatus according to the first embodiment.
图8是用于说明合成二维图像的导出的图。FIG. 8 is a diagram for explaining the derivation of a composite two-dimensional image.
图9是用于说明合成二维图像的导出的图。FIG. 9 is a diagram for explaining the derivation of a composite two-dimensional image.
图10是用于说明CT值的图。FIG. 10 is a diagram for explaining CT values.
图11是表示放射线能量与质量衰减系数的关系的图。FIG. 11 is a graph showing the relationship between radiation energy and mass attenuation coefficient.
图12是用于说明神经网络的学习的图。FIG. 12 is a diagram for explaining learning of a neural network.
图13是学习完毕神经网络所进行的处理的概念图。FIG. 13 is a conceptual diagram of processing performed by the learned neural network.
图14是表示推定结果的显示画面的图。FIG. 14 is a diagram showing a display screen of an estimation result.
图15是在第1实施方式中进行的学习处理的流程图。FIG. 15 is a flowchart of a learning process performed in the first embodiment.
图16是在第1实施方式中进行的推定处理的流程图。FIG. 16 is a flowchart of estimation processing performed in the first embodiment.
图17是表示教师数据的另一例的图。FIG. 17 is a diagram showing another example of teacher data.
图18是表示基于第2实施方式的信息导出装置的功能性结构的图。FIG. 18 is a diagram showing a functional configuration of an information derivation apparatus according to the second embodiment.
图19是表示统计值与10年以内的骨折发病概率的关系的图表。FIG. 19 is a graph showing the relationship between the statistical value and the fracture incidence probability within 10 years.
图20是表示教师数据的另一例的图。FIG. 20 is a diagram showing another example of teacher data.
图21是表示基于第3实施方式的信息导出装置的功能性结构的图。FIG. 21 is a diagram showing a functional configuration of an information derivation device according to the third embodiment.
图22是表示植入于被摄体的骨部的人造骨的一例的图。FIG. 22 is a diagram showing an example of an artificial bone implanted in a bony part of a subject.
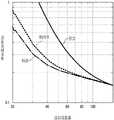
图23是表示术后各阶段的距股骨内部的股骨柄(stem)的距离与骨盐量的关系的一例的图表。FIG. 23 is a graph showing an example of the relationship between the distance from the femoral stem inside the femur and the amount of bone salt in each postoperative stage.
图24是表示人骨的截面结构的一例的剖视图。24 is a cross-sectional view showing an example of a cross-sectional structure of a human bone.
图25是表示教师数据的另一例的图。FIG. 25 is a diagram showing another example of teacher data.
图26是表示推定结果的显示画面的另一例的图。FIG. 26 is a diagram showing another example of the display screen of the estimation result.
具体实施方式Detailed ways
以下,参考附图对本发明的实施方式进行说明。图1是表示适用基于本发明的第1实施方式的推定装置的放射线图像摄影系统的结构的概略框图。如图1所示,基于第1实施方式的放射线图像摄影系统具备摄影装置1、CT装置7、图像保存系统9、基于第1实施方式的推定装置10及信息导出装置50。摄影装置1、CT(Computed Tomography:计算机断层摄影)装置7、推定装置10及信息导出装置50经由未图示的网络与图像保存系统9连接。Hereinafter, embodiments of the present invention will be described with reference to the drawings. FIG. 1 is a schematic block diagram showing the configuration of a radiographic imaging system to which an estimation device according to a first embodiment of the present invention is applied. As shown in FIG. 1 , the radiographic imaging system according to the first embodiment includes an
摄影装置1为能够通过向放射线检测器5照射从放射线源3发射且透射了被摄体H的X射线等放射线来获取被摄体H的单纯放射线图像G0的摄影装置。所获取的单纯放射线图像G0输入到推定装置10中。单纯放射线图像G0例如为包含被摄体H的胯部周边的正面图像。The
放射线检测器5为能够重复进行放射线图像的记录及读出的放射线检测器,可以使用直接接受放射线的照射而产生电荷的所谓的直接型的放射线检测器,也可以使用将放射线暂时转换为可见光,再将该可见光转换为电荷信号的所谓的间接型的放射线检测器。并且,作为放射线图像信号的读出方式,优选使用通过接通或断开TFT(thin filmtransistor:薄膜晶体管)开关来读出放射线图像信号的所谓的TFT读出方式或通过照射读取光来读出放射线图像信号的所谓的光读出方式,但并不限于此,也可以使用其他方式。The radiation detector 5 is a radiation detector capable of repeating the recording and reading of radiographic images, and a so-called direct-type radiation detector that is directly irradiated with radiation to generate electric charges may be used, or a radiation detector that temporarily converts radiation into visible light may be used. A so-called indirect radiation detector that converts the visible light into a charge signal. In addition, as a method of reading out the radiographic image signal, a so-called TFT readout method in which a radiographic image signal is read out by turning on or off a TFT (thin film transistor) switch, or a so-called TFT readout method by irradiating reading light is preferably used. The so-called optical readout method of the radiographic image signal is not limited to this, and other methods may be used.
CT装置7获取表示被摄体H中的多个断层面的多个断层图像来作为三维CT图像V0。CT图像中的各像素(体素)的CT值为将构成人体的组成中的放射线的吸收率进行了数值化的值。关于CT值,将在后面进行叙述。The
图像保存系统9为保存由摄影装置1获取的放射线图像的图像数据及由CT装置7获取的CT图像的图像数据的系统。图像保存系统9从所保存的放射线图像及CT图像中取出与来自推定装置10及信息导出装置50的请求相对应的图像,并发送到请求源装置。作为图像保存系统9的具体例,可以举出PACS(Picture Archiving and Communication Systems:影像存档与通信系统)。另外,在本实施方式中,图像保存系统9中保存有用于对后述的神经网络进行学习的大量教师数据。The
接着,对第1实施方式所涉及的推定装置进行说明。首先,参考图2对第1实施方式所涉及的推定装置的硬件结构进行说明。如图2所示,放射线图像处理装置10为工作站、服务器计算机及个人电脑等计算机,具备CPU(Central Processing Unit:中央处理器)11、非易失性存储器13及作为临时存储区域的内部存储器(memory)16。并且,推定装置10具备液晶显示器等显示器14、键盘及鼠标等输入器件15以及连接于未图示的网络的网络I/F(InterFace:接)17。CPU11、存储器13、显示器14、输入器件15、内部存储器16及网络I/F17连接于总线18。另外,CPU11为本发明中的处理器的一例。Next, the estimation device according to the first embodiment will be described. First, the hardware configuration of the estimation device according to the first embodiment will be described with reference to FIG. 2 . As shown in FIG. 2 , the radiation
存储器13通过HDD(Hard Disk Drive:硬盘驱动器)、SSD(Solid State Drive:固态驱动器)及闪存等来实现。作为存储介质的存储器13中存储有安装到推定装置10中的推定程序12A及学习程序12B。CPU11从存储器13中读出推定程序12A及学习程序12B并展开在内部存储器16中,并且执行展开的推定程序12A及学习程序12B。The
另外,推定程序12A及学习程序12B以能够从外部访问的状态存储于与网络连接的服务器计算机的存储装置或网络存储器中,根据请求下载并安装到构成推定装置10的计算机中。或者,记录在DVD(Digital Versatile Disc:数字多功能光盘)、CD-ROM(CompactDisc Read Only Memory:光盘只读存储器)等记录介质中而分发,从该记录介质安装到构成推定装置10的计算机中。In addition, the
接着,对基于第1实施方式的推定装置的功能性结构进行说明。图3是表示基于第1实施方式的推定装置的功能性结构的图。如图3所示,推定装置10具备图像获取部21、信息获取部22、推定部23、学习部24及显示控制部25。而且,CPU11通过执行推定程序12A而作为图像获取部21、信息获取部22、推定部23及显示控制部25发挥作用。并且,CPU11通过执行学习程序12B而作为学习部24发挥作用。Next, the functional configuration of the estimation device according to the first embodiment will be described. FIG. 3 is a diagram showing a functional configuration of an estimation device according to the first embodiment. As shown in FIG. 3 , the
图像获取部21通过使摄影装置1进行被摄体H的单纯拍摄来从放射线检测器5例如获取被摄体H的胯部附近的正面图像即单纯放射线图像G0。在获取单纯放射线图像G0时,设定摄影剂量、线质、管电压、放射线源3与放射线检测器5的表面的距离即SID(Source Imagereceptor Distance:射线源-影像受体距离)、放射线源3与被摄体H的表面的距离即SOD(Source Object Distance:射线源-物体距离)及有无散射线去除栅格等摄影条件。The
摄影条件通过由操作者从输入器件15输入来设定即可。所设定的摄影条件存储于存储器13中。单纯放射线图像G0及摄影条件还发送并保存于图像保存系统9。The imaging conditions may be set by input from the
另外,在本实施方式中,也可以利用与推定程序12A独立的程序获取单纯放射线图像G0并存储于存储器13中。在该情况下,图像获取部21通过为了进行处理而从存储器13中读出存储于存储器13中的单纯放射线图像G0来获取该单纯放射线图像G0。In addition, in the present embodiment, the simple radiation image G0 may be acquired by a program independent of the
信息获取部22从图像保存系统9经由网络I/F17获取用于对后述的神经网络进行学习的教师数据。The
推定部23根据单纯放射线图像G0导出与被摄体H中所包含的骨部的骨密度相关的推定结果。在本实施方式中,作为与骨密度相关的推定结果,导出关于单纯放射线图像G0中所包含的骨部区域中的对象骨的骨密度的推定结果。因此,推定部23使用输入单纯放射线图像G0时输出骨密度的学习完毕神经网络23A来导出与骨密度相关的推定结果。The
学习部24通过使用教师数据对神经网络进行机器学习来构建学习完毕神经网络23A。作为神经网络,可以举出简单感知器、多层感知器、深度神经网络、卷积神经网络、深度信念网络、递归神经网络及概率神经网络等。在本实施方式中,作为神经网络,使用卷积神经网络。The
图4是表示在本实施方式中使用的神经网络的图。如图4所示,神经网络30具备输入层31、中间层32及输出层33。中间层32例如具备多个卷积层35、多个池化层36及全连接层37。在神经网络30中,全连接层37存在于输出层33的前段。而且,在神经网络30中,卷积层35和池化层36交替地配置于输入层31与全连接层37之间。FIG. 4 is a diagram showing a neural network used in this embodiment. As shown in FIG. 4 , the
另外,神经网络30的结构并不限定于图4的例子。例如,神经网络30也可以在输入层31与全连接层37之间具备一个卷积层35和一个池化层36。In addition, the structure of the
图5是表示神经网络的学习中使用的教师数据的例子的图。如图5所示,教师数据40由学习用数据41和正解数据42构成。在本实施方式中,为了得到骨密度的推定结果而输入到学习完毕神经网络23A中的数据为单纯放射线图像G0,但学习用数据41包含通过合成CT图像V0而导出的表示被摄体H的合成二维图像C0。FIG. 5 is a diagram showing an example of teacher data used for learning of a neural network. As shown in FIG. 5 , the
正解数据42为关于获取了学习用数据41的被摄体的对象骨(即,股骨)的骨密度。另外,在本实施方式中,根据二维单纯放射线图像G0推定每单位面积的骨密度,因此骨密度的单位为(g/cm2)。作为学习用数据41的合成二维图像C0及作为正解数据42的骨密度由信息导出装置50导出。另外,成为正解数据42的骨密度为与被摄体的骨部的骨密度相关的信息的一例。以下,对信息导出装置50进行说明。The
图6是表示基于第1实施方式的信息导出装置的结构的概略框图。如图6所示,基于第1实施方式的信息导出装置50为工作站、服务器计算机及个人电脑等计算机,包括CPU51、非易失性存储器53及作为临时存储区域的内部存储器56。并且,信息导出装置50包括液晶显示器等显示器54、由键盘及鼠标等指示器件(pointing device)等构成的输入器件55以及连接于未图示的网络的网络I/F57。CPU51、存储器53、显示器54、输入器件55、内部存储器56及网络I/F57连接于总线58。FIG. 6 is a schematic block diagram showing the configuration of the information derivation apparatus according to the first embodiment. As shown in FIG. 6 , the
与存储器13同样地,存储器53通过HDD、SSD及闪存等来实现。作为存储介质的存储器53中存储有信息导出程序52。CPU51从存储器53中读出信息导出程序52并展开在内部存储器56中,并且执行展开的信息导出程序52。Like the
接着,对基于第1实施方式的信息导出装置的功能性结构进行说明。图7是表示基于第1实施方式的信息导出装置的功能性结构的图。如图7所示,基于第1实施方式的信息导出装置50具备图像获取部61、合成部62及骨密度导出部63。而且,通过CPU51执行信息导出程序52,CPU51作为图像获取部61、合成部62及骨密度导出部63发挥作用。Next, the functional configuration of the information derivation device according to the first embodiment will be described. FIG. 7 is a diagram showing a functional configuration of the information derivation apparatus according to the first embodiment. As shown in FIG. 7 , the
图像获取部61从图像保存系统9中获取用于导出学习用数据41的CT图像V0。另外,图像获取部61也可以与推定装置10的图像获取部21同样地通过使CT装置7进行被摄体H的拍摄来获取CT图像V0。The
合成部62通过合成CT图像V0来导出表示被摄体H的合成二维图像C0。图8是用于说明合成二维图像C0的导出的图。另外,为了进行说明,在图8中二维地示出三维CT图像V0。如图8所示,由CT图像V0表示的三维空间中包含被摄体H。被摄体H由骨部、脂肪、肌肉及内脏的多个组成构成。The
在此,CT图像V0的各像素处的CT值V0(x,y,z)能够使用该像素处的组成的衰减系数μi和水的衰减系数μw,由下述式(1)表示。(x,y,z)为表示CT图像V0的像素位置的坐标。另外,在以后的说明中,只要没有特别指定,则衰减系数是指射线衰减系数。衰减系数表示放射线因吸收或散射等而衰减的程度(比例)。衰减系数根据放射线所透射的结构物的具体组成(密度等)及厚度(质量)而不同。Here, the CT value V0 (x, y, z) at each pixel of the CT image V0 can be represented by the following formula (1) using the attenuation coefficient μi of the composition at the pixel and the attenuation coefficient μw of water. (x, y, z) are coordinates representing the pixel position of the CT image V0. In addition, in the following description, unless otherwise specified, the attenuation coefficient refers to a radiation attenuation coefficient. The attenuation coefficient represents the degree (ratio) of attenuation of radiation due to absorption or scattering, or the like. The attenuation coefficient differs depending on the specific composition (density, etc.) and thickness (mass) of the structure through which the radiation is transmitted.
V0(x,y,z)=(μi-μw)/μw×1000 (1)V0(x, y, z)=(μi-μw)/μw×1000 (1)
水的衰减系数μw为已知。因此,通过将式(1)关于μi求解,如下述式(2)所示,能够计算各组成的衰减系数μi。The attenuation coefficient μw of water is known. Therefore, by solving Equation (1) for μi, as shown in the following Equation (2), the attenuation coefficient μi of each composition can be calculated.
μi=V0(x,y,z)×μw/1000+μw (2)μi=V0(x, y, z)×μw/1000+μw (2)
如图8所示,合成部62向被摄体H虚拟地照射照射剂量I0的放射线,并利用设置于虚拟的平面64的放射线检测器(未图示)来导出虚拟地检测到透射了被摄体H的放射线而得到的合成二维图像C0。另外,虚拟的放射线的照射剂量I0及放射线能量可根据预先规定的摄影条件来设定。具体而言,准备好与管电压、mAs值及SID等摄影条件对应的表,并参考该表设定照射剂量I0即可。并且,准备好与管电压相对应的表,并参考该表设定放射线能量即可。此时,关于合成二维图像C0的各像素的到达剂量I1(x,y)透射被摄体H内的一个以上的组成。因此,到达剂量I1(x,y)能够使用照射剂量I0的放射线所透射的一个以上的组成的衰减系数μi,由下述式(3)导出。另外,到达剂量I1(x,y)成为合成二维图像C0的各像素的像素值。As shown in FIG. 8 , the combining
I1(x,y)=I0×exp(-∫μi·dt) (3)I1(x, y)=I0×exp(-∫μi·dt) (3)
另外,当将要照射的放射线源假定为面光源时,用于式(3)的衰减系数μi使用根据图8所示的沿上下方向排列的各像素的CT值并由式(2)导出的衰减系数即可。并且,当将要照射的光源的面光源假定为点光源时,如图9所示,使用根据点光源与虚拟的平面64上的各位置的几何学位置关系来确定位于到达各像素的放射线的路径上的像素,且根据所确定的像素的CT值并由式(2)导出的衰减系数μi即可。In addition, when the radiation source to be irradiated is assumed to be a surface light source, the attenuation coefficient μi used in Equation (3) uses the attenuation derived from Equation (2) based on the CT value of each pixel arranged in the vertical direction shown in FIG. 8 coefficient can be. Furthermore, when the surface light source of the light source to be irradiated is assumed to be a point light source, as shown in FIG. 9 , the path of the radiation reaching each pixel is determined using the geometrical positional relationship between the point light source and each position on the
骨密度导出部63使用CT图像V0,按合成二维图像C0的每个像素导出被摄体H的骨密度。在此,对CT值进行说明。图10是用于说明CT值的图。CT值为将人体中的X射线的吸收率进行了数值化的值。具体而言,如图10所示,以水为0,空气的CT值为-1000(单位为HU)这样的方式,根据构成人体的组成规定CT值。The bone
骨密度导出部63首先根据CT图像V0的CT值来确定CT图像V0中的骨部区域。具体而言,通过阈值处理,将由CT值为100~1000的像素构成的区域确定为骨部区域。另外,也可以代替阈值处理而使用以从CT图像V0检测骨部区域的方式进行了学习的学习完毕神经网络来确定骨部区域。并且,也可以通过将CT图像V0显示于显示器54,并在所显示的CT图像V0中接收基于手动操作的骨部区域的指定来确定骨部区域。The bone
在此,CT图像的各像素处的组成的每单位体积的密度ρ[g/cm3]能够根据组成的衰减系数μi[1/cm]和该组成的质量衰减系数μe[cm2/g],由下述式(4)导出。Here, the density ρ [g/cm3 ] per unit volume of the composition at each pixel of the CT image can be determined from the attenuation coefficient μi [1/cm] of the composition and the mass attenuation coefficient μe [cm2 /g] of the composition , which is derived from the following formula (4).
ρ=μi/μe (4)ρ=μi/μe (4)
图11是表示人体的各种组成中的放射线能量与质量衰减系数的关系的图。在图11中示出关于骨部、肌肉等及脂肪的放射线能量与质量衰减系数的关系。另外,肌肉等是指肌肉、血液及水。在本实施方式中,图11所示的放射线能量与质量衰减系数的关系以表形式存储于存储器53中。在本实施方式中,需要骨部的质量衰减系数,因此根据虚拟的放射线能量,参考图11所示的表中的关于骨部的关系来获取骨部的质量衰减系数。并且,由上述式(2)导出骨部区域的各像素处的衰减系数μb。然后,由上述式(4)导出CT图像V0中所包含的骨部区域的各像素处的每单位体积的骨密度ρ。FIG. 11 is a diagram showing the relationship between the radiation energy and the mass attenuation coefficient in various compositions of the human body. FIG. 11 shows the relationship between the radiation energy and the mass attenuation coefficient with respect to the bone, muscle, etc., and fat. In addition, muscle etc. mean muscle, blood, and water. In the present embodiment, the relationship between the radiation energy and the mass attenuation coefficient shown in FIG. 11 is stored in the
另外,CT图像V0为三维图像,因此由上述式(4)导出的每单位体积的骨密度的单位为[g/cm3]。在本实施方式中,骨密度导出部63导出关于合成二维图像C0的各像素的每单位面积的骨密度。因此,骨密度导出部63通过将由上述式(4)导出的每单位体积的骨密度ρ与导出合成二维图像C0时同样地投影在虚拟的平面64来导出关于合成二维图像C0的各像素的每单位面积的骨密度B[g/cm2]。Since the CT image V0 is a three-dimensional image, the unit of the bone density per unit volume derived from the above-mentioned formula (4) is [g/cm3 ]. In the present embodiment, the bone
另外,在投影时,导出位于从虚拟的放射线源到达合成二维图像C0的各像素的路径上的CT图像V0的各像素的骨密度的代表值即可。作为代表值,能够使用累计值、平均值、最大值、中央值及最小值等。此外,在本实施方式中,骨密度导出部63仅关于对象骨导出骨密度的代表值即可。例如,当对象骨为股骨时,骨密度导出部63通过导出合成二维图像C0中的股骨区域中的各像素的骨密度的代表值来导出股骨区域的骨密度的代表值。作为代表值,能够使用平均值、中央值、最小值及最大值等。在本实施方式中,将作为对象骨的股骨的骨密度的代表值用作正解数据42。In addition, at the time of projection, the representative value of the bone density of each pixel of the CT image V0 located on the path from the virtual radiation source to each pixel of the composite two-dimensional image C0 may be derived. As the representative value, an accumulated value, an average value, a maximum value, a median value, a minimum value, or the like can be used. In addition, in the present embodiment, the bone
用作正解数据42的骨密度在与获取学习用数据41的时期相同的时期导出,并发送到图像保存系统9。在图像保存系统9中,将学习用数据41和正解数据42建立对应关系而作为教师数据40来保存。另外,为了提高学习的鲁棒性,可以追加制作并保存教师数据40,该教师数据40包含对同一个图像进行了放大缩小、对比度的变更、移动、面内的旋转、反转及噪声赋予等中的至少一种处理的图像来作为学习用数据41。The bone density used as the
返回到推定装置10,学习部24使用大量教师数据40对神经网络进行学习。图12是用于说明神经网络30的学习的图。在进行神经网络30的学习时,学习部24向神经网络30的输入层31中输入学习用数据41即合成二维图像C0。而且,学习部24从神经网络30的输出层33中输出对象骨的骨密度作为输出数据47。而且,学习部24导出输出数据47与正解数据42的差异来作为损失L0。Returning to the
学习部24根据损失L0对神经网络30进行学习。具体而言,学习部24以使损失L0变小的方式调整卷积层35中的核(kernel)系数、各层之间的连接权重(connection weight)及全连接层37中的连接权重等(以下,称为参数48)。作为参数48的调整方法,例如能够使用误差反向传播法。学习部24重复参数48的调整,直至损失L0成为预先规定的阈值以下。由此,将参数48调整为输入单纯放射线图像G0时输出对象骨的骨密度来构建学习完毕神经网络23A。构建的学习完毕神经网络23A存储于存储器13中。The
图13是学习完毕神经网络23A所进行的处理的概念图。如图13所示,若向以上述方式构建的学习完毕神经网络23A中输入患者的单纯放射线图像G0,则学习完毕神经网络23A输出关于所输入的单纯放射线图像G0中所包含的对象骨(即,股骨)的骨密度。FIG. 13 is a conceptual diagram of processing performed by the learned
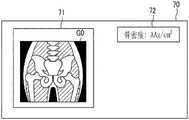
显示控制部25将推定部23所推定的骨密度的推定结果显示于显示器14。图14是表示推定结果的显示画面的图。如图14所示,显示画面70具有图像显示区域71和骨密度显示区域72。在图像显示区域71中显示有被摄体H的单纯放射线图像G0。并且,在骨密度显示区域72中显示有推定部23所推定的骨密度下的股骨的关节周边的骨密度的代表值。The
接着,对在第1实施方式中进行的处理进行说明。图15是表示在第1实施方式中进行的学习处理的流程图。首先,信息获取部22从图像保存系统9中获取教师数据40(步骤ST1),学习部24将教师数据40中所包含的学习用数据41输入到神经网络30中并输出骨密度,使用基于与正解数据42的差异的损失L0对神经网络30进行学习(步骤ST2),并且返回到步骤ST1。然后,学习部24重复步骤ST1、ST2的处理,直至损失L0成为预先规定的阈值,并且结束学习处理。另外,学习部24也可以通过重复预先规定的次数的学习来结束学习处理。由此,学习部24构建学习完毕神经网络23A。Next, the processing performed in the first embodiment will be described. FIG. 15 is a flowchart showing a learning process performed in the first embodiment. First, the
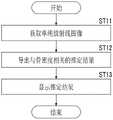
接着,对第1实施方式中的推定处理进行说明。图16是表示第1实施方式中的推定处理的流程图。另外,通过摄影而获取单纯放射线图像G0,并存储于存储器13中。若从输入器件15输入开始进行处理的指示,则图像获取部21从存储器13获取单纯放射线图像G0(步骤ST11)。接着,推定部23根据单纯放射线图像G0导出与骨密度相关的推定结果(步骤ST12)。然后,显示控制部25将推定部23所导出的与骨密度相关的推定结果与单纯放射线图像G0一并显示于显示器14(步骤ST13),并且结束处理。Next, the estimation processing in the first embodiment will be described. FIG. 16 is a flowchart showing estimation processing in the first embodiment. In addition, the simple radiographic image G0 is acquired by imaging and stored in the
如此,在本实施方式中,使用学习完毕神经网络23A来导出与单纯放射线图像G0中所包含的被摄体H的骨密度相关的推定结果,该学习完毕神经网络23A通过将根据CT图像V0导出的合成二维图像C0及根据CT图像V0导出的骨密度用作教师数据进行学习来构建。在此,在本实施方式中,神经网络的学习中使用了根据CT图像V0导出的合成二维图像C0和根据CT图像V0导出的骨密度。因此,与将一个放射线图像和根据放射线图像导出的与骨密度相关的信息用作教师数据的情况相比,学习完毕神经网络23A能够根据单纯放射线图像G0更精度良好地导出与骨密度相关的推定结果。因此,根据本实施方式,能够更精度良好地导出与骨密度有关的推定结果。In this way, in the present embodiment, an estimation result related to the bone density of the subject H included in the simple radiographic image G0 is derived using the learned
另外,在上述第1实施方式中,作为正解数据42,导出了每单位面积的骨密度,但并不限定于此。在上述第1实施方式中,也可以导出在导出每单位面积的骨密度的过程中得到的每单位体积的骨密度来作为正解数据。每单位体积的骨密度使用CT图像V0的对象骨区域内的像素处的骨密度的代表值即可。作为代表值,能够使用平均值、中央值、最小值及最大值等。将该情况下的教师数据示于图17。如图17所示,教师数据40A由包含合成二维图像C0的学习用数据41和每单位体积的骨密度即正解数据42A构成。In addition, in the above-described first embodiment, the bone density per unit area was derived as the
通过使用图17所示的教师数据40A对神经网络进行学习,能够构建输入单纯放射线图像G0时输出每单位体积的骨密度作为与骨密度相关的推定结果的学习完毕神经网络23A。By learning the neural network using the
并且,在上述各实施方式中。作为与骨密度相关的信息,推定了单纯放射线图像G0的每单位面积或每单位体积的骨密度,但并不限定于此。例如,也可以导出骨折风险的评价值来作为与骨密度相关的推定结果。以下,将其作为第2实施方式进行说明。In addition, in each of the above-mentioned embodiments. As the information related to the bone density, the bone density per unit area or per unit volume of the simple radiographic image G0 is estimated, but it is not limited to this. For example, an evaluation value of fracture risk may be derived as an estimation result related to bone density. Hereinafter, this will be described as a second embodiment.
图18是表示基于第2实施方式的信息导出装置的功能性结构的图。另外,在图18中,对与图7相同的结构赋予相同的参考符号,并省略详细说明。在本发明的第2实施方式中,代替骨密度的导出而导出骨折风险的评价值来作为正解数据42。因此,如图18所示,基于第2实施方式的信息导出装置50A相对于基于第1实施方式的信息导出装置50,还具备肌肉密度导出部65、统计值导出部66及评价值导出部67。FIG. 18 is a diagram showing a functional configuration of an information derivation apparatus according to the second embodiment. In addition, in FIG. 18 , the same reference numerals are given to the same components as those in FIG. 7 , and detailed descriptions are omitted. In the second embodiment of the present invention, instead of deriving the bone density, an evaluation value of fracture risk is derived as the
肌肉密度导出部65根据CT图像V0中的CT值来确定肌肉区域。具体而言,通过阈值处理,将由CT值为60~70的像素构成的区域确定为肌肉区域。另外,也可以代替阈值处理而使用以从CT图像V0检测肌肉区域的方式进行了学习的学习完毕神经网络来检测肌肉区域。并且,也可以通过将CT图像V0显示于显示器54,并在所显示的CT图像V0中接收基于手动操作的肌肉区域的指定来确定肌肉区域。The muscle
此外,肌肉密度导出部65由上述式(2)计算肌肉的衰减系数μm。然后,参考图11所示的表来获取肌肉的质量衰减系数。然后,由上述式(4)导出每单位体积的肌肉的密度ρm。In addition, the muscle
统计值导出部66根据骨密度导出部63所导出的骨密度及肌肉密度导出部65所导出的肌肉密度来求出与被摄体H有关的统计值。如后述,统计值用于计算用于评价骨折风险的骨折风险评价值。具体而言,如下述式(5)所示,统计值导出部66根据与骨密度的空间分布有关的骨密度分布指标值Rd及与肌肉量相关的空间分布有关的肌肉量分布指标值Md来导出统计值Q。The statistical
Q=W1×Bd+W2×Md (5)Q=W1×Bd+W2×Md (5)
式(5)的W1、W2分别为权重系数,是收集大量的骨密度分布指标值及肌肉密度分布指标值并按照回归分析规定的。W1 and W2 in formula (5) are weight coefficients, respectively, which are determined by collecting a large number of bone density distribution index values and muscle density distribution index values and according to regression analysis.
骨密度分布指标值为表示骨密度的值如何扩散的值。作为骨密度分布指标值,例如有骨密度的每单位面积或每单位体积的值、平均值、中间值、最大值及最小值等。肌肉密度分布指标值为表示肌肉密度的值如何扩散的值。作为肌肉密度分布指标值,例如有肌肉密度的每单位面积或每单位体积的值、平均值、中间值、最大值及最小值等。The bone density distribution index value is a value indicating how the value of the bone density spreads. As the bone density distribution index value, there are, for example, a value per unit area or per unit volume, an average value, a median value, a maximum value, and a minimum value of the bone density. The muscle density distribution index value is a value indicatinghow the value of the muscle density spreads. The muscle density distribution index value includes, for example, a value per unit area or per unit volume, an average value, a median value, a maximum value, and a minimum value of muscle density.
并且,统计值导出部66除了骨密度及肌肉密度以外,还可以根据被摄体的身高、体重、年龄及骨折史等中至少任一个来求出统计值Q。例如,当根据骨密度、肌肉密度及年龄求出统计值时,根据骨密度分布指标值Rd、肌肉量分布指标值Md及年龄Y,利用下述式(6)计算统计值Q。Further, the statistical
Q=W1×Bd+W2×Md+W3×Y (6)Q=W1×Bd+W2×Md+W3×Y (6)
式(6)的W1、W2、W3分别为权重系数,大量收集骨密度分布指标值及肌肉密度分布指标值和与这些指标值对应的与被摄体的年龄有关的数据,并按照基于这些数据的回归分析来规定权重系数W1、W2、W3。另外,当除了年龄以外还加入被摄体的身高、体重及骨折史等而求出统计值时,优选将权重系数相乘之后进行相加。W1, W2, and W3 in formula (6) are weight coefficients, respectively, and a large number of bone density distribution index values and muscle density distribution index values and the data related to the age of the subject corresponding to these index values are collected, and the data is based on these data. The regression analysis to specify the weight coefficients W1, W2, W3. In addition, when adding the height, weight, fracture history, etc. of the subject in addition to the age to obtain the statistical value, it is preferable to multiply the weight coefficients and then add them.
评价值导出部67根据统计值Q来计算用于评价被摄体H的骨折风险的骨折风险评价值。统计值Q与骨折风险评价值的关系根据大量的诊断数据而得到,因此在评价值导出部67中,使用该关系来计算骨折风险评价值。预先导出统计值Q与骨折风险评价值的关系并以表的形式存储于存储器53中即可。The evaluation
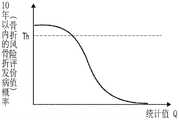
例如,作为骨折风险评价值,有从被摄体H诊断时(获取单纯放射线图像G0时)起10年以内的骨折发病概率。然后,如上所述,当在统计值Q的计算中使用了式(6)时,如图19所示,“10年以内的骨折发病概率”与“统计值Q“的关系表示,统计值Q变得越大,则骨折发病概率变得越低。For example, as a fracture risk evaluation value, there is a fracture incidence probability within 10 years from the time when the subject H is diagnosed (when the simple radiographic image G0 is acquired). Then, as described above, when the formula (6) is used in the calculation of the statistical value Q, as shown in FIG. 19 , the relationship between the “probability of fracture incidence within 10 years” and the “statistical value Q” is expressed, and the statistical value Q The larger it becomes, the lower the probability of fracture incidence becomes.
在第2实施方式中,将信息导出装置50A所导出的骨折风险评价值用作教师数据的正解数据。图20是表示在第2实施方式中导出的教师数据的图。如图20所示,教师数据40B由包含合成二维图像C0的学习用数据41和骨折风险评价值即正解数据42B构成。In the second embodiment, the fracture risk evaluation value derived by the information deriving device 50A is used as the correct solution data of the teacher data. FIG. 20 is a diagram showing teacher data derived in the second embodiment. As shown in FIG. 20 , the
通过使用图20所示的教师数据40B对神经网络进行学习,能够构建输入单纯放射线图像G0时输出骨折风险评价值作为与骨密度相关的推定结果的学习完毕神经网络23A。By learning the neural network using the
接着,对本发明的第3实施方式进行说明。图21是表示基于第3实施方式的信息导出装置的功能性结构的图。另外,在图21中,对与图7相同的结构赋予相同的参考符号,并省略详细说明。在本发明的第3实施方式中,也可以代替骨密度的导出而导出表示治疗后的骨部的治愈状态的信息来作为正解数据42。因此,如图21所示,基于第3实施方式的信息导出装置50B相对于基于第1实施方式的信息导出装置50,还具备治愈信息导出部68。另外,在第3实施方式中,作为骨部的治疗,假设进行将人造骨等人造物植入于骨部的手术。Next, a third embodiment of the present invention will be described. FIG. 21 is a diagram showing a functional configuration of an information derivation device according to the third embodiment. In addition, in FIG. 21, the same reference numerals are given to the same structure as FIG. 7, and a detailed description is abbreviate|omitted. In the third embodiment of the present invention, instead of the derivation of the bone density, information indicating the healing state of the bone portion after treatment may be derived as the
治愈信息导出部68根据植入于被摄体H的骨部的人造骨等人造物周边的骨密度来导出表示人造物植入于被摄体H的骨部之后的被摄体的骨部的状态的信息来作为治愈信息。人造骨等人造物代替着因粉碎性骨折或肿瘤等而失去的骨,因此通过外科手术植入于活体内。The healing
图22是表示植入于被摄体的骨部的人造骨的一例的图。在图22中例示出实施了人工股关节置换术的被摄体H的骨部,在被摄体H的股骨80中植入有人工关节的股骨柄81。FIG. 22 is a diagram showing an example of an artificial bone implanted in a bony part of a subject. FIG. 22 illustrates the bone portion of the subject H to which the artificial femoral joint replacement surgery has been performed, and the
作为固定股骨柄81的方法,已知有直接固定法(无水泥固定)及间接固定法(水泥固定)。在直接固定法中,无需使用水泥,便将股骨柄81插入到股骨80内部的空腔。股骨80内部的空腔的形状预先整形为与股骨柄81匹配。股骨柄81的表面被粗面化,以使骨组织朝向股骨柄81的内部以渗透的方式逐渐生长。即,在刚将股骨柄81植入于股骨80之后,在股骨柄81与股骨80之间存在空腔,但若股骨80恢复,则空腔随着骨组织的生长而缩小并消失。因此,通过获取股骨柄81周边的骨密度,能够掌握术后股骨80的恢复程度。As a method of fixing the
图23是表示术后各阶段的距股骨80内部的股骨柄81的距离与骨密度的关系的一例的图表。图23所示的图表的横轴为沿图22中的直线L的位置。在图23中,实线对应于刚将股骨柄81植入于股骨80之后的初始阶段,点线对应于恢复中途阶段,单点划线对应于痊愈阶段。如图23所示,在术后初始阶段,股骨80与股骨柄81未紧贴,股骨柄81附近的骨密度极其少。随着恢复,骨组织朝向股骨柄81的内部以渗透的方式逐渐生长,从而股骨柄81附近的骨密度增加。另一方面,从股骨柄81远端位置的骨密度在术后各阶段大致恒定。在痊愈阶段,股骨柄81附近的骨密度与远端位置的骨密度变得大致同等。FIG. 23 is a graph showing an example of the relationship between the distance from the
以下,关于治愈信息导出部68导出治愈信息的方式,以实施了图22所示的人工股关节置换术的情况为例子进行说明。治愈信息导出部68导出和距股骨柄81的距离相对较近的位置LA处的骨密度BA与距股骨柄81的距离相对较远的位置XB处的骨密度BB的差异相对应的数值ΔB来作为治愈信息。例如,治愈信息导出部68可以导出骨密度之差(ΔB=BB-BA)来作为治愈信息。在该情况下,作为治愈信息而导出的数值随着恢复而变小,逐渐接近0。并且,治愈信息导出部68也可以导出骨密度之比(ΔB=BA/BB)来作为治愈信息。在该情况下,作为治愈信息而导出的数值ΔB随着骨部的恢复而变大,逐渐接近1。即,和骨密度BA与BB的差异相对应的数值ΔB可以说是表示术后骨部的恢复程度的数值。因此,通过导出数值ΔB作为治愈信息,能够定量地掌握术后股骨80的恢复程度。Hereinafter, the manner in which the healing
另外,治愈信息导出部68可以使用由骨密度导出部63导出的合成二维图像C0的各像素处的每单位面积的骨密度来导出治愈信息,也可以使用CT图像V0的各像素处的每单位体积的骨密度来导出治愈信息。并且,在合成二维图像C0中,股骨柄81的像素值也与骨部区域中的像素值明显不同,因此能够在合成二维图像C0中确定存在股骨柄81的区域。因此,治愈信息导出部68能够根据合成二维图像C0来确定距股骨柄81的距离。In addition, the healing
图24是表示人骨的截面结构的一例的剖视图。如图24所示,人骨包含松质骨90和覆盖松质骨90的外侧的皮质骨91而构成。皮质骨91比松质骨90硬,且致密。松质骨90为向髓腔内扩散的被称为骨小梁的小骨柱的集合体。骨小梁的形态有板状和棒状结构,相互连接。松质骨90的骨密度与皮质骨91的骨密度明显不同,因此在CT图像V0中能够区分皮质骨91和松质骨90。尤其,当所导出的骨密度为每单位体积的骨密度时,与每单位面积的骨密度相比,能够明确地区分松质骨90的骨密度和皮质骨91的骨密度。24 is a cross-sectional view showing an example of a cross-sectional structure of a human bone. As shown in FIG. 24 , the human bone includes
当人造物植入于松质骨90时,治愈信息导出部68可以根据CT图像V0的各像素的CT值来确定松质骨90的区域,并根据人造物周边的松质骨90的骨密度来导出治愈信息。具体而言,治愈信息导出部68可以导出与距人造物的距离相对较近的松质骨90内的位置XA处的骨密度BA与距人造物的距离相对较远的松质骨90内的位置XB处的骨密度BB的差异相对应的数值ΔB来作为治愈信息。When the artificial object is implanted in the
另一方面,当人造物植入于皮质骨91时,治愈信息导出部68优选根据CT图像V0的各像素的CT值来确定皮质骨91的区域,并根据人造物周边的皮质骨91的骨密度来导出治愈信息。具体而言,治愈信息导出部68可以导出与距人造物的距离相对较近的皮质骨91内的位置XA处的骨密度BA与距人造物的距离相对较远的皮质骨91内的位置XB处的骨密度BB的差异相对应的数值ΔB来作为治愈信息。On the other hand, when the artificial object is implanted in the
并且,当植入于被摄体H的骨部的人造物涉及松质骨90及皮质骨91这两者时,可以根据CT图像V0的各像素的CT值来确定松质骨90及皮质骨91的区域,并根据人造物周边的松质骨90及皮质骨91这两者的骨密度来导出治愈信息。具体而言,治愈信息导出部68可以导出与距人造物的距离相对较近的松质骨90内的位置LA1处的骨密度BA1与距人造物的距离相对较远的松质骨90内的位置LB1处的骨密度BB1的差异相对应的数值ΔB1来作为治愈信息,并且导出与距人造物的距离相对较近的皮质骨91内的位置LA2处的骨密度BA2与距人造物的距离相对较远的皮质骨91内的位置LB2处的骨密度BB2的差异相对应的数值ΔB2来作为治愈信息。另外,当植入于被摄体H的骨部的人造物涉及松质骨90及皮质骨91这两者时,也可以根据人造物周边的松质骨90及皮质骨91中的一者的骨密度来导出治愈信息。即,可以导出数值ΔB1及数值ΔB2中的一者来作为治愈信息。Furthermore, when the artificial object implanted in the bone portion of the subject H involves both the
在第3实施方式中,将信息导出装置50B所导出的治愈信息用作教师数据的正解数据。图25是表示在第3实施方式中导出的教师数据的图。如图25所示,教师数据40C由包含合成二维图像C0的学习用数据41和治愈信息的数值即正解数据42C构成。In the third embodiment, the healing information derived by the
通过使用图25所示的教师数据40C对神经网络进行学习,能够构建输入单纯放射线图像G0时输出表示治愈状态的信息作为治愈信息的学习完毕神经网络23A。By learning the neural network using the
并且,在上述各实施方式中,作为教师数据40的正解数据42,也可以使用将骨密度导出部63所导出的每单位面积或每单位体积的骨密度作为像素值的骨密度图像。在该情况下,推定装置10的推定部23根据单纯放射线图像G0导出骨密度图像来作为与骨密度相关的推定结果。如此,在导出了骨密度图像的情况下,可以在显示画面显示骨密度图像。In addition, in each of the above-described embodiments, as the
图26是表示推定结果的显示画面的另一例的图。如图26所示,显示画面70A具有与图14所示的显示画面70相同的图像显示区域71。在图像显示区域71中显示有被摄体H的单纯放射线图像G0中的骨密度的推定结果即骨密度图像Gd。在骨密度图像Gd中,根据骨密度对骨部区域赋予有花纹。另外,在图26中,为了简化说明,仅对股骨赋予有表示骨盐量的花纹。在图像显示区域71的下方显示有关于所赋予的花纹的表示骨盐量的大小的参考资料(reference)73。操作者能够通过一边将参考资料73进行参考一边读取骨密度图像Gd来容易识别患者的骨密度。另外,也可以代替花纹,而根据骨密度对骨密度图像Gd赋予不同的颜色。FIG. 26 is a diagram showing another example of the display screen of the estimation result. As shown in FIG. 26 , the
并且,在上述各实施方式中,推定了与关于股关节附近的股骨的骨密度相关的信息,但成为对象的骨并不限定于股骨。在推定与关于膝关节附近的股骨及胫骨、腰椎等椎骨、跟骨以及掌骨等任意骨部的骨密度相关的信息时,也能够适用本发明的技术。In addition, in each of the above-described embodiments, the information related to the bone density of the femur in the vicinity of the femoral joint is estimated, but the target bone is not limited to the femur. The technique of the present invention can also be applied to estimating information related to the bone density of any bone portion such as the femur, tibia, lumbar spine, and any bone portion in the vicinity of the knee joint, such as the calcaneus and the metacarpal.
并且,在上述各实施方式中,根据单纯放射线图像G0导出了与骨密度相关的推定结果,但并不限定于此。例如,即使在根据利用日本特开平9-108206号公报及日本特开2006-271437号公报等中所记载的DXA摄影装置拍摄被摄体而获取的DXA扫描图像来导出与骨密度相关的推定结果的情况下,也能够适用本发明的技术。DXA扫描图像是指一边切换精细准直的高能量放射线束及低能量放射线束且一边扫描一边照射到被摄体而由放射线检测器拍摄的放射线图像。精细准直的放射线束例如是使用位于放射线源与被摄体之间的准直仪而形成为笔形束、窄扇形束或宽扇形束等放射线束。低能量放射线是指能量比高能量放射线相对较低的放射线。In addition, in each of the above-described embodiments, the estimation result related to the bone density is derived from the simple radiographic image G0, but the present invention is not limited to this. For example, even when an estimation result related to bone density is derived from a DXA scan image obtained by photographing a subject with the DXA imaging apparatus described in Japanese Patent Application Laid-Open No. 9-108206 and Japanese Patent Application Laid-Open No. 2006-271437, etc. In this case, the technology of the present invention can also be applied. The DXA scan image refers to a radiation image captured by a radiation detector while irradiating a subject while scanning while switching between a finely collimated high-energy radiation beam and a low-energy radiation beam. The finely collimated radiation beam is formed into a radiation beam such as a pencil beam, a narrow fan beam, or a wide fan beam, for example, using a collimator located between the radiation source and the subject. Low-energy radiation refers to radiation having a relatively lower energy than high-energy radiation.
在该情况下,可以按照拍摄DXA扫描图像的检测器的像素尺寸、拍摄时的扫描方向及扫描速度、X射线源、被摄体及检测器彼此的距离以及放射线的能量分布(由管电压、靶及滤波器确定)等各条件,根据合成二维图像C0生成模拟了DXA扫描图像的图像,并将所生成的模拟了DXA扫描图像的图像用作学习用数据41来构建学习完毕神经网络23A。In this case, the pixel size of the detector that captures the DXA scan image, the scanning direction and scanning speed at the time of capture, the distance between the X-ray source, the object, and the detector, and the energy distribution of the radiation (determined by the tube voltage, target and filter determination) and other conditions, an image simulating the DXA scan image is generated from the synthetic two-dimensional image C0, and the generated image simulating the DXA scan image is used as the learning
模拟了DXA扫描图像的图像例如通过根据DXA扫描图像的拍摄中使用的检测器的像素尺寸、扫描方向及扫描速度等对合成二维图像C0实施降低分辨率的处理来生成即可。另外,模拟了DXA扫描图像的图像为低分辨率合成二维图像的一例。An image simulating a DXA scan image may be generated by, for example, subjecting the composite two-dimensional image C0 to a process of reducing the resolution according to the pixel size, scan direction, and scan speed of a detector used for capturing the DXA scan image. In addition, the image simulating the DXA scan image is an example of a low-resolution composite two-dimensional image.
具体而言,以如下方式生成模拟了DXA扫描图像的图像。设想如下情况:将L、M、N设为自然数,相对于被摄体H的实际尺寸Lmm×Lmm,合成二维图像C0的M×M个像素与其对应且DXA扫描图像的学习用图像的N×N个像素与其对应。此时,以使合成二维图像C0的(M/N)×(M/N)个像素即相邻的多个像素对应于DXA扫描图像的学习用图像的一个像素的方式,将合成二维图像C0的(M/N)×(M/N)个像素的像素值的平均值作为合成二维图像C0的(M/N)×(M/N)个所有像素值,由此将合成二维图像C0进行低分辨率化。然后,在合成二维图像C0的与DXA扫描图像对应的所有区域中进行这种低分辨率化处理,由此生成模拟了DXA扫描图像的图像。当M/N不是自然数时,以M/N前后的自然数适当调整合成二维图像C0与DXA扫描图像的学习用图像的对应像素的位置来从合成二维图像C0生成模拟了DXA扫描图像的图像即可。Specifically, an image simulating a DXA scan image is generated as follows. Suppose that L, M, and N are natural numbers, M×M pixels of the synthetic two-dimensional image C0 correspond to the actual size Lmm×Lmm of the subject H, and N of the learning image of the DXA scan image corresponds to it. ×N pixels correspond thereto. At this time, the composite two-dimensional image C0 is composed of (M/N)×(M/N) pixels, that is, a plurality of adjacent pixels corresponding to one pixel of the learning image of the DXA scan image. The average value of the pixel values of the (M/N)×(M/N) pixels of the image C0 is taken as the (M/N)×(M/N) all pixel values of the composite two-dimensional image C0, thereby combining two The dimensional image C0 is reduced in resolution. Then, such a low-resolution processing is performed on all regions of the composite two-dimensional image C0 corresponding to the DXA scan image, thereby generating an image simulating the DXA scan image. When M/N is not a natural number, the positions of the corresponding pixels of the learning image of the composite 2D image C0 and the DXA scanned image are appropriately adjusted with natural numbers before and after M/N to generate an image that simulates the DXA scanned image from the composite 2D image C0 That's it.
此外,作为用于模拟由扫描引起的模糊的低分辨率化处理,也可以通过进行向与扫描方向对应的一方向的移动平均处理来生成模拟了DXA扫描图像的图像。In addition, as a reduction processing for simulating blur caused by scanning, an image simulating a DXA scanned image may be generated by performing moving average processing in one direction corresponding to the scanning direction.
并且,也可以通过对合成二维图像C0进行移动平均处理来生成模拟了DXA扫描图像的图像。移动平均处理根据拍摄DXA扫描图像时的扫描方向、扫描速度、检测器的像素尺寸及X射线源、被摄体及检测器彼此的距离等来适当确定移动平均的计算中使用的滤波器的尺寸及滤波器的强度分布即可。例如,扫描速度相对越快,则成为相对越低的分辨率,因此相对较大地设定滤波器的尺寸即可。在该情况下,当设定为L=10时,成为M=200、N=5左右。Furthermore, it is also possible to generate an image simulating a DXA scan image by performing moving average processing on the synthesized two-dimensional image C0. Moving average processing The size of the filter used in the calculation of the moving average is appropriately determined according to the scanning direction, scanning speed, pixel size of the detector, and the distance between the X-ray source, the object, and the detector at the time of capturing the DXA scan image. and the intensity distribution of the filter. For example, as the scanning speed is relatively high, the resolution becomes relatively low, so the size of the filter may be set relatively large. In this case, when L=10 is set, M=200 and N=5 or so.
并且,在上述各实施方式中,作为用于对神经网络进行学习的教师数据中所包含的正解数据,使用了骨密度、骨折风险及治愈信息。因此,推定部23根据单纯放射线图像G0推定的与骨密度相关的信息为单纯放射线图像G0中的骨密度、骨折风险及治愈信息,但并不限定于这些。也可以将YAM、T分数或Z分数作为正解数据而构建学习完毕神经网络23A,并根据单纯放射线图像G0推定YAM、T分数及Z分数来作为与骨密度相关的信息。并且,在推定部23中,作为要推定的与骨密度相关的信息,可以使用有无骨折、有无肿瘤、有无植入物的检测结果,也可以使用骨质疏松症的判定结果。并且,也可以推定多发性骨髓瘤、风湿病、关节病及软骨硬化等与骨密度相关的骨疾病来作为与骨密度相关的信息。在该情况下,使用包含这些与骨密度相关的信息的教师数据作为正解数据来构建学习完毕神经网络23A即可。In addition, in each of the above-described embodiments, bone density, fracture risk, and healing information are used as correct solution data included in the teacher data for learning the neural network. Therefore, the information related to the bone density estimated by the
另外,在上述各实施方式中,在推定装置10中进行神经网络的学习来构建了学习完毕神经网络23A,但并不限定于此。也可以将在除推定装置10以外的其他装置中构建的学习完毕神经网络23A用于本实施方式中的推定装置10的推定部23。In addition, in each of the above-described embodiments, the learning of the neural network is performed in the
并且,在上述各实施方式中,使用在利用放射线检测器5拍摄被摄体H的系统中所获取的放射线图像来进行了与骨密度相关的信息的推定处理,但当代替放射线检测器而使用蓄积性荧光体片获取放射线图像时,当然也能够适用本发明的技术。In addition, in each of the above-described embodiments, the estimation process of the information related to bone density is performed using the radiographic image acquired by the system that captures the subject H with the radiation detector 5, but it is possible to use the radiation detector instead of the radiation detector. Of course, the technique of the present invention can also be applied when the accumulating phosphor sheet acquires a radiographic image.
并且,上述实施方式中的放射线并不受特别限定,除了能够使用X射线以外,还能够使用d射线或γ射线等。In addition, the radiation in the above-described embodiment is not particularly limited, and in addition to X-rays, d-rays, γ-rays, or the like can be used.
并且,在上述实施方式中,例如作为推定装置10的图像获取部21、信息获取部22、推定部23、学习部24及显示控制部25以及信息导出装置50等的图像获取部61、合成部62及骨密度导出部63等执行各种处理的处理部(Processing Unit)的硬件结构,能够使用以下所示的各种处理器(Processor)。上述各种处理器中除了包括如上所述的执行软件(程序)来作为各种处理部发挥作用的通用的处理器即CPU以外,还包括FPGA(Field ProgrammableGate Array:现场可编程门阵列)等在制造后能够变更电路结构的处理器即可编程逻辑器件(Programmable Logic Device:PLD)、ASIC(Application Specific IntegratedCircuit:专用集成电路)等具有为了执行特定的处理而专门设计的电路结构的处理器即专用电路等。In addition, in the above-described embodiment, for example, the
一个处理部可以由这些各种处理器中的一个构成,也可以由相同种类或不同种类的两个以上的处理器的组合(例如,多个FPGA的组合或CPU与FPGA的组合)构成。并且,也可以由一个处理器构成多个处理部。One processing unit may be constituted by one of these various processors, or may be constituted by a combination of two or more processors of the same or different types (for example, a combination of a plurality of FPGAs or a combination of a CPU and an FPGA). In addition, a plurality of processing units may be constituted by one processor.
作为由一个处理器构成多个处理部的例子,第1,有如下方式:如以用户端及服务器等计算机为代表那样,以一个以上的CPU与软件的组合构成一个处理器,且该处理器作为多个处理部发挥作用。第2,有如下方式:如片上系统(System On Chip:SoC)等为代表那样,使用以一个IC(Integrated Circuit:集成电路)芯片实现包括多个处理部的系统整体的功能的处理器。如此,各种处理部作为硬件结构使用上述各种处理器中的一个以上而构成。As an example in which a plurality of processing units are constituted by one processor, firstly, there is a method in which one processor is constituted by a combination of one or more CPUs and software, as represented by computers such as a client and a server, and the processor It functions as a plurality of processing units. Second, there is a system in which a single IC (Integrated Circuit) chip, as represented by a System On Chip (SoC) or the like, is used to realize the functions of the entire system including a plurality of processing units. In this way, the various processing units are configured using one or more of the above-described various processors as a hardware configuration.
此外,作为这些各种处理器的硬件结构,更具体而言,能够使用将半导体元件等电路元件组合而成的电路(Circuitry)。In addition, as the hardware configuration of these various processors, more specifically, a circuit (Circuitry) formed by combining circuit elements such as semiconductor elements can be used.
符号说明Symbol Description
1-摄影装置,3-放射线源,5-放射线检测器,7-CT装置,9-图像保存系统,10-推定装置,11、51-CPU,12A-推定程序,12B-学习程序,13、53-存储器,14、54-显示器,15、55-输入器件,16、56-内部存储器,17、57-网络I/F,18、58-总线,21-图像获取部,22-信息获取部,23-推定部,23A-学习完毕神经网络,24-学习部,25-显示控制部,30-神经网络,31-输入层,32-中间层,33-输出层,35-卷积层,36-池化层,37-全连接层,40、40A、40B、40C-教师数据,41-学习用数据,42、42A、42B、42C-正解数据,47-输出数据,48-参数,50、50A、50B-信息导出装置,52-信息导出程序,61-图像获取部,62-合成部,63-骨密度导出部,64-平面,65-肌肉密度导出部,66-统计值导出部,67-评价值导出部,68-治愈信息导出部,70、70A-显示画面,71-图像显示区域,72-骨密度显示区域,73-参考资料,80-股骨,81-股骨柄,90-松质骨,91-皮质骨,C0-合成二维图像,G0-单纯放射线图像,Gd-骨密度图像,L-距离,Q-统计值,V0-CT图像。1-photography device, 3-radiation source, 5-radiation detector, 7-CT device, 9-image storage system, 10-estimation device, 11, 51-CPU, 12A-estimation program, 12B-learning program, 13, 53-memory, 14,54-display, 15,55-input device, 16,56-internal memory, 17,57-network I/F, 18,58-bus, 21-image acquisition part, 22-information acquisition part , 23-estimation part, 23A-learned neural network, 24-learning part, 25-display control part, 30-neural network, 31-input layer, 32-intermediate layer, 33-output layer, 35-convolutional layer, 36-pooling layer, 37-full connection layer, 40, 40A, 40B, 40C-teacher data, 41-learning data, 42, 42A, 42B, 42C-positive solution data, 47-output data, 48-parameters, 50 , 50A, 50B-information derivation device, 52-information derivation program, 61-image acquisition part, 62-synthesis part, 63-bone density derivation part, 64-plane, 65-muscle density derivation part, 66-statistical value derivation part , 67 - Evaluation value derivation part, 68 - Healing information derivation part, 70, 70A - Display screen, 71 - Image display area, 72 - Bone density display area, 73 - Reference material, 80 - Femur, 81 - Femoral stem, 90 - Cancellous bone, 91-cortical bone, C0-synthetic two-dimensional image, G0-simple radiographic image, Gd-bone density image, L-distance, Q-statistic value, V0-CT image.
Claims (11)
Translated fromChineseApplications Claiming Priority (2)
| Application Number | Priority Date | Filing Date | Title |
|---|---|---|---|
| JP2021040686AJP2022140050A (en) | 2021-03-12 | 2021-03-12 | Estimation device, method and program |
| JP2021-040686 | 2021-03-12 |
Publications (1)
| Publication Number | Publication Date |
|---|---|
| CN115067976Atrue CN115067976A (en) | 2022-09-20 |
Family
ID=80685161
Family Applications (1)
| Application Number | Title | Priority Date | Filing Date |
|---|---|---|---|
| CN202210213756.9APendingCN115067976A (en) | 2021-03-12 | 2022-03-03 | Estimation device, method, and computer-readable storage medium |
Country Status (4)
| Country | Link |
|---|---|
| US (1) | US12133752B2 (en) |
| EP (1) | EP4056120B1 (en) |
| JP (2) | JP2022140050A (en) |
| CN (1) | CN115067976A (en) |
Cited By (1)
| Publication number | Priority date | Publication date | Assignee | Title |
|---|---|---|---|---|
| CN116458909A (en)* | 2023-04-10 | 2023-07-21 | 清华大学 | Method and device for measuring three-dimensional bone density distribution by using cone beam DR equipment |
Families Citing this family (2)
| Publication number | Priority date | Publication date | Assignee | Title |
|---|---|---|---|---|
| CN114663363B (en)* | 2022-03-03 | 2023-11-17 | 四川大学 | Deep learning-based hip joint medical image processing method and device |
| JPWO2024090050A1 (en)* | 2022-10-27 | 2024-05-02 |
Family Cites Families (15)
| Publication number | Priority date | Publication date | Assignee | Title |
|---|---|---|---|---|
| US5931780A (en)* | 1993-11-29 | 1999-08-03 | Arch Development Corporation | Method and system for the computerized radiographic analysis of bone |
| CA2178395A1 (en) | 1995-06-07 | 1996-12-08 | Donald Barry | X-ray bone densitometry apparatus |
| US6064716A (en)* | 1997-09-05 | 2000-05-16 | Cyberlogic, Inc. | Plain x-ray bone densitometry apparatus and method |
| US6570955B1 (en)* | 2002-01-08 | 2003-05-27 | Cyberlogic, Inc. | Digital x-ray material testing and bone densitometry apparatus and method |
| JP4499593B2 (en) | 2005-03-28 | 2010-07-07 | アロカ株式会社 | X-ray bone density measuring device |
| US20090285467A1 (en)* | 2008-05-15 | 2009-11-19 | New Medical Co., Ltd. | Method for assessing bone status |
| US10039513B2 (en)* | 2014-07-21 | 2018-08-07 | Zebra Medical Vision Ltd. | Systems and methods for emulating DEXA scores based on CT images |
| WO2019208037A1 (en)* | 2018-04-24 | 2019-10-31 | 株式会社島津製作所 | Image analysis method, segmentation method, bone density measurement method, learning model creation method, and image creation device |
| JP2019198376A (en)* | 2018-05-14 | 2019-11-21 | キヤノンメディカルシステムズ株式会社 | Medical image processor, medical image processing method, and medical image processing system |
| CN120199453A (en)* | 2018-09-10 | 2025-06-24 | 京瓷株式会社 | Estimation device, device, learning model generation method, and prediction system |
| JP7406892B2 (en)* | 2019-03-11 | 2023-12-28 | キヤノン株式会社 | Medical image processing device, medical image processing method and program |
| KR102240804B1 (en)* | 2019-04-24 | 2021-04-19 | 가톨릭대학교 산학협력단 | Method for providing osteoporosis diagnosis and treatment service based on bigdata and artificial intelligence |
| US11737704B2 (en)* | 2019-07-16 | 2023-08-29 | 16 Bit Inc. | Systems and methods for approximating bone mineral density and fracture risk using single energy x-rays |
| JP7454435B2 (en)* | 2020-04-15 | 2024-03-22 | キヤノンメディカルシステムズ株式会社 | Medical image processing device and medical image processing method |
| JP7583653B2 (en)* | 2021-03-12 | 2024-11-14 | 富士フイルム株式会社 | Estimation device, method and program |
- 2021
- 2021-03-12JPJP2021040686Apatent/JP2022140050A/enactivePending
- 2022
- 2022-02-03USUS17/591,616patent/US12133752B2/enactiveActive
- 2022-03-03CNCN202210213756.9Apatent/CN115067976A/enactivePending
- 2022-03-09EPEP22161114.8Apatent/EP4056120B1/enactiveActive
- 2024
- 2024-12-11JPJP2024217068Apatent/JP2025026691A/enactivePending
Cited By (2)
| Publication number | Priority date | Publication date | Assignee | Title |
|---|---|---|---|---|
| CN116458909A (en)* | 2023-04-10 | 2023-07-21 | 清华大学 | Method and device for measuring three-dimensional bone density distribution by using cone beam DR equipment |
| CN116458909B (en)* | 2023-04-10 | 2024-05-07 | 清华大学 | Method and device for measuring three-dimensional bone density distribution by using cone beam DR equipment |
Also Published As
| Publication number | Publication date |
|---|---|
| JP2025026691A (en) | 2025-02-21 |
| EP4056120B1 (en) | 2024-04-17 |
| US12133752B2 (en) | 2024-11-05 |
| JP2022140050A (en) | 2022-09-26 |
| EP4056120A1 (en) | 2022-09-14 |
| US20220287665A1 (en) | 2022-09-15 |
Similar Documents
| Publication | Publication Date | Title |
|---|---|---|
| US12133752B2 (en) | Estimation device, estimation method, and estimation program | |
| US11096645B2 (en) | Bone mineral information acquisition apparatus, bone mineral information acquisition method, and bone mineral information acquisition program | |
| JP7746507B2 (en) | Estimation device, method, and program | |
| US10973482B2 (en) | Bone mineral information acquisition apparatus, bone mineral information acquisition method, and bone mineral information acquisition program | |
| CN114903504A (en) | Apparatus, method and storage medium for predicting disease of moving organ, learning apparatus, method and storage medium for learning neural network | |
| CN117710284A (en) | Image processing apparatus, image processing method, and recording medium | |
| EP4527297A1 (en) | Image processing device, image processing method, and image processing program | |
| JP2025010394A (en) | Estimation device, method and program | |
| JP7686430B2 (en) | Estimation device, method and program | |
| US12097062B2 (en) | Estimation device, estimation method, and estimation program | |
| JP7342140B2 (en) | Information processing device, information processing method and program | |
| WO2024189963A1 (en) | Image processing device, method, and program | |
| WO2023054287A1 (en) | Bone disease prediction device, method, and program, learning device, method, and program, and trained neural network | |
| US20210393227A1 (en) | Radiographic image processing device, radiographic image processing method, and radiographic image processing program | |
| US20230172576A1 (en) | Radiation image processing device, radiation image processing method, and radiation image processing program | |
| JP6252750B2 (en) | Trabecular bone analyzer |
Legal Events
| Date | Code | Title | Description |
|---|---|---|---|
| PB01 | Publication | ||
| PB01 | Publication | ||
| SE01 | Entry into force of request for substantive examination | ||
| SE01 | Entry into force of request for substantive examination |