CN114925518A - A bridge health warning method based on time series and multi-sensor fusion - Google Patents
A bridge health warning method based on time series and multi-sensor fusionDownload PDFInfo
- Publication number
- CN114925518A CN114925518ACN202210534056.XACN202210534056ACN114925518ACN 114925518 ACN114925518 ACN 114925518ACN 202210534056 ACN202210534056 ACN 202210534056ACN 114925518 ACN114925518 ACN 114925518A
- Authority
- CN
- China
- Prior art keywords
- data
- sensor
- model
- bridge
- arma model
- Prior art date
- Legal status (The legal status is an assumption and is not a legal conclusion. Google has not performed a legal analysis and makes no representation as to the accuracy of the status listed.)
- Granted
Links
Images


Classifications
- G—PHYSICS
- G06—COMPUTING OR CALCULATING; COUNTING
- G06F—ELECTRIC DIGITAL DATA PROCESSING
- G06F30/00—Computer-aided design [CAD]
- G06F30/20—Design optimisation, verification or simulation
- G—PHYSICS
- G06—COMPUTING OR CALCULATING; COUNTING
- G06F—ELECTRIC DIGITAL DATA PROCESSING
- G06F17/00—Digital computing or data processing equipment or methods, specially adapted for specific functions
- G06F17/10—Complex mathematical operations
- G06F17/16—Matrix or vector computation, e.g. matrix-matrix or matrix-vector multiplication, matrix factorization
- G—PHYSICS
- G06—COMPUTING OR CALCULATING; COUNTING
- G06F—ELECTRIC DIGITAL DATA PROCESSING
- G06F17/00—Digital computing or data processing equipment or methods, specially adapted for specific functions
- G06F17/10—Complex mathematical operations
- G06F17/18—Complex mathematical operations for evaluating statistical data, e.g. average values, frequency distributions, probability functions, regression analysis
- G—PHYSICS
- G06—COMPUTING OR CALCULATING; COUNTING
- G06F—ELECTRIC DIGITAL DATA PROCESSING
- G06F18/00—Pattern recognition
- G06F18/20—Analysing
- G06F18/22—Matching criteria, e.g. proximity measures
- G—PHYSICS
- G06—COMPUTING OR CALCULATING; COUNTING
- G06F—ELECTRIC DIGITAL DATA PROCESSING
- G06F18/00—Pattern recognition
- G06F18/20—Analysing
- G06F18/25—Fusion techniques
- G—PHYSICS
- G06—COMPUTING OR CALCULATING; COUNTING
- G06F—ELECTRIC DIGITAL DATA PROCESSING
- G06F30/00—Computer-aided design [CAD]
- G06F30/10—Geometric CAD
- G06F30/13—Architectural design, e.g. computer-aided architectural design [CAAD] related to design of buildings, bridges, landscapes, production plants or roads
- G—PHYSICS
- G06—COMPUTING OR CALCULATING; COUNTING
- G06F—ELECTRIC DIGITAL DATA PROCESSING
- G06F18/00—Pattern recognition
- G06F18/20—Analysing
- G06F18/25—Fusion techniques
- G06F18/257—Belief theory, e.g. Dempster-Shafer
- Y—GENERAL TAGGING OF NEW TECHNOLOGICAL DEVELOPMENTS; GENERAL TAGGING OF CROSS-SECTIONAL TECHNOLOGIES SPANNING OVER SEVERAL SECTIONS OF THE IPC; TECHNICAL SUBJECTS COVERED BY FORMER USPC CROSS-REFERENCE ART COLLECTIONS [XRACs] AND DIGESTS
- Y02—TECHNOLOGIES OR APPLICATIONS FOR MITIGATION OR ADAPTATION AGAINST CLIMATE CHANGE
- Y02T—CLIMATE CHANGE MITIGATION TECHNOLOGIES RELATED TO TRANSPORTATION
- Y02T90/00—Enabling technologies or technologies with a potential or indirect contribution to GHG emissions mitigation
Landscapes
- Engineering & Computer Science (AREA)
- Physics & Mathematics (AREA)
- Theoretical Computer Science (AREA)
- General Physics & Mathematics (AREA)
- Data Mining & Analysis (AREA)
- General Engineering & Computer Science (AREA)
- Mathematical Physics (AREA)
- Pure & Applied Mathematics (AREA)
- Mathematical Optimization (AREA)
- Mathematical Analysis (AREA)
- Computational Mathematics (AREA)
- Geometry (AREA)
- Evolutionary Computation (AREA)
- Bioinformatics & Computational Biology (AREA)
- Computer Hardware Design (AREA)
- Evolutionary Biology (AREA)
- Life Sciences & Earth Sciences (AREA)
- Bioinformatics & Cheminformatics (AREA)
- Algebra (AREA)
- Computer Vision & Pattern Recognition (AREA)
- Artificial Intelligence (AREA)
- Databases & Information Systems (AREA)
- Software Systems (AREA)
- Structural Engineering (AREA)
- Operations Research (AREA)
- Probability & Statistics with Applications (AREA)
- Civil Engineering (AREA)
- Architecture (AREA)
- Computing Systems (AREA)
- Testing Or Calibration Of Command Recording Devices (AREA)
Abstract
Description
Translated fromChinese技术领域technical field
本发明涉及桥梁预警领域,特别涉及一种基于时间序列和多传感器融合的桥梁健康预警方法。The invention relates to the field of bridge early warning, in particular to a bridge health early warning method based on time series and multi-sensor fusion.
背景技术Background technique
目前,桥梁健康预警仍然是一项非常具有挑战性的任务,传统的桥梁监测方式以人工巡查、设备检测为主,很难做到及时或实时监测.随着大数据、BIM等信息技术的发展,桥梁监测逐步构建起信息化、智能化的应用系统.信息技术不断的进步会导致更加多样化的数据被采集,因此也会促进评估理论的发展.目前国内外在健康检测中的新技术以BIM、传感传输、GPS技术为主.在近期对桥梁健康监测的研究中,技术难点和研究热点主要是:信号降噪,信号预警,模态参数识别,损伤识别,状态预测与评估.由于野外测试的信号具有复杂噪声,因此不能将桥梁健康监测系统采集到的初始信号直接用来分析,需要对其进行降噪处理.在目前的桥梁监测项目中,缺少从数据序列的角度出发对桥梁各项监测数据的预测的相关工作,也缺乏对桥梁进行多模态融合后总体的诊断工作。At present, bridge health warning is still a very challenging task. The traditional bridge monitoring method is mainly based on manual inspection and equipment detection, and it is difficult to achieve timely or real-time monitoring. With the development of big data, BIM and other information technologies , Bridge monitoring has gradually built an informationized and intelligent application system. The continuous progress of information technology will lead to the collection of more diverse data, which will also promote the development of evaluation theory. At present, new technologies in health testing at home and abroad are BIM, sensor transmission, and GPS technology are the main technologies. In the recent research on bridge health monitoring, the technical difficulties and research hotspots are mainly: signal noise reduction, signal early warning, modal parameter identification, damage identification, state prediction and evaluation. The signal of the field test has complex noise, so the initial signal collected by the bridge health monitoring system cannot be directly used for analysis, and it needs to be denoised. The work related to the prediction of various monitoring data is also lacking in the overall diagnosis of bridges after multi-modal fusion.
建立桥梁健康预警任务旨在通过对数据的融合、预测、危害判断,对桥梁危害提前预警.减少病态桥梁的存在,防止桥梁偶然事故的发生;减少亚健康的桥梁,确保健康桥梁的正常使用,目前关于长周期下的桥梁安全预警的预测精度是比较低的。The purpose of establishing bridge health warning task is to provide early warning of bridge hazards through data fusion, prediction, and hazard judgment. Reduce the existence of sick bridges and prevent accidental bridge accidents; reduce sub-healthy bridges and ensure the normal use of healthy bridges. At present, the prediction accuracy of bridge safety warning under long period is relatively low.
发明内容SUMMARY OF THE INVENTION
针对现有技术存在的上述问题,本发明要解决的技术问题是:在长时间跨度下桥梁预警的预测精准度比较低的问题。Aiming at the above problems existing in the prior art, the technical problem to be solved by the present invention is the problem that the prediction accuracy of bridge early warning is relatively low in a long-term span.
为解决上述技术问题,本发明采用如下技术方案:In order to solve the above-mentioned technical problems, the present invention adopts the following technical solutions:
一种基于时间序列和多传感器融合的桥梁健康预警方法,包括如下步骤:A bridge health warning method based on time series and multi-sensor fusion, including the following steps:
S100:选取目标桥梁已知W个传感器的数据流作为数据集,该数据集包括桥梁上的W种传感器监测指标的数据;该数据集中的所有数据服从时间序列且分为长时监测数据与短时监测数据;S100: Select the data stream of the known W sensors of the target bridge as a data set, and the data set includes data of monitoring indicators of W sensors on the bridge; all data in the data set obey a time series and are divided into long-term monitoring data and short-term monitoring data. time monitoring data;
S200:建立ARMA模型,表达式如下:S200: Establish an ARMA model, the expression is as follows:

其中,xm表示当前时间结果,p表示长时监测数据的时间跨度,
将S100中所述数据集中所有数据进行检验,确定该数据集为适合ARMA模型输入的可用数据集;All data in the data set described in S100 are checked, and it is determined that the data set is an available data set suitable for ARMA model input;
S300:对ARMA模型进行定阶,得到定阶ARMA模型;S300: Determine the order of the ARMA model to obtain a fixed-order ARMA model;
S400:对S200中得到的可用数据集通过离群值处理方法来完成数据清洗,然后利用指数平均化对清洗后的数据进行降噪平滑处理,得到新数据集;S400: Complete data cleaning on the available data set obtained in S200 by outlier processing method, and then use exponential averaging to perform noise reduction and smoothing processing on the cleaned data to obtain a new data set;
S500:对新数据集进行剔除处理,去掉异常传感器数据,得到ARMA模型输入数据,具体步骤如下:S500: Perform a culling process on the new data set, remove abnormal sensor data, and obtain the input data of the ARMA model. The specific steps are as follows:
S510:选取传感器a,计算传感器a的输出数据与其他传感器的输出数据之间的距离d(Xa),表达式如下:S510: Select sensor a, calculate the distance d(Xa ) between the output data of sensor a and the output data of other sensors, the expression is as follows:

其中,Xa表示传感器a的输出数据,且Xa={xi|i=1,2,…,m},Xb表示除传感器a以外的其他传感器输出数据,且Xb={xj|j=1,2,…,m};Among them, Xa represents the output data of sensor a, and Xa ={xi |i=1,2,...,m}, Xb represents the output data of other sensors except sensor a, and Xb ={xj |j=1,2,…,m};
S520:将计算得出的Xa与Xb的距离表示成一个距离矩阵,表达式如下:S520: Express the calculated distance between Xa and Xb as a distance matrix, and the expression is as follows:

其中,距离Dd(dab)表示Xa和Xb的相似度;Among them, the distance Dd(dab ) represents the similarity between Xa and Xb ;
S530:对相似度Dd(dab)进行归一化处理,表达式如下:S530: Normalize the similarity Dd(dab ), and the expression is as follows:

其中
S540:计算传感器a的同类数据的信任函数DSUP(Xa),表达式如下:S540: Calculate the trust function DSUP(Xa ) of the similar data of sensor a, and the expression is as follows:
DSUP(Xa)=1-DG(Xa),a=1,2,…,A;(5)DSUP(Xa )=1-DG(Xa ),a=1,2,...,A; (5)
S550:设置传感器a的同类数据的阈值δ,表达式如下:S550: Set the threshold value δ of the same data of sensor a, and the expression is as follows:
δ=DSUP(m)*0.02 (6)δ=DSUP(m)*0.02 (6)
其中,DSUP(m)表示DSUP(Xa)的中位数;Among them, DSUP(m) represents the median of DSUP(Xa );
S560:当DSUP(m)-δ<<DSUP(Xa)<<DSUP(m)+δ时判定Xa有效,保留DSUP(Xa)的值,当DSUP(Xa)不符合此条件时判定Xa为异常值并剔除,得到关于传感器a的ARMA模型输入数据;S560: When DSUP(m)-δ<<DSUP(Xa )<<DSUP(m)+δ, it is determined that Xa is valid, and the value of DSUP(Xa ) is retained, when DSUP(Xa ) does not meet this condition Determine Xa as an outlier and remove it, and obtain the ARMA model input data about sensor a;
S570:遍历新数据集中的所有传感器数据,使用步骤S500得到最终的ARMA模型输入数据集;S570: Traverse all sensor data in the new data set, and use step S500 to obtain the final ARMA model input data set;
S600:初始化定阶ARMA模型,并对初始化定阶ARMA模型进行训练,具体训练过程如下:S600: Initialize the fixed-order ARMA model, and train the initialized fixed-order ARMA model. The specific training process is as follows:
S610:选择ARMA模型输入数据集中的长时监测数据作为训练集,将训练集作为初始化定阶ARMA模型的输入,输出为对桥梁W种传感器的监测指标的预测数据
S620:计算W种传感器监测指标的真实数据Ya和
S700:选取目标桥梁的ARMA模型输入数据集中的短时监测数据,将该部分短时监测数据输入到预训练ARMA模型中,完成对预训练ARMA模型的步进更新,得到最终ARMA模型;S700: Select the short-term monitoring data in the ARMA model input data set of the target bridge, input the part of the short-term monitoring data into the pre-training ARMA model, complete the step-by-step update of the pre-training ARMA model, and obtain the final ARMA model;
S800:将目标桥梁当前时间的W种传感器的监测指标数据作为最终ARMA模型的输入,得到目标桥梁的W种监测指标的预测数据;S800: Use the monitoring index data of the W sensors of the target bridge at the current time as the input of the final ARMA model, and obtain the prediction data of the W monitoring indicators of the target bridge;
S900:对目标桥梁的W种监测指标的预测数据进行信息融合,信息融合后的数据值将落在M-1个等级区间中的某个等级区间内,将该等级区间对应的预警状态作为对桥梁的危险预警结果。S900: Perform information fusion on the prediction data of the W monitoring indicators of the target bridge, the data value after information fusion will fall within a certain grade interval in the M-1 grade interval, and the warning state corresponding to the grade interval is used as a Hazard warning results for bridges.
作为优选,所述S200中对数据集中的所有数据进行检验的步骤如下:Preferably, the steps of checking all the data in the data set in the S200 are as follows:
S210:对数据集中的所有数据分别进行自相关分析与和偏自相关分析,当自相关分析结果和偏自相关分析结果均为拖尾时,执行下一步;否则,认为数据不适用本模型使用;S210: Perform autocorrelation analysis and partial autocorrelation analysis on all the data in the data set. When both the autocorrelation analysis results and the partial autocorrelation analysis results are tailings, perform the next step; otherwise, the data are considered not suitable for use in this model ;
S220:将经过S210分析后的数据分别进行ADF平稳性检验和白噪声检验,当ADF平稳性检验结果和白噪声检验结果均为合格时,表示该数据适合本模型使用,否则,认为数据不适用本模型使用。S220: Perform the ADF stationarity test and the white noise test on the data analyzed by S210 respectively. When the ADF stationarity test results and the white noise test results are both qualified, it means that the data is suitable for the model, otherwise, the data is considered inapplicable used in this model.
作为优选,所述S300中对ARMA模型定阶所使用的方法是BIC准则,具体为通过BIC准则进行网格搜索,选取令BIC值最低的模型阶数,作为本模型的适用阶数。Preferably, the method used to determine the order of the ARMA model in the S300 is the BIC criterion, specifically performing a grid search through the BIC criterion, and selecting the model order with the lowest BIC value as the applicable order of the model.
BIC准则针对较长的传感器数据时间序列,有最好的计算准确率,以免相关信息变得分散,BIC的惩罚项相比其他方法更大,考虑到样本数量过多时,使用BIC可有效防止模型精度过高造成的模型复杂度过高问题。The BIC criterion has the best calculation accuracy for long sensor data time series, so as to prevent the related information from becoming scattered. The penalty term of BIC is larger than other methods. Considering that the number of samples is too large, using BIC can effectively prevent the model The problem of high model complexity caused by high precision.
作为优选,所述S900中的M-1个等级区间通过如下方法建立:Preferably, the M-1 grade intervals in the S900 are established by the following methods:
预设M个阈值t,根据如下公式将预警结果分为M-1个等级区间,即[t0,t1]、[t1,t2]、[t2,t3]、[ti,ti+1]…[tM-1,tM]依次表示第1级到第M-1级,其中,t0至tM具体表示如下:M thresholds t are preset, and the warning results are divided into M-1 grade intervals according to the following formula, namely [t0 , t1 ], [t1 , t2 ], [t2 , t3 ], [ti ,ti+1 ]…[tM-1 ,tM ] represents the first stage to the M-1th stage in sequence, where t0 to tM are specifically expressed as follows:

其中,min表示本组监测数据中的最小数据,diff为本组数据的极差,M′表示对应区间的经验参数。Among them, min represents the minimum data in this group of monitoring data, diff is the extreme difference of this group of data, and M′ represents the empirical parameter of the corresponding interval.
作为优选,所述S900中对桥梁的W种监测指标的预测数据进行信息融合的方法为D-S证据融合方法,具体信息融合步骤如下:Preferably, the method of performing information fusion on the prediction data of the W kinds of monitoring indicators of the bridge in the S900 is the D-S evidence fusion method, and the specific information fusion steps are as follows:
S910:将W种传感器分为T个类别;S910: Divide W sensors into T categories;
S920:从S910所述T个类别中选取第i类传感器数据,并对所有第i类传感器数据求取平均值得到数据
S930:计算


其中,Timax和Timin分别代表第i类传感器数据等级特征值的最大值和最小值,Timax-Timin用来消除第i类数据之间的量纲,ΔTi/2表示第i类数据的每一个等级区间的中间值;Among them, Timax and Timin represent the maximum and minimum value of the eigenvalues of the i-th sensor data level, respectively, Timax -Timin is used to eliminate the dimension between the i-th type of data, and ΔTi /2 represents the i-th type of data. The median value of each level interval of the data;
S940:计算异类数据的信任函数MSUP(Xi),此处的异类数据是指非第i类传感器数据以外的其他的所有传感器数据,计算表达式如下:S940: Calculate the trust function MSUP(Xi ) for heterogeneous data, where heterogeneous data refers to all sensor data other than the i-th sensor data, and the calculation expression is as follows:

S950:对异类数据的信任函数MSUP(Xi)进行归一化处理后,利用D-S证据理论计算Xi的mass函数,计算表达式如下:S950: After normalizing the trust function MSUP(Xi ) of heterogeneous data, use DS evidence theory to calculate the mass function of Xi , and the calculation expression is as follows:

S960:重复S920-S950,得到将数据集中所有类别的传感器数据的mass函数;S960: Repeat S920-S950 to obtain the mass function of all types of sensor data in the dataset;
S970:利用D-S组合公式将所有类别的传感器数据的mass函数进行信息融合,得到最终的信息融合数据,计算表达式如下:S970: Use the D-S combination formula to fuse the mass functions of all types of sensor data to obtain the final information fusion data. The calculation expression is as follows:

其中,θ表示识别框架,m1和m2表示基本概率赋值函数,
基于D-S证据理论的多传感器信息融合决策模型对桥梁危害状态预警,以及对桥梁的健康运行态势进行监控具有较为科学的作用。The multi-sensor information fusion decision-making model based on the D-S evidence theory has a more scientific role in the early warning of the bridge hazard state and the monitoring of the healthy operation of the bridge.
相对于现有技术,本发明至少具有如下优点:Compared with the prior art, the present invention has at least the following advantages:
1.本方法使用短期监测数据对模型进行步进更新,循环自动化地对桥梁传感器数据流分析预测并给出结果,对于不同的桥梁类型通用性强,而且精准度也比较高。1. This method uses short-term monitoring data to update the model step by step, analyzes and predicts the data flow of bridge sensors automatically and gives results, and has strong versatility and high accuracy for different bridge types.
2.本发明采用的D-S证据融合方法对有不确定性的多种传感器数据的融合问题,提出了一种较好的数据处理解决方案。2. The D-S evidence fusion method adopted in the present invention proposes a better data processing solution for the fusion of various sensor data with uncertainty.
3.有针对性的在短时预测的精度上体现出了更优秀的实验结果。3. Targeted to reflect better experimental results in the accuracy of short-term prediction.
附图说明Description of drawings
图1为本方法运行流程图。Figure 1 is a flow chart of the operation of the method.
图2为长时监测数据应力监测传感器A1时序图。FIG. 2 is a timing diagram of the long-term monitoring data stress monitoring sensor A1.
图3为部分数据去噪平滑效果对比。Figure 3 shows the comparison of some data denoising and smoothing effects.
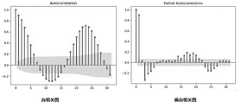
图4为自相关图与偏自相关图。Figure 4 is an autocorrelation diagram and a partial autocorrelation diagram.
图5为预测结果与证据融合结果。Figure 5 shows the results of prediction and evidence fusion.
图6为步进预测结果。Figure 6 shows the step-by-step prediction results.
具体实施方式Detailed ways
下面对本发明作进一步详细说明。The present invention will be described in further detail below.
针对桥梁健康检测中人工检测获取信息滞后,检测情况难以量化,桥梁危害不能及时预警的问题,受传感器序列数据预测算法的启发,本发明提出了一种基于时间序列算法和多传感器融合的桥梁预警模型。Aiming at the problems of lagging information obtained by manual detection in bridge health detection, difficult to quantify the detection situation, and failure to warn of bridge damage in time, inspired by the sensor sequence data prediction algorithm, the present invention proposes a bridge early warning based on time series algorithm and multi-sensor fusion Model.
在当前已有技术的基础上提出ARMA模型,将该模型运用于桥梁数据的短时预测工程中,针对本文桥梁数据趋势调整模型阶数,提升了该模型对桥梁特定数据的拟合效果。本发明中融入D-S证据理论,将不确定性的传感器数据进行融合处理,作为ARMA预测模型的数据来源,实现实时监测,为桥梁健康监测提出了新的思路;将改进后的模型在更多数据集上进行实践的结果表明,ARMA模型在其他时序模型上的预测精度仍然优秀;在不确定性的传感器数据融合和短时预测的精度上体现出了更优越的效果,能准确地预测桥梁危害,且具有应用范围广的特点。On the basis of the current existing technology, the ARMA model is proposed, and the model is applied to the short-term prediction project of bridge data. The model order is adjusted according to the bridge data trend in this paper, and the fitting effect of the model to bridge-specific data is improved. The D-S evidence theory is integrated into the present invention, and the uncertain sensor data is fused and processed as the data source of the ARMA prediction model to realize real-time monitoring, and put forward a new idea for bridge health monitoring; the improved model is used in more data. The results of the practice on the set show that the prediction accuracy of the ARMA model is still excellent in other time series models; it shows a better effect in the accuracy of uncertain sensor data fusion and short-term prediction, and can accurately predict bridge hazards. , and has a wide range of applications.
参见图1,一种基于时间序列和多传感器融合的桥梁健康预警方法,包括如下步骤:Referring to Figure 1, a bridge health warning method based on time series and multi-sensor fusion includes the following steps:
S100:选取目标桥梁已知W个传感器的数据流作为数据集,该数据集包括桥梁上的W种传感器监测指标的数据;该数据集中的所有数据服从时间序列且分为长时监测数据与短时监测数据。S100: Select the data stream of the known W sensors of the target bridge as a data set, and the data set includes data of monitoring indicators of W sensors on the bridge; all data in the data set obey a time series and are divided into long-term monitoring data and short-term monitoring data. time monitoring data.
S200:建立ARMA模型,表达式如下:S200: Establish an ARMA model, the expression is as follows:

其中,xm表示当前时间结果,p表示长时监测数据的时间跨度,
将S100中所述数据集中所有数据进行检验,确定该数据集为适合ARMA模型输入的可用数据集;All data in the data set described in S100 are checked, and it is determined that the data set is an available data set suitable for ARMA model input;
所述S200中对数据集中的所有数据进行检验的步骤如下:The steps of checking all the data in the data set in the S200 are as follows:
S210:对数据集中的所有数据分别进行自相关分析与和偏自相关分析,当自相关分析结果和偏自相关分析结果均为拖尾时,执行下一步;否则,认为数据不适用本模型使用;S210: Perform autocorrelation analysis and partial autocorrelation analysis on all the data in the data set. When both the autocorrelation analysis results and the partial autocorrelation analysis results are tailings, perform the next step; otherwise, the data are considered not suitable for use in this model ;
S220:将经过S210分析后的数据分别进行ADF平稳性检验和白噪声检验,当ADF平稳性检验结果和白噪声检验结果均为合格时,表示该数据适合本模型使用,否则,认为数据不适用本模型使用。S220: Perform the ADF stationarity test and the white noise test on the data analyzed by S210 respectively. When the ADF stationarity test results and the white noise test results are both qualified, it means that the data is suitable for the model, otherwise, the data is considered inapplicable used in this model.
S300:对ARMA模型进行定阶,得到定阶ARMA模型;S300: Determine the order of the ARMA model to obtain a fixed-order ARMA model;
所述S300中对ARMA模型定阶所使用的方法是BIC准则,具体为通过BIC准则进行网格搜索,选取令BIC值最低的模型阶数,作为本模型的适用阶数。The method used to determine the order of the ARMA model in the S300 is the BIC criterion, specifically performing a grid search through the BIC criterion, and selecting the model order with the lowest BIC value as the applicable order of the model.
S400:对S200中得到的可用数据集通过离群值处理方法来完成数据清洗,然后利用指数平均化对清洗后的数据进行降噪平滑处理,得到新数据集;用于清洗数据的离群值处理方法和用于降噪平滑处理的指数平均化方法均为现有方法技术。S400: Use the outlier processing method to complete data cleaning for the available data set obtained in S200, and then use exponential averaging to perform noise reduction and smoothing processing on the cleaned data to obtain a new data set; the outliers used to clean the data The processing method and the exponential averaging method for noise reduction smoothing are both existing methods.
S500:对新数据集进行剔除处理,去掉异常传感器数据,得到ARMA模型输入数据,具体步骤如下:S500: Perform a culling process on the new data set, remove abnormal sensor data, and obtain the input data of the ARMA model. The specific steps are as follows:
S510:选取传感器a,计算传感器a的输出数据与其他传感器的输出数据之间的距离d(Xa),表达式如下:S510: Select sensor a, calculate the distance d(Xa ) between the output data of sensor a and the output data of other sensors, the expression is as follows:

其中,Xa表示传感器a的输出数据,且Xa={xi|i=1,2,…,m},Xb表示除传感器a以外的其他传感器输出数据,且Xb={xj|j=1,2,…,m};Among them, Xa represents the output data of sensor a, and Xa ={xi |i=1,2,...,m}, Xb represents the output data of other sensors except sensor a, and Xb ={xj |j=1,2,…,m};
S520:将计算得出的Xa与Xb的距离表示成一个距离矩阵,表达式如下:S520: Express the calculated distance between Xa and Xb as a distance matrix, and the expression is as follows:

其中,距离Dd(dab)表示Xa和Xb的相似度;当Dd(dab)中dab的元素值越小时,其两种数据的相似程度越大;同类数据间的距离越小代表其相似程度越大,反映数据的真实性就越大;Among them, the distance Dd(dab ) represents the similarity between Xa and Xb ; when the element value of dab in Dd(dab ) is smaller, the degree of similarity between the two data is greater; the distance between similar data is smaller The greater the degree of similarity, the greater the authenticity of the reflected data;
S530:对相似度Dd(dab)进行归一化处理,表达式如下:S530: Normalize the similarity Dd(dab ), and the expression is as follows:

其中
S540:计算传感器a的同类数据的信任函数DSUP(Xa),表达式如下:S540: Calculate the trust function DSUP(Xa ) of the similar data of sensor a, and the expression is as follows:
DSUP(Xa)=1-DG(Xa),a=1,2,…,A;DSUP(Xa )=1-DG(Xa ), a=1,2,...,A;
S550:设置传感器a的同类数据的阈值δ,表达式如下:S550: Set the threshold value δ of the same data of sensor a, and the expression is as follows:
δ=DSUP(m)*0.02δ=DSUP(m)*0.02
其中,DSUP(m)表示DSUP(Xa)的中位数;Among them, DSUP(m) represents the median of DSUP(Xa );
S560:当DSUP(m)-δ<<DSUP(Xa)<<DSUP(m)+δ时判定Xa有效,保留DSUP(Xa)的值,当DSUP(Xa)不符合此条件时判定Xa为异常值并剔除,得到关于传感器a的ARMA模型输入数据;S560: When DSUP(m)-δ<<DSUP(Xa )<<DSUP(m)+δ, it is determined that Xa is valid, and the value of DSUP(Xa ) is retained, when DSUP(Xa ) does not meet this condition Determine Xa as an outlier and remove it, and obtain the ARMA model input data about sensor a;
S570:遍历新数据集中的所有传感器数据,使用步骤S500得到最终的ARMA模型输入数据集。S570: Traverse all sensor data in the new data set, and use step S500 to obtain the final ARMA model input data set.
S600:初始化定阶ARMA模型,并对初始化定阶ARMA模型进行训练,具体训练过程如下:S600: Initialize the fixed-order ARMA model, and train the initialized fixed-order ARMA model. The specific training process is as follows:
S610:选择ARMA模型输入数据集中的长时监测数据作为训练集,将训练集作为初始化定阶ARMA模型的输入,输出为对桥梁W种传感器的监测指标的预测数据
S620:计算W种传感器监测指标的真实数据Ya和

S700:选取目标桥梁的ARMA模型输入数据集中的短时监测数据,将该部分短时监测数据输入到预训练ARMA模型中,完成对预训练ARMA模型的步进更新,得到最终ARMA模型。S700: Select the short-term monitoring data in the ARMA model input data set of the target bridge, input the part of the short-term monitoring data into the pre-training ARMA model, complete the step-by-step update of the pre-training ARMA model, and obtain the final ARMA model.
S800:将目标桥梁当前时间的W种传感器的监测指标数据作为最终ARMA模型的输入,得到目标桥梁的W种监测指标的预测数据。S800: Use the monitoring index data of the W sensors at the current time of the target bridge as the input of the final ARMA model, and obtain the prediction data of the W monitoring indexes of the target bridge.
S900:对目标桥梁的W种监测指标的预测数据进行信息融合,信息融合后的数据值将落在M-1个等级区间中的某个等级区间内,将该等级区间对应的预警状态作为对桥梁的危险预警结果;S900: Perform information fusion on the prediction data of the W monitoring indicators of the target bridge, the data value after information fusion will fall within a certain grade interval in the M-1 grade interval, and the warning state corresponding to the grade interval is used as a Danger warning results of bridges;
所述S900中的M-1个等级区间通过如下方法建立:The M-1 grade intervals in the S900 are established by the following methods:
预设M个阈值t,根据如下公式将预警结果分为M-1个等级区间,即[t0,t1]、[t1,t2]、[t2,t3]、[ti,ti+1]…[tM-1,tM]依次表示第1级到第M-1级,其中,t0至tM具体表示如下:M thresholds t are preset, and the warning results are divided into M-1 grade intervals according to the following formula, namely [t0 , t1 ], [t1 , t2 ], [t2 , t3 ], [ti ,ti+1 ]…[tM-1 ,tM ] represents the first stage to the M-1th stage in sequence, where t0 to tM are specifically expressed as follows:

其中,min表示本组监测数据中的最小数据,diff为本组数据的极差,M′表示对应区间的经验参数,代表第1级与第M-1级在源数据范围之外,处于危险范围,需要报警;其余在源数据范围内的划分为剩下M-3个等级;Among them, min represents the minimum data in this group of monitoring data, diff is the extreme difference of this group of data, M′ represents the empirical parameter of the corresponding interval, which means that the first level and the M-1 level are outside the range of the source data and are in danger range, need to be alarmed; the rest within the range of source data are divided into the remaining M-3 levels;
所述S900中对桥梁的W种监测指标的预测数据进行信息融合的方法为D-S证据融合方法,具体信息融合步骤如下:The method of performing information fusion on the prediction data of W kinds of monitoring indicators of the bridge in the S900 is the D-S evidence fusion method, and the specific information fusion steps are as follows:
S910:将W种传感器分为T个类别;S910: Divide W sensors into T categories;
S920:从S910所述T个类别中选取第i类传感器数据,并对所有第i类传感器数据求取平均值得到数据
S930:计算


其中,Timax和Timin分别代表第i类传感器数据等级特征值的最大值和最小值,Timax-Timin用来消除第i类数据之间的量纲,ΔTi/2表示第i类数据的每一个等级区间的中间值;Among them, Timax and Timin represent the maximum and minimum value of the eigenvalues of the i-th sensor data level, respectively, Timax -Timin is used to eliminate the dimension between the i-th type of data, and ΔTi /2 represents the i-th type of data. The median value of each level interval of the data;
S940:计算异类数据的信任函数MSUP(Xi),此处的异类数据是指非第i类传感器数据以外的其他的所有传感器数据,计算表达式如下:S940: Calculate the trust function MSUP(Xi ) for heterogeneous data, where heterogeneous data refers to all sensor data other than the i-th sensor data, and the calculation expression is as follows:

S950:对异类数据的信任函数MSUP(Xi)进行归一化处理后,利用D-S证据理论计算Xi的mass函数,计算表达式如下:S950: After normalizing the trust function MSUP(Xi ) of heterogeneous data, use DS evidence theory to calculate the mass function of Xi , and the calculation expression is as follows:

S960:重复S920-S950,得到将数据集中所有类别的传感器数据的mass函数;S960: Repeat S920-S950 to obtain the mass function of all types of sensor data in the dataset;
S970:利用D-S组合公式将所有类别的传感器数据的mass函数进行信息融合,得到最终的信息融合数据,计算表达式如下:S970: Use the D-S combination formula to fuse the mass functions of all types of sensor data to obtain the final information fusion data. The calculation expression is as follows:

其中,θ表示识别框架,m1和m2表示基本概率赋值函数,
实验及结果分析Experiment and result analysis
1、数据集及评价标准1. Data set and evaluation criteria
本发明采用某公司公开的桥梁监测数据作为数据集,该数据集为一座桥梁上应力监测、温度监测、伸缩缝监测、沉降监测、索力监测五种监测数据,数据集分为长时监测数据与短时监测数据。The present invention adopts the bridge monitoring data disclosed by a certain company as the data set. The data set includes five kinds of monitoring data: stress monitoring, temperature monitoring, expansion joint monitoring, settlement monitoring, and cable force monitoring on a bridge. The data set is divided into long-term monitoring data. with short-term monitoring data.
长时监测数据时间范围2020.01.08~2020.04.28,数据采集时间间隔1小时共2566条数据,其中,应力监测、温度监测有16个传感器,伸缩缝监测、沉降监测有8个传感器。The time range of long-term monitoring data is from 2020.01.08 to 2020.04.28, and the data collection time interval is 1 hour, a total of 2566 pieces of data. Among them, there are 16 sensors for stress monitoring and temperature monitoring, and 8 sensors for expansion joint monitoring and settlement monitoring.
短时监测数据时间范围2020.05.01~2020.05.21,数据采集时间间隔5分钟共5876条数据,其中,应力监测、温度监测、索力监测有8个传感器。传感器名称如下表2:The short-term monitoring data time range is from 2020.05.01 to 2020.05.21, and the data collection time interval is 5 minutes, a total of 5876 pieces of data, of which there are 8 sensors for stress monitoring, temperature monitoring, and cable force monitoring. The sensor names are as follows in Table 2:
表2数据集Table 2 Dataset


此外,本文采用经典太阳黑子时间序列来检验ARMA模型的预测性能.本文采集了1749-2022年的太阳黑子数据,共有3278条数据,训练集和测试集以8:2比例划分,即前80%作为训练集后20%作为测试集。In addition, this paper uses the classical sunspot time series to test the prediction performance of the ARMA model. This paper collects the sunspot data from 1749 to 2022, with a total of 3278 pieces of data. The training set and the test set are divided in a ratio of 8:2, that is, the top 80% 20% as the training set as the test set.
2、本模型预测精度采用如下两个指标来衡量:2. The prediction accuracy of this model is measured by the following two indicators:
本文采用的软件运行环境为Windows Server 2016,平台配置为Python3.7和PyCharm2021.1The software operating environment used in this article is Windows Server 2016, and the platform configuration is Python3.7 and PyCharm2021.1
平均相对误差绝对值MAPE,其计算方法如下:The absolute value of the average relative error, MAPE, is calculated as follows:

预测误差的标准方差RMSE,其计算方法如下:The standard deviation RMSE of the forecast error is calculated as follows:

预报准确率FA,其计算方法如下:The prediction accuracy FA is calculated as follows:

3、实验过程及结果3. Experimental process and results
取长时监测数据应力监测传感器A1数据,绘制时序图如图2。通过观察原始数据的时序图可以看出,传感器数据在短时间上存在明显的规律性,这是因为在每天内存在温度变化,车流变化等以天为周期的变化.此外,存在某段时间内异变或异常平稳的情况,对于预测与桥梁健康来说,都在工程允许的安全范围内。Take the long-term monitoring data stress monitoring sensor A1 data, and draw the timing diagram as shown in Figure 2. By observing the time series diagram of the original data, it can be seen that the sensor data has obvious regularity in a short period of time, because there are daily changes such as temperature changes and traffic flow changes. In addition, there is a certain period of time. The abnormal or abnormally stable situation is within the safe range allowed by the project for prediction and bridge health.
由于源数据在短时间内的变动与噪声对数据预测有明显的不利,因此,对源数据去噪平滑,使模型更关注主体趋势变化而忽略细小的噪声,避免过拟合,得到效果如图3。Since the change and noise of the source data in a short period of time are obviously unfavorable to the data prediction, the denoising and smoothing of the source data makes the model pay more attention to the main trend change and ignore the small noise, so as to avoid overfitting, and the effect is shown in the figure. 3.
计算序列的自相关系数和偏自相关系数,根据拖尾性和截尾性来选择时间序列预测模型的类型。AR(p)、MA(q)和ARMA(p,q)的相关性质如下表所示。Calculate the autocorrelation coefficient and partial autocorrelation coefficient of the series, and select the type of time series forecasting model according to the tailing and truncation. The relevant properties of AR(p), MA(q) and ARMA(p,q) are shown in the table below.
表1 ARMA模型自相关与偏相关特性Table 1 Autocorrelation and partial correlation characteristics of ARMA model
计算监测数据应力监测传感器A1数据时间序列的自相关系数和偏自相关系数,得到两个系数图,如图4。观察图4的特性,可知结果均为拖尾,且首次落入置信范围内x都不超过7,故可初步选用ARMA模型且p,q≤7。Calculate the autocorrelation coefficient and partial autocorrelation coefficient of the monitoring data stress monitoring sensor A1 data time series, and obtain two coefficient graphs, as shown in Figure 4. Observing the characteristics of Fig. 4, it can be seen that the results are all trailing, and x does not exceed 7 within the confidence range for the first time, so the ARMA model can be initially selected and p, q≤7.
对数据做ADF平稳性检验与白噪检验,结果如下表3和表4,t统计量明显小于1%置信区间,显示数据是平稳的序列且非白噪声,有分析意义。ADF stationarity test and white noise test were performed on the data. The results are shown in Table 3 and Table 4. The t statistic is significantly smaller than the 1% confidence interval, indicating that the data is a stationary sequence and not white noise, which is meaningful for analysis.
表3 ADF平稳性检验结果Table 3 ADF stationarity test results

表4白噪检验结果Table 4 White noise test results
在通过上述预检验后,以p=7,q=7为参数上限,由BIC求解的模型的最佳阶次.得到阶次为(5,7),取i=1000处局部预测,计算mass函数,根据D-S证据理论进行融合,预测与融合结果如图5,图6。由结果显示,与未来趋势基本相符,且对于未来24期的预测情况,只有2期的等级预测错误。After passing the above pre-test, with p=7, q=7 as the upper limit of the parameters, the optimal order of the model solved by BIC is obtained. The order is (5, 7), the local prediction at i=1000 is taken, and the mass is calculated function, according to the D-S evidence theory for fusion, the prediction and fusion results are shown in Figure 5 and Figure 6. The results show that it is basically consistent with the future trend, and for the forecast situation of the next 24 periods, only 2 periods of grade forecasts are wrong.
从i=1000处,使用步进预测,结果如图6所示,图中棕色部分为真实数据,其他颜色为预测所得数据,可以看到对于趋势的预测结果基本与真实数据相同,在部分异变或异常平稳处有小部分预测错误,在工程允许的误差范围内。From i=1000, using step-by-step prediction, the result is shown in Figure 6. The brown part in the figure is the real data, and the other colors are the predicted data. It can be seen that the prediction result of the trend is basically the same as the real data, and the difference in some parts is the same as the real data. There is a small part of prediction error at the variable or abnormally stable place, which is within the allowable error range of the project.
4、定量评估4. Quantitative assessment
对于上述长时监测数据应力监测传感器A1数据,使用模型进行预测结果如下表5。For the above long-term monitoring data stress monitoring sensor A1 data, use the model to predict the results as shown in Table 5.
表5本文模型在i=1000处24期数据预测结果Table 5 The prediction results of the 24-period data at i=1000 by the model in this paper
此外,对于太阳黑子时间序列数据集,使用ARMA(q=10,p=7)模型预测,预测结果由表6列出,可得ARMA模型与其他预测模型的在此数据集上预测结果对比,ARMA预测精度优秀。In addition, for the sunspot time series data set, the ARMA (q=10, p=7) model is used to predict, and the prediction results are listed in Table 6. The ARMA model can be compared with the prediction results of other prediction models on this data set. ARMA prediction accuracy is excellent.
表6不同算法在A1数据集结果比较Table 6 Comparison of the results of different algorithms in the A1 dataset


本发明实验的信息融合的结果即将预警等级分为五个,其中第1级,第5级为危险级别,表明桥梁状况危险,应当立即检修,第2级,第4级为预警级别,表明桥梁状况亚健康,应当多加留意避免进一步情况恶化,第3级为安全级别,表明桥梁状况健康,传感器数据正常。The result of the information fusion of the experiment of the present invention is to divide the early warning levels into five levels, wherein the first level and the fifth level are the dangerous levels, indicating that the bridge is in a dangerous condition and should be repaired immediately, and the second level and the fourth level are the early warning levels, indicating that the bridge is in danger. If the condition is sub-healthy, more attention should be paid to avoid further deterioration of the situation. The third level is the safety level, indicating that the bridge is in healthy condition and the sensor data is normal.
最后说明的是,以上实施例仅用以说明本发明的技术方案而非限制,尽管参照较佳实施例对本发明进行了详细说明,本领域的普通技术人员应当理解,可以对本发明的技术方案进行修改或者等同替换,而不脱离本发明技术方案的宗旨和范围,其均应涵盖在本发明的权利要求范围当中。Finally, it should be noted that the above embodiments are only used to illustrate the technical solutions of the present invention and not to limit them. Although the present invention has been described in detail with reference to the preferred embodiments, those of ordinary skill in the art should understand that the technical solutions of the present invention can be Modifications or equivalent substitutions without departing from the spirit and scope of the technical solutions of the present invention should be included in the scope of the claims of the present invention.
Claims (5)


Priority Applications (1)
| Application Number | Priority Date | Filing Date | Title |
|---|---|---|---|
| CN202210534056.XACN114925518B (en) | 2022-05-17 | 2022-05-17 | A bridge health early warning method based on time series and multi-sensor fusion |
Applications Claiming Priority (1)
| Application Number | Priority Date | Filing Date | Title |
|---|---|---|---|
| CN202210534056.XACN114925518B (en) | 2022-05-17 | 2022-05-17 | A bridge health early warning method based on time series and multi-sensor fusion |
Publications (2)
| Publication Number | Publication Date |
|---|---|
| CN114925518Atrue CN114925518A (en) | 2022-08-19 |
| CN114925518B CN114925518B (en) | 2024-04-26 |
Family
ID=82808024
Family Applications (1)
| Application Number | Title | Priority Date | Filing Date |
|---|---|---|---|
| CN202210534056.XAActiveCN114925518B (en) | 2022-05-17 | 2022-05-17 | A bridge health early warning method based on time series and multi-sensor fusion |
Country Status (1)
| Country | Link |
|---|---|
| CN (1) | CN114925518B (en) |
Cited By (2)
| Publication number | Priority date | Publication date | Assignee | Title |
|---|---|---|---|---|
| CN115687983A (en)* | 2022-12-30 | 2023-02-03 | 中裕铁信交通科技股份有限公司 | Bridge health state monitoring method and system and electronic equipment |
| CN118568506A (en)* | 2024-08-01 | 2024-08-30 | 苏交科集团股份有限公司 | Medium and high frequency monitoring data timing method, system and storage medium |
Citations (9)
| Publication number | Priority date | Publication date | Assignee | Title |
|---|---|---|---|---|
| CN104268658A (en)* | 2014-09-29 | 2015-01-07 | 招商局重庆交通科研设计院有限公司 | Bridge structure safety monitoring data prediction method |
| CN106201871A (en)* | 2016-06-30 | 2016-12-07 | 重庆大学 | Based on the Software Defects Predict Methods that cost-sensitive is semi-supervised |
| CN107895014A (en)* | 2017-11-14 | 2018-04-10 | 辽宁工业大学 | A kind of time series bridge monitoring data analysing method based on MapReduce frameworks |
| CN108170925A (en)* | 2017-12-21 | 2018-06-15 | 中国铁道科学研究院铁道建筑研究所 | A kind of bridge damnification method for early warning based on arma modeling |
| CN109583570A (en)* | 2018-11-30 | 2019-04-05 | 重庆大学 | The method for determining bridge health monitoring system abnormal data source based on deep learning |
| WO2020008192A2 (en)* | 2018-07-03 | 2020-01-09 | Chronomics Limited | Phenotype prediction |
| CN111523572A (en)* | 2020-04-10 | 2020-08-11 | 重庆大学 | Real-time bridge structure damage status identification method and system |
| CN113312696A (en)* | 2021-05-26 | 2021-08-27 | 福建中锐网络股份有限公司 | Bridge health condition dynamic prediction alarm method based on ARIMA algorithm |
| CN113723010A (en)* | 2021-09-08 | 2021-11-30 | 福建中锐网络股份有限公司 | Bridge damage early warning method based on LSTM temperature-displacement correlation model |
- 2022
- 2022-05-17CNCN202210534056.XApatent/CN114925518B/enactiveActive
Patent Citations (9)
| Publication number | Priority date | Publication date | Assignee | Title |
|---|---|---|---|---|
| CN104268658A (en)* | 2014-09-29 | 2015-01-07 | 招商局重庆交通科研设计院有限公司 | Bridge structure safety monitoring data prediction method |
| CN106201871A (en)* | 2016-06-30 | 2016-12-07 | 重庆大学 | Based on the Software Defects Predict Methods that cost-sensitive is semi-supervised |
| CN107895014A (en)* | 2017-11-14 | 2018-04-10 | 辽宁工业大学 | A kind of time series bridge monitoring data analysing method based on MapReduce frameworks |
| CN108170925A (en)* | 2017-12-21 | 2018-06-15 | 中国铁道科学研究院铁道建筑研究所 | A kind of bridge damnification method for early warning based on arma modeling |
| WO2020008192A2 (en)* | 2018-07-03 | 2020-01-09 | Chronomics Limited | Phenotype prediction |
| CN109583570A (en)* | 2018-11-30 | 2019-04-05 | 重庆大学 | The method for determining bridge health monitoring system abnormal data source based on deep learning |
| CN111523572A (en)* | 2020-04-10 | 2020-08-11 | 重庆大学 | Real-time bridge structure damage status identification method and system |
| CN113312696A (en)* | 2021-05-26 | 2021-08-27 | 福建中锐网络股份有限公司 | Bridge health condition dynamic prediction alarm method based on ARIMA algorithm |
| CN113723010A (en)* | 2021-09-08 | 2021-11-30 | 福建中锐网络股份有限公司 | Bridge damage early warning method based on LSTM temperature-displacement correlation model |
Non-Patent Citations (7)
| Title |
|---|
| FONEONE: "时间序列模型(ARIMA和ARMA)完整步骤详述", Retrieved from the Internet <URL:https://blog.csdn.net/foneone/article/details/90141213>* |
| HUNG V. DANG 等: "Data-Driven Structural Health Monitoring Using Feature Fusion and Hybrid Deep Learning", IEEE TRANSACTIONS ON AUTOMATION SCIENCE AND ENGINEERING, vol. 18, no. 4, 6 October 2021 (2021-10-06), pages 2087 - 2103, XP011881781, DOI: 10.1109/TASE.2020.3034401* |
| JINGPEI DAN 等: "Global bridge damage detection using multi-sensor data based on optimized functional echo state networks", STRUCTURAL HEALTH MONITORING, vol. 20, no. 4, 16 August 2020 (2020-08-16), pages 1 - 14* |
| 唐浩;孟利波;宋刚;廖敬波;: "基于ARMA的桥梁监测信息预测技术研究", 世界桥梁, no. 03, 28 May 2015 (2015-05-28), pages 47 - 51* |
| 李修云;黄硕;杨文伟;谭超英;: "面向桥梁结构状态预测的ARMA-GM组合时序模型研究", 重庆交通大学学报(自然科学版), no. 04, 15 August 2016 (2016-08-15), pages 10 - 13* |
| 李西芝;章世祥;: "时间序列分析在桥梁应力监测数据预警中的应用", 湖南交通科技, no. 04, 30 December 2019 (2019-12-30), pages 87 - 91* |
| 王叶: "基于时间序列分析的无线传感器网络数据融合算法研究", 中国优秀硕士学位论文全文数据库 信息科技辑, 15 March 2014 (2014-03-15), pages 140 - 2172* |
Cited By (2)
| Publication number | Priority date | Publication date | Assignee | Title |
|---|---|---|---|---|
| CN115687983A (en)* | 2022-12-30 | 2023-02-03 | 中裕铁信交通科技股份有限公司 | Bridge health state monitoring method and system and electronic equipment |
| CN118568506A (en)* | 2024-08-01 | 2024-08-30 | 苏交科集团股份有限公司 | Medium and high frequency monitoring data timing method, system and storage medium |
Also Published As
| Publication number | Publication date |
|---|---|
| CN114925518B (en) | 2024-04-26 |
Similar Documents
| Publication | Publication Date | Title |
|---|---|---|
| US20250045476A1 (en) | Method for evaluating fatigue damage and life of bridge structure under multi-factor coupling effect and computer-readable storage medium | |
| CN110647539B (en) | Prediction method and system for vehicle faults | |
| CN102629418B (en) | Fuzzy kalman filtering-based traffic flow parameter prediction method | |
| CN103903430B (en) | Dynamic fusion type travel time predicting method with multi-source and isomorphic data adopted | |
| CN104732075B (en) | A kind of Urban Road Traffic Accidents risk real-time predicting method | |
| CN107610464A (en) | A kind of trajectory predictions method based on Gaussian Mixture time series models | |
| CN112669599B (en) | Short-time traffic flow prediction method based on time sequence analysis and residual error matching | |
| CN114925518A (en) | A bridge health warning method based on time series and multi-sensor fusion | |
| CN111275255A (en) | A Construction Method of Concrete Dam Deformation Monitoring and Prediction Model | |
| CN106373390B (en) | Traffic state evaluation method based on Adaptive Neuro-fuzzy Inference | |
| CN110232524A (en) | Social networks cheats the construction method of model, antifraud method and apparatus | |
| CN106022561A (en) | Driving comprehensive evaluation method | |
| CN109272169A (en) | Traffic flow forecasting method, device, computer equipment and storage medium | |
| CN108241901A (en) | A Transformer Early Warning Evaluation Method and Device Based on Prediction Data | |
| CN112650825A (en) | Method and device for determining abnormal drive receiving behavior, storage medium and electronic equipment | |
| CN117746626A (en) | Intelligent traffic management method and system based on traffic flow | |
| CN112542049A (en) | Comprehensive management and control platform for intelligent traffic | |
| JP2018511857A (en) | Server, system and method for identifying traffic jam end position | |
| Razavi et al. | Damage identification under ambient vibration and unpredictable signal nature | |
| CN104008646A (en) | Urban road traffic identification method and system based on elastic coefficients | |
| CN107145995A (en) | Production environment safety prediction method, device and system | |
| CN109951358A (en) | Data Network Traffic Prediction Method | |
| CN117932550A (en) | Online lubricating oil early warning method based on self-adaptive threshold | |
| CN117992810B (en) | Road and bridge intensity detection device | |
| Borkar et al. | Acoustic signal based optimal route selection problem: performance comparison of multi-attribute decision making methods |
Legal Events
| Date | Code | Title | Description |
|---|---|---|---|
| PB01 | Publication | ||
| PB01 | Publication | ||
| SE01 | Entry into force of request for substantive examination | ||
| SE01 | Entry into force of request for substantive examination | ||
| GR01 | Patent grant | ||
| GR01 | Patent grant |