CN114912074A - Statistical analysis of manufacturing production intelligent calculation method based on data space and multi-value chain - Google Patents
Statistical analysis of manufacturing production intelligent calculation method based on data space and multi-value chainDownload PDFInfo
- Publication number
- CN114912074A CN114912074ACN202210359177.5ACN202210359177ACN114912074ACN 114912074 ACN114912074 ACN 114912074ACN 202210359177 ACN202210359177 ACN 202210359177ACN 114912074 ACN114912074 ACN 114912074A
- Authority
- CN
- China
- Prior art keywords
- value chain
- statistical analysis
- chain
- value
- link
- Prior art date
- Legal status (The legal status is an assumption and is not a legal conclusion. Google has not performed a legal analysis and makes no representation as to the accuracy of the status listed.)
- Pending
Links
Images


Classifications
- G—PHYSICS
- G06—COMPUTING OR CALCULATING; COUNTING
- G06F—ELECTRIC DIGITAL DATA PROCESSING
- G06F17/00—Digital computing or data processing equipment or methods, specially adapted for specific functions
- G06F17/10—Complex mathematical operations
- G06F17/18—Complex mathematical operations for evaluating statistical data, e.g. average values, frequency distributions, probability functions, regression analysis
- G—PHYSICS
- G06—COMPUTING OR CALCULATING; COUNTING
- G06N—COMPUTING ARRANGEMENTS BASED ON SPECIFIC COMPUTATIONAL MODELS
- G06N3/00—Computing arrangements based on biological models
- G06N3/02—Neural networks
- G06N3/04—Architecture, e.g. interconnection topology
- G06N3/045—Combinations of networks
- G—PHYSICS
- G06—COMPUTING OR CALCULATING; COUNTING
- G06N—COMPUTING ARRANGEMENTS BASED ON SPECIFIC COMPUTATIONAL MODELS
- G06N3/00—Computing arrangements based on biological models
- G06N3/02—Neural networks
- G06N3/08—Learning methods
- G06N3/084—Backpropagation, e.g. using gradient descent
- G—PHYSICS
- G06—COMPUTING OR CALCULATING; COUNTING
- G06N—COMPUTING ARRANGEMENTS BASED ON SPECIFIC COMPUTATIONAL MODELS
- G06N5/00—Computing arrangements using knowledge-based models
- G06N5/01—Dynamic search techniques; Heuristics; Dynamic trees; Branch-and-bound
- G—PHYSICS
- G06—COMPUTING OR CALCULATING; COUNTING
- G06Q—INFORMATION AND COMMUNICATION TECHNOLOGY [ICT] SPECIALLY ADAPTED FOR ADMINISTRATIVE, COMMERCIAL, FINANCIAL, MANAGERIAL OR SUPERVISORY PURPOSES; SYSTEMS OR METHODS SPECIALLY ADAPTED FOR ADMINISTRATIVE, COMMERCIAL, FINANCIAL, MANAGERIAL OR SUPERVISORY PURPOSES, NOT OTHERWISE PROVIDED FOR
- G06Q10/00—Administration; Management
- G06Q10/06—Resources, workflows, human or project management; Enterprise or organisation planning; Enterprise or organisation modelling
- G06Q10/063—Operations research, analysis or management
- G—PHYSICS
- G06—COMPUTING OR CALCULATING; COUNTING
- G06Q—INFORMATION AND COMMUNICATION TECHNOLOGY [ICT] SPECIALLY ADAPTED FOR ADMINISTRATIVE, COMMERCIAL, FINANCIAL, MANAGERIAL OR SUPERVISORY PURPOSES; SYSTEMS OR METHODS SPECIALLY ADAPTED FOR ADMINISTRATIVE, COMMERCIAL, FINANCIAL, MANAGERIAL OR SUPERVISORY PURPOSES, NOT OTHERWISE PROVIDED FOR
- G06Q50/00—Information and communication technology [ICT] specially adapted for implementation of business processes of specific business sectors, e.g. utilities or tourism
- G06Q50/04—Manufacturing
- Y—GENERAL TAGGING OF NEW TECHNOLOGICAL DEVELOPMENTS; GENERAL TAGGING OF CROSS-SECTIONAL TECHNOLOGIES SPANNING OVER SEVERAL SECTIONS OF THE IPC; TECHNICAL SUBJECTS COVERED BY FORMER USPC CROSS-REFERENCE ART COLLECTIONS [XRACs] AND DIGESTS
- Y02—TECHNOLOGIES OR APPLICATIONS FOR MITIGATION OR ADAPTATION AGAINST CLIMATE CHANGE
- Y02P—CLIMATE CHANGE MITIGATION TECHNOLOGIES IN THE PRODUCTION OR PROCESSING OF GOODS
- Y02P90/00—Enabling technologies with a potential contribution to greenhouse gas [GHG] emissions mitigation
- Y02P90/30—Computing systems specially adapted for manufacturing
Landscapes
- Engineering & Computer Science (AREA)
- Physics & Mathematics (AREA)
- Theoretical Computer Science (AREA)
- General Physics & Mathematics (AREA)
- Business, Economics & Management (AREA)
- Data Mining & Analysis (AREA)
- Mathematical Physics (AREA)
- Human Resources & Organizations (AREA)
- Software Systems (AREA)
- General Engineering & Computer Science (AREA)
- Artificial Intelligence (AREA)
- General Health & Medical Sciences (AREA)
- Computing Systems (AREA)
- Evolutionary Computation (AREA)
- Computational Linguistics (AREA)
- Economics (AREA)
- Strategic Management (AREA)
- Life Sciences & Earth Sciences (AREA)
- Health & Medical Sciences (AREA)
- Mathematical Analysis (AREA)
- Biophysics (AREA)
- General Business, Economics & Management (AREA)
- Tourism & Hospitality (AREA)
- Mathematical Optimization (AREA)
- Operations Research (AREA)
- Marketing (AREA)
- Pure & Applied Mathematics (AREA)
- Biomedical Technology (AREA)
- Entrepreneurship & Innovation (AREA)
- Computational Mathematics (AREA)
- Molecular Biology (AREA)
- Probability & Statistics with Applications (AREA)
- Bioinformatics & Cheminformatics (AREA)
- Educational Administration (AREA)
- Databases & Information Systems (AREA)
- Game Theory and Decision Science (AREA)
- Algebra (AREA)
- Development Economics (AREA)
- Quality & Reliability (AREA)
- Bioinformatics & Computational Biology (AREA)
Abstract
Description
Translated fromChinese技术领域technical field
本发明属于数据空间智能计算领域,尤其涉及一种基于数据空间多价值链 统计分析制造业生产智能计算方法。The invention belongs to the field of intelligent computing in data space, and in particular relates to an intelligent computing method for manufacturing production based on multi-value chain statistical analysis in data space.
背景技术Background technique
数据空间这一数据管理方法与当前智能制造企业统计分析决策问题相结合, 能够有效提高智能制造领域的统计分析决策水平,从而促进制造业高质量快速 发展。The data management method of data space, combined with the current statistical analysis and decision-making problems of intelligent manufacturing enterprises, can effectively improve the level of statistical analysis and decision-making in the field of intelligent manufacturing, thereby promoting the high-quality and rapid development of the manufacturing industry.
现如今,全球产业价值链正在调整升级,各国如何更好地参与全球产业价 值链重构。其中,多价值链协同描述了价值在产业链上相关主体中传递、转移 和增值过程,它是在产业链结构下遵循价值的发现和再创造过程,多价值链架 构的建立有利于充分整合产业链中各个企业的价值链,持续地对产业链价值系 统进行设计和再设计。同时打造多价值链协同的统计分析决策模型,有效把控 制造行业各业务环节之间的相互关系,联动协同,从多价值链角度,精准分析 供应、营销及服务等多维度因素对制造业统计分析决策的影响,为制造业高质 量发展提供有效途径。Nowadays, the global industrial value chain is being adjusted and upgraded. How can countries better participate in the reconstruction of the global industrial value chain? Among them, multi-value chain collaboration describes the process of value transmission, transfer and value-added among relevant subjects in the industrial chain. It follows the process of value discovery and re-creation under the industrial chain structure. The establishment of a multi-value chain structure is conducive to fully integrating the industry. The value chain of each enterprise in the chain continuously designs and redesigns the value system of the industrial chain. At the same time, a statistical analysis and decision-making model for multi-value chain collaboration is created to effectively control the relationship between various business links in the manufacturing industry, linkage and coordination, and from the perspective of multi-value chains, accurately analyze supply, marketing and services and other multi-dimensional factors for manufacturing statistics. Analyze the impact of decisions and provide an effective way for the high-quality development of the manufacturing industry.
目前,我国制造业生产经营过程中存在许多问题。第一,在实现智能制造 的过程中,制造企业同时面临着内部挑战和外部环境变化的双重压力。从企业 内部看,生产成本上升、研发投入不足、生产组织方式较为传统都是目前亟待 解决的具体问题。从外部环境看,消费者具有更大的主导权,大数据、云计算、 3D打印、机器人等技术发展将颠覆旧有的制造模式,跨界融合、制造业服务化 的趋势也日益显著。第二,当前制造企业多价值链的研究更多聚焦于某一单一 价值链的业务范围,对于多价值链之间的协同关系研究较少。对于制造业多价 值链协同架构的构建基本为空白。第三,数据空间这一智能化数据管理技术在多价值链架构之中的应用并未得到实现,对于多价值链影响因素的选取方法更 多地聚焦于因子分析和成分分析等,较少使用智能算法进行客观分析;在多价 值链协同的研究方法中也多使用回归分析的方法,较少使用深度学习算法。At present, there are many problems in the production and operation of my country's manufacturing industry. First, in the process of realizing intelligent manufacturing, manufacturing enterprises are faced with the dual pressures of internal challenges and changes in the external environment. From an internal perspective, rising production costs, insufficient R&D investment, and traditional production organization are all specific problems that need to be solved urgently. From the perspective of the external environment, consumers have greater dominance. The development of technologies such as big data, cloud computing, 3D printing, and robotics will subvert the old manufacturing model. Second, the current research on multi-value chains of manufacturing enterprises focuses more on the business scope of a single value chain, and there is less research on the synergistic relationship between multiple value chains. The construction of a multi-value chain collaborative architecture in the manufacturing industry is basically blank. Third, the application of data space, an intelligent data management technology, in the multi-value chain structure has not been realized. The selection method of multi-value chain influencing factors focuses more on factor analysis and component analysis, etc., and is rarely used. Intelligent algorithms are used for objective analysis; in the research methods of multi-value chain collaboration, regression analysis methods are also used, and deep learning algorithms are rarely used.
目前研究针对制造业多价值链之间的协同关系,还没有形成完整的研究体 系,对于制造业多价值链影响因素的选取方法更多地聚焦于因子分析和成分分 析等,较少使用智能算法进行客观分析;在多价值链协同的研究方法中也多使 用回归分析的方法,较少使用深度学习算法。而深度学习算法因其宽度广、上 限高、神经网络层数多等特点,成为人工智能领域解决复杂数据驱动问题的主 流方法,常常应用于预测领域。而且制造业数据空间平台能够更好地适应智能 制造的特点,能够更好地利用制造企业的分布式异构数据,将数据与智能应用 相关联,从而更好地支持制造业统计分析决策。At present, the research focuses on the synergistic relationship between the multi-value chains of the manufacturing industry, and a complete research system has not yet been formed. The selection method of the influencing factors of the multi-value chains of the manufacturing industry focuses more on factor analysis and component analysis, etc., and uses less intelligent algorithms. Carry out objective analysis; in the research methods of multi-value chain collaboration, regression analysis methods are also used, and deep learning algorithms are rarely used. Due to its wide width, high upper limit, and many neural network layers, deep learning algorithms have become the mainstream method for solving complex data-driven problems in the field of artificial intelligence, and are often used in the field of forecasting. Moreover, the manufacturing data space platform can better adapt to the characteristics of intelligent manufacturing, and can make better use of the distributed heterogeneous data of manufacturing enterprises to associate data with intelligent applications, so as to better support manufacturing statistical analysis and decision-making.
发明内容SUMMARY OF THE INVENTION
针对上述问题,本发明提出了一种基于数据空间多价值链统计分析制造业 生产智能计算方法。首先利用数据空间制造业多价值链协同体系架构,形成制 造业多价值链协同模式,然后利用随机森林算法进行多价值链因素筛选,最后 构建了随机森林(RF)-天牛须优化(BAS)-卷积神经网络(CNN)组合模型 进行制造业多价值链协同的统计分析及决策分析。从而实现基于数据空间的制 造企业多价值链协同的统计分析及决策分析,为制造企业生产经营管理提出建 议。In view of the above problems, the present invention proposes an intelligent calculation method for manufacturing production based on data space multi-value chain statistical analysis. Firstly, the multi-value chain collaboration system architecture of the manufacturing industry is used in the data space to form a multi-value chain collaboration mode in the manufacturing industry. Then, the random forest algorithm is used to screen the factors of the multi-value chain. Finally, the random forest (RF) - beetle optimization (BAS) is constructed. -Convolutional Neural Network (CNN) combination model for statistical analysis and decision analysis of multi-value chain collaboration in manufacturing. In this way, the statistical analysis and decision-making analysis of multi-value chain collaboration of manufacturing enterprises based on data space can be realized, and suggestions for production and operation management of manufacturing enterprises are put forward.
一种基于数据空间多价值链统计分析制造业生产智能计算方法,包括:An intelligent calculation method for manufacturing production based on data space multi-value chain statistical analysis, including:
步骤1:基于数据空间多价值链协同体系架构,确定内部价值链和外部价值 链的影响因素;内部价值链为生产环节,外部价值链包括供应环节、营销环节 和服务环节;Step 1: Determine the influencing factors of the internal value chain and the external value chain based on the multi-value chain collaborative system architecture of the data space; the internal value chain is the production link, and the external value chain includes the supply link, marketing link and service link;
步骤2:采用随机森林算法(RF)对外部价值链影响因素进行筛选和分析, 得到不同影响因素在各自环节中的贡献程度,根据贡献程度将影响因素进行重 构,得到各自环节的综合影响因素指标;Step 2: Use Random Forest Algorithm (RF) to screen and analyze the influencing factors of the external value chain, obtain the contribution degree of different influencing factors in their respective links, reconstruct the influencing factors according to the contribution degrees, and obtain the comprehensive influencing factors of each link index;
步骤3:对构建的外部价值链综合影响因素指标和内部价值链统计分析决策 指标进行数据累计平滑处理,得到外部价值链各环节的累计综合影响因素指标 和内部价值链累计统计分析决策指标;Step 3: Perform data accumulation and smoothing on the constructed external value chain comprehensive influencing factor indicators and internal value chain statistical analysis decision indicators, and obtain the cumulative comprehensive influencing factor indicators of each link of the external value chain and the internal value chain cumulative statistical analysis decision indicators;
步骤4:将内部价值链累计统计分析决策指标作为输出变量,外部价值链各 环节的累计综合影响因素指标作为输入变量建立初始模型,利用天牛须优化的 卷积神经网络对该初始模型进行训练,得到统计分析决策模型;Step 4: Use the cumulative statistical analysis decision-making index of the internal value chain as the output variable, and the cumulative comprehensive influencing factor indicators of each link of the external value chain as the input variable to establish an initial model, and use the convolutional neural network optimized by Tianniu to train the initial model , to obtain a statistical analysis decision model;
步骤5:利用得到的统计分析决策模型计算制造业的生产能力以进行决策。Step 5: Use the obtained statistical analysis decision model to calculate the production capacity of the manufacturing industry for decision-making.
进一步,供应链的影响因素包括原材料采购量、原材料采购成本、原材料 存货、出库成本、原材料运费、原材料使用量、原材料价格、资金筹措以及借 款利息;所述营销链影响因素包括销售量、销售成本、销售收入、销售毛利以 及销售价格;所述服务链影响因素包括检修成本、检修次数、客户数量及产品 合格率。Further, the influencing factors of the supply chain include raw material procurement volume, raw material procurement cost, raw material inventory, delivery cost, raw material freight, raw material usage, raw material price, financing and loan interest; the marketing chain influencing factors include sales volume, sales Cost, sales revenue, sales gross profit and sales price; the service chain influencing factors include maintenance cost, number of maintenance, number of customers and product qualification rate.
进一步,外部价值链各自环节的综合影响因素指标由下式计算Further, the comprehensive influencing factor index of each link of the external value chain is calculated by the following formula:

其中,i代表外部价值链的不同环节,g代表外部价值链某一环节中的第g个 影响因素,m代表外部价值链某一环节中共m个影响因素,dig代表外部价值链i环 节第g个影响因素的序列数据,wig代表外部价值链i环节第g个影响因素的贡献程 度,Di代表外部价值链i环节的综合影响因素序列数据。Among them, i represents different links of the external value chain,g represents theg -th influencing factor in a certain link of the external value chain,m represents them influencing factors in a certain link of the external value chain, and dig represents the i-th link of the external value chain. The sequence data ofg influencing factors, wig represents the contribution degree of thegth influencing factor in the i link of the external value chain, and Di represents the sequence data of the comprehensive influencing factors of the i link of the external value chain.
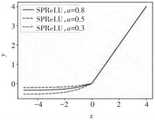
进一步,对初始模型进行训练时,选取的激活函数为SPReLu,其数学形式 为Further, when training the initial model, the selected activation function is SPReLu, and its mathematical form is

其中,a为随机参数,根据模型实时训练发生变化,最终收敛为适宜的常数。Among them, a is a random parameter, which changes according to the real-time training of the model, and finally converges to a suitable constant.
更进一步,a取值可以为常数0.3、0.5或0.8。Furthermore, the value of a can be a constant of 0.3, 0.5 or 0.8.
进一步,在利用所述激活函数对初始模型进行训练时,在迭代10000次之 前,在区间(0.0001,0.01)中使用优化算法寻找最优的高学习率,以加快迭代 更新的速度,找到全局近似最优解;之后再从(0.0001,0.01)中使用优化算法 寻找最优的低学习率以获得全局最优解。Further, when using the activation function to train the initial model, before 10,000 iterations, an optimization algorithm is used to find the optimal high learning rate in the interval (0.0001, 0.01) to speed up the iterative update and find a global approximation The optimal solution; then use the optimization algorithm from (0.0001, 0.01) to find the optimal low learning rate to obtain the global optimal solution.
进一步,利用天牛须算法优化卷积神经网络的具体步骤包括:Further, the specific steps for optimizing the convolutional neural network using the beetle algorithm include:
Step1:网络进行权值的初始化;Step1: The network initializes the weights;
Step2:输入数据经过卷积层、下采样层、全连接层的向前传播得到输出值;Step2: The input data is propagated forward through the convolutional layer, the downsampling layer, and the fully connected layer to obtain the output value;
Step3:求出网络的输出值与目标值之间的误差;Step3: Find the error between the output value of the network and the target value;
Step4:当误差大于期望值时,将误差传回网络中,依次求得全连接层,下 采样层,卷积层的误差;当误差等于或小于期望值时,结束训练;Step4: When the error is greater than the expected value, the error is sent back to the network, and the errors of the fully connected layer, the downsampling layer, and the convolutional layer are obtained in turn; when the error is equal to or less than the expected value, the training is ended;
Step5:根据求得误差进行权值更新,优化学习率和激活函数,返回到Step2。Step5: Update the weights according to the obtained error, optimize the learning rate and activation function, and return to Step2.
本发明的有益效果在于:通过提出的基于数据空间多价值链统计分析制造 业生产智能计算方法,为制造业高质量发展提供有效途径,提高制造业统计分 析决策水平,提升企业竞争力,充分把握新工业时代下信息资源带来的机遇, 构建以数据洞察为驱动的制造业多价值链生产管理模式,从而促进制造业智能 化统计分析决策管理。此方法可以适应市场环境的具体要求和变化,精准分析 统计分析决策过程中可能出现的各种因素,从生产、供应、营销及服务等多价 值链环节分析其中的协同关系。同时,利用制造企业的分布式异构数据,将数 据与智能应用相关联,充分利用海量数据空间技术,结合产业链融合,打造多 价值链协同的统计分析决策模型。The beneficial effects of the present invention are: through the proposed intelligent calculation method for manufacturing production based on data space multi-value chain statistical analysis, an effective way is provided for the high-quality development of the manufacturing industry, the level of statistical analysis and decision-making in the manufacturing industry is improved, the competitiveness of enterprises is enhanced, and the Opportunities brought by information resources in the new industrial era, build a multi-value chain production management model driven by data insights, thereby promoting intelligent statistical analysis and decision-making management in the manufacturing industry. This method can adapt to the specific requirements and changes of the market environment, accurately analyze various factors that may appear in the process of statistical analysis and decision-making, and analyze the synergistic relationship among multi-value chain links such as production, supply, marketing and service. At the same time, the distributed heterogeneous data of manufacturing enterprises is used to associate data with intelligent applications, make full use of massive data space technology, and combine industrial chain integration to create a multi-value chain collaborative statistical analysis and decision-making model.
附图说明Description of drawings
图1是基于数据空间多价值链统计分析制造业生产智能计算方法模型框架 图;Figure 1 is a model frame diagram of an intelligent calculation method for manufacturing production based on data space multi-value chain statistical analysis;
图2是激活函数SPReLU的参考图;Fig. 2 is the reference diagram of activation function SPReLU;
图3是BAS优化的CNN训练算法的具体流程图;Fig. 3 is the specific flow chart of the CNN training algorithm optimized by BAS;
图4是不同训练算法下统计分析决策模型的对比图;Figure 4 is a comparison diagram of statistical analysis decision models under different training algorithms;
图5是不同训练算法下统计分析决策模型的误差对比图。Figure 5 is a comparison chart of errors of statistical analysis decision models under different training algorithms.
具体实施方式Detailed ways
下面结合附图,对实施例作详细说明。The embodiments are described in detail below with reference to the accompanying drawings.
目前对于多价值链系统架构的研究方法包括系统动力学、生命周期法,综 合评价法等等。系统动力学是一种系统建模和动态模拟方法。它通过系统各要 素之间的复杂关系建立一个相对有效的模型。但是,系统动力学法不够精细, 无法十分准确地描述相关问题。企业的生命周期理论认为,在不同的生命周期 阶段,企业的经营管理方式和投资决策会有所不同,企业中的价值链研究同样 会受到影响。生命周期法可以完整地跟踪系统,解决全局问题。但是生命周期 法的流程较长,需要耗费时间多。综合评价法指的是运用多个指标对多个参评 单位进行评价的方法,它可以多元化地对企业的相关情况进行评价。但由于指标可得性以及主观性的限制,综合评价法难以完全全面与客观地反映被评价对 象的特点。At present, the research methods for multi-value chain system architecture include system dynamics, life cycle method, comprehensive evaluation method and so on. System dynamics is a system modeling and dynamic simulation method. It builds a relatively effective model through the complex relationship between the elements of the system. However, the system dynamics method is not refined enough to describe the relevant problems with sufficient accuracy. The life cycle theory of an enterprise believes that in different life cycle stages, the operation and management methods and investment decisions of the enterprise will be different, and the research on the value chain in the enterprise will also be affected. The life cycle method can completely track the system and solve the global problem. However, the process of the life cycle method is longer and takes more time. The comprehensive evaluation method refers to the method of using multiple indicators to evaluate multiple participating units. It can evaluate the relevant situation of the enterprise in a diversified manner. However, due to the limitation of index availability and subjectivity, the comprehensive evaluation method cannot fully and objectively reflect the characteristics of the object being evaluated.
当前对于企业的价值链进行研究涉及到多个业务流程的影响因素筛选的方 法主要有因子分析法、灰色关联分析法、PCA法等等。因子分析对于样本数量 的有所要求。样本量过大,会造成人力、物力和财力的浪费;样本量过小,又 会增加抽样误差,影响分析结果的可靠程度。灰色关联分析法也是常用的影响 因素筛选方法,常用于确定企业的生产管理特征分析以及相关影响因素的排序。 但是,灰色关联度量化模型所求出的关联度为正值,这不能全面反映事物之间 的关系。同时,该方法不能解决评价指标间相关造成的评价信息重复问题,因 而指标的选择对评判结果影响很大。主成分分析(PCA)被广泛用于模式识别和数据分析的特征提取和降维,常用于企业的各价值链的影响因素筛选。主成 分分析法虽然有着简便快捷的优点,但其第一主成分中各指标变量的系数正负, 可能与评价的实际意义不符,命名清晰度低。The current research on the value chain of an enterprise involves the screening of influencing factors of multiple business processes, including factor analysis, grey correlation analysis, PCA and so on. Factor analysis requires a sample size. If the sample size is too large, it will cause waste of human, material and financial resources; if the sample size is too small, it will increase the sampling error and affect the reliability of the analysis results. Grey relational analysis is also a commonly used screening method for influencing factors, which is often used to determine the characteristics of production management of enterprises and the ranking of relevant influencing factors. However, the correlation degree obtained by the grey relational quantification model is a positive value, which cannot fully reflect the relationship between things. At the same time, this method cannot solve the problem of duplication of evaluation information caused by the correlation between evaluation indicators, so the selection of indicators has a great impact on the evaluation results. Principal Component Analysis (PCA) is widely used for feature extraction and dimensionality reduction in pattern recognition and data analysis, and is often used in the screening of influencing factors in various value chains of enterprises. Although the principal component analysis method has the advantages of simplicity and speed, the positive and negative coefficients of each index variable in the first principal component may not match the actual meaning of the evaluation, and the naming clarity is low.
当前对于企业多价值链的研究,更多聚焦于某一单一价值链的业务范围, 对于多价值链之间的协同关系研究较少。其中,分析不同业务流程的价值链因 素之间的相互关系的研究,主要采用的研究方法为建立回归预测模型。建立这 种模型的方法有很多,包括多元线性回归方法、机器学习方法、弹性网络方法 等等。多元线性回归(MLR)拥有简单性和可解释性的优点。它可以用于相互 关系的研究中。线性回归模型形式简单、易于建模,但是,线性回归方程的假 设较为严格,需要了解引起因变量改变的所有解释变量的因素,否则会出现伪 回归等问题。机器学习技术可以帮助人们从海量数据中发现规律,形成回归预 测模型。但是,机器学习所包含的方法多种多样,在面对不同的领域需要根据 数据集来选择方法,同时,机器学习方法通常存在容易出现过拟合、欠拟合以 及耗时耗力等问题。弹性网络是一种正则化的最小二乘回归方法,是Ridge回归 和Lasso回归的凸组合。弹性网络在企业相关的研究中应用较少。当弹性网络陷 入局部极小值时,网络将失去继续学习的能力,从而无法得到最优解,这是该 方法的重要缺陷。At present, the research on multi-value chains of enterprises focuses more on the business scope of a single value chain, and there is less research on the synergistic relationship between multiple value chains. Among them, the main research method used to analyze the relationship between the value chain factors of different business processes is to establish a regression prediction model. There are many ways to build this model, including multiple linear regression methods, machine learning methods, elastic network methods, and so on. Multiple linear regression (MLR) has the advantages of simplicity and interpretability. It can be used in the study of interrelationships. The linear regression model has a simple form and is easy to model. However, the assumptions of the linear regression equation are relatively strict, and it is necessary to understand all the explanatory variables that cause the change of the dependent variable, otherwise there will be problems such as pseudo-regression. Machine learning technology can help people discover patterns from massive data and form regression prediction models. However, there are various methods included in machine learning. In the face of different fields, methods need to be selected according to data sets. At the same time, machine learning methods usually have problems such as overfitting, underfitting, and time-consuming and labor-intensive. Elastic Net is a regularized least squares regression method, which is a convex combination of Ridge regression and Lasso regression. Elastic networks are rarely used in enterprise-related research. When the elastic network falls into a local minimum, the network will lose the ability to continue learning, so that the optimal solution cannot be obtained, which is an important defect of this method.
根据以上研究可以看出,当前研究针对多价值链的单一价值链的研究已经 形成了较为完整的研究体系,但对于制造企业多价值链之间的协同关系,还没 有形成完整的研究体系,对于制造企业多价值链协同架构的构建基本为空白, 数据空间这一智能化数据管理技术在多价值链架构之中的应用也基本为空白; 在统计分析决策的研究中也很少从多价值链角度进行分析,对于多价值链影响 因素的选取方法更多地聚焦于因子分析和成分分析等,较少使用智能算法进行 客观分析;在多价值链协同的研究方法中也多使用回归分析的方法,较少使用 深度学习算法。According to the above research, it can be seen that the current research on the single value chain of multiple value chains has formed a relatively complete research system, but there is no complete research system for the collaborative relationship between multiple value chains of manufacturing enterprises. The construction of multi-value chain collaborative architecture of manufacturing enterprises is basically blank, and the application of data space, an intelligent data management technology, in the multi-value chain architecture is basically blank. From the perspective of analysis, the selection method of multi-value chain influencing factors focuses more on factor analysis and component analysis, etc., and uses less intelligent algorithms for objective analysis; in the research method of multi-value chain collaboration, regression analysis is also used. , with less use of deep learning algorithms.
本发明规划的数据空间多价值链协同体系架构进行制造业统计分析决策分 析,利用多价值链协同体系架构中的多价值链协同关系,通过随机森林算法筛 选重构多价值链影响因素,利用天牛须优化的CNN进行统计分析决策,从而构 建三阶段(RF-BAS-CNN)统计分析决策模型。图1示出了本发明的一种基于 数据空间多价值链统计分析制造业生产智能计算方法模型框架。The data space multi-value chain collaborative system architecture planned by the invention carries out statistical analysis and decision-making analysis of the manufacturing industry, utilizes the multi-value chain collaborative relationship in the multi-value chain collaborative architecture, filters and reconstructs the multi-value chain influencing factors through the random forest algorithm, and utilizes the The cattle-beard-optimized CNN conducts statistical analysis and decision-making, thereby constructing a three-stage (RF-BAS-CNN) statistical analysis and decision-making model. Figure 1 shows a model framework of an intelligent calculation method for manufacturing production based on data space multi-value chain statistical analysis of the present invention.
数据空间多价值链协同体系构建。Data space multi-value chain collaborative system construction.
本发明基于整体性、层次性、可扩展性、制造业适用性、多价值链协同性、 全过程性和多源异构性的原则,根据数据空间的制造业多价值链协同体系的特 征,形成数据空间多价值链协同体系架构,分析生产、供应、营销及服务各价 值链之间的相互关系和外部价值链对内部价值链的影响,确定制造业统计分析 决策的价值链角度分析对象。最终,在多价值链的生产环节,确定了生产订单 数量(POQ)作为统计分析决策的研究变量;在多价值链的供应环节,最终选 取原材料采购量(RMPV)、原材料采购成本(RMPC)、原材料存货(RMI)、 出库成本(OC)、原材料运费(RMF)、原材料使用量(RMU)、原材料价格(RMP)、 资金筹措(F)以及借款利息(B)9个影响因素,从原材料供应、原材料使用 情况以及资金供应等方面反映电力制造企业实际的供应情况;在多价值链的营 销环节,选取了销售量(SV)、销售成本(C)、销售收入(R)、销售毛利(G) 以及销售价格(P)5个影响因素作为营销环节的影响因素,这几个变量可以从 营销的收支情况及盈利情况等方面反映出电力制造企业的营销状况;在多价值 链的服务环节,选取了检修成本(MC)、检修次数(OT)、客户数量(NC)及 产品合格率(RQP)4个影响因素,来反映电力制造业对客户的服务情况以及服 务对生产的影响,构成多价值链中服务环节。The invention is based on the principles of integrity, hierarchy, scalability, manufacturing applicability, multi-value chain collaboration, whole process and multi-source heterogeneity, and according to the characteristics of the manufacturing multi-value chain collaborative system in the data space, Form a multi-value chain collaborative system architecture in the data space, analyze the relationship between production, supply, marketing and service value chains and the impact of external value chains on the internal value chain, and determine the value chain analysis object for manufacturing statistical analysis and decision-making. Finally, in the production link of the multi-value chain, the production order quantity (POQ) is determined as the research variable for statistical analysis and decision-making; in the supply link of the multi-value chain, the raw material procurement volume (RMPV), raw material procurement cost (RMPC), Raw material inventory (RMI), outgoing cost (OC), raw material freight (RMF), raw material usage (RMU), raw material price (RMP), financing (F) and borrowing interest (B) 9 factors, from raw materials Supply, raw material usage and capital supply reflect the actual supply situation of power manufacturing enterprises; in the multi-value chain marketing link, sales volume (SV), cost of sales (C), sales revenue (R), sales gross profit ( G) and sales price (P) 5 influencing factors as the influencing factors of the marketing link, these variables can reflect the marketing situation of power manufacturing enterprises from the aspects of marketing revenue and expenditure and profitability; In the link, four influencing factors including maintenance cost (MC), number of maintenance (OT), number of customers (NC) and product qualification rate (RQP) were selected to reflect the service situation of the power manufacturing industry to customers and the impact of service on production. It constitutes the service link in the multi-value chain.
本发明对基于数据空间的制造业多价值链协同体系架构进行了规划,在体 系架构的规划中,涉及到数据服务层制造业多价值链数据,利用该数据进行统 计分析决策,得到制造业生产经营的基本内在关系。从体系架构的构建来看, 多价值链之中,外部价值链的供应、营销及服务环节对企业内部的生产经营环 节具有重要的影响作用,企业能够正常生产经营,取决于内外部价值链之间的 相互协同关系。The invention plans the multi-value chain collaboration system architecture of the manufacturing industry based on the data space. In the planning of the system architecture, the multi-value chain data of the manufacturing industry in the data service layer is involved, and the data is used for statistical analysis and decision-making to obtain the manufacturing production The basic internal relationship of operation. From the perspective of the construction of the system architecture, in the multi-value chain, the supply, marketing and service links of the external value chain have an important impact on the internal production and operation of the enterprise. The normal production and operation of the enterprise depends on the internal and external value chains. mutual synergy between them.
筛选多价值链综合影响因素。Screen the comprehensive influencing factors of multiple value chains.
多价值链中的每一条价值链都存在着多种影响因素,其对价值链的意义与 影响也有所不同,为了更好地体现多价值链之间的协同关系,有必要针对单一 价值链内部影响因素进行分析。因此在确定输入的变量数据之前,需要对相关 影响因素进行筛选,找出影响最大的、最有意义的影响因子作为输入变量,既 能避免耗时耗力,又能提高决策效率。随机森林算法是一种利用多个决策树对 数据进行综合分类的方法,可用于影响因素的筛选,具有训练速度快,容易做 成并行化方法、能够检测到影响因子间的互相影响等优点。基于此,本发明采 用随机森林算法对制造业多价值链的供应、营销及服务环节进行影响因素的筛 选和分析,得到不同影响因素在该价值链中的贡献程度,根据贡献程度将影响 因素进行重构,得到多价值链综合影响因素,形成累计供应综合影响因素指标 (C_ICSU)、累计营销综合影响因素指标(C_ICM)和累计服务综合影响因素 指标(C_ICSE)三大综合影响因素指标。Each value chain in the multi-value chain has a variety of influencing factors, which have different meanings and influences on the value chain. In order to better reflect the synergy between the multi-value chains, it is necessary to target the internal Analysis of influencing factors. Therefore, before determining the input variable data, it is necessary to screen the relevant influencing factors and find the most influential and meaningful influencing factors as input variables, which can not only avoid time-consuming and labor-intensive, but also improve decision-making efficiency. Random forest algorithm is a method that uses multiple decision trees to comprehensively classify data, which can be used for screening of influencing factors. Based on this, the present invention uses the random forest algorithm to screen and analyze the influencing factors of the supply, marketing and service links of the multi-value chain of the manufacturing industry, and obtains the contribution degree of different influencing factors in the value chain. Reconstruction to obtain the comprehensive influencing factors of multiple value chains, and form three comprehensive influencing factor indicators of cumulative supply comprehensive influencing factor index (C_ICSU), cumulative marketing comprehensive influencing factor index (C_ICM) and cumulative service comprehensive influencing factor index (C_ICSE).
Step1:通过随机森林算法计算外部价值链中供应、营销及服务环节各影响 因素对该价值链的贡献程度。Step1: Calculate the contribution of each influencing factor of supply, marketing and service in the external value chain to the value chain through random forest algorithm.
(1)当随机森林

当原始数据量N足够大时,k≈0.368N。使用回归树Tn对OOBn进行预测, 得到OOBn的预测均方误差为When the original data volume N is large enough, k≈0.368N. Using the regression tree Tn to predict OOBn , the mean square error of the prediction of OOBn is obtained as

式中:yi为OOBn中响应变量的第i个实测量;
于是,对于整个随机森林,可得到ntree个袋外数据的预测均方误差,即Therefore, for the entire random forest, the predicted mean square error of ntree out-of-bag data can be obtained, namely
[MSE1...MSEn...MSEntree] (3)[MSE1 ...MSEn ...MSEntree ] (3)
(2)针对自变量Xj(1≤j≤p),j表示在未被抽取的p个袋外数据中的第j 个数据;在ntree个OOB样本中,保持其他列数据不变,对各样本中的第j列数据 进行随机置换,形成ntree个新的OOB样本,计算各新OOB样本的预测均方误差, 得到[MSE1...MSEn...MSEntree],则对所有自变量Xj(对应各价值链中的各个影响因 素)有如下预测均方误差矩阵(2) For the independent variable Xj (1≤j≤p), j represents the jth data in the unextracted p out-of-bag data; in ntree OOB samples, keeping other column data unchanged, for The jth column of data in each sample is randomly permuted to form ntree new OOB samples, and the prediction mean square error of each new OOB sample is calculated to obtain [MSE1 ... MSEn ... MSEntree ], then for all the new OOB samples The independent variable Xj (corresponding to each influencing factor in each value chain) has the following prediction mean square error matrix

用[MSE1...MSEn...MSEntree]与上述矩阵的第[MSE1...MSEn...MSEntree]行向量相减, 平均后再除以标准误差得到自变量Xj的重要性评分(increase of mean squarederror,IncMSE),即Use [MSE1 ... MSEn ... MSEntree ] to subtract the vector of the [MSE1 ... MSEn ... MSEntree ] row of the above matrix, and then divide by the standard error to obtain the independent variable X The importance score ofj (increase of mean squared error, IncMSE), namely


式中:ti为袋外数据中响应变量的第i个实测值;
Step2:通过随机森林算法计算得到外部价值链不同环节各影响因素在该环 节中的贡献程度,该贡献程度可以反映出这一影响因素在外部价值链中该环节 的重要性,通过该重要性可以对外部价值链影响因素进行重构,建立可以代表 外部价值链不同环节的综合影响因素指标。具体计算方法如下:Step2: Calculate the contribution degree of each influencing factor in different links of the external value chain through the random forest algorithm. The contribution degree can reflect the importance of this influencing factor in this link in the external value chain. Reconstruct the influencing factors of the external value chain, and establish comprehensive influencing factor indicators that can represent different links of the external value chain. The specific calculation method is as follows:

其中,i代表外部价值链的不同环节,g代表外部价值链某一环节中的第g个 影响因素,m代表外部价值链某一环节中共m个影响因素,dig代表外部价值链i环 节第g个影响因素的序列数据,wig代表外部价值链i环节第g个影响因素的贡献程 度,Di代表外部价值链i环节的综合影响因素序列数据。Among them, i represents different links of the external value chain,g represents theg -th influencing factor in a certain link of the external value chain,m represents them influencing factors in a certain link of the external value chain, and dig represents the i-th link of the external value chain. The sequence data ofg influencing factors, wig represents the contribution degree of thegth influencing factor in the i link of the external value chain, and Di represents the sequence data of the comprehensive influencing factors of the i link of the external value chain.
对影响因素指标数据进行累计平滑处理。由于本发明所涉及的影响因素众 多,而部分影响因素的数据值存在着较大的波动,容易影响模型的最终结果, 因此本发明对数据波动较大的影响因素序列采用累计平滑的方式来处理数据。 该方法能够有效平滑数据,使得数据变化出现随时间变动的基本规律,从而为 后续统计分析决策提供良好的数据基础。通过这种方法可以提高研究的准确度, 实现有效的数据平滑处理。基于该方法,本发明对构建的外部价值链综合影响 因素指标和内部价值链统计分析决策指标进行数据累计平滑处理,形成统计分 析决策模型的输入变量和输出变量。Accumulative smoothing is performed on the influencing factor indicator data. Since there are many influencing factors involved in the present invention, and the data values of some of the influencing factors have large fluctuations, it is easy to affect the final result of the model, so the present invention adopts the cumulative smoothing method to process the sequence of influencing factors with large data fluctuations data. This method can effectively smooth the data, so that the basic law of data changes with time changes, so as to provide a good data basis for subsequent statistical analysis and decision-making. This method can improve the accuracy of research and achieve effective data smoothing. Based on this method, the present invention performs data accumulation and smoothing on the constructed external value chain comprehensive influencing factor indicators and internal value chain statistical analysis decision indicators to form input variables and output variables of the statistical analysis decision model.
本发明通过随机森林算法对外部价值链的供应、营销及服务等环节的研究, 得到不同环节各因素贡献程度。其中供应环节中,原材料采购量和原材料价格 对供应环节整体的影响程度较高,而原材料存货和原材料采购成本对供应环节 的影响程度较弱;营销环节中,销售量和销售收入对营销环节影响程度较高, 而销售成本的营销程度较小;在服务环节中,几种因素的贡献程度基本保持在 同一水平,其中检修次数的影响程度较高。因此为保证制造企业内部价值链生 产经营的有效性和合理性,在外部价值链环节,应当有效把控原材料采购量和 采购价格、销售量和销售收入以及客户服务的检修次数。The present invention obtains the contribution degree of each factor in different links through the research on the supply, marketing and service of the external value chain through the random forest algorithm. Among them, in the supply chain, the raw material purchase volume and raw material price have a higher degree of influence on the overall supply chain, while the raw material inventory and raw material purchase cost have a weaker impact on the supply chain; in the marketing chain, the sales volume and sales revenue have an impact on the marketing chain. In the service link, the contribution degree of several factors is basically kept at the same level, and the influence degree of the number of maintenance is relatively high. Therefore, in order to ensure the effectiveness and rationality of the production and operation of the internal value chain of manufacturing enterprises, in the external value chain links, the purchase volume and purchase price of raw materials, sales volume and sales revenue, and the number of maintenance of customer services should be effectively controlled.
通过构建外部综合影响因素指标,可以看出各指标可以实现平稳变动。在 企业生产经营过程中,将外部价值链指标控制在合理范围内能够有效稳定生产 经营,保障制造企业内部价值链的稳定性。By constructing the index of external comprehensive influencing factors, it can be seen that each index can achieve stable changes. In the process of production and operation of enterprises, controlling the external value chain indicators within a reasonable range can effectively stabilize production and operation and ensure the stability of the internal value chain of manufacturing enterprises.
构建基于数据空间多价值链协同的统计分析生产决策模型。Build a statistical analysis and production decision-making model based on data space multi-value chain collaboration.
将随机森林(RF)筛选指出来的累计供应综合影响因素指标(C_ICSU)、累 计营销综合影响因素指标(C_ICM)和累计服务综合影响因素指标(C_ICSE) 作为输入,累计生产订单数量(即内部价值链累计统计分析决策指标)作为输 出构建初始模型。利用天牛须优化的卷积神经网络(CNN)对该模型进行训练, 最终得到RF-BAS-CNN模型,也即本发明的统计分析决策模型,然后利用模型对实 际生产情况进行预测。Taking the cumulative supply comprehensive influence factor index (C_ICSU), cumulative marketing comprehensive influence factor index (C_ICM) and cumulative service comprehensive influence factor index (C_ICSE) pointed out by random forest (RF) screening as input, the cumulative number of production orders (that is, the internal value Chain Cumulative Statistical Analysis Decision Indicator) as the output to build the initial model. The model is trained by using the convolutional neural network (CNN) optimized by beetles, and finally the RF-BAS-CNN model is obtained, that is, the statistical analysis decision model of the present invention, and then the model is used to predict the actual production situation.
卷积神经网络(Convolutional Neural Networks,CNN)是一类包含卷积计算 且具有深度结构的前馈神经网络(Feedforward Neural Networks),是深度学习 (deeplearning)的代表算法之一。卷积神经网络具有表征学习(representation learning)能力,能够按其阶层结构对输入信息进行平移不变分类,因此也被称 为“平移不变人工神经网络(Shift-Invariant Artificial Neural Networks,SIANN)”。 本发明运用天牛须算法来优化卷积神经网络。天牛须搜索(Beetle Antennae Search-BAS),也叫甲壳虫须搜索,是2017年提出的一种高效的智能优化算法, 具有运算量非常小,收敛非常快和具有全局寻优能力的优点。Convolutional Neural Networks (CNN) is a kind of Feedforward Neural Networks (Feedforward Neural Networks) that includes convolution computation and has a deep structure, and is one of the representative algorithms of deep learning. Convolutional neural network has the ability of representation learning and can classify input information according to its hierarchical structure, so it is also called "Shift-Invariant Artificial Neural Networks (SIANN)" . The present invention optimizes the convolutional neural network by using the beetle algorithm. Beetle Antennae Search (BAS), also known as Beetle muster search, is an efficient intelligent optimization algorithm proposed in 2017. It has the advantages of very small computational load, very fast convergence and global optimization ability.
综合ReLU、PReLU和Softplus几类激活函数的特性,本发明提出了一种新 的激活函数SPReLu,其数学形式为Synthesizing the characteristics of several types of activation functions of ReLU, PReLU and Softplus, the present invention proposes a new activation function SPReLu whose mathematical form is

其中,a为随机参数,根据模型实时训练发生变化,最终收敛为适宜的常 数。a取值可以为常数0.3、0.5、0.8。Among them, a is a random parameter, which changes according to the real-time training of the model, and finally converges to an appropriate constant. The value of a can be constant 0.3, 0.5, 0.8.
该函数具有以下特性,当x≥0时,保留了Re-Lu的线性特点,输出结果与 输入数据保持不变;当x<0时,将Softplus函数的曲线下移ln2个单位,取负 半轴曲线并乘上参数a。The function has the following characteristics. When x≥0, the linearity of Re-Lu is retained, and the output result remains unchanged from the input data; when x<0, the curve of the Softplus function is moved down by ln2 units, and the negative half is taken. axis curve and multiply by the parameter a.
SPReLU函数的图像如图2所示。其中,参数a有效地控制了函数的饱和范 围,它可以通过反向传播进行训练,并与其他层同时进行优化。某一层ai的梯 度为An image of the SPReLU function is shown in Figure 2. Among them, the parameter a effectively controls the saturation range of the function, which can be trained by backpropagation and optimized simultaneously with other layers. The gradient of a layer ai is

更新梯度时采用动量法:The momentum method is used when updating the gradient:

其中,μ为动量系数,α是学习率。where μ is the momentum coefficient and α is the learning rate.
对于CNN算法而言,学习率对于迭代速率、获得最优解有十分大的影响。 当设置的学习率较高时,网络迭代更新较快,能够从全局出发找到最优解,但 是存在不容易收敛的问题。当设置的学习率较低时,网络迭代更新速度较慢, 能够找到局部最优值,但是有时会让网络陷入局部最优而丧失得到全局最优值 的能力。所以,在进行网络的训练时,往往会将二者结合起来,首先使用高学 习率来获得全局近似最优解,再使用低学习率获得最终的最优值。For the CNN algorithm, the learning rate has a great influence on the iteration rate and obtaining the optimal solution. When the set learning rate is high, the network iterative update is faster, and the optimal solution can be found from the global perspective, but there is a problem that it is not easy to converge. When the set learning rate is low, the network iterative update speed is slow, and the local optimal value can be found, but sometimes the network falls into the local optimal value and loses the ability to obtain the global optimal value. Therefore, when training the network, the two are often combined. First, a high learning rate is used to obtain the global approximate optimal solution, and then a low learning rate is used to obtain the final optimal value.
在本发明的BAS-CNN中设置的初始学习率是0.01,之后每迭代10000次, 学习速率降低为原来的十分之一。但是根据经验选择的学习率可能不是最优值, 所以本文对学习率的设置重新规划。在迭代10000次之前,在区间(0.0001, 0.01)中使用优化算法寻找最优的高学习率,以加快迭代更新的速度,找到全局 近似最优解;之后再从(0.0001,0.01]中使用优化算法寻找最优的低学习率以获 得全局最优解,这样使得学习率的设置更为合理。因此本文采用BAS优化算法, 将CNN优化算法的学习率设置为搜索空间,寻找使得拟合效果最优的学习率参 数值,并将其代入模型训练过程中,以完成模型训练。The initial learning rate set in the BAS-CNN of the present invention is 0.01, and after each 10,000 iterations, the learning rate is reduced to one tenth of the original. However, the learning rate selected according to experience may not be the optimal value, so this paper re-plans the setting of the learning rate. Before iterating 10000 times, use the optimization algorithm to find the optimal high learning rate in the interval (0.0001, 0.01) to speed up the iterative update and find the global approximate optimal solution; then use the optimization from (0.0001, 0.01] The algorithm finds the optimal low learning rate to obtain the global optimal solution, which makes the setting of the learning rate more reasonable. Therefore, this paper adopts the BAS optimization algorithm, and sets the learning rate of the CNN optimization algorithm as the search space to find the best fitting effect. The optimal learning rate parameter value is substituted into the model training process to complete the model training.
在模型训练中基于BAS对CNN进行优化的具体步骤如图3所示:The specific steps of optimizing CNN based on BAS in model training are shown in Figure 3:
Step1:网络进行权值的初始化;Step1: The network initializes the weights;
Step2:输入数据经过卷积层、下采样层、全连接层的向前传播得到输出值;Step2: The input data is propagated forward through the convolutional layer, the downsampling layer, and the fully connected layer to obtain the output value;
Step3:求出网络的输出值与目标值之间的误差;Step3: Find the error between the output value of the network and the target value;
Step4:当误差大于期望值时,将误差传回网络中,依次求得全连接层,下 采样层,卷积层的误差。各层的误差可以理解为对于网络的总误差,网络应承 担多少;当误差等于或小于期望值时,结束训练。Step4: When the error is greater than the expected value, the error is transmitted back to the network, and the errors of the fully connected layer, the downsampling layer, and the convolutional layer are obtained in turn. The error of each layer can be understood as how much the network should bear for the total error of the network; when the error is equal to or less than the expected value, the training ends.
Step5:根据求得误差进行权值更新,优化学习率和激活函数,返回到Step2。Step5: Update the weights according to the obtained error, optimize the learning rate and activation function, and return to Step2.
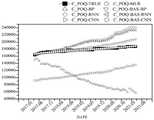
建立了RF-BAS-CNN模型后,为判断该统计分析决策模型构建的有效性。 本发明针对模型进行了实证分析。模型的输出结果为经过训练的累计生产订单 数量决策值,将其与实际生产订单数量进行对比分析。本发明选择了BPNN、 BAS-BPNN、RNN、BAS-RNN、CNN训练算法作为BAS-CNN算法的对比算法, 选择MSE(Mean Squared Error)、MAE(Mean AbsoluteError)、MAPE(Mean Absolute Percentage Error)、MSPE(Mean Square Pure Error)、RMSE(Root Mean Squared Error)以及SSE(Sum of Squares for Error)六个指标作为客观指标值对 预测结果进行误差分析,用来判断该统计分析决策模型构建的有效性。对比结 果如图4和图5及表1所示:After establishing the RF-BAS-CNN model, in order to judge the validity of the statistical analysis decision-making model. The present invention conducts an empirical analysis of the model. The output of the model is the decision value of the trained cumulative production order quantity, which is compared and analyzed with the actual production order quantity. The present invention selects BPNN, BAS-BPNN, RNN, BAS-RNN, CNN training algorithm as the comparison algorithm of BAS-CNN algorithm, selects MSE (Mean Squared Error), MAE (Mean Absolute Error), MAPE (Mean Absolute Percentage Error), The six indicators of MSPE (Mean Square Pure Error), RMSE (Root Mean Squared Error) and SSE (Sum of Squares for Error) are used as objective indicators to analyze the error of the prediction results, which are used to judge the validity of the statistical analysis decision-making model. . The comparison results are shown in Figure 4 and Figure 5 and Table 1:
表1C_POQ误差分析Table 1C_POQ Error Analysis

通过上面的比较可以看出,本发明所建立的模型的高拟合度和有效性。由 模型对比图和C_POQ预测结果的误差分析可以看出,通过RF-BAS-CNN模型 的构建,得到的实验结果明显优于其他结果。在六种误差指标下,BAS-CNN算 法的预测结果误差值都是最小的,该模型得到的预测曲线和实际值曲线相比拟 合效果也很好,而误差最大的为BP模型的预测结果,其次是多元线性回归预测 结果,然后是RNN预测结果,BAS-RNN预测结果,BAS-BP预测结果,CNN 预测结果。因此,本发明构建的模型在内部价值链和外部价值链之间的协同关系上具有较高的拟合性。It can be seen from the above comparison that the model established by the present invention has a high degree of fit and validity. From the model comparison chart and the error analysis of the C_POQ prediction results, it can be seen that the experimental results obtained by the construction of the RF-BAS-CNN model are significantly better than other results. Under the six error indicators, the prediction results of the BAS-CNN algorithm have the smallest error values, and the prediction curve obtained by this model has a good fitting effect compared with the actual value curve, and the prediction result of the BP model has the largest error. , followed by multiple linear regression prediction results, then RNN prediction results, BAS-RNN prediction results, BAS-BP prediction results, and CNN prediction results. Therefore, the model constructed by the present invention has a high fit in the synergistic relationship between the internal value chain and the external value chain.
本发明通过构建RF-BAS-CNN模型,有效对内部价值链的生产订单进行决 策分析,通过模型输出的决策值与实际值进行对比可以看出模型的高拟合度和 有效性,就MAPE这一误差指标来说,生产订单决策结果的误差为0.0058。因 此,本发明构建的模型在内部价值链和外部价值链之间的协同关系上具有较高 的拟合性,为未来制造企业考虑多价值链协同下,进行内部价值链的统计分析 决策提供了有效的分析模型,具有重要的意义。By constructing the RF-BAS-CNN model, the present invention effectively conducts decision analysis on the production orders of the internal value chain, and the high fitting degree and effectiveness of the model can be seen by comparing the decision value output by the model with the actual value. For an error indicator, the error of the decision result of the production order is 0.0058. Therefore, the model constructed by the present invention has a high fit in the synergistic relationship between the internal value chain and the external value chain, and provides a statistical analysis and decision-making method for the internal value chain for the future manufacturing enterprises considering the coordination of multiple value chains. An effective analytical model is of great significance.
综上,本发明具有如下的创新:To sum up, the present invention has the following innovations:
首次提出基于数据空间的制造业多价值链协同概念,为制造业内部各价值 链之间的管理经营提供新思路。前人的研究多基于单一价值链,并未考虑多价 值链协同的概念,而本发明系统性地提出了多价值链协同的概念,研究了价值 链之间的协同关系,形成了一套理论基础。For the first time, the concept of multi-value chain collaboration in manufacturing based on data space is proposed, which provides new ideas for the management and operation of various value chains within the manufacturing industry. The previous studies were mostly based on a single value chain and did not consider the concept of multi-value chain collaboration, but the present invention systematically proposed the concept of multi-value chain collaboration, studied the collaborative relationship between value chains, and formed a set of theories Base.
本发明基于深度学习智能计算构建了基于数据空间多价值链协同体系架构 的统计分析决策模型。将生产、供应、营销及服务等环节之间的相互关系考虑 在内,形成相互联动、相互协同、数据共享、安全管理的统计分析决策模型。 在前人的研究中,将智能算法应用于价值链分析中的实例并不多,在统计分析 决策的研究中也很少从多价值链角度进行分析,对于多价值链影响因素的选取 方法更多地聚焦于因子分析和成分分析等,较少使用智能算法进行客观分析; 在多价值链协同的研究方法中也多使用回归分析的方法,较少使用深度学习算 法。而本发明基于此,将智能算法RF、BAS、CNN三种算法组合构建出了一个基于数据空间多价值链协同体系架构的统计分析决策模型。其中RF用于多价值 链的影响因素的筛选与排序,BAS-CNN模型用于统计分析决策。The present invention constructs a statistical analysis decision model based on a data space multi-value chain collaborative architecture based on deep learning intelligent computing. Taking the interrelationships among production, supply, marketing and service into consideration, a statistical analysis and decision-making model of mutual linkage, mutual coordination, data sharing and safety management is formed. In previous studies, there are not many examples of applying intelligent algorithms to value chain analysis, and in the research of statistical analysis and decision-making, the analysis is seldom carried out from the perspective of multi-value chains. Focus on factor analysis and component analysis, etc., and use intelligent algorithms for objective analysis less; in the research methods of multi-value chain collaboration, regression analysis methods are also used, and deep learning algorithms are rarely used. Based on this, the present invention combines the intelligent algorithms RF, BAS, and CNN to construct a statistical analysis decision model based on a data space multi-value chain collaborative architecture. Among them, RF is used for screening and sorting of influencing factors of multiple value chains, and BAS-CNN model is used for statistical analysis and decision-making.
本发明首次提出代表价值链不同环节的综合影响因素指标,用来表示多价 值链不同环节的实际变动情况。从宏观上为制造业分析不同价值链实际情况提 供了参考。前人的研究中对于制造业多价值链之间的协同关系,还没有形成完 整的研究体系,对于制造业多价值链协同架构的构建基本为空白。本发明总结 了电力企业生产、供应、营销及服务各价值链之间的相互关系和外部价值链对 内部价值链的影响,针对性地提出影响因素,并对影响因素进行排序筛选,建 立了三种综合影响因素指标,用来反映不同环节价值链的变动情况,为未来制 造业的相关决策和评价奠定基础。The present invention proposes for the first time comprehensive influencing factor indicators representing different links of the value chain, which are used to represent the actual changes in different links of the multi-value chain. From a macro perspective, it provides a reference for the manufacturing industry to analyze the actual situation of different value chains. In previous researches, a complete research system has not been formed on the synergistic relationship between multiple value chains in the manufacturing industry, and the construction of the synergistic structure of multiple value chains in the manufacturing industry is basically blank. The invention summarizes the relationship between the value chains of production, supply, marketing and service of electric power enterprises and the influence of the external value chain on the internal value chain, proposes the influencing factors pertinently, sorts and filters the influencing factors, and establishes It is a comprehensive influencing factor index, which is used to reflect the changes in different links of the value chain and lay a foundation for the relevant decision-making and evaluation of the future manufacturing industry.
此实施例仅为本发明较佳的具体实施方式,但本发明的保护范围并不局限 于此,任何熟悉本技术领域的技术人员在本发明揭露的技术范围内,可轻易想 到的变化或替换,都应涵盖在本发明的保护范围之内。因此,本发明的保护范 围应该以权利要求的保护范围为准。This embodiment is only a preferred embodiment of the present invention, but the protection scope of the present invention is not limited to this. Any person skilled in the art can easily think of changes or substitutions within the technical scope disclosed by the present invention. , all should be covered within the protection scope of the present invention. Therefore, the protection scope of the present invention should be subject to the protection scope of the claims.
Claims (7)


Priority Applications (1)
| Application Number | Priority Date | Filing Date | Title |
|---|---|---|---|
| CN202210359177.5ACN114912074A (en) | 2022-04-07 | 2022-04-07 | Statistical analysis of manufacturing production intelligent calculation method based on data space and multi-value chain |
Applications Claiming Priority (1)
| Application Number | Priority Date | Filing Date | Title |
|---|---|---|---|
| CN202210359177.5ACN114912074A (en) | 2022-04-07 | 2022-04-07 | Statistical analysis of manufacturing production intelligent calculation method based on data space and multi-value chain |
Publications (1)
| Publication Number | Publication Date |
|---|---|
| CN114912074Atrue CN114912074A (en) | 2022-08-16 |
Family
ID=82763546
Family Applications (1)
| Application Number | Title | Priority Date | Filing Date |
|---|---|---|---|
| CN202210359177.5APendingCN114912074A (en) | 2022-04-07 | 2022-04-07 | Statistical analysis of manufacturing production intelligent calculation method based on data space and multi-value chain |
Country Status (1)
| Country | Link |
|---|---|
| CN (1) | CN114912074A (en) |
Cited By (1)
| Publication number | Priority date | Publication date | Assignee | Title |
|---|---|---|---|---|
| CN116366343A (en)* | 2023-03-31 | 2023-06-30 | 中国工商银行股份有限公司 | Blockchain-based data verification method and device |
Citations (4)
| Publication number | Priority date | Publication date | Assignee | Title |
|---|---|---|---|---|
| US20070230770A1 (en)* | 2005-11-18 | 2007-10-04 | Ashok Kulkarni | Methods and systems for determining a position of inspection data in design data space |
| CN109673034A (en)* | 2018-12-28 | 2019-04-23 | 中国科学院上海微系统与信息技术研究所 | A kind of wireless sensor network cluster routing method that must be searched for based on longicorn |
| CN110378799A (en)* | 2019-07-16 | 2019-10-25 | 东北大学 | Aluminium oxide comprehensive production index decision-making technique based on multiple dimensioned depth convolutional network |
| CN114138766A (en)* | 2021-12-07 | 2022-03-04 | 华北电力大学 | Multi-value chain data system analysis architecture and integration cooperation method under data space |
- 2022
- 2022-04-07CNCN202210359177.5Apatent/CN114912074A/enactivePending
Patent Citations (4)
| Publication number | Priority date | Publication date | Assignee | Title |
|---|---|---|---|---|
| US20070230770A1 (en)* | 2005-11-18 | 2007-10-04 | Ashok Kulkarni | Methods and systems for determining a position of inspection data in design data space |
| CN109673034A (en)* | 2018-12-28 | 2019-04-23 | 中国科学院上海微系统与信息技术研究所 | A kind of wireless sensor network cluster routing method that must be searched for based on longicorn |
| CN110378799A (en)* | 2019-07-16 | 2019-10-25 | 东北大学 | Aluminium oxide comprehensive production index decision-making technique based on multiple dimensioned depth convolutional network |
| CN114138766A (en)* | 2021-12-07 | 2022-03-04 | 华北电力大学 | Multi-value chain data system analysis architecture and integration cooperation method under data space |
Non-Patent Citations (3)
| Title |
|---|
| WENBO LI等: "Research on the network structure and organizational model of multi-value chain based on third-party platform", 《 2021 2ND INTERNATIONAL CONFERENCE ON E-COMMERCE AND INTERNET TECHNOLOGY (ECIT)》, 21 April 2021 (2021-04-21), pages 1 - 8* |
| 吴庚奇等: "多价值链视角下基于深度学习算法的制造企业产品需求预测", 《 科学技术与工程 》, vol. 21, no. 31, 8 November 2021 (2021-11-08), pages 13413 - 13420* |
| 李明钰等: "考虑多价值链协同的电力设备制造企业经营风险预测研究", 《工程管理科技前沿》, vol. 41, no. 3, 27 May 2022 (2022-05-27), pages 53 - 60* |
Cited By (1)
| Publication number | Priority date | Publication date | Assignee | Title |
|---|---|---|---|---|
| CN116366343A (en)* | 2023-03-31 | 2023-06-30 | 中国工商银行股份有限公司 | Blockchain-based data verification method and device |
Similar Documents
| Publication | Publication Date | Title |
|---|---|---|
| Li et al. | Risk prediction in financial management of listed companies based on optimized BP neural network under digital economy | |
| CN109685240A (en) | A kind of prediction of 95598 traffic work orders and unusual fluctuation method for early warning based on LSTM deep learning | |
| CN107481048A (en) | A kind of financial kind price expectation method and system based on mixed model | |
| CN113822499B (en) | Train spare part loss prediction method based on model fusion | |
| Lv et al. | An improved long short-term memory neural network for stock forecast | |
| Saraeian et al. | Optimal autonomous architecture for uncertain processes management | |
| CN113919944A (en) | Stock trading method and system based on reinforcement learning algorithm and time series model | |
| Karim et al. | A deep learning-based approach for stock price prediction using bidirectional gated recurrent unit and bidirectional long short term memory model | |
| CN115034473A (en) | A kind of electricity price prediction method, system and device | |
| CN109993354A (en) | A method for forecasting energy consumption | |
| Bao | Advancing Corporate Financial Forecasting: The Role of LSTM and AI in Modern Accounting | |
| CN114912074A (en) | Statistical analysis of manufacturing production intelligent calculation method based on data space and multi-value chain | |
| CN119313467A (en) | Stock prediction method based on temporal convolutional network fusion channel attention mechanism | |
| Dinda | Gated recurrent neural network with TPE Bayesian optimization for enhancing stock index prediction accuracy | |
| Kasianenko et al. | Investment potential forecast and strategies for its expansion: case of Ukraine | |
| NAPITUPULU | Artificial neural network application in gross domestic product forecasting an Indonesia case | |
| Duan et al. | Application of machine learning in quantitative timing model based on factor stock selection. | |
| CN114511137A (en) | Short-term power prediction method based on cross-correlation entropy-gated recurrent unit | |
| Kokkinos et al. | Efficiency in energy decision support systems using soft computing techniques | |
| " De Virgilis" et al. | Estimation of Individual Claim Liabilities | |
| Du et al. | Research on Revenue Forecasting Model of Automobile Manufacturing Enterprises Combining Public Opinion Data and Financial Data: A Case Study of Chinese Automobile Manufacturing Enterprises | |
| KR102680144B1 (en) | Method, device and storage media that records program optimizing loan approval policy | |
| Benincasa | An LSTM-based model to Trading Energy Stocks | |
| Hu | Intelligent Financial Decision Support System Using Artificial Intelligence | |
| Napitupulu | Artificial neural network application in gross domestic product forecasting: an Indonesia case |
Legal Events
| Date | Code | Title | Description |
|---|---|---|---|
| PB01 | Publication | ||
| PB01 | Publication | ||
| SE01 | Entry into force of request for substantive examination | ||
| SE01 | Entry into force of request for substantive examination |