CN114861722B - Partial discharge narrow-band interference suppression method based on time-frequency spectrogram separation - Google Patents
Partial discharge narrow-band interference suppression method based on time-frequency spectrogram separationDownload PDFInfo
- Publication number
- CN114861722B CN114861722BCN202210472721.7ACN202210472721ACN114861722BCN 114861722 BCN114861722 BCN 114861722BCN 202210472721 ACN202210472721 ACN 202210472721ACN 114861722 BCN114861722 BCN 114861722B
- Authority
- CN
- China
- Prior art keywords
- signal
- time
- frequency
- noise
- matrix
- Prior art date
- Legal status (The legal status is an assumption and is not a legal conclusion. Google has not performed a legal analysis and makes no representation as to the accuracy of the status listed.)
- Active
Links
Images


Classifications
- G—PHYSICS
- G06—COMPUTING OR CALCULATING; COUNTING
- G06F—ELECTRIC DIGITAL DATA PROCESSING
- G06F2218/00—Aspects of pattern recognition specially adapted for signal processing
- G06F2218/02—Preprocessing
- G06F2218/04—Denoising
- G—PHYSICS
- G01—MEASURING; TESTING
- G01R—MEASURING ELECTRIC VARIABLES; MEASURING MAGNETIC VARIABLES
- G01R31/00—Arrangements for testing electric properties; Arrangements for locating electric faults; Arrangements for electrical testing characterised by what is being tested not provided for elsewhere
- G01R31/12—Testing dielectric strength or breakdown voltage ; Testing or monitoring effectiveness or level of insulation, e.g. of a cable or of an apparatus, for example using partial discharge measurements; Electrostatic testing
- G01R31/1227—Testing dielectric strength or breakdown voltage ; Testing or monitoring effectiveness or level of insulation, e.g. of a cable or of an apparatus, for example using partial discharge measurements; Electrostatic testing of components, parts or materials
- G—PHYSICS
- G06—COMPUTING OR CALCULATING; COUNTING
- G06F—ELECTRIC DIGITAL DATA PROCESSING
- G06F2218/00—Aspects of pattern recognition specially adapted for signal processing
- G06F2218/02—Preprocessing
- G06F2218/04—Denoising
- G06F2218/06—Denoising by applying a scale-space analysis, e.g. using wavelet analysis
- G—PHYSICS
- G06—COMPUTING OR CALCULATING; COUNTING
- G06F—ELECTRIC DIGITAL DATA PROCESSING
- G06F2218/00—Aspects of pattern recognition specially adapted for signal processing
- G06F2218/08—Feature extraction
- G06F2218/10—Feature extraction by analysing the shape of a waveform, e.g. extracting parameters relating to peaks
- G—PHYSICS
- G06—COMPUTING OR CALCULATING; COUNTING
- G06F—ELECTRIC DIGITAL DATA PROCESSING
- G06F2218/00—Aspects of pattern recognition specially adapted for signal processing
- G06F2218/12—Classification; Matching
- Y—GENERAL TAGGING OF NEW TECHNOLOGICAL DEVELOPMENTS; GENERAL TAGGING OF CROSS-SECTIONAL TECHNOLOGIES SPANNING OVER SEVERAL SECTIONS OF THE IPC; TECHNICAL SUBJECTS COVERED BY FORMER USPC CROSS-REFERENCE ART COLLECTIONS [XRACs] AND DIGESTS
- Y04—INFORMATION OR COMMUNICATION TECHNOLOGIES HAVING AN IMPACT ON OTHER TECHNOLOGY AREAS
- Y04S—SYSTEMS INTEGRATING TECHNOLOGIES RELATED TO POWER NETWORK OPERATION, COMMUNICATION OR INFORMATION TECHNOLOGIES FOR IMPROVING THE ELECTRICAL POWER GENERATION, TRANSMISSION, DISTRIBUTION, MANAGEMENT OR USAGE, i.e. SMART GRIDS
- Y04S10/00—Systems supporting electrical power generation, transmission or distribution
- Y04S10/50—Systems or methods supporting the power network operation or management, involving a certain degree of interaction with the load-side end user applications
- Y04S10/52—Outage or fault management, e.g. fault detection or location
Landscapes
- Engineering & Computer Science (AREA)
- Physics & Mathematics (AREA)
- General Physics & Mathematics (AREA)
- Theoretical Computer Science (AREA)
- Artificial Intelligence (AREA)
- Computer Vision & Pattern Recognition (AREA)
- Signal Processing (AREA)
- General Engineering & Computer Science (AREA)
- Measurement Of Mechanical Vibrations Or Ultrasonic Waves (AREA)
Abstract
Description
Translated fromChinese技术领域Technical Field
本发明涉及高压电力设备绝缘状态诊断技术,具体是基于时频谱图分离的局部放电窄带干扰抑制方法。The invention relates to a high-voltage power equipment insulation state diagnosis technology, in particular to a local discharge narrowband interference suppression method based on time-frequency spectrum separation.
背景技术Background Art
高压电力设备的绝缘状态可通过监测局部放电(Partial Discharge,PD)信号进行诊断,通常现场采集的PD信号会受到电磁干扰影响,导致难以直接开展PD信号的分析及特征提取。PD信号面临的电磁干扰主要为脉冲型干扰、白噪声干扰及周期性窄带干扰,其中,周期性窄带干扰拥有持续时间长、能量强和随机性大的显著特点,导致PD信号容易被周期性窄带干扰完全淹没。因此,为了利用PD信号对高压电力设备的绝缘状态诊断时提升精确性,对周期性窄带干扰的抑制尤其重要。The insulation status of high-voltage power equipment can be diagnosed by monitoring partial discharge (PD) signals. Usually, the PD signals collected on site are affected by electromagnetic interference, which makes it difficult to directly analyze and extract features of PD signals. The electromagnetic interference faced by PD signals is mainly pulse interference, white noise interference and periodic narrowband interference. Among them, periodic narrowband interference has the significant characteristics of long duration, strong energy and high randomness, which makes PD signals easily completely submerged by periodic narrowband interference. Therefore, in order to improve the accuracy of diagnosing the insulation status of high-voltage power equipment using PD signals, it is particularly important to suppress periodic narrowband interference.
目前,国内外学者对PD信号中周期性窄带干扰的抑制技术开展了大量研究。樊高辉、刘尚合、刘卫东及王雷于2017年04月06日在《高电压技术》发表的名称为“FFT谱最小熵解卷积滤波抑制放电信号中的周期性窄带干扰”的文献,其在快速傅里叶变换(fastFourier transform,FFT)算法的基础上,引入了解卷积滤波法和经典阈值法用于提取窄带干扰的频点,然后将窄带干扰对应频点的FFT系数进行压缩,达到削弱窄带干扰能量的目的。虽然该方法可以有效削弱窄带干扰的频域能量,但是由于FFT算法存在频谱泄露等缺陷和阈值法存在阈值选取困难的问题,所以该方法最终的降噪效果不够理想。马星河和张登奎于2021年08月17日在《电工技术学报》发表的名称为“基于改进经验小波变换的高压电缆局部放电噪声抑制研究”的文献,其借助小波分解算法的优异时频分析能力,能一定程度上削弱窄带干扰的能量,但是该类方法难以选择适宜的小波基函数、小波分解层数和小波分解阈值。魏海增、马宏忠、黄涛及黄烜城于2019年05朋15日在《电力系统及其自动化学报》发表的名称为“基于EMD的ICA降噪方法在电厂开关柜局部放电信号中的应用”的文献,其使用经验模态分解算法对PD信号中窄带干扰进行分离,但是该方法的稳定性较差,容易出现端点效应、模态混叠等问题。徐永干、姜杰、唐昆明、张太勤、罗建及谢敏于2019年09月17日在《电网技术》发表的名称为“基于Hankel矩阵和奇异值分解的局部放电窄带干扰抑制方法”的文献,毕潇文、钟俊、张大堃、周电波及阮莹于2021年03月25日在《电网技术》发表的名称为“基于改进奇异值与经验小波分解的局放去噪算法”的文献,以及杨晓丽、黄宏光、舒勤、张大堃及周电波于2020年11月25日在《高电压技术》发表的名称为“基于SVD和低秩RBF神经网络的局部放电信号提取方法”的文献,这三篇文献均提出了自适应奇异值分解法抑制染噪PD信号中窄带干扰,但是该方法存在奇异值阈值选取困难的问题,难以有效抑制小幅值的窄带干扰。宋立业、蒲霄祥及李希桐于2021年11月23日在《电工电能新技术》发表的名称为“基于广义S变换和随机子空间的局放窄带干扰抑制方法”的文献,其利用广义S变换算法得到染噪PD信号的时频谱图,然后直接在该时频谱图中确定窄带干扰和PD信号对应的时频区域子矩阵,以提取窄带干扰的特征参数,实现窄带干扰抑制,但是在窄带干扰强能量特点的影响下,PD信号的时频特征可能会被窄带干扰所掩盖,导致该类方法的可靠性下降。At present, domestic and foreign scholars have conducted a lot of research on the suppression technology of periodic narrowband interference in PD signals. On April 6, 2017, Fan Gaohui, Liu Shanghe, Liu Weidong and Wang Lei published a paper titled "FFT spectrum minimum entropy deconvolution filter to suppress periodic narrowband interference in discharge signals" in "High Voltage Technology". Based on the fast Fourier transform (FFT) algorithm, the deconvolution filter method and the classical threshold method were introduced to extract the frequency points of narrowband interference, and then the FFT coefficients of the corresponding frequency points of narrowband interference were compressed to achieve the purpose of weakening the energy of narrowband interference. Although this method can effectively weaken the frequency domain energy of narrowband interference, due to the defects of the FFT algorithm such as spectrum leakage and the difficulty of threshold selection in the threshold method, the final noise reduction effect of this method is not ideal. On August 17, 2021, Ma Xinghe and Zhang Dengkui published a paper titled "Research on Suppression of Partial Discharge Noise of High-voltage Cables Based on Improved Empirical Wavelet Transform" in the Journal of China Electrotechnical Society. With the help of the excellent time-frequency analysis ability of the wavelet decomposition algorithm, it can weaken the energy of narrowband interference to a certain extent, but this type of method is difficult to select appropriate wavelet basis functions, wavelet decomposition layers and wavelet decomposition thresholds. On May 15, 2019, Wei Haizeng, Ma Hongzhong, Huang Tao and Huang Xuancheng published a paper titled "Application of EMD-based ICA Noise Reduction Method in Partial Discharge Signals of Power Plant Switchgear" in the Journal of Electric Power System and Automation. It uses the empirical mode decomposition algorithm to separate narrowband interference in PD signals, but this method has poor stability and is prone to problems such as endpoint effects and modal aliasing. The paper entitled "Partial discharge narrowband interference suppression method based on Hankel matrix and singular value decomposition" published by Xu Yonggan, Jiang Jie, Tang Kunming, Zhang Taiqin, Luo Jian and Xie Min in "Power System Technology" on September 17, 2019, the paper entitled "Partial discharge denoising algorithm based on improved singular value and empirical wavelet decomposition" published by Bi Xiaowen, Zhong Jun, Zhang Dakun, Zhou Dianbo and Ruan Ying in "Power System Technology" on March 25, 2021, and the paper entitled "Partial discharge signal extraction method based on SVD and low-rank RBF neural network" published by Yang Xiaoli, Huang Hongguang, Shu Qin, Zhang Dakun and Zhou Dianbo in "High Voltage Technology" on November 25, 2020. All three papers proposed the adaptive singular value decomposition method to suppress narrowband interference in noisy PD signals, but this method has the problem of difficulty in selecting the singular value threshold, and it is difficult to effectively suppress small-amplitude narrowband interference. Song Liye, Pu Xiaoxiang and Li Xitong published a document entitled "Partial discharge narrowband interference suppression method based on generalized S transform and random subspace" in "New Technology of Electrical Engineering and Energy" on November 23, 2021. The document uses the generalized S transform algorithm to obtain the time-frequency spectrum of the noisy PD signal, and then directly determines the time-frequency region sub-matrix corresponding to the narrowband interference and the PD signal in the time-frequency spectrum to extract the characteristic parameters of the narrowband interference and realize narrowband interference suppression. However, under the influence of the strong energy characteristics of narrowband interference, the time-frequency characteristics of the PD signal may be masked by the narrowband interference, resulting in a decrease in the reliability of this type of method.
发明内容Summary of the invention
本发明的目的在于解决现有技术抑制染噪PD信号中窄带干扰的不足,提供了一种基于时频谱图分离的局部放电窄带干扰抑制方法,其能分离出染噪PD信号时频谱图中窄带干扰和PD信号,提升窄带干扰影响下PD信号时频分析的准确率,从而有效抑制染噪PD信号中窄带干扰。The purpose of the present invention is to solve the shortcomings of the prior art in suppressing narrowband interference in noisy PD signals, and provide a method for suppressing local discharge narrowband interference based on time-frequency spectrum separation, which can separate the narrowband interference and PD signal in the time-frequency spectrum of the noisy PD signal, improve the accuracy of time-frequency analysis of the PD signal under the influence of narrowband interference, thereby effectively suppressing narrowband interference in the noisy PD signal.
本发明的目的主要通过以下技术方案实现:The purpose of the present invention is mainly achieved through the following technical solutions:
基于时频谱图分离的局部放电窄带干扰抑制方法,包括:The local discharge narrowband interference suppression method based on time-frequency spectrum separation includes:
S1、采样获取染噪PD信号;S1, sampling to obtain the noisy PD signal;
S2、采用广义S变换对染噪PD信号的离散信号进行时频变换处理,得到二维时频复数矩阵,其中,二维时频复数矩阵中横轴为时间采样点,纵轴为频率采样点;S2, using generalized S transform to perform time-frequency transform on the discrete signal of the noisy PD signal to obtain a two-dimensional time-frequency complex matrix, where the horizontal axis of the two-dimensional time-frequency complex matrix is the time sampling point and the vertical axis is the frequency sampling point;
S3、对二维时频复数矩阵求模得到关于染噪PD信号的时频谱图;S3, obtaining a time-frequency spectrum diagram of the noisy PD signal by modulo the two-dimensional time-frequency complex matrix;
S4、采用数学形态学获取染噪PD信号时频谱图中各行分量的平滑分量和非平滑分量,将分离出的平滑分量和非平滑分量作为行分量构成新的矩阵,分离出窄带干扰和原始PD信号的时频谱图,以确定窄带干扰的数目与PD脉冲的时间区域;S4, using mathematical morphology to obtain the smooth components and non-smooth components of each row component in the time-frequency spectrum of the noisy PD signal, using the separated smooth components and non-smooth components as row components to form a new matrix, separating the time-frequency spectrum of the narrow-band interference and the original PD signal to determine the number of narrow-band interference and the time region of the PD pulse;
S5、将采样得到的染噪PD信号根据时间轴划定为含有PD信号的信号帧和仅含噪声的噪声帧,采用总体最小二乘不变旋转矢量技术分析噪声帧内时域数据,以提取窄带干扰的时域特征量;S5, dividing the sampled noisy PD signal into a signal frame containing the PD signal and a noise frame containing only noise according to the time axis, and using the total least squares invariant rotation vector technology to analyze the time domain data in the noise frame to extract the time domain feature quantity of the narrowband interference;
S6、重构出窄带干扰的时域波形,从染噪PD信号的时域波形中去除窄带干扰的时域波形,得到降噪后PD信号。S6. Reconstruct the time domain waveform of the narrowband interference, remove the time domain waveform of the narrowband interference from the time domain waveform of the noisy PD signal, and obtain a denoised PD signal.
本发明针对高压电力设备局部放电信号受周期性窄带干扰影响大的问题,提出了一种基于时频谱图分离的局部放电窄带干扰抑制方法,其结合广义S变换和数学形态学,从染噪PD信号中分离出原始PD信号和窄带干扰信号的时频谱图,从而在时频域内准确辨识出窄带干扰和原始PD信号,避免强能量的窄带干扰掩盖原始PD信号时频特征的问题,提升窄带干扰影响下PD信号时频分析的准确率。本发明再利用总体最小二乘不变旋转矢量技术准确估计窄带干扰的特征参数,以抑制染噪PD信号中窄带干扰。Aiming at the problem that the local discharge signal of high-voltage power equipment is greatly affected by periodic narrowband interference, the present invention proposes a local discharge narrowband interference suppression method based on time-frequency spectrum separation, which combines generalized S transform and mathematical morphology to separate the time-frequency spectrum of the original PD signal and the narrowband interference signal from the noisy PD signal, thereby accurately identifying the narrowband interference and the original PD signal in the time-frequency domain, avoiding the problem that the strong energy narrowband interference masks the time-frequency characteristics of the original PD signal, and improving the accuracy of the time-frequency analysis of the PD signal under the influence of narrowband interference. The present invention then uses the total least squares invariant rotation vector technology to accurately estimate the characteristic parameters of the narrowband interference to suppress the narrowband interference in the noisy PD signal.
进一步的,所述步骤S2中采用广义S变换对染噪PD信号的离散信号进行时频变换处理包括以下步骤:Furthermore, the step S2 of using the generalized S transform to perform time-frequency transform processing on the discrete signal of the noisy PD signal includes the following steps:
染噪PD信号x(t)的广义S变换结果G(τ,f,λ)被定义为The generalized S-transform result G(τ,f,λ) of the noisy PD signal x(t) is defined as

式中,t和τ为两组时间变量;f是频率;λ是调节因子;w(t-τ,f,λ)是高斯窗函数,对应的表达式为:Where t and τ are two sets of time variables; f is the frequency; λ is the adjustment factor; w(t-τ,f,λ) is the Gaussian window function, and the corresponding expression is:

令x(n)为染噪PD信号x的离散信号,同时定义f=n/(NT)、τ=iT,其中T是采样周期,N是x(n)的数据总量,得到x(n)的广义S变换结果为:Let x(n) be the discrete signal of the noisy PD signal x, and define f = n/(NT), τ = iT, where T is the sampling period and N is the total amount of data of x(n). The generalized S transform result of x(n) is:

式中,i、m、n是x(n)的广义S变换结果中三组变量,被定义为0,1,…,N-1;Where i, m, and n are three groups of variables in the generalized S-transformation result of x(n), which are defined as 0, 1, ..., N-1;
利用x(n)的广义S变换结果对x(n)开展时频变换处理后得到二维的时频复数矩阵。The generalized S-transform result of x(n) is used to perform time-frequency transform on x(n) to obtain a two-dimensional time-frequency complex matrix.
进一步的,所述步骤S4中采用数学形态学获取染噪PD信号时频谱图中各行分量的平滑分量和非平滑分量包括以下步骤:Furthermore, the step S4 of using mathematical morphology to obtain the smoothed components and non-smoothed components of each row component in the frequency spectrum of the noisy PD signal includes the following steps:
所述染噪PD信号时频谱图中各行分量Gt(nGt)的膨胀变换结果公式为:The expansion transformation result formula of each row componentGt (nGt ) in the time spectrum of the noisy PD signal is:

腐蚀变换结果公式为:The corrosion transformation result formula is:

式中,g(ig)是结构元素;⊕是膨胀运算符;⊙是腐蚀运算符;DGt是Gt(nGt)的定义域;Dg是g(ig)的定义域,nGt是数组Gt中某个索引,ig是数组g中某个索引;Where g(ig ) is the structural element; ⊕ is the dilation operator; ⊙ is the erosion operator; DGt is the domain ofGt (nGt ); Dg is the domain of g(ig ), nGt is an index in the arrayGt , and ig is an index in the array g;
通过膨胀变换结果公式和腐蚀变换结果公式的级联组合,得到数学形态学中开运算和闭运算分别为:Through the cascade combination of the dilation transformation result formula and the erosion transformation result formula, the opening operation and closing operation in mathematical morphology are obtained as follows:

(Gt·g)(nGt)=((Gt⊕g)⊙g)(nGt)(Gt ·g)(nGt )=((Gt ⊕g)⊙g)(nGt )
式中,
将开、闭运算进行级联组合,分别得到形态开-闭滤波器运行结果[Foc(Gt)](nGt)和形态闭-开滤波器运行结果[Fco(Gt)](nGt)为:The open and close operations are cascaded to obtain the morphological open-closed filter operation results [Foc (Gt )](nGt ) and the morphological closed-open filter operation results [Fco (Gt )](nGt ) respectively:


采用形态开-闭滤波器和形态闭-开滤波器的混合运算,得到信号Gt(nGt)中的平滑分量[F1(Gt)](nGt)和非平滑分量[F2(Gt)](nGt)分别为:By using the hybridoperation of morphological open-closed filter and morphological closed-open filter, the smooth component [F1 (Gt )](nGt ) and the non-smooth component [F2 (Gt )](nGt ) in the signal G t (nGt ) are obtained as follows:
[F1(Gt)](nGt)=([Foc(Gt)](nGt)+[Fco(Gt)](nGt))/2[F1 (Gt )](nGt )=([Foc (Gt )](nGt )+[Fco (Gt )](nGt ))/2
[F2(Gt)](nGt)=Gt(nGt)-[F1(Gt)](nGt)。[F2 (Gt )](nGt )=Gt (nGt )-[F1 (Gt )](nGt ).
进一步的,所述步骤S5中采用总体最小二乘不变旋转矢量技术分析噪声帧内时域数据包括以下步骤:Furthermore, the step S5 of using the total least squares invariant rotation vector technique to analyze the time domain data in the noise frame includes the following steps:
S51、将噪声帧内时域数据信号y(ny)构成Hankle矩阵H为:S51, constructing the Hankle matrix H of the time domain data signal y(ny ) in the noise frame as follows:

式中,Ny是信号y(ny)的数据长度,L是H的列数;Where Ny is the data length of signal y (ny ), and L is the number of columns of H;
S52、将H开展奇异值分解,得到S52, perform singular value decomposition on H and obtain
H=UΣVTH=UΣVT
式中,T是取矩阵的共轭转置;U和V分别是左、右正交矩阵;Σ是对角矩阵,其中的对角元素是矩阵H的奇异值;WhereT is the conjugate transpose of the matrix; U and V are left and right orthogonal matrices respectively; Σ is a diagonal matrix, where the diagonal elements are the singular values of the matrix H;
S53、分离出矩阵U中第1行到第L行,第1列到第P列的子矩阵为矩阵U1;同时分离出矩阵U中第2行到第L+1行,第1列到第P列的子矩阵为U2,以此得到U1和U2分别为:S53, separate the submatrix from the 1st row to the Lth row and the 1st column to the Pth column in the matrix U as the matrix U1 ; at the same time separate the submatrix from the 2nd row to the L+1th row and the 1st column to the Pth column in the matrix U as U2 , thereby obtaining U1 and U2 respectively:
U1=U[1:L,1:P]U1 =U[1:L,1:P]
U2=U[2:L+1,1:P]U2 =U[2:L+1,1:P]
式中,P是分离后时频图谱确定的窄带干扰个数的2倍;Where P is twice the number of narrowband interferences determined by the time-frequency spectrum after separation;
S54、构建矩阵Z=[U1 U2],然后对Z开展奇异值分解,得到S54, construct the matrix Z = [U1 U2 ], and then perform singular value decomposition on Z to obtain


式中:


S55、利用V12和V22构建矩阵ψ为S55, using V12 and V22 to construct the matrix ψ
ψ=-V12V22-1ψ=-V12 V22-1
S56、对ψ开展特征值分解,得到对应的特征值为μk(k=1,2,…,P),从而估计得到各窄带干扰分量的频率

式中,arg(*)是计算复数的相角;Where arg(*) is the phase angle of the complex number to be calculated;
S57、利用最小二乘法计算各窄带干扰分量的幅值

Y=μcY=μc
Y=[y(0),y(1),…,y(Ny-1)]TY=[y(0),y(1),…,y(Ny -1)]T


式中,c是中间变量矩阵,ck是c中元素。Where c is the intermediate variable matrix andck is the element in c.
进一步的,所述信号帧内窄带干扰相位


式中,ΔT是信号帧和噪声帧的时延。Where ΔT is the delay between the signal frame and the noise frame.
综上所述,本发明与现有技术相比具有以下有益效果:本发明能有效分离出染噪PD信号时频谱图中窄带干扰和PD信号,具备良好的窄带干扰抑制效果,能有效恢复局部放电信号的波形特征,进而能提升窄带干扰影响下PD信号时频分析的准确率。In summary, compared with the prior art, the present invention has the following beneficial effects: the present invention can effectively separate the narrowband interference and PD signal in the time-frequency spectrum of the noisy PD signal, has a good narrowband interference suppression effect, can effectively restore the waveform characteristics of the partial discharge signal, and thus can improve the accuracy of the time-frequency analysis of the PD signal under the influence of narrowband interference.
附图说明BRIEF DESCRIPTION OF THE DRAWINGS
此处所说明的附图用来提供对本发明实施例的进一步理解,构成本申请的一部分,并不构成对本发明实施例的限定。在附图中:The drawings described herein are used to provide a further understanding of the embodiments of the present invention, constitute a part of this application, and do not constitute a limitation of the embodiments of the present invention. In the drawings:
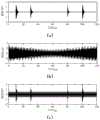
图1为PD信号的仿真波形图;FIG1 is a simulation waveform diagram of a PD signal;
图2为仿真PD波形的时频谱图;FIG2 is a time-frequency spectrum diagram of a simulated PD waveform;
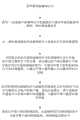
图3为染噪PD信号时频谱图中频率能量和时间的关系图;FIG3 is a graph showing the relationship between frequency energy and time in a spectrum of a noisy PD signal;
图4为分离后窄带干扰和原始PD信号的时频谱图;FIG4 is a time-frequency spectrum diagram of the separated narrowband interference and the original PD signal;
图5为仿真PD波形的窄带干扰抑制结果图;FIG5 is a diagram showing the narrowband interference suppression results of the simulated PD waveform;
图6为混合干扰下的染噪PD波形图;Figure 6 is a PD waveform diagram of stained noise under mixed interference;
图7为混合干扰下染噪PD信号的时频谱图分离结果图;FIG7 is a time-frequency spectrum separation result diagram of a noisy PD signal under mixed interference;
图8为混合干扰下染噪PD波形的降噪结果图;FIG8 is a diagram showing the denoising result of the PD waveform with mixed interference;
图9为实测的染噪PD信号图;FIG9 is a diagram of the measured PD signal with noise;
图10为实测PD信号的时频谱图;FIG10 is a time-frequency spectrum diagram of the measured PD signal;
图11为实测PD信号的时频谱图分离结果图;FIG11 is a time-frequency spectrum separation result diagram of the measured PD signal;
图12为实测PD信号的窄带干扰抑制结果图;FIG12 is a diagram showing the narrowband interference suppression results of the measured PD signal;
图13为本发明一个具体实施例的流程图。FIG. 13 is a flow chart of a specific embodiment of the present invention.
具体实施方式DETAILED DESCRIPTION
为使本发明的目的、技术方案和优点更加清楚明白,下面结合实施例和附图,对本发明作进一步的详细说明,本发明的示意性实施方式及其说明仅用于解释本发明,并不作为对本发明的限定。In order to make the objectives, technical solutions and advantages of the present invention more clearly understood, the present invention is further described in detail below in conjunction with embodiments and drawings. The exemplary implementation modes of the present invention and their description are only used to explain the present invention and are not intended to limit the present invention.
实施例:Example:
如图13所示,基于时频谱图分离的局部放电窄带干扰抑制方法,包括:S1、采样获取染噪PD信号;S2、采用广义S变换对染噪PD信号的离散信号进行时频变换处理,得到二维时频复数矩阵,其中,二维时频复数矩阵中横轴为时间采样点,纵轴为频率采样点;S3、对二维时频复数矩阵求模得到关于染噪PD信号的时频谱图;S4、采用数学形态学获取染噪PD信号时频谱图中各行分量的平滑分量和非平滑分量,将分离出的平滑分量和非平滑分量作为行分量构成新的矩阵,分离出窄带干扰和原始PD信号的时频谱图,以确定窄带干扰的数目与PD脉冲的时间区域;S5、将采样得到的染噪PD信号根据时间轴划定为含有PD信号的信号帧和仅含噪声的噪声帧,采用总体最小二乘不变旋转矢量技术分析噪声帧内时域数据,以提取窄带干扰的时域特征量;S6、重构出窄带干扰的时域波形,从染噪PD信号的时域波形中去除窄带干扰的时域波形,得到降噪后PD信号。As shown in FIG13 , the method for suppressing narrowband interference of partial discharge based on separation of time-frequency spectrum includes: S1, sampling to obtain the noisy PD signal; S2, using generalized S transform to perform time-frequency transform on the discrete signal of the noisy PD signal to obtain a two-dimensional time-frequency complex matrix, wherein the horizontal axis of the two-dimensional time-frequency complex matrix is the time sampling point and the vertical axis is the frequency sampling point; S3, taking the module of the two-dimensional time-frequency complex matrix to obtain the time-frequency spectrum of the noisy PD signal; S4, using mathematical morphology to obtain the smoothed component and the non-smoothed component of each row component in the time-frequency spectrum of the noisy PD signal, and separating the smoothed component The amount and the non-smoothed component are used as row components to form a new matrix, and the time-frequency spectrum of the narrowband interference and the original PD signal is separated to determine the number of narrowband interferences and the time region of the PD pulse; S5, the sampled noisy PD signal is divided into a signal frame containing the PD signal and a noise frame containing only noise according to the time axis, and the total least squares invariant rotation vector technology is used to analyze the time domain data in the noise frame to extract the time domain feature of the narrowband interference; S6, the time domain waveform of the narrowband interference is reconstructed, and the time domain waveform of the narrowband interference is removed from the time domain waveform of the noisy PD signal to obtain the denoised PD signal.
本实施例中,信号x(t)的广义S变换结果G(τ,f,λ)被定义为:In this embodiment, the generalized S-transform result G(τ, f, λ) of the signal x(t) is defined as:

式中,t和τ为两组时间变量;f是频率;λ是调节因子;w(t-τ,f,λ)是高斯窗函数,对应的表达式为:Where t and τ are two sets of time variables; f is the frequency; λ is the adjustment factor; w(t-τ,f,λ) is the Gaussian window function, and the corresponding expression is:

由于式(2)中窗函数的宽度和分析频率成反比,所以广义S变换在低频区域能获得更高的频率分辨率,而在高频区域能获得更高的时间分辨率,利于PD信号这类非平稳信号的时频分析。同时可以通过设定合适的λ,对广义S变换的最终时频变换结果进行人为调节。如果将λ设定在(0,1)范围内,那么可以增加式(2)中窗函数的宽度,达到提升频域分辨率的目的;如果将λ设定在(1,+∞)范围内,那么可以减小式(2)中窗函数的宽度,达到提升时域分辨率的目的。Since the width of the window function in equation (2) is inversely proportional to the analysis frequency, the generalized S transform can obtain higher frequency resolution in the low-frequency region and higher time resolution in the high-frequency region, which is beneficial to the time-frequency analysis of non-stationary signals such as PD signals. At the same time, the final time-frequency transform result of the generalized S transform can be artificially adjusted by setting an appropriate λ. If λ is set in the range of (0,1), the width of the window function in equation (2) can be increased to achieve the purpose of improving the frequency domain resolution; if λ is set in the range of (1,+∞), the width of the window function in equation (2) can be reduced to achieve the purpose of improving the time domain resolution.
在实际使用广义S变换时,令x(n)是信号x的离散信号,同时定义f=n/(NT)、τ=iT,其中T是采样周期,N是x(n)的数据总量,得到x(n)的广义S变换结果为:When the generalized S transform is actually used, let x(n) be the discrete signal of signal x, and define f=n/(NT) and τ=iT, where T is the sampling period and N is the total amount of data of x(n). The generalized S transform result of x(n) is:

式中,i、m、n是x(n)的广义S变换结果中三组变量,被定义为0,1,…,N-1。Where i, m, and n are three groups of variables in the generalized S-transform result of x(n), and are defined as 0, 1, …, N-1.
在利用式(3)对x(n)开展时频变换处理后,可以得到一个二维的时频复数矩阵,该矩阵的横轴是时间采样点,该矩阵的纵轴是频率采样点。对该二维时频复数矩阵进行求模处理,可以得到关于染噪PD信号的时频谱图。After using equation (3) to perform time-frequency transformation on x(n), a two-dimensional time-frequency complex matrix can be obtained, the horizontal axis of which is the time sampling point and the vertical axis of which is the frequency sampling point. By performing modulus processing on the two-dimensional time-frequency complex matrix, a time-frequency spectrum of the noisy PD signal can be obtained.
本实施例采用的广义S变换方法是一种基于S变换的改进时频变换方法,该方法在S变换方法的窗函数中加入了调节因子λ,不仅继承了S变换对非平稳信号的优异时频分析能力,同时增加了时频变换结果的人为可控性。本实施例采用的广义S变换方法同时具备小波变换方法的多分辨率分析和短时傅里叶变换方法的单频率分量分析的优点,并且不需要人为选择小波函数或窗函数的参数,减小了人为因素干扰。The generalized S transform method used in this embodiment is an improved time-frequency transform method based on the S transform. This method adds an adjustment factor λ to the window function of the S transform method, which not only inherits the excellent time-frequency analysis capability of the S transform for non-stationary signals, but also increases the artificial controllability of the time-frequency transform result. The generalized S transform method used in this embodiment has the advantages of multi-resolution analysis of the wavelet transform method and single frequency component analysis of the short-time Fourier transform method, and does not require artificial selection of wavelet function or window function parameters, thereby reducing interference from artificial factors.
数学形态学中存在两种基本的变换形式:腐蚀和膨胀。染噪PD信号时频谱图中各行分量Gt(nGt)的膨胀和腐蚀变换结果分别表示为:There are two basic transformation forms in mathematical morphology: erosion and dilation. The dilation and erosion transformation results of each row componentGt (nGt ) in the spectrum of the noisy PD signal are expressed as:


式中,g(ig)是结构元素;⊕是膨胀运算符;⊙是腐蚀运算符;DGt是Gt(nGt)的定义域;Dg是g(ig)的定义域,nGt是数组Gt中某个索引,ig是数组g中某个索引。In the formula, g(ig ) is the structural element; ⊕ is the expansion operator; ⊙ is the erosion operator; DGt is the domain ofGt (nGt ); Dg is the domain of g(ig ), nGt is an index in the arrayGt , and ig is an index in the array g.
通过式(4)和式(5)的级联组合,可以得到数学形态学中开运算和闭运算分别为:By cascading formula (4) and formula (5), we can get the opening and closing operations in mathematical morphology as follows:

(Gt·g)(nGt)=((Gt⊕g)⊙g)(nGt) (7)(Gt ·g)(nGt )=((Gt ⊕g)⊙g)(nGt ) (7)
式中,
利用开、闭运算的组合可以对目标信号进行削峰平谷,从而分离出目标信号的平滑分量和非平滑分量。将式(6)和式(7)的开、闭运算进行级联组合,分别得到形态开-闭滤波器运行结果[Foc(Gt)](nGt)和形态闭-开滤波器运行结果[Fco(Gt)](nGt)为:The combination of open and close operations can be used to cut the peaks and flatten the valleys of the target signal, thereby separating the smooth component and the non-smooth component of the target signal. The open and close operations of equations (6) and (7) are cascaded to obtain the morphological open-closed filter operation results [Foc (Gt )](nGt ) and the morphological closed-open filter operation results [Fco (Gt )](nGt ) respectively:


在利用数学形态学算法对目标信号开展分量分离时,为了减小统计偏倚现象的影响,本实施例采用形态开-闭滤波器和形态闭-开滤波器的混合运算,得到信号Gt(nGt)中的平滑分量[F1(Gt)](nGt)和非平滑分量[F2(Gt)](nGt)分别为:When the target signal is separated by the mathematical morphology algorithm, in order to reduce the influence of the statistical bias phenomenon, the present embodiment adopts the hybrid operation of the morphological open-closed filter and the morphological closed-open filter, and obtains thesmooth component [F1 (Gt )] (nGt ) and the non-smooth component [F2 (Gt )] (nGt ) in the signal G t (nGt ) as follows:
[F1(Gt)](nGt)=([Foc(Gt)](nGt)+[Fco(Gt)](nGt))/2 (10)[F1 (Gt )](nGt )=([Foc (Gt )](nGt )+[Fco (Gt )](nGt ))/2 (10)
[F2(Gt)](nGt)=Gt(nGt)-[F1(Gt)](nGt) (11)。[F2 (Gt )](nGt )=Gt (nGt )-[F1 (Gt )](nGt ) (11).
本实施例基于数学形态学进行信号特征提取,利用合适的结构元素去采集目标信号的特征信息,从而刻画出目标信号的结构特征。This embodiment performs signal feature extraction based on mathematical morphology, and uses appropriate structural elements to collect feature information of the target signal, thereby characterizing the structural features of the target signal.
本实施例采用总体最小二乘不变旋转矢量技术(total least squares-estimation of signal parameters via rotational invariance techniques,TLE-ESPRIT)计算窄带干扰的特征参数,其具体计算流程如下:This embodiment uses total least squares-estimation of signal parameters via rotational invariance techniques (TLE-ESPRIT) to calculate the characteristic parameters of narrowband interference, and the specific calculation process is as follows:
(1)将噪声帧内时域数据信号y(ny)构成Hankle矩阵H为:(1) The time domain data signal y(ny ) in the noise frame is transformed into the Hankle matrix H:

式中,Ny是信号y(ny)的数据长度,L是H的列数,L的优选值为Ny/3。Wherein, Ny is the data length of signal y (ny ), L is the number of columns of H, and the preferred value of L is Ny /3.
(2)将H开展奇异值分解,得到(2) Perform singular value decomposition on H and obtain
H=UΣVT (13)H=UΣVT (13)
式中,T是取矩阵的共轭转置;U和V分别是左、右正交矩阵;Σ是对角矩阵,其中的对角元素是矩阵H的奇异值。WhereT is the conjugate transpose of the matrix; U and V are left and right orthogonal matrices respectively; Σ is a diagonal matrix, where the diagonal elements are the singular values of the matrix H.
(3)分离出矩阵U中第1行到第L行,第1列到第P列的子矩阵为矩阵U1;同时分离出矩阵U中第2行到第L+1行,第1列到第P列的子矩阵为U2,以此得到U1和U2分别为:(3) Separate the submatrix from the 1st row to the Lth row and the 1st column to the Pth column in the matrix U as the matrix U1 ; at the same time, separate the submatrix from the 2nd row to the L+1th row and the 1st column to the Pth column in the matrix U as U2 , thereby obtaining U1 and U2 respectively:
U1=U[1:L,1:P] (14)U1 =U[1:L,1:P] (14)
U2=U[2:L+1,1:P] (15)U2 =U[2:L+1,1:P] (15)
式中,P是分离后时频图谱确定的窄带干扰个数的2倍。Where P is twice the number of narrowband interferences determined by the time-frequency spectrum after separation.
(4)构建矩阵Z=[U1 U2],然后对Z开展奇异值分解,得到(4) Construct the matrix Z = [U1 U2 ], and then perform singular value decomposition on Z to obtain


式中:


(5)利用V12和V22构建矩阵ψ为(5) Using V12 and V22, we construct the matrix ψ:
ψ=-V12V22-1 (18)ψ=-V12 V22-1 (18)
(6)对ψ开展特征值分解,得到对应的特征值为μk(k=1,2,…,P),从而估计得到各窄带干扰分量的频率

式中,arg(*)是计算复数的相角。Where arg(*) is the phase angle of the complex number being calculated.
(7)利用最小二乘法计算各窄带干扰分量的幅值

Y=μc (20)Y=μc (20)
Y=[y(0),y(1),…,y(Ny-1)]T (21)Y=[y(0),y(1),…,y(Ny -1)]T (21)


式中,c是中间变量矩阵,ck是c中元素。Where c is the intermediate variable matrix andck is the element in c.
PD脉冲信号通常会呈现衰减振荡的波形特征,因此采用式(25)所示的单指数衰减振荡函数s1(t)和式(26)所示的双指数衰减振荡函数s2(t)对真实的局部放电信号进行模拟。PD pulse signals usually present a waveform characteristic of decay oscillation, so the single exponential decay oscillation function s1 (t) shown in equation (25) and the double exponential decay oscillation function s2 (t) shown in equation (26) are used to simulate the real partial discharge signal.


式中,a1和a2是仿真PD信号的幅值;τ1和τ2是仿真PD信号的衰减常数;fs1和fs2是仿真PD信号的振荡频率。Wherea1 anda2 are the amplitudes of the simulated PD signals;τ1 andτ2 are the attenuation constants of the simulated PD signals;fs1 andfs2 are the oscillation frequencies of the simulated PD signals.
周期性窄带干扰snoise(t)的表达式为:The expression of periodic narrowband interferencesnoise (t) is:

式中,Ak是窄带干扰的幅值;fk是窄带干扰的频率;
利用表1中参数构造4组仿真PD脉冲,如图1(a)所示。由于现场窄带干扰频带具有一定宽度,因此本实施例设计了多组不同频带的窄带干扰进行模拟测试。利用表2中参数构造5组窄带干扰,并将窄带干扰叠加在图1(a)中原始的PD仿真波形上,得到染噪的PD仿真波形如图1(b)所示,图1中波形的采样时长和采样频率分别设置为120μs和40MHz。值得说明的是,对比表1和表2可知,PD信号脉冲在脉冲序号1、3和窄带干扰的干扰序号3的频带存在重合现象,以模拟实际情况中局部放电信号频带与窄带干扰频带重合的情况。从图1中可以看出,在叠加了窄带干扰之后,原始PD信号几乎完全被窄带干扰淹没,因此无法直接从时域中将原始PD信号和窄带干扰进行分离,导致PD信号的识别和分析受到限制。Four groups of simulated PD pulses are constructed using the parameters in Table 1, as shown in Figure 1(a). Since the narrowband interference frequency band on site has a certain width, this embodiment designs multiple groups of narrowband interferences of different frequency bands for simulation testing. Five groups of narrowband interferences are constructed using the parameters in Table 2, and the narrowband interferences are superimposed on the original PD simulation waveform in Figure 1(a), and the stained PD simulation waveform is obtained as shown in Figure 1(b). The sampling duration and sampling frequency of the waveform in Figure 1 are set to 120μs and 40MHz, respectively. It is worth noting that, by comparing Table 1 and Table 2, it can be seen that the PD signal pulses overlap in the frequency bands of
表1仿真PD信号的参数表Table 1 Parameters of simulated PD signal
表2仿真窄带干扰的参数表Table 2 Parameters of simulated narrowband interference
PD脉冲信号通常会呈现衰减振荡的波形特征,因此可以采用式(25)所示的单指数衰减振荡函数s1(t)和式(26)所示的双指数衰减振荡函数s2(t)对真实的局部放电信号进行模拟。PD pulse signals usually present a waveform characteristic of decay oscillation, so the single exponential decay oscillation function s1 (t) shown in equation (25) and the double exponential decay oscillation function s2 (t) shown in equation (26) can be used to simulate the real partial discharge signal.
利用广义S变换方法分别对图1(a)中原始的PD仿真波形和图1(b)中染噪的PD仿真波形进行时频分析,得到两者对应的时频谱图如图2所示。需要说明的是,本实施例将式(3)中λ优选设置为0.3。The generalized S transform method is used to perform time-frequency analysis on the original PD simulation waveform in FIG1(a) and the noisy PD simulation waveform in FIG1(b), and the corresponding time-frequency spectra of the two are shown in FIG2. It should be noted that in this embodiment, λ in formula (3) is preferably set to 0.3.
在图2的时频谱图中,原始PD信号和窄带干扰呈现出明显不同的特点。原始PD信号在时间轴方向上的跨度较小,同时该信号在频率轴方向上的跨度较大;窄带干扰在频率轴方向上的跨度较小,同时该信号在时间轴方向上的跨度较大。综上所述,可以利用原始PD信号和窄带干扰在时频谱图中的不同特征,对两者进行分离。进一步对图2(b)中染噪PD信号的时频谱图开展分析,可以发现:当窄带干扰和原始PD信号的时频能量存在混叠时,由于窄带干扰的能量较强,所以窄带干扰会掩盖原始PD信号的时频特征,难以直接在时频谱图中区分窄带干扰和PD信号。若直接在时频谱图中区分窄带干扰和PD信号,具有很大的局限性,难以准确划分出窄带干扰和PD信号对应的时频子区域。In the time-frequency spectrum of Figure 2, the original PD signal and the narrowband interference show significantly different characteristics. The span of the original PD signal in the time axis direction is small, while the span of the signal in the frequency axis direction is large; the span of the narrowband interference in the frequency axis direction is small, while the span of the signal in the time axis direction is large. In summary, the different characteristics of the original PD signal and the narrowband interference in the time-frequency spectrum can be used to separate the two. Further analysis of the time-frequency spectrum of the noisy PD signal in Figure 2(b) shows that: when the time-frequency energy of the narrowband interference and the original PD signal is aliased, due to the strong energy of the narrowband interference, the narrowband interference will mask the time-frequency characteristics of the original PD signal, and it is difficult to directly distinguish the narrowband interference and the PD signal in the time-frequency spectrum. If the narrowband interference and the PD signal are distinguished directly in the time-frequency spectrum, there are great limitations, and it is difficult to accurately divide the time-frequency sub-regions corresponding to the narrowband interference and the PD signal.
对图2(b)中染噪PD信号时频谱图的每行数据开展单独分析,即单独分析各频率能量和时间的变化关系曲线,得到2组典型的变化关系曲线如图3所示。其中图3(a)的频率能量仅由原始PD信号构成,图3(b)的频率能量由原始PD信号和窄带干扰共同构成。这里需要说明的是,由于染噪PD信号的首端和末端存在数据的截断效应,所以染噪PD信号的广义S变换模矩阵在时间序列的首端和末端都存在畸变,为了准确分析染噪PD信号广义S变换模矩阵的特征,本实施例在广义S变换模矩阵时间序列的首端和末端都删除一小部分采样点。Each row of data in the time-frequency spectrum of the noisy PD signal in Figure 2(b) is analyzed separately, that is, the change relationship curve of each frequency energy and time is analyzed separately, and two groups of typical change relationship curves are obtained as shown in Figure 3. The frequency energy of Figure 3(a) is only composed of the original PD signal, and the frequency energy of Figure 3(b) is composed of the original PD signal and narrowband interference. It should be noted here that due to the truncation effect of data at the beginning and end of the noisy PD signal, the generalized S transform module matrix of the noisy PD signal is distorted at the beginning and end of the time series. In order to accurately analyze the characteristics of the generalized S transform module matrix of the noisy PD signal, this embodiment deletes a small number of sampling points at the beginning and end of the generalized S transform module matrix time series.
分析图3可以看出,在各频率能量和时间的变化关系曲线中,窄带干扰会呈现为平滑分量,而原始PD信号是一个“丘状”结构,呈现为非平滑分量,本实施例利用该特点将两者进行区分,以分离出染噪PD信号时频谱图中窄带干扰与原始PD信号。本实施例采用数学形态学方法分离信号中平滑分量和非平滑分量,进而分离染噪PD信号时频谱图中窄带干扰和PD信号。From the analysis of Figure 3, it can be seen that in the curve of the relationship between the energy of each frequency and time, the narrowband interference will appear as a smooth component, while the original PD signal is a "hill-like" structure, which appears as a non-smooth component. This embodiment uses this feature to distinguish the two, so as to separate the narrowband interference and the original PD signal in the spectrum of the stained PD signal. This embodiment uses a mathematical morphology method to separate the smooth component and the non-smooth component in the signal, and then separates the narrowband interference and the PD signal in the spectrum of the stained PD signal.
通常局部放电的持续时间小于1μs,在测试回路中电容和电感的影响下,实际测试的PD波形的持续时间通常会大于1μs。为了有效分离染噪PD信号时频谱图中原始PD信号和窄带干扰,本实施例中结构元素选择为时间长度为5μs的扁平结构元素。Usually, the duration of partial discharge is less than 1μs. Under the influence of capacitance and inductance in the test loop, the duration of the PD waveform actually tested is usually greater than 1μs. In order to effectively separate the original PD signal and narrowband interference in the spectrum of the noisy PD signal, the structural element in this embodiment is selected as a flat structural element with a time length of 5μs.
依照本实施例,首先将染噪PD信号时频谱图中各行分量作为目标信号,利用数学形态学方法分离目标信号的平滑分量和非平滑分量,然后将分离出的平滑分量和非平滑分量作为行分量构成新的矩阵,以此分离出窄带干扰和原始PD信号的时频谱图,从而提取窄带干扰和原始PD信号的特征量。为了方便观察,本实施例对分离出的原始PD信号时频谱图进行了取模处理。According to this embodiment, each row component in the time-frequency spectrum of the noisy PD signal is first used as the target signal, and the smooth component and the non-smooth component of the target signal are separated by a mathematical morphology method, and then the separated smooth component and the non-smooth component are used as row components to form a new matrix, thereby separating the time-frequency spectrum of the narrowband interference and the original PD signal, thereby extracting the characteristic quantities of the narrowband interference and the original PD signal. For the convenience of observation, this embodiment performs a modulus process on the separated time-frequency spectrum of the original PD signal.
利用数学形态学方法对图2(b)中染噪PD信号的时频谱图进行处理,分离出窄带干扰和原始PD信号的时频谱图分别如图4(a)和图4(b)所示。首先分析图4(a)中分离出的窄带干扰时频谱图,依照窄带干扰的时频特性,可以确定仿真的染噪PD信号中存在5组窄带干扰。接着分析图4(b)中分离出的原始PD信号时频谱图,由于部分PD信号和窄带干扰在染噪PD信号时频谱图中发生了时频能量的混叠,所以图4(b)中部分PD信号(仿真的局放脉冲1和局放脉冲3)的时频能量分布与图2(a)中原始PD信号的时频能量分布产生了差异,但是仍然具备原始PD信号的时频特性,因此依旧可以按照PD信号的时频特性,确定PD脉冲的时间区域。The time-frequency spectrum of the noisy PD signal in Figure 2(b) is processed by the mathematical morphology method, and the time-frequency spectrum of the narrowband interference and the original PD signal are separated as shown in Figure 4(a) and Figure 4(b), respectively. First, the time-frequency spectrum of the narrowband interference separated in Figure 4(a) is analyzed. According to the time-frequency characteristics of the narrowband interference, it can be determined that there are 5 groups of narrowband interference in the simulated noisy PD signal. Then, the time-frequency spectrum of the original PD signal separated in Figure 4(b) is analyzed. Since some PD signals and narrowband interference have time-frequency energy aliasing in the time-frequency spectrum of the noisy PD signal, the time-frequency energy distribution of some PD signals (simulated
当采样的时间窗口较长时,PD信号仅会占据较小的时间,更多的时间是由窄带干扰等噪声所占据,所以可以将采样得到的染噪PD信号根据时间轴划定为含有PD信号的信号帧和仅含窄带干扰等噪声的噪声帧。When the sampling time window is longer, the PD signal will only occupy a smaller time, and more time will be occupied by noise such as narrowband interference. Therefore, the sampled noisy PD signal can be divided into signal frames containing PD signals and noise frames containing only narrowband interference and other noise according to the time axis.
由于染噪PD信号在噪声帧内不含有PD信号,因此可以利用TLE-ESPRIT方法分析噪声帧内时域数据,以准确提取窄带干扰的时域特征量。需要说明的是,利用噪声帧内时域数据计算得到的相位仅对应噪声帧内的窄带干扰,为计算信号帧中相位以重构窄带干扰,需要将式(23)中


式中,ΔT是信号帧和噪声帧的时延。Where ΔT is the delay between the signal frame and the noise frame.
通过TLE-ESPRIT提取窄带干扰的时域特征量后,然后利用式(28)可以重构出窄带干扰的时域波形,最后从染噪PD信号的时域波形中去除窄带干扰的时域波形,得到降噪后PD信号。After extracting the time domain features of the narrowband interference through TLE-ESPRIT, the time domain waveform of the narrowband interference can be reconstructed using formula (28). Finally, the time domain waveform of the narrowband interference is removed from the time domain waveform of the noisy PD signal to obtain the denoised PD signal.
对图1(b)所示含有窄带干扰的染噪PD信号利用本实施例进行降噪,得到降噪结果如图5(a)所示。为了便于比较,本实施例引入FFT谱最小熵解卷积滤波方法和自适应奇异值分解方法对仿真染噪PD信号进行窄带干扰降噪,分别得到对应的降噪结果如图5(b)和图5(c)所示。The denoised PD signal with narrowband interference shown in FIG1(b) is subjected to denoising using this embodiment, and the denoising result is shown in FIG5(a). For the sake of comparison, this embodiment introduces the FFT spectrum minimum entropy deconvolution filtering method and the adaptive singular value decomposition method to perform narrowband interference denoising on the simulated denoised PD signal, and the corresponding denoising results are shown in FIG5(b) and FIG5(c), respectively.
由图5可知,对于FFT谱最小熵解卷积滤波方法而言,由于傅里叶变换算法存在频谱泄露的特点,导致该方法的最终降噪结果存在明显的“边缘效应”(边缘处的噪声较大),同时该方法中阈值法无法提取小幅值窄带干扰的频点,因此该方法难以抑制小幅值的窄带干扰,导致整个降噪波形中残留较多的窄带干扰能量。对于自适应奇异值分解方法而言,由于PD波形和小幅值窄带干扰的奇异值数值非常接近,甚至会导致奇异值的能量产生相互的混叠,所以最终的降噪结果存在窄带干扰抑制不干净的情况。利用本实施例对染噪的仿真PD波形进行降噪时,既可以最大程度地削弱窄带干扰的能量,同时也能保留PD信号的波形特征。As shown in Figure 5, for the FFT spectrum minimum entropy deconvolution filtering method, due to the spectrum leakage characteristics of the Fourier transform algorithm, the final denoising result of this method has an obvious "edge effect" (the noise at the edge is larger), and at the same time, the threshold method in this method cannot extract the frequency of small-amplitude narrowband interference, so this method is difficult to suppress small-amplitude narrowband interference, resulting in more residual narrowband interference energy in the entire denoised waveform. For the adaptive singular value decomposition method, since the singular value values of the PD waveform and the small-amplitude narrowband interference are very close, it may even cause the energy of the singular values to alias each other, so the final denoising result has the situation that the narrowband interference is not cleanly suppressed. When the present embodiment is used to denoise the simulated PD waveform with noise, the energy of the narrowband interference can be weakened to the greatest extent, while the waveform characteristics of the PD signal can be retained.
为了对图5中各方法的实际降噪结果开展量化分析,本实施例采用了信噪比(signal to noise ratio,SNR)、波形相似系数(normalized correlation coefficient,NCC)和均方误差(mean square error,MSE)三组特征参数对仿真PD波形的降噪效果进行评估,计算得到图5中各方法降噪结果的评价参数如表3所示。对比表3中的各项参数可以看出,本实施例的SNR和NNC值最大,同时MSE值最小,说明本实施例对窄带干扰的降噪效果最好,对原始PD信号的还原效果最佳。In order to quantitatively analyze the actual noise reduction results of each method in FIG5, this embodiment uses three sets of characteristic parameters, namely, signal to noise ratio (SNR), normalized correlation coefficient (NCC) and mean square error (MSE), to evaluate the noise reduction effect of the simulated PD waveform, and the evaluation parameters of the noise reduction results of each method in FIG5 are calculated as shown in Table 3. By comparing the parameters in Table 3, it can be seen that the SNR and NNC values of this embodiment are the largest, while the MSE value is the smallest, indicating that this embodiment has the best noise reduction effect on narrowband interference and the best restoration effect on the original PD signal.
表3降噪结果的评价参数表Table 3 Evaluation parameters of denoising results

通常情况下,实际采集的PD信号会同时含有白噪声干扰和窄带干扰,为了验证本实施例的适用性,先对图1(a)的仿真原始PD波形添加2dB的白噪声干扰,再加入仿真的窄带干扰,得到对应混合干扰下的PD波形如图6所示,此时计算得到染噪PD信号的信噪比为-26.5915dB。Normally, the PD signal actually collected will contain both white noise interference and narrowband interference. In order to verify the applicability of this embodiment, 2dB white noise interference is first added to the simulated original PD waveform of Figure 1(a), and then the simulated narrowband interference is added to obtain the PD waveform under the corresponding mixed interference as shown in Figure 6. At this time, the signal-to-noise ratio of the noisy PD signal is calculated to be -26.5915dB.
利用本实施例分离图6中染噪PD波形的时频谱图,得到分离后窄带干扰和PD信号的时频谱图分别如图7(a)和图7(b)所示。从图7中可以看出,在染噪PD信号存在白噪声干扰的情况下,本实施例仍旧可以有效分离出窄带干扰和PD信号的时频谱图,其中分离出的窄带干扰时频谱图无异常变化,可以准确判断窄带干扰数量;分离出的PD信号时频谱图中会存在白噪声能量,但是PD信号的时频特征仍然清晰可见,可以准确划定PD信号的时频区域,确定染噪PD信号的信号帧和噪声帧。The time-frequency spectrum of the noisy PD waveform in FIG6 is separated by this embodiment, and the time-frequency spectrum of the separated narrowband interference and PD signal are shown in FIG7(a) and FIG7(b) respectively. As can be seen from FIG7, in the case of white noise interference in the noisy PD signal, this embodiment can still effectively separate the time-frequency spectrum of the narrowband interference and the PD signal, wherein the separated narrowband interference time-frequency spectrum has no abnormal changes, and the amount of narrowband interference can be accurately determined; there will be white noise energy in the separated PD signal time-frequency spectrum, but the time-frequency characteristics of the PD signal are still clearly visible, and the time-frequency region of the PD signal can be accurately delineated, and the signal frame and noise frame of the noisy PD signal can be determined.
利用本实施例对图6中染噪PD信号的窄带干扰进行抑制,得到对应的降噪结果如图8所示。从图8中可以看出,此时已经可以明显观察到PD信号的波形,计算得到此时的信噪比已经降为1.4571dB。上述结果证明了:在存在白噪声干扰的情况下,本实施例仍旧可以有效抑制染噪PD信号中窄带干扰,从而提高染噪PD信号的信噪比。The narrowband interference of the stained PD signal in FIG6 is suppressed by using this embodiment, and the corresponding noise reduction result is shown in FIG8. As can be seen from FIG8, the waveform of the PD signal can be clearly observed at this time, and the signal-to-noise ratio at this time is calculated to be reduced to 1.4571dB. The above results prove that: in the presence of white noise interference, this embodiment can still effectively suppress the narrowband interference in the stained PD signal, thereby improving the signal-to-noise ratio of the stained PD signal.
为了验证本实施例抑制实测染噪PD信号中窄带干扰的有效性,在实验室中搭建10kV交联聚乙烯电力电缆的工频局放测试系统,局放缺陷设置为电缆终端处存在半导电层突起缺陷,采样频率设置为100MHz,采样点数设置为4000。由于实验室近似于无噪环境,人为向实测PD信号中叠加5组窄带干扰,幅值分别设置为20、8、25、35、25mV,频率分别设置为2.51、5.36、10.32、15.33、22.42MHz,相位分别设置为45°、60°、30°、30°和90°,得到实测的染噪PD信号如图9所示。从图9中可以看出,在窄带干扰的影响下,原始PD信号已经严重被污染,难以进行特征分析。In order to verify the effectiveness of this embodiment in suppressing narrowband interference in the measured stained PD signal, a power frequency partial discharge test system for 10kV cross-linked polyethylene power cable was built in the laboratory. The partial discharge defect was set as a protruding defect in the semi-conductive layer at the cable terminal, the sampling frequency was set to 100MHz, and the number of sampling points was set to 4000. Since the laboratory is close to a noise-free environment, 5 groups of narrowband interference were artificially superimposed on the measured PD signal, with amplitudes set to 20, 8, 25, 35, and 25mV, frequencies set to 2.51, 5.36, 10.32, 15.33, and 22.42MHz, and phases set to 45°, 60°, 30°, 30°, and 90°, respectively. The measured stained PD signal is shown in Figure 9. As can be seen from Figure 9, under the influence of narrowband interference, the original PD signal has been severely contaminated, making it difficult to perform feature analysis.
利用广义S变换对图9中实测的染噪PD信号进行时频分析,得到对应的时频谱图如图10所示,从图10中可以看出,由于窄带干扰的能量较强,所以在实测染噪PD信号的时频谱图中,PD信号的时频特征已经完全被掩盖,直接在该时频谱图中划定窄带干扰和PD信号的方法难以实施,具备较大的局限性。The generalized S transform is used to perform time-frequency analysis on the measured noisy PD signal in Figure 9, and the corresponding time-frequency spectrum is shown in Figure 10. It can be seen from Figure 10 that due to the strong energy of the narrowband interference, the time-frequency characteristics of the PD signal have been completely masked in the time-frequency spectrum of the measured noisy PD signal. The method of directly demarcating the narrowband interference and the PD signal in the time-frequency spectrum is difficult to implement and has great limitations.
利用本实施例对图10实测PD信号的时频谱图进行分离,得到分离后窄带干扰和PD信号对应的时频谱图如图11所示,从图11中可以看出,此时窄带干扰和PD信号的时频谱图得到了有效的分离,利用分离出的窄带干扰时频谱图可以确定窄带干扰个数为5,同时利用分离出的PD信号时频谱图可以划定信号帧和噪声帧,以确保利用TLS-ESPRIT准确提取窄带干扰特征参数,重构窄带干扰,得到最终的降噪结果如图12(a)所示。The time-frequency spectrum of the measured PD signal in Figure 10 is separated by using this embodiment, and the time-frequency spectrum of the narrowband interference and the PD signal after separation is shown in Figure 11. It can be seen from Figure 11 that the time-frequency spectrum of the narrowband interference and the PD signal are effectively separated at this time. The number of narrowband interferences can be determined to be 5 using the separated narrowband interference time-frequency spectrum. At the same time, the signal frame and the noise frame can be demarcated using the separated PD signal time-frequency spectrum, so as to ensure that the narrowband interference characteristic parameters are accurately extracted using TLS-ESPRIT, and the narrowband interference is reconstructed to obtain the final denoising result as shown in Figure 12(a).
为了说明本实施例的优越性,再分别利用FFT谱最小熵解卷积滤波法和自适应奇异值分解法对图9中实测的染噪PD信号进行降噪处理,分别得到降噪结果如图12(b)和图12(c)所示。从图12中可以看出,利用FFT谱最小熵解卷积滤波法进行降噪时,降噪结果中残余的窄带干扰能量较强,尤其是在信号的边缘部分;利用自适应奇异值分解法进行降噪时,虽然大部分窄带干扰能够被有效抑制,但是会残留部分的小幅值窄带干扰;而采用本实施例进行降噪时,降噪结果中窄带干扰的残余能量较小,同时PD信号的波形特征得到了保留。In order to illustrate the superiority of this embodiment, the measured noisy PD signal in Figure 9 is subjected to denoising using the FFT spectrum minimum entropy deconvolution filtering method and the adaptive singular value decomposition method, respectively, and the denoising results are shown in Figures 12(b) and 12(c), respectively. As can be seen from Figure 12, when the FFT spectrum minimum entropy deconvolution filtering method is used for denoising, the residual narrowband interference energy in the denoising result is relatively strong, especially at the edge of the signal; when the adaptive singular value decomposition method is used for denoising, although most of the narrowband interference can be effectively suppressed, some small-amplitude narrowband interference will remain; and when the present embodiment is used for denoising, the residual energy of the narrowband interference in the denoising result is relatively small, and the waveform characteristics of the PD signal are retained.
因为难以采集到完全没有噪声的PD信号,所以不能采用SNR、NCC、MSE等参数对实测PD信号的降噪效果进行量化分析,本实施例引入噪声抑制比ρ抑对图12中降噪效果进行评估。该参数可以表现降噪结果中PD信号的凸显程度,该值越大,说明降噪结果更好。ρ抑的具体定义为:Because it is difficult to collect a PD signal without any noise, it is not possible to use parameters such as SNR, NCC, and MSE to quantitatively analyze the noise reduction effect of the measured PD signal. This embodiment introduces the noise suppression ratio ρto evaluate the noise reduction effect in Figure 12. This parameter can show the prominence of the PD signal in the noise reduction result. The larger the value, the better the noise reduction result. The specific definition ofρ is:

式中,σ1是降噪前信号的标准差,σ2是降噪后信号的标准差。Whereσ1 is the standard deviation of the signal before denoising, andσ2 is the standard deviation of the signal after denoising.
计算得到本实施例的方法、FFT谱最小熵解卷积滤波法和自适应奇异值分解法的噪声抑制比结果分别为30.7559、7.3017、16.4680,通过对比可以发现,本实施例的ρ抑值更大,说明本实施例可以有效抑制窄带干扰,以恢复PD信号的波形特征。值得说明的是,由图11可知,在本实施例实测的染噪PD信号中,PD信号和窄带干扰存在明显的频带重叠,而本实施例依然可以取得较好的窄带干扰抑制效果。The noise suppression ratios of the method of this embodiment, the FFT spectrum minimum entropy deconvolution filtering method, and the adaptive singular value decomposition method are calculated to be 30.7559, 7.3017, and 16.4680, respectively. By comparison, it can be found that the ρsuppression value of this embodiment is larger, indicating that this embodiment can effectively suppress narrowband interference to restore the waveform characteristics of the PD signal. It is worth noting that, as shown in Figure 11, in the stained PD signal measured in this embodiment, there is an obvious frequency band overlap between the PD signal and the narrowband interference, and this embodiment can still achieve a good narrowband interference suppression effect.
本实施例提出了一种基于时频谱图分离的局部放电窄带干扰抑制方法,该方法可以有效降低染噪PD信号中窄带干扰的能量,恢复PD信号的波形特征。本实施例的具体结论如下:This embodiment proposes a method for suppressing narrowband interference of partial discharge based on time-frequency spectrum separation, which can effectively reduce the energy of narrowband interference in the noisy PD signal and restore the waveform characteristics of the PD signal. The specific conclusions of this embodiment are as follows:
(1)通过分析染噪PD信号的时频谱图,明确当窄带干扰的能量较强时,窄带干扰会掩盖原始PD信号的时频特征,难以直接在染噪PD信号的时频谱图中辨识原始PD信号和窄带干扰。(1) By analyzing the time-frequency spectrum of the noisy PD signal, it is clear that when the energy of the narrowband interference is strong, the narrowband interference will mask the time-frequency characteristics of the original PD signal, making it difficult to directly identify the original PD signal and the narrowband interference in the time-frequency spectrum of the noisy PD signal.
(2)结合广义S变换和数学形态学,本实施例所提方法可以从染噪PD信号中分离出原始PD信号和窄带干扰信号的时频谱图,从而在时频域内准确辨识出窄带干扰和原始PD信号。(2) By combining generalized S-transform and mathematical morphology, the method proposed in this embodiment can separate the time-frequency spectrum of the original PD signal and the narrowband interference signal from the noisy PD signal, thereby accurately identifying the narrowband interference and the original PD signal in the time-frequency domain.
(3)在分离出原始PD信号和窄带干扰信号的时频谱图的基础上,利用TLS-ESPRIT算法可以准确估计窄带干扰的特征参数,实现窄带干扰的抑制。(3) Based on the separation of the time-frequency spectrum of the original PD signal and the narrowband interference signal, the TLS-ESPRIT algorithm can be used to accurately estimate the characteristic parameters of the narrowband interference and achieve the suppression of the narrowband interference.
(4)仿真和实测染噪PD信号的降噪结果表明:对比传统的FFT谱最小熵解卷积滤波法和自适应奇异值分解法,本实施例具备更好的窄带干扰抑制效果,有利于小幅值窄带干扰的抑制。(4) The simulation and measured denoising results of the noisy PD signal show that compared with the traditional FFT spectrum minimum entropy deconvolution filtering method and the adaptive singular value decomposition method, this embodiment has a better narrowband interference suppression effect and is conducive to the suppression of small-amplitude narrowband interference.
利用本实施例的方法、FFT谱最小熵解卷积滤波方法和自适应奇异值分解方法对仿真和实测的染噪PD信号开展降噪处理,通过对比降噪结果,验证了本实施例可以有效抑制染噪PD信号中窄带干扰,并且降噪结果中残余的窄带干扰能量较小。The method of this embodiment, the FFT spectrum minimum entropy deconvolution filtering method and the adaptive singular value decomposition method are used to perform noise reduction processing on the simulated and measured noisy PD signals. By comparing the noise reduction results, it is verified that this embodiment can effectively suppress narrowband interference in the noisy PD signals, and the residual narrowband interference energy in the noise reduction results is small.
以上所述的具体实施方式,对本发明的目的、技术方案和有益效果进行了进一步详细说明,所应理解的是,以上所述仅为本发明的具体实施方式而已,并不用于限定本发明的保护范围,凡在本发明的精神和原则之内,所做的任何修改、等同替换、改进等,均应包含在本发明的保护范围之内。The specific implementation methods described above further illustrate the objectives, technical solutions and beneficial effects of the present invention in detail. It should be understood that the above description is only a specific implementation method of the present invention and is not intended to limit the scope of protection of the present invention. Any modifications, equivalent substitutions, improvements, etc. made within the spirit and principles of the present invention should be included in the scope of protection of the present invention.
Claims (2)


Priority Applications (1)
| Application Number | Priority Date | Filing Date | Title |
|---|---|---|---|
| CN202210472721.7ACN114861722B (en) | 2022-04-29 | 2022-04-29 | Partial discharge narrow-band interference suppression method based on time-frequency spectrogram separation |
Applications Claiming Priority (1)
| Application Number | Priority Date | Filing Date | Title |
|---|---|---|---|
| CN202210472721.7ACN114861722B (en) | 2022-04-29 | 2022-04-29 | Partial discharge narrow-band interference suppression method based on time-frequency spectrogram separation |
Publications (2)
| Publication Number | Publication Date |
|---|---|
| CN114861722A CN114861722A (en) | 2022-08-05 |
| CN114861722Btrue CN114861722B (en) | 2023-04-11 |
Family
ID=82635419
Family Applications (1)
| Application Number | Title | Priority Date | Filing Date |
|---|---|---|---|
| CN202210472721.7AActiveCN114861722B (en) | 2022-04-29 | 2022-04-29 | Partial discharge narrow-band interference suppression method based on time-frequency spectrogram separation |
Country Status (1)
| Country | Link |
|---|---|
| CN (1) | CN114861722B (en) |
Families Citing this family (5)
| Publication number | Priority date | Publication date | Assignee | Title |
|---|---|---|---|---|
| CN115980528B (en)* | 2023-02-14 | 2024-03-26 | 湖南湘能智能配电设备有限公司 | Ring main unit noise signal rapid diagnosis and elimination method and device |
| CN116486836B (en)* | 2023-03-29 | 2025-08-01 | 昆明理工大学 | Signal-to-noise ratio estimation method for transmission voice |
| CN119782873A (en)* | 2024-11-27 | 2025-04-08 | 国网江苏省电力有限公司连云港供电分公司 | A method and system for intelligent simulation test of primary and secondary fusion centralized DTU equipment |
| CN119916147A (en)* | 2024-12-19 | 2025-05-02 | 国网安徽省电力有限公司电力科学研究院 | Active suppression method and system for background noise of partial discharge ultra-high frequency signal |
| CN119959711B (en)* | 2025-04-10 | 2025-07-04 | 国网山西省电力公司电力科学研究院 | Spectral signal characteristic extraction method and discharge fault diagnosis method of GIS equipment |
Family Cites Families (5)
| Publication number | Priority date | Publication date | Assignee | Title |
|---|---|---|---|---|
| US20090196524A1 (en)* | 2008-02-05 | 2009-08-06 | Dts Digital Images, Inc. | System and method for sharpening of digital images |
| CN103245832B (en)* | 2013-05-16 | 2015-08-12 | 湖南大学 | Based on harmonic wave time-frequency characteristic method for parameter estimation and the analyser of quick S-transformation |
| CN111308285B (en)* | 2020-03-03 | 2021-04-13 | 西南交通大学 | Narrow-band interference noise reduction method |
| CN111460367B (en)* | 2020-03-20 | 2023-05-30 | 淮阴工学院 | Algorithm for solving imbalance of leak data of halogen conveying pipeline based on S transformation/WGAN |
| CN113777449A (en)* | 2021-08-31 | 2021-12-10 | 云南电网有限责任公司昆明供电局 | Narrowband interference suppression method for cable partial discharge based on improved SVD algorithm |
- 2022
- 2022-04-29CNCN202210472721.7Apatent/CN114861722B/enactiveActive
Also Published As
| Publication number | Publication date |
|---|---|
| CN114861722A (en) | 2022-08-05 |
Similar Documents
| Publication | Publication Date | Title |
|---|---|---|
| CN114861722B (en) | Partial discharge narrow-band interference suppression method based on time-frequency spectrogram separation | |
| CN109557429B (en) | GIS partial discharge fault detection method based on improved wavelet threshold denoising | |
| Neelamani et al. | Wavelet-based deconvolution for ill-conditioned systems | |
| CN107957566A (en) | Magnetic resonance depth measurement method for extracting signal based on frequency selection singular spectrum analysis | |
| CN108287073B (en) | Resonance band selection method based on singular value component frequency domain spectrum | |
| CN112014692A (en) | Blind source separation and denoising method of partial discharge UHF signal based on principal component analysis | |
| CN106771905A (en) | A kind of DISCHARGE PULSES EXTRACTION method suitable for high frequency electric Partial Discharge Detection | |
| Ashtiani et al. | Feature-oriented de-noising of partial discharge signals employing mathematical morphology filters | |
| CN111308285A (en) | Narrow-band interference noise reduction method | |
| CN113486750A (en) | Oil-immersed transformer partial discharge signal denoising method based on improved VMD algorithm and wavelet packet denoising algorithm | |
| Ray et al. | A new threshold function for de-noising partial discharge signal based on wavelet transform | |
| CN115712819A (en) | Ground nuclear magnetic resonance signal noise suppression method based on generation countermeasure network | |
| Rauscher et al. | Pareto optimization of wavelet filter design for partial discharge detection in electrical machines | |
| CN112528853B (en) | Improved dual-tree complex wavelet transform denoising method | |
| US7676046B1 (en) | Method of removing noise and interference from signal | |
| Ming et al. | Partial discharge de-noising based on hybrid particle swarm optimization SWT adaptive threshold | |
| CN119199380A (en) | A distribution line fault waveform denoising analysis method and computer equipment based on improved wavelet threshold function | |
| CN118858853A (en) | A partial discharge noise reduction method based on SVMD and SE | |
| CN110703089B (en) | A Wavelet Threshold Denoising Method for Low Frequency Oscillation Prony Analysis | |
| Yang et al. | Denoising of partial discharge signal by common factor method and wavelet thresholding | |
| Ray et al. | Extract Partial Discharge signal using wavelet for on-line measurement | |
| Zehtabian et al. | A novel speech enhancement approach based on singular value decomposition and genetic algorithm | |
| Sahu et al. | Image denoising using principal component analysis in wavelet domain and total variation regularization in spatial domain | |
| Wang et al. | Denoising of electrical shock fault signal based on empirical mode decomposition thresholding | |
| Dong et al. | Distribution Cable Partial Discharge Hybrid Noise Suppression Method based on Adaptive Dual Complementary Convolutional Network |
Legal Events
| Date | Code | Title | Description |
|---|---|---|---|
| PB01 | Publication | ||
| PB01 | Publication | ||
| SE01 | Entry into force of request for substantive examination | ||
| SE01 | Entry into force of request for substantive examination | ||
| GR01 | Patent grant | ||
| GR01 | Patent grant |