CN114841894A - Method for correcting spectral distortion - Google Patents
Method for correcting spectral distortionDownload PDFInfo
- Publication number
- CN114841894A CN114841894ACN202210566583.9ACN202210566583ACN114841894ACN 114841894 ACN114841894 ACN 114841894ACN 202210566583 ACN202210566583 ACN 202210566583ACN 114841894 ACN114841894 ACN 114841894A
- Authority
- CN
- China
- Prior art keywords
- spectral
- data
- line
- spectrum
- normal
- Prior art date
- Legal status (The legal status is an assumption and is not a legal conclusion. Google has not performed a legal analysis and makes no representation as to the accuracy of the status listed.)
- Granted
Links
Images


Classifications
- G—PHYSICS
- G06—COMPUTING OR CALCULATING; COUNTING
- G06T—IMAGE DATA PROCESSING OR GENERATION, IN GENERAL
- G06T5/00—Image enhancement or restoration
- G06T5/80—Geometric correction
- G—PHYSICS
- G06—COMPUTING OR CALCULATING; COUNTING
- G06T—IMAGE DATA PROCESSING OR GENERATION, IN GENERAL
- G06T5/00—Image enhancement or restoration
- G06T5/70—Denoising; Smoothing
- G—PHYSICS
- G06—COMPUTING OR CALCULATING; COUNTING
- G06T—IMAGE DATA PROCESSING OR GENERATION, IN GENERAL
- G06T5/00—Image enhancement or restoration
- G06T5/77—Retouching; Inpainting; Scratch removal
- G—PHYSICS
- G06—COMPUTING OR CALCULATING; COUNTING
- G06T—IMAGE DATA PROCESSING OR GENERATION, IN GENERAL
- G06T5/00—Image enhancement or restoration
- G06T5/90—Dynamic range modification of images or parts thereof
- G—PHYSICS
- G06—COMPUTING OR CALCULATING; COUNTING
- G06T—IMAGE DATA PROCESSING OR GENERATION, IN GENERAL
- G06T7/00—Image analysis
- G06T7/10—Segmentation; Edge detection
- G06T7/13—Edge detection
- G—PHYSICS
- G06—COMPUTING OR CALCULATING; COUNTING
- G06T—IMAGE DATA PROCESSING OR GENERATION, IN GENERAL
- G06T2207/00—Indexing scheme for image analysis or image enhancement
- G06T2207/10—Image acquisition modality
- G06T2207/10024—Color image
- G—PHYSICS
- G06—COMPUTING OR CALCULATING; COUNTING
- G06T—IMAGE DATA PROCESSING OR GENERATION, IN GENERAL
- G06T2207/00—Indexing scheme for image analysis or image enhancement
- G06T2207/10—Image acquisition modality
- G06T2207/10032—Satellite or aerial image; Remote sensing
- G06T2207/10036—Multispectral image; Hyperspectral image
- Y—GENERAL TAGGING OF NEW TECHNOLOGICAL DEVELOPMENTS; GENERAL TAGGING OF CROSS-SECTIONAL TECHNOLOGIES SPANNING OVER SEVERAL SECTIONS OF THE IPC; TECHNICAL SUBJECTS COVERED BY FORMER USPC CROSS-REFERENCE ART COLLECTIONS [XRACs] AND DIGESTS
- Y02—TECHNOLOGIES OR APPLICATIONS FOR MITIGATION OR ADAPTATION AGAINST CLIMATE CHANGE
- Y02A—TECHNOLOGIES FOR ADAPTATION TO CLIMATE CHANGE
- Y02A40/00—Adaptation technologies in agriculture, forestry, livestock or agroalimentary production
- Y02A40/10—Adaptation technologies in agriculture, forestry, livestock or agroalimentary production in agriculture
Landscapes
- Engineering & Computer Science (AREA)
- Physics & Mathematics (AREA)
- General Physics & Mathematics (AREA)
- Theoretical Computer Science (AREA)
- Computer Vision & Pattern Recognition (AREA)
- Spectrometry And Color Measurement (AREA)
Abstract
Description
Translated fromChinese技术领域technical field
本发明涉及高光谱数据处理领域,特别是涉及一种高光谱仪器中光谱畸变的校正方法。The invention relates to the field of hyperspectral data processing, in particular to a correction method for spectral distortion in a hyperspectral instrument.
背景技术Background technique
目前,高光谱仪器被广泛应用,由原来应用于航空航天方面,逐渐扩大到农业、森林、天文探测、军事、资源勘探以及环境监测等方面。高光谱技术不断进步,逐渐成熟。光谱成像技术是把图像和光谱结合在一起的一种技术,获取目标的相关信息,包括空间信息以及光谱信息。光谱成像技术获取的数据称为光谱数据立方体,分析数据立方体可以提取光谱曲线。At present, hyperspectral instruments are widely used, from the original application in aerospace, to agriculture, forest, astronomical exploration, military, resource exploration and environmental monitoring. Hyperspectral technology continues to improve and gradually mature. Spectral imaging technology is a technology that combines image and spectrum to obtain relevant information of the target, including spatial information and spectral information. The data acquired by spectral imaging technology is called the spectral data cube, and the spectral curve can be extracted by analyzing the data cube.
高光谱仪器中按照分光原理可以分成滤光片型、干涉型、计算层析型和色散型。最早出现的是滤光片型光谱仪,光学布局简单,但光谱分辨率较低;干涉型光谱仪是利用傅里叶变换的方法处理图像,具有强集光性,并且能够进行多通道探测,但对仪器的精度要求较高;计算层析型探测速度较快,但成本高;色散型光谱仪有两种类型,可分为光栅成像型和棱镜成像型,具有高分辨率和色散线性的优点,应用广泛。According to the spectroscopic principle, hyperspectral instruments can be divided into filter type, interference type, computed tomography type and dispersion type. The first appeared was the filter type spectrometer, which has a simple optical layout but low spectral resolution. The precision of the instrument is required to be high; the computational tomography type has a faster detection speed, but the cost is high; there are two types of dispersive spectrometers, which can be divided into grating imaging type and prism imaging type, which have the advantages of high resolution and dispersion linearity. widely.
高光谱仪器中狭缝像会发生畸变,畸变有两种类型,一是谱线弯曲,狭缝像边缘视场和中心视场在光谱维度方向上像点位置的差异;二是色畸变,不同波长狭缝像的长度相对于参考波长狭缝像长度的差值,属于狭缝像放大率的差异。光栅成像型和棱镜成像型仪器在成像时会发生畸变,主要是发生谱线弯曲,当存在谱线弯曲时,会造成光谱仪获取的光谱线和图像信息发生变化,同一行之间探测器像元会产生一定的光谱偏离,原有的图谱混叠形式会发生改变,使得对后续的光谱标定、像元匹配变得更加复杂,后期进行图像处理的难度加大,影响高光谱仪器的精度,使复原图谱的准确度造成一定的误差。In hyperspectral instruments, the slit image will be distorted. There are two types of distortion. One is the bending of the spectral line, and the difference in the position of the image point in the spectral dimension between the edge field of view and the center field of view of the slit image; the second is color distortion. The difference between the length of the wavelength slit image and the length of the reference wavelength slit image belongs to the difference in the magnification of the slit image. The grating imaging type and prism imaging type instruments will be distorted during imaging, mainly due to the bending of the spectral line. When there is a bending of the spectral line, the spectral lines and image information obtained by the spectrometer will change, and the detector pixels between the same lines will change. There will be a certain spectral deviation, and the original spectral aliasing form will change, making the subsequent spectral calibration and pixel matching more complicated, and the difficulty of image processing in the later stage will increase, which will affect the accuracy of the hyperspectral instrument. The accuracy of the restored map caused certain errors.
高光谱仪器中狭缝图像畸变又难以完全消除,因此,对高光谱仪器中光谱畸变的校正方法的研究十分重要。使用matlab搭建一个校正系统,进行光谱线的校正,可以减小畸变,从而提高高光谱仪器对目标检测的精度等。对高光谱仪器中光谱畸变的校正方法的研究,是对高光谱仪器获取光谱线后进行应用的基础。Slit image distortion in hyperspectral instruments is difficult to completely eliminate. Therefore, it is very important to study the correction method of spectral distortion in hyperspectral instruments. Using matlab to build a calibration system to calibrate the spectral lines can reduce the distortion and improve the accuracy of target detection by hyperspectral instruments. The research on the correction method of spectral distortion in hyperspectral instruments is the basis for the application of hyperspectral instruments after acquiring spectral lines.
在此背景下,通过分析光谱线的特点,我们提出了一种光谱畸变的校正方法,实现对发生畸变的光谱图进行校正,对后续的光谱特征提取有着重要意义。In this context, by analyzing the characteristics of spectral lines, we propose a correction method for spectral distortion, which can correct the distorted spectrogram, which is of great significance for the subsequent spectral feature extraction.
发明内容SUMMARY OF THE INVENTION
本发明目的在于对高光谱仪器中的狭缝图像畸变进行校正,提出了一种光谱畸变的校正方法。The purpose of the invention is to correct the slit image distortion in a hyperspectral instrument, and a correction method for spectral distortion is proposed.
本发明提出的一种光谱畸变的校正方法,包括光谱的边缘检测、光谱区域的划分、光谱长度的计算、光谱宽度的计算、获取光谱的位置信息,然后修复光谱数据,最后显示校正后的光谱图像。技术细节如下:The method for correcting spectral distortion provided by the present invention includes edge detection of the spectrum, division of the spectral region, calculation of the spectral length, calculation of the spectral width, acquisition of the position information of the spectrum, then repairing the spectral data, and finally displaying the corrected spectrum image. The technical details are as follows:
步骤S1:光谱的边缘检测Step S1: Edge Detection of Spectrum
步骤S1.1:读取光谱数据,将光谱图像转换为灰度图像。Step S1.1: Read the spectral data and convert the spectral image into a grayscale image.
令three_D∈RM*N*3表示读取图像得到的三维彩色图像,one_D∈RM*N表示转换后得到的二维灰度图像,其中M和N分别是图像的高度和宽度。Let three_D∈RM*N*3 denote the 3D color image obtained by reading the image, and one_D∈RM*N denote the 2D grayscale image obtained after conversion, where M and N are the height and width of the image, respectively.
步骤S1.2:分别采用阈值是0.8和0.2的Canny边缘检测算子对one_D进行处理。Step S1.2: Use Canny edge detection operators with thresholds of 0.8 and 0.2 to process one_D respectively.
步骤S1.3:对使用阈值为0.8的边缘检测算子处理的边缘数据进行一次函数拟合得到直线,用spectral_position保存直线的斜率和截距数据,以该直线为基准,确定光谱带的上边界和下边界位置,用spectral_position_above保存光谱带的上边界直线的斜率和截距数据,用spectral_position_below保存光谱带的下边界直线的斜率和截距数据。Step S1.3: Perform linear function fitting on the edge data processed by the edge detection operator with a threshold of 0.8 to obtain a straight line, use spectral_position to save the slope and intercept data of the straight line, and use the straight line as a benchmark to determine the upper boundary of the spectral band and the lower boundary position, use spectral_position_above to save the slope and intercept data of the upper boundary line of the spectral band, and use spectral_position_below to save the slope and intercept data of the lower boundary line of the spectral band.
步骤S1.4:对使用阈值为0.2的边缘检测算子处理后的光谱数据,依据光谱边界数据spectral_position_above和spectral_position_below消除光谱数据中的噪声,得到去噪后的光谱数据get_edge∈RM*N,其中M和N分别是图像的高度和宽度。Step S1.4: For the spectral data processed by the edge detection operator with a threshold of 0.2, remove the noise in the spectral data according to the spectral boundary data spectral_position_above and spectral_position_below, and obtain the denoised spectral data get_edge∈RM*N , where M and N are the height and width of the image, respectively.
步骤S2:光谱区域的划分Step S2: Division of Spectral Regions
步骤S2.1:依据光谱的首尾横坐标得到在水平方向的最小值mincol和最大值maxcol,得到整个区域的宽度col_wide。Step S2.1: Obtain the minimum value mincol and the maximum value maxcol in the horizontal direction according to the abscissas of the beginning and end of the spectrum, and obtain the width col_wide of the entire region.
步骤S2.2:按照目标划分的区域个数number_of_split_blocks得到每个光谱区域块的宽度block_wide,公式如下:Step S2.2: Obtain the width block_wide of each spectral region block according to the number of regions divided by the target number_of_split_blocks, the formula is as follows:
block_wide = col_wide / number_of_split_blocksblock_wide = col_wide / number_of_split_blocks
number_of_split_blocks可以根据光谱畸变的程度调整,默认分成3段光谱区域,不能设置划分成1段区域。number_of_split_blocks can be adjusted according to the degree of spectral distortion. It is divided into 3 spectral regions by default, and cannot be divided into 1 region.
步骤S2.3:依据光谱的首端横坐标mincol和光谱区域段的宽度block_wide得到每个区域的开始位置start_plot_x和结束位置end_plot_x,公式如下:Step S2.3: Obtain the start position start_plot_x and end position end_plot_x of each area according to the abscissa mincol of the head end of the spectrum and the width block_wide of the spectral area segment. The formula is as follows:
start_plot_x = mincol + (i-1) ×block_widestart_plot_x = mincol + (i-1) ×block_wide
end_plot_x = mincol + i×block_wideend_plot_x = mincol + i×block_wide
其中i=1,2,…,number_of_split_blocks。where i=1,2,…,number_of_split_blocks.
步骤S3:光谱长度的计算Step S3: Calculation of Spectral Length
步骤S3.1:依据每个区域的开始位置start_plot_x和结束位置end_plot_x,截取每个区域的光谱数据。Step S3.1: According to the start position start_plot_x and the end position end_plot_x of each area, the spectral data of each area is intercepted.
步骤S3.2:将每个区域的数据拟合出一条一次函数的直线,用fitting_line保存直线的斜率和截距数据。Step S3.2: Fit the data of each area to a linear function line, and use fitting_line to save the slope and intercept data of the line.
步骤S3.3:依据每个区域的开始位置start_plot_x和结束位置end_plot_x,得到直线上两端的坐标start_plot(start_plot_x,start_plot_y)和end_plot(end_plot_x,end_plot_y),公式如下:Step S3.3: According to the start position start_plot_x and end position end_plot_x of each area, obtain the coordinates start_plot (start_plot_x, start_plot_y) and end_plot (end_plot_x, end_plot_y) at both ends of the line, the formula is as follows:
start_plot_y=fitting_line (1,1) ×start_plot_x + fitting_line (1,2);start_plot_y=fitting_line (1,1) ×start_plot_x + fitting_line (1,2);
end_plot_y=fitting_line (1,1) ×end_plot_x + fitting_line (1,2);end_plot_y=fitting_line(1,1) ×end_plot_x + fitting_line(1,2);
其中fitting_line (1,1)是直线的斜率,fitting_line (1,2)是直线的截距。where fitting_line(1,1) is the slope of the line and fitting_line(1,2) is the intercept of the line.
步骤S3.4:依据光谱的首尾点start_plot和end_plot的坐标得到这一段的光谱长度leng_part。Step S3.4: According to the coordinates of the start_plot and end_plot of the start and end points of the spectrum, the length of the spectrum length of this section is obtained.
步骤S4:光谱宽度的计算Step S4: Calculation of spectral width
步骤S4.1:在分段光谱的开始点start_plot处,做直线的法线,用normal_line保存法线的斜率和截距数据。Step S4.1: At the start point start_plot of the segmented spectrum, make the normal of the straight line, and use normal_line to save the slope and intercept data of the normal.
步骤S4.2:求得法线与光谱相交的点的集合collection_of_ points,遍历分段光谱内所有的点p0,求p0到法线的距离distance是否小于阈值,一般阈值设为1即可,点p0到法线的距离公式如下:Step S4.2: Obtain the collection_of_ points of the points where the normal and the spectrum intersect, traverse all the points p0 in the segmented spectrum, and find out whether the distance from p0 to the normal is less than the threshold. Generally, the threshold can be set to 1, and the point p0 The formula for the distance to the normal is as follows:
distance= abs(det([p2-p1,p0-p1]))/norm(p2-p1)distance= abs(det([p2-p1,p0-p1]))/norm(p2-p1)
其中p1、p2是法线上的两个点,两个点就可以确定这条法线。Among them, p1 and p2 are two points on the normal, and two points can determine the normal.
步骤S4.3:计算collection_of_ points中符合条件的坐标数据两两之间的距离,取其中的最大值,即作为法线与直线交点处的宽度数据,将其存入total_block_wide∈RL*1,L是光谱的总长度。Step S4.3: Calculate the distance between the qualified coordinate data in the collection_of_ points, take the maximum value, which is the width data at the intersection of the normal and the straight line, and store it in total_block_wide∈RL*1 , L is the total length of the spectrum.
步骤S4.4:如果collection_of_ points中没有符合条件的数据,则这一点的宽度数据和前一个点的宽度数据保持一致。Step S4.4: If there is no eligible data in the collection_of_ points, the width data of this point is consistent with the width data of the previous point.
步骤S4.5:将法线normal_line沿着拟合直线fitting_line方向移动1个单位得到下一个点的法线normal_line,法线的斜率不变,截距会发生变化,截距变化的数值公式如下Step S4.5: Move the normal line normal_line by 1 unit in the direction of the fitting line fitting_line to obtain the normal line normal_line of the next point. The slope of the normal line remains unchanged, and the intercept will change. The numerical formula for the change of the intercept is as follows
d=sqrt(k2 + 1)/ kd=sqrt(k2 + 1)/k
其中d是截距变化的数值,有正负,k是拟合直线的斜率。where d is the value of the change in the intercept, positive or negative, and k is the slope of the fitted line.
步骤S4.6:回到4.3迭代计算宽度数据,直到数据点宽度个数满足长度数据。Step S4.6: Go back to 4.3 to iteratively calculate the width data until the number of data point widths satisfies the length data.
步骤S5:获取光谱的位置信息Step S5: Obtain the position information of the spectrum
步骤S5.1:对整个区域所有边缘数据点进行拟合,拟合结果为一条水平直线,得到一个常数fitting_spectral_position,即为光谱线位置。Step S5.1: Fit all edge data points in the entire area, the fitting result is a horizontal straight line, and a constant fitting_spectral_position is obtained, which is the spectral line position.
步骤S6:修复光谱数据Step S6: Repair spectral data
步骤S6.1:根据光谱宽度数据total_block_wide和位置数据fitting_spectral_position修复光谱数据,得到repaired_spectrum。Step S6.1: Repair the spectral data according to the spectral width data total_block_wide and the position data fitting_spectral_position to obtain repaired_spectrum.
步骤S7:显示校正后的光谱图像Step S7: Display the corrected spectral image
步骤S7.1:显示修复后的光谱图像repaired_spectrum。Step S7.1: Display the repaired spectral image repaired_spectrum.
附图说明Description of drawings
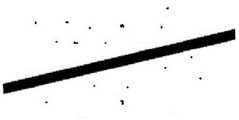
图1光谱数据的原始图像。Figure 1 Raw image of spectral data.
图2光谱数据的灰度图像。Figure 2 Grayscale image of spectral data.
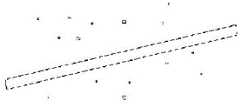
图3使用阈值为0.8的canny算子得到的边缘数据。Figure 3. Edge data obtained using the canny operator with a threshold of 0.8.
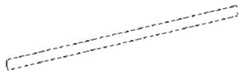
图4使用阈值为0.2的canny算子得到的边缘数据。Figure 4. Edge data obtained using the canny operator with a threshold of 0.2.
图5去噪后的光谱边缘检测图像。Figure 5 Spectral edge detection image after denoising.
图6修复后的光谱图像。Figure 6. Repaired spectral image.
具体实施方式Detailed ways
为了使本技术领域的人员更好地理解本发明方案,下面将结合本发明实施例中的附图,对本发明实施例中的技术方案进行清楚、完整地描述,显然,所描述的实施例仅仅是本发明一部分的实施例,而不是全部的实施例。基于本发明中的实施例,本领域普通技术人员在没有做出创造性劳动的前提下所获得的所有其他实施例,都应当属于本发明保护的范围。In order to make those skilled in the art better understand the solutions of the present invention, the technical solutions in the embodiments of the present invention will be clearly and completely described below with reference to the accompanying drawings in the embodiments of the present invention. Obviously, the described embodiments are only Embodiments are part of the present invention, but not all embodiments. Based on the embodiments of the present invention, all other embodiments obtained by persons of ordinary skill in the art without creative work shall fall within the protection scope of the present invention.
本发明提出方法包括光谱的边缘检测、光谱区域的划分、光谱长度的计算、光谱宽度的计算、获取光谱的位置信息,然后修复光谱数据,最后显示校正后的光谱图像。具体步骤如下:The method proposed by the invention includes spectral edge detection, spectral region division, spectral length calculation, spectral width calculation, acquisition of spectral position information, restoration of spectral data, and finally display of the corrected spectral image. Specific steps are as follows:
步骤S1:光谱的边缘检测Step S1: Edge Detection of Spectrum
步骤S1.1:读取如图1所示光谱数据,将图1转换为灰度图像,如图2所示;Step S1.1: read the spectral data shown in Figure 1, and convert Figure 1 into a grayscale image, as shown in Figure 2;
令three_D∈RM*N*3表示读取图1得到的三维彩色图像,one_D∈RM*N表示转换后得到的二维灰度图像,其中M和N分别是图像的高度和宽度。Let three_D∈RM*N*3 denote the 3D color image obtained by reading Figure 1, and one_D∈RM*N denote the 2D grayscale image obtained after conversion, where M and N are the height and width of the image, respectively.
步骤S1.2:采用两个不同阈值的Canny边缘检测算子对one_D进行处理,结果如图3和图4所示。Step S1.2: Use two Canny edge detection operators with different thresholds to process one_D, and the results are shown in Figure 3 and Figure 4.
步骤S1.3:对图3的边缘数据进行一次函数拟合得到直线,用spectral_position保存直线的斜率和截距数据,以该直线为基准,确定光谱带的上边界和下边界位置,用spectral_position_above保存光谱带的上边界直线的斜率和截距数据,用spectral_position_below保存光谱带的下边界直线的斜率和截距数据。Step S1.3: Perform a function fitting on the edge data in Figure 3 to obtain a straight line, use spectral_position to save the slope and intercept data of the straight line, use the straight line as a benchmark, determine the upper and lower boundary positions of the spectral band, and save it with spectral_position_above The slope and intercept data of the upper boundary line of the spectral band, use spectral_position_below to save the slope and intercept data of the lower boundary line of the spectral band.
步骤S1.4:依据光谱边界数据spectral_position_above和spectral_position_below消除图4中光谱以外的噪声,得到去噪后的光谱数据get_edge∈RM*N,其中M和N分别是图像的高度和宽度,去噪结果如图5所示。Step S1.4: Eliminate the noise outside the spectrum in Figure 4 according to the spectral boundary data spectral_position_above and spectral_position_below to obtain the denoised spectral data get_edge∈RM*N , where M and N are the height and width of the image respectively, and the denoising result As shown in Figure 5.
步骤S2:光谱区域的划分Step S2: Division of Spectral Regions
步骤S2.1:依据光谱的首尾横坐标得到在水平方向的最小值mincol和最大值maxcol,得到整个区域的宽度col_wide。Step S2.1: Obtain the minimum value mincol and the maximum value maxcol in the horizontal direction according to the abscissas of the beginning and end of the spectrum, and obtain the width col_wide of the entire region.
步骤S2.2:按照目标划分的区域个数number_of_split_blocks得到每个光谱区域块的宽度block_wide,公式如下:Step S2.2: Obtain the width block_wide of each spectral region block according to the number of regions divided by the target number_of_split_blocks, the formula is as follows:
block_wide = col_wide / number_of_split_blocksblock_wide = col_wide / number_of_split_blocks
number_of_split_blocks可以根据光谱畸变的程度调整,默认分成3段光谱区域,不能设置划分成1段区域。number_of_split_blocks can be adjusted according to the degree of spectral distortion. It is divided into 3 spectral regions by default, and cannot be divided into 1 region.
步骤S2.3:依据光谱的首端横坐标mincol和光谱区域段的宽度block_wide得到每个区域的开始位置start_plot_x和结束位置end_plot_x,公式如下:Step S2.3: Obtain the start position start_plot_x and end position end_plot_x of each area according to the abscissa mincol of the head end of the spectrum and the width block_wide of the spectral area segment. The formula is as follows:
start_plot_x = mincol + (i-1) ×block_widestart_plot_x = mincol + (i-1) ×block_wide
end_plot_x = mincol + i×block_wideend_plot_x = mincol + i×block_wide
其中i=1,2,…,number_of_split_blocks。where i=1,2,…,number_of_split_blocks.
步骤S3:光谱长度的计算Step S3: Calculation of Spectral Length
步骤S3.1:依据每个区域的开始位置start_plot_x和结束位置end_plot_x,截取每个区域的光谱数据。Step S3.1: According to the start position start_plot_x and the end position end_plot_x of each area, the spectral data of each area is intercepted.
步骤S3.2:将每个区域的数据拟合出一条一次函数的直线,用fitting_line保存直线的斜率和截距数据。Step S3.2: Fit the data of each area to a linear function line, and use fitting_line to save the slope and intercept data of the line.
步骤S3.3:依据每个区域的开始位置start_plot_x和结束位置end_plot_x,得到直线上两端的坐标start_plot(start_plot_x,start_plot_y)和end_plot(end_plot_x,end_plot_y),公式如下:Step S3.3: According to the start position start_plot_x and end position end_plot_x of each area, obtain the coordinates start_plot (start_plot_x, start_plot_y) and end_plot (end_plot_x, end_plot_y) at both ends of the line, the formula is as follows:
start_plot_y=fitting_line (1,1) ×start_plot_x + fitting_line (1,2);start_plot_y=fitting_line (1,1) ×start_plot_x + fitting_line (1,2);
end_plot_y=fitting_line (1,1) ×end_plot_x + fitting_line (1,2);end_plot_y=fitting_line(1,1) ×end_plot_x + fitting_line(1,2);
其中fitting_line (1,1)是直线的斜率,fitting_line (1,2)是直线的截距。where fitting_line(1,1) is the slope of the line and fitting_line(1,2) is the intercept of the line.
步骤S3.4:依据光谱的首尾点start_plot和end_plot的坐标得到这一段的光谱长度leng_part。Step S3.4: According to the coordinates of the start_plot and end_plot of the start and end points of the spectrum, the length of the spectrum length of this section is obtained.
步骤S4:光谱宽度的计算Step S4: Calculation of spectral width
步骤S4.1:在分段光谱的开始点start_plot处,做直线的法线,用normal_line保存法线的斜率和截距数据。Step S4.1: At the start point start_plot of the segmented spectrum, make the normal of the straight line, and use normal_line to save the slope and intercept data of the normal.
步骤S4.2:求得法线与光谱相交的点的集合collection_of_ points,遍历分段光谱内所有的点p0,求p0到法线的距离distance是否小于阈值,一般阈值设为1即可,点p0到法线的距离公式如下:Step S4.2: Obtain the collection_of_ points of the points where the normal and the spectrum intersect, traverse all the points p0 in the segmented spectrum, and find out whether the distance from p0 to the normal is less than the threshold. Generally, the threshold can be set to 1, and the point p0 The formula for the distance to the normal is as follows:
distance= abs(det([p2-p1,p0-p1]))/norm(p2-p1)distance= abs(det([p2-p1,p0-p1]))/norm(p2-p1)
其中p1、p2是法线上的两个点,两个点就可以确定这条法线。Among them, p1 and p2 are two points on the normal, and two points can determine the normal.
步骤S4.3:计算collection_of_ points中符合条件的坐标数据两两之间的距离,取其中的最大值,即作为法线与直线交点处的宽度数据,将其存入total_block_wide∈RL*1,L是光谱的总长度。Step S4.3: Calculate the distance between the qualified coordinate data in the collection_of_ points, take the maximum value, which is the width data at the intersection of the normal and the straight line, and store it in total_block_wide∈RL*1 , L is the total length of the spectrum.
步骤S4.4:如果collection_of_ points中没有符合条件的数据,则这一点的宽度数据和前一个点的宽度数据保持一致。Step S4.4: If there is no eligible data in the collection_of_ points, the width data of this point is consistent with the width data of the previous point.
步骤S4.5:将法线normal_line沿着拟合直线fitting_line方向移动1个单位得到下一个点的法线normal_line,法线的斜率不变,截距会发生变化,截距变化的数值公式如下:Step S4.5: Move the normal line normal_line by 1 unit along the fitting_line direction to obtain the normal line normal_line of the next point. The slope of the normal line remains unchanged, and the intercept will change. The numerical formula for the change of the intercept is as follows:
d=sqrt(k2 + 1)/ kd=sqrt(k2 + 1)/k
其中d是截距变化的数值,有正负,k是拟合直线的斜率。where d is the value of the change in the intercept, positive or negative, and k is the slope of the fitted line.
步骤S4.6:回到4.3迭代计算宽度数据,直到数据点宽度个数满足长度数据。Step S4.6: Go back to 4.3 to iteratively calculate the width data until the number of data point widths satisfies the length data.
步骤S5:获取光谱的位置信息Step S5: Obtain the position information of the spectrum
步骤S5.1:对整个区域所有边缘数据点进行拟合,拟合结果为一条水平直线,得到一个常数fitting_spectral_position,即为光谱线位置。Step S5.1: Fit all edge data points in the entire area, the fitting result is a horizontal straight line, and a constant fitting_spectral_position is obtained, which is the spectral line position.
步骤S6:修复光谱数据Step S6: Repair spectral data
步骤S6.1:根据光谱宽度数据total_block_wide和位置数据fitting_spectral_position修复光谱数据,得到repaired_spectrum。Step S6.1: Repair the spectral data according to the spectral width data total_block_wide and the position data fitting_spectral_position to obtain repaired_spectrum.
步骤S7:显示校正后的光谱图像Step S7: Display the corrected spectral image
步骤S7.1:显示修复后的光谱图像repaired_spectrum,结果如图6所示。Step S7.1: Display the repaired spectral image repaired_spectrum, and the result is shown in Figure 6.
以上仅是本申请的具体实施方式而已,并非对本申请做任何形式上的限定,凡是依据本申请的技术实质对以上实施方式所做的任意简单修改、等同变化或修饰,均仍属于本申请技术方案的保护范围。The above are only specific embodiments of the present application, and are not intended to limit the present application in any form. Any simple modifications, equivalent changes or modifications made to the above embodiments according to the technical essence of the present application still belong to the technology of the present application. The scope of protection of the program.
Claims (3)
Priority Applications (1)
| Application Number | Priority Date | Filing Date | Title |
|---|---|---|---|
| CN202210566583.9ACN114841894B (en) | 2022-05-24 | 2022-05-24 | A method for correcting spectral distortion |
Applications Claiming Priority (1)
| Application Number | Priority Date | Filing Date | Title |
|---|---|---|---|
| CN202210566583.9ACN114841894B (en) | 2022-05-24 | 2022-05-24 | A method for correcting spectral distortion |
Publications (2)
| Publication Number | Publication Date |
|---|---|
| CN114841894Atrue CN114841894A (en) | 2022-08-02 |
| CN114841894B CN114841894B (en) | 2024-04-16 |
Family
ID=82571805
Family Applications (1)
| Application Number | Title | Priority Date | Filing Date |
|---|---|---|---|
| CN202210566583.9AActiveCN114841894B (en) | 2022-05-24 | 2022-05-24 | A method for correcting spectral distortion |
Country Status (1)
| Country | Link |
|---|---|
| CN (1) | CN114841894B (en) |
Citations (6)
| Publication number | Priority date | Publication date | Assignee | Title |
|---|---|---|---|---|
| US20040142496A1 (en)* | 2001-04-23 | 2004-07-22 | Nicholson Jeremy Kirk | Methods for analysis of spectral data and their applications: atherosclerosis/coronary heart disease |
| US20050162649A1 (en)* | 2004-01-23 | 2005-07-28 | P&P Optica Inc. | Multi-channel spectrum analyzer |
| CN107220939A (en)* | 2016-03-21 | 2017-09-29 | 吴健奇 | A kind of core high-spectral data geometric distortion correction method based on triangle scaling method |
| EP3401656A1 (en)* | 2017-05-11 | 2018-11-14 | Nederlandse Organisatie voor toegepast- natuurwetenschappelijk onderzoek TNO | Correction of curved projection of a spectrometer slit line |
| CN109816607A (en)* | 2019-01-22 | 2019-05-28 | 北京师范大学 | A Two-dimensional Optical Fiber Spectral Image Correction Technology Based on Multilayer Feedforward Neural Network |
| CN111076816A (en)* | 2019-12-27 | 2020-04-28 | 中国科学院西安光学精密机械研究所 | Full-field spectrum calibration error correction method for large-aperture static interference imaging spectrometer |
- 2022
- 2022-05-24CNCN202210566583.9Apatent/CN114841894B/enactiveActive
Patent Citations (6)
| Publication number | Priority date | Publication date | Assignee | Title |
|---|---|---|---|---|
| US20040142496A1 (en)* | 2001-04-23 | 2004-07-22 | Nicholson Jeremy Kirk | Methods for analysis of spectral data and their applications: atherosclerosis/coronary heart disease |
| US20050162649A1 (en)* | 2004-01-23 | 2005-07-28 | P&P Optica Inc. | Multi-channel spectrum analyzer |
| CN107220939A (en)* | 2016-03-21 | 2017-09-29 | 吴健奇 | A kind of core high-spectral data geometric distortion correction method based on triangle scaling method |
| EP3401656A1 (en)* | 2017-05-11 | 2018-11-14 | Nederlandse Organisatie voor toegepast- natuurwetenschappelijk onderzoek TNO | Correction of curved projection of a spectrometer slit line |
| CN109816607A (en)* | 2019-01-22 | 2019-05-28 | 北京师范大学 | A Two-dimensional Optical Fiber Spectral Image Correction Technology Based on Multilayer Feedforward Neural Network |
| CN111076816A (en)* | 2019-12-27 | 2020-04-28 | 中国科学院西安光学精密机械研究所 | Full-field spectrum calibration error correction method for large-aperture static interference imaging spectrometer |
Non-Patent Citations (7)
| Title |
|---|
| JILIN LIU 等: "Analysis and correction of distortions in a spatial heterodyne spectrometer system", 《APPLIED OPTICS》, vol. 58, no. 9, 20 March 2019 (2019-03-20)* |
| 曹玮亮;廖宁放;吕航;吴文敏;程灏波;: "大口径干涉成像光谱仪扫描速度偏差的评估与校正", 光学技术, no. 05, 15 September 2017 (2017-09-15)* |
| 王小龙 等: "基于图像畸变校正的高光谱偏振图像配准方法", 《红外技术》, vol. 40, no. 8, 31 August 2018 (2018-08-31)* |
| 贡丽霞;何东中;白艳萍;: "基于畸变校正的高光谱偏振图像配准方法", 激光杂志, no. 07, 25 July 2020 (2020-07-25)* |
| 郭小方, 王润生: "机载成像光谱图象边缘辐射畸变校正", 中国图象图形学报, no. 01, 25 January 2000 (2000-01-25)* |
| 韩军 等: "SVM 的光栅成像光谱仪图像畸变校准方法", 《红外与激光工程》, vol. 43, no. 9, 30 September 2014 (2014-09-30)* |
| 马亮;危峻;黄小仙;崔毅;张晓;: "光栅色散型成像光谱仪的实验室光谱定标方法研究", 激光与光电子学进展, no. 02, 10 February 2013 (2013-02-10)* |
Also Published As
| Publication number | Publication date |
|---|---|
| CN114841894B (en) | 2024-04-16 |
Similar Documents
| Publication | Publication Date | Title |
|---|---|---|
| US8428335B2 (en) | Combining feature boundaries | |
| CN111242855B (en) | Iterative depth map structure repairing method based on RGB-D SSIM structure similarity | |
| CN117437223B (en) | Intelligent defect detection method for high-speed board-to-board connector | |
| CN106408616B (en) | A Correction Method for Inconsistency of Projection Image Background in CT Imaging | |
| CN112991287B (en) | Automatic indentation measurement method based on full convolution neural network | |
| DE112007003533T5 (en) | Angle correction method for a rotary encoder | |
| CN114820577A (en) | A radiation quality detection method and system for multi-source satellite remote sensing image products | |
| CN112037284A (en) | Checkerboard grid center point detection method, camera distortion calibration method and system | |
| CN114155236A (en) | Laser stripe center line extraction method suitable for dynamic measurement environment | |
| CN113763279A (en) | A Precise Correction Processing Method for Image with Rectangular Frame | |
| CN102903078B (en) | A kind of motion blur image method for parameter estimation based on multiresolution Fourier analysis theory | |
| CN115205259B (en) | Aircraft skin joint feature extraction method and system | |
| CN112634375A (en) | Plane calibration and three-dimensional reconstruction method in AI intelligent detection | |
| CN113066097B (en) | A method and system for fast and accurate measurement of finger width, period and metallization ratio of interdigital transducer | |
| CN114841894B (en) | A method for correcting spectral distortion | |
| CN118154455B (en) | Method for measuring displacement of face based on image processing | |
| CN110910442B (en) | High-speed moving object machine vision size detection method based on kernel-free image restoration | |
| JP2011133954A (en) | Edge extraction method and edge extraction device | |
| CN114387323B (en) | A displacement measurement method and device based on grating image | |
| CN117541492A (en) | A real-time merging method of multi-slit hyperspectral data | |
| CN116823715A (en) | Machine vision-based steel bar unit element detection method | |
| CN114001674A (en) | A machine vision measurement method of wire harness bending radius under free viewing angle | |
| CN113947543A (en) | An Unbiased Correction Method for the Center of Curved Light Bars | |
| CN113920141A (en) | A calculation method, device and storage medium for rock mass integrity coefficient | |
| CN120047448B (en) | A skin texture monitoring method based on image processing |
Legal Events
| Date | Code | Title | Description |
|---|---|---|---|
| PB01 | Publication | ||
| PB01 | Publication | ||
| SE01 | Entry into force of request for substantive examination | ||
| SE01 | Entry into force of request for substantive examination | ||
| GR01 | Patent grant | ||
| GR01 | Patent grant | ||
| TR01 | Transfer of patent right | Effective date of registration:20250530 Address after:No. 33 Zhongshan West Road, Changning District, Shanghai 200000 Patentee after:Xiao Liquan Country or region after:China Address before:266520 Shandong Province, Qingdao City, Huangdao District, Jialingjiang East Road No. 777, Room 607, School of Information Control Patentee before:Qingdao University of Technology Country or region before:China | |
| TR01 | Transfer of patent right |