CN114820074A - Target user group prediction model construction method based on machine learning - Google Patents
Target user group prediction model construction method based on machine learningDownload PDFInfo
- Publication number
- CN114820074A CN114820074ACN202210528067.7ACN202210528067ACN114820074ACN 114820074 ACN114820074 ACN 114820074ACN 202210528067 ACN202210528067 ACN 202210528067ACN 114820074 ACN114820074 ACN 114820074A
- Authority
- CN
- China
- Prior art keywords
- data
- model
- data set
- positive
- sample
- Prior art date
- Legal status (The legal status is an assumption and is not a legal conclusion. Google has not performed a legal analysis and makes no representation as to the accuracy of the status listed.)
- Pending
Links
Images


Classifications
- G—PHYSICS
- G06—COMPUTING OR CALCULATING; COUNTING
- G06Q—INFORMATION AND COMMUNICATION TECHNOLOGY [ICT] SPECIALLY ADAPTED FOR ADMINISTRATIVE, COMMERCIAL, FINANCIAL, MANAGERIAL OR SUPERVISORY PURPOSES; SYSTEMS OR METHODS SPECIALLY ADAPTED FOR ADMINISTRATIVE, COMMERCIAL, FINANCIAL, MANAGERIAL OR SUPERVISORY PURPOSES, NOT OTHERWISE PROVIDED FOR
- G06Q30/00—Commerce
- G06Q30/02—Marketing; Price estimation or determination; Fundraising
- G06Q30/0201—Market modelling; Market analysis; Collecting market data
- G06Q30/0202—Market predictions or forecasting for commercial activities
- G—PHYSICS
- G06—COMPUTING OR CALCULATING; COUNTING
- G06N—COMPUTING ARRANGEMENTS BASED ON SPECIFIC COMPUTATIONAL MODELS
- G06N20/00—Machine learning
Landscapes
- Engineering & Computer Science (AREA)
- Business, Economics & Management (AREA)
- Strategic Management (AREA)
- Finance (AREA)
- Development Economics (AREA)
- Theoretical Computer Science (AREA)
- Accounting & Taxation (AREA)
- Data Mining & Analysis (AREA)
- Entrepreneurship & Innovation (AREA)
- Software Systems (AREA)
- Physics & Mathematics (AREA)
- General Physics & Mathematics (AREA)
- Computer Vision & Pattern Recognition (AREA)
- General Engineering & Computer Science (AREA)
- Mathematical Physics (AREA)
- Computing Systems (AREA)
- Medical Informatics (AREA)
- Evolutionary Computation (AREA)
- Artificial Intelligence (AREA)
- Game Theory and Decision Science (AREA)
- Economics (AREA)
- Marketing (AREA)
- General Business, Economics & Management (AREA)
- Management, Administration, Business Operations System, And Electronic Commerce (AREA)
Abstract
Translated fromChinese
Description
Translated fromChinese技术领域technical field
本发明涉及用户群体数据分析和预测技术领域,具体涉及一种基于机器学习的目标用户群体预测模型构建方法。The invention relates to the technical field of user group data analysis and prediction, in particular to a method for constructing a target user group prediction model based on machine learning.
背景技术Background technique
目前在用户群体数据分析和预测技术领域内,常用方法是通过固定的数据模型,进行用户分类,在数据模型建立初期,是简单高效的,由于数据模型的静态性,此数据模型会因环境、数据参数、市场等因素的变化,导致准确性越来越低,当发现准确性降低时,通过人为调整大量数据模型又会增加许多工作量,且不能保证数据模型的客观准确。At present, in the field of user group data analysis and prediction technology, the common method is to classify users through a fixed data model. In the early stage of data model establishment, it is simple and efficient. Due to the static nature of the data model, the data model will Changes in data parameters, markets and other factors lead to lower and lower accuracy. When the accuracy is found to be lower, manual adjustment of a large number of data models will increase the workload, and the objective accuracy of the data model cannot be guaranteed.
发明内容SUMMARY OF THE INVENTION
本发明要解决的技术问题是提供一种基于机器学习的目标用户群体预测模型构建方法,用于解决现有数据模型预测结果准确率低和工作量大的问题,实现准确高效的目标用户群体预测。The technical problem to be solved by the present invention is to provide a method for constructing a target user group prediction model based on machine learning, which is used to solve the problems of low accuracy and large workload of the prediction results of the existing data model, and achieve accurate and efficient target user group prediction. .
为解决上述技术问题,本发明采用如下技术方案:In order to solve the above-mentioned technical problems, the present invention adopts the following technical solutions:
设计一种基于机器学习的目标用户群体预测模型构建方法,包括下列步骤:Design a method for building a predictive model for target user groups based on machine learning, including the following steps:
S1.选取或构造样本用户数据集,所述样本用户数据集包括样本的人口属性、兴趣特征、消费特征、位置特征、设备属性、行为数据、社交数据等;S1. Select or construct a sample user data set, the sample user data set includes the population attributes, interest characteristics, consumption characteristics, location characteristics, device attributes, behavior data, social data, etc. of the sample;
S2.对步骤S1得到的目标用户数据集进行数据集的预处理工作,形成用户特征数据集;S2. Carry out data set preprocessing on the target user data set obtained in step S1 to form a user feature data set;
预处理后的用户特征数据集分为两部分,其中70%-90%的数据集作为训练集用来训练模型,10%-30%的数据集作为测试集用来评估模型效果;The preprocessed user feature data set is divided into two parts, of which 70%-90% of the data set is used as a training set to train the model, and 10%-30% of the data set is used as a test set to evaluate the model effect;
S3.基于步骤S2得到的样本用户特征数据集,使用其中70-90%的数据集作为训练集进行模型训练;S3. Based on the sample user feature data set obtained in step S2, use 70-90% of the data set as a training set for model training;
使用决策树CART分析法,采用基尼系数(gini)作为特征划分的度量;预测时,在树的内部节点处用某一属性值进行判断,根据判断结果决定进入哪个分支节点,直到到达叶节点处,得到分类结果;通过CART剪枝算法从完全生长的决策树底端减去一些子树,使决策树模型简化,从而能够对未知数据有更准确的预测;Using the decision tree CART analysis method, the Gini coefficient (gini) is used as a measure of feature division; during prediction, a certain attribute value is used to judge the internal node of the tree, and which branch node to enter is determined according to the judgment result until it reaches the leaf node. , get the classification result; subtract some subtrees from the bottom of the fully grown decision tree through the CART pruning algorithm, so that the decision tree model is simplified, so that the unknown data can be predicted more accurately;
S4.对训练得到的预测模型进行模型评估;S4. Perform model evaluation on the prediction model obtained by training;
基于步骤S3得到的目标用户群体预测模型,使用10-30%的数据集作为测试集用来评估模型效果;Based on the target user group prediction model obtained in step S3, 10-30% of the data set is used as the test set to evaluate the model effect;
模型训练完成之后利用这个模型对测试集进行分类识别,即进行模型评估过程处理,模型评估的指标为:准确率、精确度、召回率和F分数;通过计算对应指标的数值来决定此预测模型是否可投入到实际使用场景;After the model training is completed, the model is used to classify and identify the test set, that is, the model evaluation process is processed. The indicators of the model evaluation are: accuracy, precision, recall and F score; the prediction model is determined by calculating the value of the corresponding indicator. Whether it can be put into actual use scenarios;
S5.将通过步骤S4评估后所得的预测用户模型应用于实际使用场景,输入目标用户特征指标即可得出预测数据。S5. Apply the predicted user model obtained after the evaluation in step S4 to the actual usage scenario, and input the target user characteristic index to obtain the predicted data.
优选的,步骤S1中所述样本数据集的获取方式包括连接数据库单元和数据导入单元两种构建方式,连接数据库单元包含对接用户特征数据库源获取实时数据,数据导入单元是将不同渠道整理所得的历史数据导入至用户特征数据集内。Preferably, the acquisition method of the sample data set in step S1 includes two construction methods: connecting to the database unit and data importing unit, the connecting to the database unit includes connecting to the user feature database source to obtain real-time data, and the data importing unit is obtained by sorting out different channels The historical data is imported into the user feature dataset.
优选的,所述步骤S2中数据集的预处理过程包括:Preferably, the preprocessing process of the data set in the step S2 includes:
S21.使用数据清洗技术消除偏离期望值的数据、纠正同一编码在不同表中出现不同值的错误数据并填充缺失值;S21. Use data cleaning techniques to eliminate data deviating from expected values, correct erroneous data with different values for the same code in different tables, and fill in missing values;
S22.使用数据降维技术,通过线型降维和非线性降维的方式,利用数据的监督方式来达到目标数据的降维效果;S22. Use data dimensionality reduction technology to achieve the dimensionality reduction effect of target data by means of linear dimensionality reduction and nonlinear dimensionality reduction, and use data supervision methods;
S23.使用文本清洗技术,删除冗余特征或聚类消除多余数据;S23. Use text cleaning technology to delete redundant features or cluster to eliminate redundant data;
S24.使用数据离散化技术,降低数据存储所需占用的大量内存空间,为特定的机器学习方法将连续值转换为类别特征;S24. Use data discretization technology to reduce the large amount of memory space required for data storage, and convert continuous values into category features for specific machine learning methods;
S25.使用数据归一化处理技术,对步骤S24处理的特征向量features vector进行归一化处理,数据归一函数使用Sigmoid函数;S25. Use the data normalization processing technology to normalize the feature vector features vector processed in step S24, and the data normalization function uses the Sigmoid function;
通过上述步骤S21-S25,构建目标样本数据集,生成目标用户特征数据集。Through the above steps S21-S25, a target sample data set is constructed, and a target user feature data set is generated.
优选的,所述步骤S4中:Preferably, in the step S4:
准确率为预测正确的结果占总样本的百分比,公式为:准确率=(TP+TN)/(TP+TN+FP+FN),准确率越高则模型也越好;The accuracy rate is the percentage of the correct prediction results in the total sample, the formula is: accuracy rate=(TP+TN)/(TP+TN+FP+FN), the higher the accuracy rate, the better the model;
精确度为所有被预测为正的样本中实际为正的样本的概率,公式为:精确度=TP/(TP+FP),精确度即为识别目标正确的比例;The accuracy is the probability of the actual positive sample among all the predicted positive samples. The formula is: accuracy=TP/(TP+FP), and the accuracy is the correct ratio of the recognition target;
召回率为实际为正的样本中被预测为正样本的概率,其公式为:召回率=TP/(TP+FN),其中实际总正例等于识别对了的正例加上识别错了的负例;The recall rate is the probability that the actual positive samples are predicted to be positive samples. negative example;
其中:TP表示真正,True Positive,为被模型预测为正的正样本数量;Among them: TP means true, True Positive, which is the number of positive samples predicted by the model as positive;
TN表示真负,True Negative,为被模型预测为负的负样本数量;TN stands for true negative, True Negative, which is the number of negative samples predicted by the model to be negative;
FP表示假正,False Positive,为被模型预测为正的负样本数量;FP stands for false positive, False Positive, which is the number of negative samples predicted as positive by the model;
FN表示假负,False Negative,为被模型预测为负的正样本数量;FN stands for False Negative, False Negative, which is the number of positive samples predicted to be negative by the model;
综合评价指标F-Measure又称F-Score,是召回率和精确度的加权调和平均。The comprehensive evaluation index F-Measure, also known as F-Score, is the weighted harmonic average of recall and precision.
优选的,该方法还包括步骤S6:在模型使用过程中,阶段性地搜集数据集,并重新进行步骤S3中的模型训练、步骤S4中的模型评估,从而实现模型的优化和自更新。Preferably, the method further includes step S6: during the use of the model, collect data sets periodically, and re-do the model training in step S3 and the model evaluation in step S4, so as to realize model optimization and self-update.
本发明的有益效果在于:The beneficial effects of the present invention are:
1.本发明技术方案通过数据处理中的数据模型使用的不断优化,动态进行参数的优化和数据处理,并不断优化达到精准预测。1. The technical solution of the present invention dynamically optimizes parameters and data processing through continuous optimization of the use of data models in data processing, and achieves accurate prediction through continuous optimization.
2.与现有人工构建模型的技术相比,利用机器学习的方法,能够加快模型构建的速度,并且可以全天7×24小时不间断运行。2. Compared with the existing artificial model building technology, the machine learning method can speed up the model building speed and can run 7×24 hours a day.
3.通过机器学习的方式,能够避免人为的输入错误、设置错误,减少人为的主观情感判断,从而避免人为干扰,减少错误,达到更高的准确率和精确度。3. Through machine learning, it is possible to avoid human input errors, setting errors, and reduce human subjective emotional judgment, thereby avoiding human interference, reducing errors, and achieving higher accuracy and precision.
4.本发明构建出的基于机器学习的目标用户群体预测模型,适应变化能力强,既能满足快速训练出数据模型以供业务系统使用外,也能根据数据集特点的变化快速演进,避免模型过时。4. The target user group prediction model based on machine learning constructed by the present invention has a strong ability to adapt to changes, which can not only meet the requirements of rapid training of data models for use by business systems, but also can rapidly evolve according to changes in the characteristics of data sets, avoiding model outdated.
附图说明Description of drawings
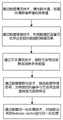
图1是本发明基于机器学习的目标用户群体预测模型构建方法的流程图;Fig. 1 is the flow chart of the target user group prediction model construction method based on machine learning of the present invention;
图2是本发明步骤S2中数据集预处理过程的流程图;Fig. 2 is the flow chart of the data set preprocessing process in step S2 of the present invention;
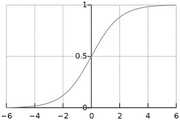
图3是步骤S25中的Sigmoid函数示例图;Fig. 3 is the Sigmoid function example diagram in step S25;
图4为步骤S4中PR曲线的示例图。FIG. 4 is an example diagram of the PR curve in step S4.
具体实施方式Detailed ways
下面结合实施例来说明本发明的具体实施方式,但以下实施例只是用来详细说明本发明,并不以任何方式限制本发明的范围。在以下实施例中所涉及的设备元件如无特别说明,均为常规设备元件。The specific embodiments of the present invention are described below in conjunction with the examples, but the following examples are only used to illustrate the present invention in detail, and do not limit the scope of the present invention in any way. The equipment elements involved in the following embodiments are conventional equipment elements unless otherwise specified.
实施例1:一种基于机器学习的目标用户群体预测模型构建方法,参见图1,包括下列步骤:Embodiment 1: a method for constructing a prediction model for a target user group based on machine learning, see FIG. 1 , including the following steps:
S1.选取或构造样本用户数据集,所述样本用户数据集包括样本的人口属性、兴趣特征、消费特征、位置特征、设备属性、行为数据、社交数据等。S1. Select or construct a sample user data set, where the sample user data set includes demographic attributes, interest characteristics, consumption characteristics, location characteristics, device attributes, behavior data, social data, etc. of the sample.
步骤S1中所述样本数据集的获取方式包括连接数据库单元和数据导入单元两种构建方式,连接数据库单元包含对接用户特征数据库源获取实时数据,数据导入单元是将不同渠道整理所得的历史数据导入至用户特征数据集内。The acquisition method of the sample data set described in the step S1 includes two construction methods, the connection database unit and the data import unit. The connection database unit includes connecting to the user feature database source to obtain real-time data, and the data import unit is to import the historical data obtained by sorting through different channels. into the user feature dataset.
S2.对步骤S1得到的目标用户数据集进行数据集的预处理工作,形成用户特征数据集。S2. Perform data set preprocessing on the target user data set obtained in step S1 to form a user feature data set.
参见图2,数据集的预处理过程包括:Referring to Figure 2, the preprocessing process of the dataset includes:
S21.通过数据清洗技术,填充缺失值,检查并清除噪声值和异常值;S21. Fill in missing values, check and remove noise values and outliers through data cleaning techniques;
使用数据清洗技术消除偏离期望值的数据、纠正同一编码在不同表中出现不同值的错误数据并填充缺失值;Use data cleaning techniques to eliminate data that deviates from expected values, correct erroneous data with different values for the same code in different tables, and fill in missing values;
S22.通过数据降维技术,利用数据的监督方式来达到目标数据的降维效果;S22. Through the data dimensionality reduction technology, the dimensionality reduction effect of the target data is achieved by using the supervision method of the data;
使用数据降维技术,通过线型降维和非线性降维的方式,利用数据的监督方式来达到目标数据的降维效果,一方面可以解决“维数灾难”,缓解信息丰富、知识贫乏的现状,降低复杂度,另一方面可以更好地认识和理解数据。Using data dimensionality reduction technology, through linear dimensionality reduction and nonlinear dimensionality reduction, using data supervision to achieve the dimensionality reduction effect of target data, on the one hand, it can solve the "dimension disaster" and alleviate the current situation of rich information and poor knowledge , reduce the complexity, and on the other hand can better understand and understand the data.
S23.通过文本清洗技术,删除冗余特征或聚类消除多余数据;S23. Remove redundant features or cluster to eliminate redundant data through text cleaning technology;
S24.通过数据离散化技术,降低数据存储空间,为特定的机器学习方法将连续值转换为类别特征;S24. Reduce data storage space through data discretization technology, and convert continuous values into categorical features for specific machine learning methods;
使用数据离散化技术,降低数据存储所需占用的大量内存空间,为特定的机器学习方法将连续值转换为类别特征。Use data discretization techniques to reduce the large amount of memory space required for data storage and convert continuous values into categorical features for specific machine learning methods.
S25.通过数据归一化处理技术,对抽取出来的特征向量features vector进行归一化处理;S25. Normalize the extracted feature vector features vector through data normalization processing technology;
对步骤S24处理后的目标用户样本数据集进行数据归一化处理,数据归一函数使用Sigmoid函数;参见图3,Sigmoid函数是一个具有S形曲线的函数,是良好的阈值函数,在(0,0.5)处中心对称,在(0,0.5)附近有比较大的斜率,而当数据趋向于正无穷和负无穷的时候,映射出来的值就会无限趋向于1和0,根据公式的改变,就可以改变分割阈值。The target user sample data set processed in step S24 is subjected to data normalization processing, and the data normalization function uses the Sigmoid function; referring to Figure 3, the Sigmoid function is a function with an S-shaped curve, which is a good threshold function. , 0.5) is centrally symmetric, and there is a relatively large slope near (0, 0.5), and when the data tends to positive infinity and negative infinity, the mapped value will infinitely tend to 1 and 0. According to the change of the formula , you can change the segmentation threshold.
Sigmoid函数的LaTex公式为:{x}_{normalization}=\frac{1}{1+{e}^{-x}},该函数具有以下基本性质:The LaTex formula of the Sigmoid function is: {x}_{normalization}=\frac{1}{1+{e}^{-x}}, the function has the following basic properties:
定义域:(-∞,+∞)(-∞,+∞);Definition domain: (-∞,+∞)(-∞,+∞);
值域:(-1,1)(-1,1);Value range: (-1,1)(-1,1);
函数在定义域内为连续和光滑函数;The function is continuous and smooth in its domain;
处处可导,导数为:f′(x)=f(x)(1-f(x))。It can be derived everywhere, and the derivative is: f'(x)=f(x)(1-f(x)).
通过上述步骤S21-S21,构建目标样本数据集,生成目标用户特征数据集。Through the above steps S21-S21, a target sample data set is constructed, and a target user feature data set is generated.
预处理后的用户特征数据集分为两部分,其中70-90%的数据集作为训练集用来训练模型,10-30%的数据集作为测试集用来评估模型效果。The preprocessed user feature data set is divided into two parts, of which 70-90% of the data set is used as the training set to train the model, and 10-30% of the data set is used as the test set to evaluate the model effect.
S3.基于步骤S2得到的样本用户特征数据集,使用其中70%-90%的数据集作为训练集进行预测模型训练;S3. Based on the sample user feature data set obtained in step S2, use 70%-90% of the data set as the training set to train the prediction model;
使用决策树CART分析法,采用基尼系数(gini)作为特征划分的度量。预测时,在树的内部节点处用某一属性值进行判断,根据判断结果决定进入哪个分支节点,直到到达叶节点处,得到分类结果。通过CART剪枝算法从完全生长的决策树底端减去一些子树,使决策树模型变简单,从而能够对未知数据有更准确的预测。Using the decision tree CART analysis method, the Gini coefficient (gini) was used as a measure of feature division. When predicting, a certain attribute value is used to judge the internal node of the tree, and which branch node to enter is determined according to the judgment result, until the leaf node is reached, and the classification result is obtained. The decision tree model is simplified by subtracting some subtrees from the bottom of the fully grown decision tree through the CART pruning algorithm, so that more accurate predictions can be made on unknown data.
基于CART算法预测模型步骤为:The steps of the prediction model based on the CART algorithm are:
1、CART分类树生成算法1. CART classification tree generation algorithm
输入:训练数据集D,停止计算的条件;Input: training data set D, the condition to stop the calculation;
输出:CART分类树。Output: CART classification tree.
根据训练数据集D,从根结点开始,递归地对每个结点进行以下操作,构建二叉决策树:According to the training data set D, starting from the root node, recursively perform the following operations on each node to construct a binary decision tree:
(1)设结点的训练数据集为D,计算现有特征对该数据集的基尼指数。此时,对每个特征A,对其可能取的每个值a,根据样本点对A=a的测试为“是”或“否”,将D分割成D1和D2两部分,计算A=a时的基尼指数:(1) Let the training data set of the node be D, and calculate the Gini index of the existing features for this data set. At this time, for each feature A, for each value a that may be taken, according to the test of the sample point to A=a is "Yes" or "No", D is divided into two parts D1 and D2, and A= Gini index at a:

(2)在所有可能的特征A以及它们的所有可能的切分点a中,选择基尼指数最小的特征及其对应的切分点作为最优特征与最优切分点。依最优特征与最优切分点,从现结点生成两个子结点,将训练数据集依特征分配到两个子结点中去。(2) Among all possible features A and all their possible segmentation points a, select the feature with the smallest Gini index and its corresponding segmentation point as the optimal feature and optimal segmentation point. According to the optimal feature and the optimal split point, two sub-nodes are generated from the current node, and the training data set is allocated to the two sub-nodes according to the features.
(3)对两个子结点递归调用(1)和(2),直到满足停止条件(结点中的样本个数小于预定阈值,或样本集的基尼指数小于预定阈值,或没有更多特征)。(3) recursively call (1) and (2) on two child nodes until the stopping condition is satisfied (the number of samples in the node is less than a predetermined threshold, or the Gini index of the sample set is less than a predetermined threshold, or there are no more features) .
(4)生成CART分类树。(4) Generate a CART classification tree.
2、CART剪枝算法2. CART pruning algorithm
输入:CART算法生成的决策树;Input: decision tree generated by CART algorithm;
输出:最优决策树Tα。Output: optimal decision tree Tα .
(1)设k=0,T=T0;(1) Set k=0, T=T0 ;
(2)设α=+∞;(2) Let α=+∞;
(3)自下而上地对各内部结点t计算:对训练数据的预测误差C(Tt),Tt的叶结点个数|Tt|(Tt表示t为根结点的子树),以及:(3) Calculate from bottom to top for each internal node t: the prediction error C(Tt ) for the training data, the number of leaf nodes of Tt |Tt | (Tt indicates that t is the root node subtree), and:

(4)对g(t)=α的内部结点t进行剪枝,并对叶结点t以多数表决法决定其类,得到树T;(4) prune the internal node t with g(t)=α, and determine the class of the leaf node t by majority voting method to obtain the tree T;
(5)设k=k+1,αk=α,Tk=T;(5) Set k=k+1, αk =α, Tk =T;
(6)若Tk不是由根结点及两个叶结点构成的数,则回到步骤(2),否则令Tk=Tn;(6) If Tk is not a number formed by the root node and two leaf nodes, then go back to step (2), otherwise let Tk =Tn ;
(7)采用交叉验证法在子树序列T0,T1,...,Tn中选取最优子树Tα。(7) The optimal subtree Tα is selected from the subtree sequence T0 , T1 , . . . , Tn by using the cross-validation method.
上述模型训练处理完成后,进行模型评估过程处理。After the above model training process is completed, the model evaluation process is performed.
S4.对训练得到的预测模型进行模型评估;S4. Perform model evaluation on the prediction model obtained by training;
基于步骤S3得到的目标用户群体预测模型,使用其中10%-30%的数据集作为测试集用来评估模型效果;模型训练完成之后利用这个模型进行用户群体识别,即进行模型评估过程处理,模型评估的指标为:准确率、精确度P、召回率R和F分数。通过计算对应指标的数值来决定此预测模型是否可投入到实际使用场景。Based on the target user group prediction model obtained in step S3, 10%-30% of the data set is used as the test set to evaluate the model effect; after the model training is completed, the model is used to identify the user group, that is, the model evaluation process is processed. The evaluation indicators are: accuracy, precision P, recall R and F scores. Determine whether the prediction model can be put into actual use scenarios by calculating the values of the corresponding indicators.
首先做如下定义:First make the following definitions:
TP(真正,True Positive)为被模型预测为正的正样本数量;TP (True, True Positive) is the number of positive samples predicted by the model as positive;
TN(真负,True Negative)为被模型预测为负的负样本数量;TN (True Negative, True Negative) is the number of negative samples predicted by the model to be negative;
FP(假正,False Positive)为被模型预测为正的负样本数量;FP (False Positive, False Positive) is the number of negative samples predicted as positive by the model;
FN(假负,False Negative)为被模型预测为负的正样本数量。FN (False Negative) is the number of positive samples predicted to be negative by the model.
准确率为预测正确的结果占总样本的百分比,公式为:准确率=(TP+TN)/(TP+TN+FP+FN),准确率越高则模型也越好。The accuracy rate is the percentage of the correct prediction results in the total sample. The formula is: accuracy rate=(TP+TN)/(TP+TN+FP+FN). The higher the accuracy rate, the better the model.
精确度P为所有被预测为正的样本中实际为正的样本的概率,公式为:精确度=TP/(TP+FP),精确度即为识别目标正确的比例。The accuracy P is the probability of the actual positive sample among all the predicted positive samples, and the formula is: accuracy=TP/(TP+FP), and the accuracy is the correct ratio of the recognition target.
召回率R为实际为正的样本中被预测为正样本的概率,其公式如下:召回率=TP/(TP+FN),其中实际总正例等于识别对了的正例加上识别错了的负例(真正例+伪负例)。其中,正例:所关注的识别目标就是正例。负例:正例以外就是负例。The recall rate R is the probability that the actual positive samples are predicted to be positive samples. The negative example of (true example + pseudo-negative example). Among them, positive example: the recognition target concerned is the positive example. Negative example: Anything other than a positive example is a negative example.
精确度与召回率都与TP值紧密相关,TP值越大,精确度、召回率就越高。理想情况下,精确度、召回率越高越好。但单独的高精确度或高召回率,都不足以体现模型的高性能。Both precision and recall are closely related to the TP value. The larger the TP value, the higher the precision and recall. Ideally, the higher the precision and recall, the better. But high precision or high recall alone are not enough to reflect the high performance of the model.
实际中,精确度与召回率是相互影响的,通常,精确度高时,召回率就会往往偏低,而召回率高时,精确度则会偏低。In practice, precision and recall affect each other. Usually, when the precision is high, the recall is often low, and when the recall is high, the precision is low.
精确度代表目标样本查找的准确率,召回率代表目标对象查找的全面度,若要精确度高,即模型给出的目标都正确,则需提高阈值门槛,阈值提高,符合要求的目标减少,必然会导致召回率降低。The precision represents the accuracy rate of the target sample search, and the recall rate represents the comprehensiveness of the target object search. If the precision is high, that is, the targets given by the model are correct, the threshold threshold needs to be increased, the threshold value is increased, and the number of targets that meet the requirements is reduced. It will inevitably lead to a reduction in the recall rate.
相反,若要召回率高,即目标样本都找到,则需降低阈值门槛,才能查找到所有目标,与此同时会查到到部分伪目标,从而导致精确度降低。On the contrary, if the recall rate is high, that is, if all target samples are found, the threshold threshold needs to be lowered so that all targets can be found. At the same time, some false targets will be found, resulting in lower accuracy.
PR曲线即是以召回率R为横轴,精确度P为纵轴画出的曲线,参见图4。公式为:F1=(2×P×R)/(P+R)。The PR curve is a curve drawn with the recall rate R as the horizontal axis and the precision P as the vertical axis, see Figure 4. The formula is: F1=(2×P×R)/(P+R).
AP(average precision)值,PR曲线下的面积称为AP,表示召回率从0-1的平均精确度值。PR曲线下的面积越大,模型性能则越好。性能优的模型应是在召回率R增长的同时保持精确度P值都在一个较高的水平,而性能较低的模型需要降低P值才能换来R值的提高。AP (average precision) value, the area under the PR curve is called AP, which represents the average precision value of the recall rate from 0-1. The larger the area under the PR curve, the better the model performance. A model with excellent performance should keep the precision P value at a high level while the recall rate R increases, while a model with lower performance needs to reduce the P value in exchange for an increase in the R value.
mAP(Mean Average Precison)值,AP是衡量模型在单个类别上平均精确度的好坏,mAP则是衡量模型在所有类别上平均精确度的好坏,每一个类别对应有一个AP,假设有n个类别,则有n个AP,分别为:AP1,AP2,…,APn,mAP就是取所有类别AP的平均值。mAP (Mean Average Precison) value, AP is a measure of the average accuracy of the model on a single category, mAP is a measure of the average accuracy of the model on all categories, each category corresponds to an AP, assuming there are n For each category, there are n APs, namely: AP1, AP2, ..., APn, mAP is to take the average value of all APs.
综合评价指标F-Measure又称F-Score,是召回率R和精确度P的加权调和平均,能够调和召回率R和精确度P之间增减反向的矛盾。The comprehensive evaluation index F-Measure, also known as F-Score, is a weighted harmonic average of recall rate R and precision P, which can reconcile the contradictory increase and decrease between recall rate R and precision P.
如果模型评估的结果达到预期,则进行步骤S5;如果模型评估的结果未达到预期,则重新进行步骤S1,选取或构造更多的样本用户数据集,基于新的数据集再进行步骤S2-S4,直到模型评估达到预期标准。If the result of model evaluation meets expectations, go to step S5; if the result of model evaluation does not meet expectations, go to step S1 again, select or construct more sample user data sets, and then go to steps S2-S4 based on the new data set , until the model evaluation reaches the expected standard.
S5.将通过步骤S4评估后所得的预测用户模型应用于实际使用场景,输入目标用户指标即可得出预测数据。S5. Apply the predicted user model obtained after the evaluation in step S4 to the actual usage scenario, and input the target user index to obtain the predicted data.
随着模型使用,系统数据集会持续增大,增加的数据集会随着时间的变化和市场形势的变化而变化,在这个过程中,原先训练好的模型的精确度会越来越低。As the model is used, the system data set will continue to increase, and the increased data set will change with time and market conditions. During this process, the accuracy of the previously trained model will become lower and lower.
因此,进一步地,还包括步骤S6:在模型使用过程中,阶段性地搜集数据集,并重新进行步骤S3中的模型训练、步骤S4中的模型评估,从而实现模型的优化和自更新。这一步就是针对数据或者标签的变化或者参数的变化进行的不断优化的过程,也是强化机器学习的深度和数据预测的精准度。Therefore, further, step S6 is included: in the process of using the model, the data sets are collected periodically, and the model training in step S3 and the model evaluation in step S4 are performed again, so as to realize the optimization and self-update of the model. This step is a process of continuous optimization for changes in data or labels or changes in parameters, and it also strengthens the depth of machine learning and the accuracy of data prediction.
本发明适用于某一特定产品或者症状的筛选和确认,也可以用于零售行业进行客户预测用于精准营销;也可以用于对于消费者人群的筛选预测,然后进行匹配营销广告等;也可基于企业涉税/工商/司法/知识产权等信息向第三方提供实时的企业征信预测,辅助政府、银行等三方机构进行决策审批。本发明构建的基于机器学习的目标用户群体预测模型,适应变化能力强,既能满足快速训练出数据模型以供业务系统使用外,也能根据数据集特点的变化快速演进,避免模型过时。The present invention is suitable for the screening and confirmation of a specific product or symptom, and can also be used for customer prediction in the retail industry for precise marketing; it can also be used for screening and prediction of consumer groups, and then matching marketing advertisements, etc.; Provide real-time corporate credit forecasts to third parties based on corporate tax/industrial/judicial/intellectual property and other information, and assist third-party agencies such as the government and banks in decision-making and approval. The target user group prediction model based on machine learning constructed by the present invention has strong adaptability to changes, and can not only meet the requirements of rapidly training data models for use by business systems, but also rapidly evolve according to changes in the characteristics of data sets to avoid model outdated.
上面结合实施例对本发明作了详细的说明,但是所属技术领域的技术人员能够理解,在不脱离本发明宗旨的前提下,还可以对上述实施例中的各个具体参数进行变更,形成多个具体的实施例,均为本发明的常见变化范围,在此不再一一详述。The present invention has been described in detail above in conjunction with the embodiments, but those skilled in the art can understand that, on the premise of not departing from the purpose of the present invention, each specific parameter in the above-mentioned embodiment can also be changed to form a plurality of specific parameters. The embodiments described above are all within the common variation range of the present invention, and will not be described in detail here.
Claims (5)
Priority Applications (1)
| Application Number | Priority Date | Filing Date | Title |
|---|---|---|---|
| CN202210528067.7ACN114820074A (en) | 2022-05-16 | 2022-05-16 | Target user group prediction model construction method based on machine learning |
Applications Claiming Priority (1)
| Application Number | Priority Date | Filing Date | Title |
|---|---|---|---|
| CN202210528067.7ACN114820074A (en) | 2022-05-16 | 2022-05-16 | Target user group prediction model construction method based on machine learning |
Publications (1)
| Publication Number | Publication Date |
|---|---|
| CN114820074Atrue CN114820074A (en) | 2022-07-29 |
Family
ID=82515701
Family Applications (1)
| Application Number | Title | Priority Date | Filing Date |
|---|---|---|---|
| CN202210528067.7APendingCN114820074A (en) | 2022-05-16 | 2022-05-16 | Target user group prediction model construction method based on machine learning |
Country Status (1)
| Country | Link |
|---|---|
| CN (1) | CN114820074A (en) |
Cited By (2)
| Publication number | Priority date | Publication date | Assignee | Title |
|---|---|---|---|---|
| CN115348190A (en)* | 2022-08-17 | 2022-11-15 | 郑州华泰联合工业自动化有限公司 | Internet of things equipment detection method, system and equipment |
| CN115935178A (en)* | 2022-10-26 | 2023-04-07 | 上海数鸣人工智能科技有限公司 | A Predictive Ensemble Modeling Method Based on Unlabeled Sample Learning |
Citations (4)
| Publication number | Priority date | Publication date | Assignee | Title |
|---|---|---|---|---|
| CN110503206A (en)* | 2019-08-09 | 2019-11-26 | 阿里巴巴集团控股有限公司 | A kind of prediction model update method, device, equipment and readable medium |
| US20200202171A1 (en)* | 2017-05-14 | 2020-06-25 | Digital Reasoning Systems, Inc. | Systems and methods for rapidly building, managing, and sharing machine learning models |
| CN113779272A (en)* | 2021-09-15 | 2021-12-10 | 上海泓笛数据科技有限公司 | Data processing method, device and equipment based on knowledge graph and storage medium |
| CN114155025A (en)* | 2021-11-30 | 2022-03-08 | 湖州电力设计院有限公司长兴分公司 | Prediction method of charging lost users of electric vehicle charging station based on random forest |
- 2022
- 2022-05-16CNCN202210528067.7Apatent/CN114820074A/enactivePending
Patent Citations (4)
| Publication number | Priority date | Publication date | Assignee | Title |
|---|---|---|---|---|
| US20200202171A1 (en)* | 2017-05-14 | 2020-06-25 | Digital Reasoning Systems, Inc. | Systems and methods for rapidly building, managing, and sharing machine learning models |
| CN110503206A (en)* | 2019-08-09 | 2019-11-26 | 阿里巴巴集团控股有限公司 | A kind of prediction model update method, device, equipment and readable medium |
| CN113779272A (en)* | 2021-09-15 | 2021-12-10 | 上海泓笛数据科技有限公司 | Data processing method, device and equipment based on knowledge graph and storage medium |
| CN114155025A (en)* | 2021-11-30 | 2022-03-08 | 湖州电力设计院有限公司长兴分公司 | Prediction method of charging lost users of electric vehicle charging station based on random forest |
Non-Patent Citations (2)
| Title |
|---|
| 拉姆什·沙尔达: "商业分析 基于数据科学及人工智能技术的决策支持系统 原书第11版", 30 April 2022, 北京:机械工业出版社, pages: 124 - 127* |
| 方健: "Python项目实战从入门到精通", 30 November 2020, 机械工业出版社, pages: 158 - 162* |
Cited By (2)
| Publication number | Priority date | Publication date | Assignee | Title |
|---|---|---|---|---|
| CN115348190A (en)* | 2022-08-17 | 2022-11-15 | 郑州华泰联合工业自动化有限公司 | Internet of things equipment detection method, system and equipment |
| CN115935178A (en)* | 2022-10-26 | 2023-04-07 | 上海数鸣人工智能科技有限公司 | A Predictive Ensemble Modeling Method Based on Unlabeled Sample Learning |
Similar Documents
| Publication | Publication Date | Title |
|---|---|---|
| Lee et al. | A novel bagging C4. 5 algorithm based on wrapper feature selection for supporting wise clinical decision making | |
| CN114841257B (en) | A small sample target detection method based on self-supervised contrast constraints | |
| CN114678080B (en) | Converter end point phosphorus content prediction model, construction method and phosphorus content prediction method | |
| CN110990718B (en) | Social network model building module of company image lifting system | |
| CN117971808B (en) | Intelligent construction method for enterprise data standard hierarchical relationship | |
| CN109767312A (en) | A credit evaluation model training and evaluation method and device | |
| CN118468061B (en) | Automatic algorithm matching and parameter optimizing method and system | |
| CN112906890A (en) | User attribute feature selection method based on mutual information and improved genetic algorithm | |
| CN114820074A (en) | Target user group prediction model construction method based on machine learning | |
| CN118035440B (en) | Enterprise associated archive management target knowledge feature recommendation method | |
| CN115359857A (en) | Method for predicting PM2.5 concentration based on CART model and optimized RVFLNN model | |
| CN117892091B (en) | Data intelligent analysis method and system based on artificial intelligence | |
| CN119150158B (en) | A method for constructing user portraits for O2O platforms based on deep learning | |
| CN114330716A (en) | A CART decision tree-based method for predicting the employment of college students | |
| CN119939193B (en) | Number correctness evaluation method and system based on machine learning | |
| CN109063983B (en) | A real-time assessment method of natural disaster losses based on social media data | |
| CN108509588B (en) | Lawyer evaluation method and recommendation method based on big data | |
| CN114282875A (en) | Process approval deterministic rules and semantic self-learning combined judgment method and device | |
| CN119377714A (en) | Data clustering method and related methods, devices and storage media | |
| Wang | Big data mining method of marketing management based on deep trust network model | |
| CN117893233A (en) | Regional industry value network analysis method based on heterogeneous graph structure learning | |
| CN115719171A (en) | An Elevator Maintenance Evaluation Method Based on IoT Sensing Data and Gradient Boosting Tree Model | |
| CN114330552A (en) | Quantitative multi-factor credit rating system and method based on classification feature recognition | |
| CN111078882A (en) | Text emotion measuring method and device | |
| CN120045644B (en) | Knowledge graph-based large model answer accuracy enhancement method and system |
Legal Events
| Date | Code | Title | Description |
|---|---|---|---|
| PB01 | Publication | ||
| PB01 | Publication | ||
| SE01 | Entry into force of request for substantive examination | ||
| SE01 | Entry into force of request for substantive examination | ||
| RJ01 | Rejection of invention patent application after publication | Application publication date:20220729 | |
| RJ01 | Rejection of invention patent application after publication |