CN114818519A - Method, system and computer readable medium for predicting bubble collapse of foamed material - Google Patents
Method, system and computer readable medium for predicting bubble collapse of foamed materialDownload PDFInfo
- Publication number
- CN114818519A CN114818519ACN202210754706.1ACN202210754706ACN114818519ACN 114818519 ACN114818519 ACN 114818519ACN 202210754706 ACN202210754706 ACN 202210754706ACN 114818519 ACN114818519 ACN 114818519A
- Authority
- CN
- China
- Prior art keywords
- bubble
- critical point
- particle
- lppl
- point
- Prior art date
- Legal status (The legal status is an assumption and is not a legal conclusion. Google has not performed a legal analysis and makes no representation as to the accuracy of the status listed.)
- Granted
Links
Images


Classifications
- G—PHYSICS
- G06—COMPUTING OR CALCULATING; COUNTING
- G06F—ELECTRIC DIGITAL DATA PROCESSING
- G06F30/00—Computer-aided design [CAD]
- G06F30/20—Design optimisation, verification or simulation
- G06F30/27—Design optimisation, verification or simulation using machine learning, e.g. artificial intelligence, neural networks, support vector machines [SVM] or training a model
- G—PHYSICS
- G06—COMPUTING OR CALCULATING; COUNTING
- G06N—COMPUTING ARRANGEMENTS BASED ON SPECIFIC COMPUTATIONAL MODELS
- G06N3/00—Computing arrangements based on biological models
- G06N3/004—Artificial life, i.e. computing arrangements simulating life
- G06N3/006—Artificial life, i.e. computing arrangements simulating life based on simulated virtual individual or collective life forms, e.g. social simulations or particle swarm optimisation [PSO]
- G—PHYSICS
- G06—COMPUTING OR CALCULATING; COUNTING
- G06F—ELECTRIC DIGITAL DATA PROCESSING
- G06F2119/00—Details relating to the type or aim of the analysis or the optimisation
- G06F2119/14—Force analysis or force optimisation, e.g. static or dynamic forces
Landscapes
- Engineering & Computer Science (AREA)
- Theoretical Computer Science (AREA)
- Physics & Mathematics (AREA)
- Evolutionary Computation (AREA)
- Software Systems (AREA)
- Artificial Intelligence (AREA)
- General Physics & Mathematics (AREA)
- General Engineering & Computer Science (AREA)
- General Health & Medical Sciences (AREA)
- Mathematical Physics (AREA)
- Computational Linguistics (AREA)
- Molecular Biology (AREA)
- Computing Systems (AREA)
- Biophysics (AREA)
- Biomedical Technology (AREA)
- Data Mining & Analysis (AREA)
- Life Sciences & Earth Sciences (AREA)
- Health & Medical Sciences (AREA)
- Computer Vision & Pattern Recognition (AREA)
- Medical Informatics (AREA)
- Computer Hardware Design (AREA)
- Geometry (AREA)
- Management, Administration, Business Operations System, And Electronic Commerce (AREA)
Abstract
Translated fromChinese
Description
Translated fromChinese技术领域technical field
本发明涉及发泡材料技术领域,特别涉及一种预测发泡材料气泡破裂的方法、系统及计算机可读介质。The present invention relates to the technical field of foamed materials, and in particular, to a method, a system and a computer-readable medium for predicting bubble bursting of foamed materials.
背景技术Background technique
发泡塑料制品是由聚合物相与气相组成的多相材料,气体以微球状泡孔形态分布在聚合物基体内。相比于普通塑料制品,这种结构具有许多优异的性能,如重量小、强度高、韧性好、尺寸稳定等。尽管发泡材料具有上述诸多优点,但由于传统发泡的工艺条件以及发泡剂的选择存在局限性,使得发泡材料的泡孔尺寸偏大且分布不均匀。这些大而不均匀的气泡在较大应力作用下容易成为裂纹源,使材料的机械性能下降。同时,传统发泡剂由于具有可燃的特性,还会使发泡过程存在一定的危险,且对环境造成一定程度的破坏。通过研究发泡材料中气泡的形成并预测气泡破裂,提高发泡材料的机械性能具有重要的现实意义。The foamed plastic product is a multi-phase material composed of a polymer phase and a gas phase, and the gas is distributed in the polymer matrix in the form of micro-spherical cells. Compared with ordinary plastic products, this structure has many excellent properties, such as low weight, high strength, good toughness, and dimensional stability. Although the foamed material has many advantages mentioned above, due to the limitations of the traditional foaming process conditions and the selection of the foaming agent, the cell size of the foamed material is too large and the distribution is uneven. These large and uneven bubbles are easy to become crack sources under the action of large stress, which reduces the mechanical properties of the material. At the same time, due to the flammable characteristics of traditional foaming agents, the foaming process will be dangerous to a certain extent, and will cause a certain degree of damage to the environment. It is of great practical significance to improve the mechanical properties of foamed materials by studying the formation of bubbles in foamed materials and predicting the collapse of bubbles.
发明内容SUMMARY OF THE INVENTION
本发明的目的是:针对上述背景技术中存在的不足,提供一种基于粒子群优化算法的对数周期幂律(Particle swarm optimization based log-periodic power law,PSO-LPPL)模型来更好地预测发泡材料气泡破裂。The purpose of the present invention is: for the deficiencies existing in the above-mentioned background technology, a kind of logarithmic periodic power law (Particle swarm optimization based log-periodic power law, PSO-LPPL) model based on particle swarm optimization algorithm is provided to better predict The foam bubbles burst.
为了达到上述目的,本发明提供了一种预测发泡材料气泡破裂的方法,包括如下步骤:In order to achieve the above object, the present invention provides a method for predicting the bubble burst of a foamed material, comprising the following steps:
S1,选择一个样本空间来预测未来时间范围内的气泡破裂临界点,通过提取气泡的面积、当量直径、几何中心、速度、加速度特征参数获取发泡材料的气泡体积数据,作为样本空间;S1, select a sample space to predict the critical point of bubble collapse in the future time range, and obtain the bubble volume data of the foamed material by extracting the characteristic parameters of the area, equivalent diameter, geometric center, velocity, and acceleration of the bubble, as the sample space;
S2,将选择的样本空间进一步划分为多个子区间;S2, further dividing the selected sample space into multiple sub-intervals;
S3,对于每个子区间,采用粒子群优化算法(PSO)拟合对数周期幂律(LPPL)模型中的参数,确立LPPL模型,并获得临界点;S3, for each sub-interval, use particle swarm optimization (PSO) to fit the parameters in the logarithmic periodic power law (LPPL) model, establish the LPPL model, and obtain the critical point;
S4,针对每个子区间的LPPL模型拟合结果,运用Lomb周期图验证LPPL模型拟合的曲线和临界点是否有效,由Lomb周期图验证的转折点为气泡破裂临界点。S4, according to the LPPL model fitting results of each sub-interval, use the Lomb periodogram to verify whether the curve and critical point fitted by the LPPL model are valid, and the turning point verified by the Lomb periodogram is the critical point of bubble collapse.
进一步地,S3中PSO首先在取值范围内随机初始化粒子速度和位置,然后迭代优化,直到满足停止优化目标,得到LPPL模型的非线性参数以及线性参数。Further, in S3, the PSO first randomly initializes the particle velocity and position within the value range, and then iteratively optimizes until the stop optimization objective is satisfied, and the nonlinear parameters and linear parameters of the LPPL model are obtained.
进一步地,S3中临界点的LPPL模型的形式如下:Further, the form of the LPPL model of the critical point in S3 is as follows:

其中,3个线性参数m为幂次加速度,


用PSO求解LPPL模型中的非线性待估参数时,每个候选解为一个粒子,并表示4维空间中的一个点;When using PSO to solve the nonlinear parameters to be estimated in the LPPL model, each candidate solution is a particle and represents a point in the 4-dimensional space;
设4维搜索空间中共有M个粒子,每个粒子i的位置为


其中,


进一步地,S4中运用Lomb周期图测试PSO得到的LPPL模型的周期性频率

Lomb周期图首先预设频率序列


其中,

然后从生成的

进一步地,无效值包括以下情况:Further, invalid values include the following:


本发明还提供了一种预测发泡材料气泡破裂的系统,包括区域划分模块、PSO-LPPL模块、以及Lomb周期图分析模块;The invention also provides a system for predicting bubble bursting of foamed materials, including a region division module, a PSO-LPPL module, and a Lomb periodogram analysis module;
所述区域划分模块用于获得样本空间并将样本空间划分为多个子区间;The area division module is used to obtain a sample space and divide the sample space into a plurality of sub-intervals;
所述PSO-LPPL模块用于拟合各个所述区子区间的LPPL模型,获得每个子区间的临界点;Described PSO-LPPL module is used for fitting the LPPL model of each described district subinterval, obtains the critical point of each subinterval;
所述Lomb周期图分析模块用于验证LPPL模型拟合的曲线和临界点是否有效,验证的转折点为气泡破裂临界点。The Lomb periodogram analysis module is used to verify whether the curve and critical point fitted by the LPPL model are valid, and the verified turning point is the critical point of bubble collapse.
本发明还提供了一种计算机可读存储介质,其上存储有计算机程序,该程序被处理器执行时实现如前所述的预测发泡材料气泡破裂的方法。The present invention also provides a computer-readable storage medium on which a computer program is stored, and when the program is executed by a processor, implements the aforementioned method for predicting the bubble collapse of a foamed material.
本发明提供的预测发泡材料气泡破裂的方法,依据观察到的气泡破裂现象前,许多参数表现出对数周期的功率行为,振荡频率增加,将其拟合到观察结果中,可以准确、提前预测气泡破裂,从而控制发泡材料气泡破裂的过程,有效提高发泡材料的机械性能;According to the method for predicting the bubble bursting of foamed materials provided by the present invention, many parameters show logarithmic cycle power behavior before the observed bubble bursting phenomenon, and the oscillation frequency increases. Predict the bursting of bubbles, so as to control the process of bubble bursting of foamed materials and effectively improve the mechanical properties of foamed materials;
本发明的其它有益效果将在随后的具体实施方式部分予以详细说明。Other beneficial effects of the present invention will be described in detail in the following detailed description section.
附图说明Description of drawings
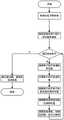
图1为本发明的流程框图;Fig. 1 is the flow chart of the present invention;
图2为本发明的粒子群优化算法流程图;Fig. 2 is the flow chart of the particle swarm optimization algorithm of the present invention;
图3为本发明LPPL模型拟合的曲线及临界点;Fig. 3 is the curve and critical point of LPPL model fitting of the present invention;
图4为本发明Lomb周期图验证气泡破裂转折点。FIG. 4 is the Lomb period diagram of the present invention to verify the turning point of bubble collapse.
具体实施方式Detailed ways
为使本发明要解决的技术问题、技术方案和优点更加清楚,下面将结合附图及具体实施例进行详细描述。显然,所描述的实施例是本发明一部分实施例,而不是全部的实施例。基于本发明中的实施例,本领域普通技术人员在没有做出创造性劳动前提下所获得的所有其他实施例,都属于本发明保护的范围。此外,下面所描述的本发明不同实施方式中所涉及的技术特征只要彼此之间未构成冲突就可以相互结合。In order to make the technical problems, technical solutions and advantages to be solved by the present invention more clear, the following will be described in detail with reference to the accompanying drawings and specific embodiments. Obviously, the described embodiments are some, but not all, embodiments of the present invention. Based on the embodiments of the present invention, all other embodiments obtained by those of ordinary skill in the art without creative efforts shall fall within the protection scope of the present invention. In addition, the technical features involved in the different embodiments of the present invention described below can be combined with each other as long as they do not conflict with each other.
在本发明的描述中,为了简单说明,该方法或规则作为一系列操作来描绘或描述,其目的既不是对实验操作进行穷举,也不是对实验操作的次序加以限制。例如,实验操作可以各种次序进行和/或同时进行,并包括其他再次没有描述的实验操作。此外,所述的步骤不都是在此描述的方法和算法所必备的。本领域技术人员可以认识和理解,这些方法和算法可通过状态图或项目表示为一系列不相关的状态。In the description of the present invention, for simplicity of illustration, the method or rule is depicted or described as a series of operations, and its purpose is neither to be exhaustive nor to limit the order of the experimental operations. For example, experimental operations can be performed in various orders and/or simultaneously, and include other experimental operations not again described. Furthermore, not all of the steps described are necessary for the methods and algorithms described herein. Those skilled in the art will recognize and understand that these methods and algorithms may be represented by a state diagram or project as a series of unrelated states.
本发明涉及气泡破裂预测技术领域,发泡塑料制品是由聚合物相与气相组成的多相材料,气体以微球状泡孔形态分布在聚合物基体内。由于传统发泡的工艺条件以及发泡剂的选择存在局限性,使得发泡材料的泡孔尺寸偏大且分布不均匀。这些大而不均匀的气泡在较大应力作用下容易成为裂纹源,使材料的机械性能下降。同时,传统发泡剂由于具有可燃的特性,还会使发泡过程存在一定的危险,且对环境造成一定程度的破坏。通过研究发泡材料中气泡的形成并预测气泡破裂,提高发泡材料的机械性能具有重要的现实意义。因此,本发明的实施例提供了一种预测发泡材料气泡破裂的方法,旨在解决上述问题。The invention relates to the technical field of bubble burst prediction. A foamed plastic product is a multiphase material composed of a polymer phase and a gas phase, and the gas is distributed in the polymer matrix in the form of microspherical cells. Due to the limitations of traditional foaming process conditions and the selection of foaming agents, the cell size of the foamed material is large and the distribution is uneven. These large and uneven bubbles are easy to become crack sources under the action of large stress, which reduces the mechanical properties of the material. At the same time, due to the flammable characteristics of traditional foaming agents, the foaming process will be dangerous to a certain extent, and will cause a certain degree of damage to the environment. It is of great practical significance to improve the mechanical properties of foamed materials by studying the formation of bubbles in foamed materials and predicting the collapse of bubbles. Therefore, the embodiments of the present invention provide a method for predicting the bubble collapse of a foamed material, aiming to solve the above-mentioned problems.
其中,PSO-LPPL的框架如下图1所示。若气泡破裂前有一个临界点,那么气泡破裂的前兆应该遵循普遍的幂律,这些幂律自然产生于在即将发生的大气泡破裂之前发生的小气泡之间的相互挤压作用。本实施例中的一个重要假设是,大气泡形成过程和破裂前兆现象可以被挑选出来并基本上作为一个孤立的系统进行研究。这相当于将发泡材料中的区域识别为相关空间,该空间可以被认为是足够连贯的。然后,每次小气泡的形成都会挤压发泡材料内部局部区域的空间,也是大气泡破裂的前兆。Among them, the framework of PSO-LPPL is shown in Figure 1 below. If there is a critical point before bubble collapse, then the precursors to bubble collapse should follow general power laws that naturally arise from the mutual squeezing of small bubbles that occurs before the impending collapse of the larger bubble. An important assumption in this example is that the macrobubble formation process and rupture precursor phenomena can be picked out and studied essentially as an isolated system. This is equivalent to identifying regions in the foamed material as relevant spaces that can be considered sufficiently coherent. Then, each time a small bubble is formed, it squeezes the space in the localized area inside the foamed material and is also a precursor to the collapse of the large bubble.
对数周期幂律(LPPL)是一种预测临界点的方法。LPPL模型以其原始形式呈现一个由3个线性和4个非线性参数组成的函数,通过将该函数拟合到序列来估计这些参数。由于必须估计的参数数量相对较多以及方程的强非线性结构,校准LPPL模型一直很困难。因此本方法是一种改进的LPPL预测模型,结合一种称为粒子群优化算法(PSO)的方法来搜索LPPL模型中参数的最优值。相对于常规LPPL模型,改进的LPPL模型在预测临界点方面提供了显着优越的性能。在LPPL模型中,一共有7个待估参数,包括4个非线性参数和3个线性参数。为了拟合该模型,首先将3个线性参数表示为其他非线性参数的函数,将模型的待估参数降至4个,然后采用PSO进行拟合。The log-periodic power law (LPPL) is a method for predicting critical points. The LPPL model in its raw form presents a function of 3 linear and 4 nonlinear parameters, which are estimated by fitting the function to the sequence. Calibrating LPPL models has been difficult due to the relatively large number of parameters that must be estimated and the strongly nonlinear structure of the equations. Therefore, this method is an improved LPPL prediction model, which combines a method called particle swarm optimization (PSO) to search for the optimal values of parameters in the LPPL model. Compared to the conventional LPPL model, the improved LPPL model provides significantly superior performance in predicting critical points. In the LPPL model, there are a total of 7 parameters to be estimated, including 4 nonlinear parameters and 3 linear parameters. In order to fit the model, the 3 linear parameters are first expressed as functions of other nonlinear parameters, the number of parameters to be estimated in the model is reduced to 4, and then PSO is used for fitting.
具体的,该方法包括如下步骤:Specifically, the method includes the following steps:
S1,选择一个样本空间来预测未来时间范围内的气泡破裂临界点。S1, choose a sample space to predict the critical point of bubble collapse in the future time horizon.
其中,样本空间的数据使用的是气泡体积。首先,制作发泡材料试样;然后通过高速摄像机拍摄其中上升气泡的运动过程,高速摄像法是一种非接触式测量方法,可以直观显示气泡的大小及其分布以及气泡的运动过程。分别记录不同直径的气孔所产生的单个气泡上升过程的连续图像,结合数字图像处理技术,提取气泡的面积、当量直径、几何中心、速度、加速度等特征参数;气泡面积为填充图像中气泡连通域中像素的总和,计算公式如下:Among them, the data of the sample space uses the bubble volume. First, a sample of foamed material is made; then the moving process of the rising bubbles is photographed by a high-speed camera. The high-speed camera method is a non-contact measurement method, which can visually display the size and distribution of the bubbles and the movement process of the bubbles. Record the continuous images of the rising process of a single bubble generated by pores of different diameters, and combine with digital image processing technology to extract characteristic parameters such as the area, equivalent diameter, geometric center, velocity, and acceleration of the bubble; the area of the bubble is the connected area of the bubble in the filled image. The sum of the pixels in , the calculation formula is as follows:


其中D为气泡直径。气泡几何中心先对气泡定位,根据图像将属于同一气泡的所有像素点的坐标值相加并求平均,将平均值记为该气泡的位置,具体算法如下:whereD is the bubble diameter. The geometric center of the bubble first locates the bubble. According to the image, the coordinate values of all pixels belonging to the same bubble are added and averaged, and the average value is recorded as the position of the bubble. The specific algorithm is as follows:

其中,


其中


其中
最后在前面得到的相关特征参数的基础上计算气泡体积。在得到的图像中,气泡的边缘检测的图像为白色,气泡边缘为黑色。记录灰度值为0的目标点的坐标为

判断距离r与当量半径的关系大小,如果r>D/2,则把r赋给数列E,否则赋给G;求出数列E,G中所有元素的平均值,分别假设为e,g;结合体积计算公式
S2,将选择的样本空间进一步划分为多个子区间,以避免特定样本空间的偏差以及选择样本空间对预测结果的影响。S2, the selected sample space is further divided into a plurality of sub-intervals to avoid the deviation of a specific sample space and the influence of the selected sample space on the prediction result.
S3,对于每个子区间,采用PSO进行拟合LPPL模型中的参数。PSO首先在取值范围内随机初始化粒子速度和位置,然后迭代优化,直到满足停止优化目标,得到LPPL的非线性参数以及线性参数,LPPL模型以及临界点确立。S3, for each sub-interval, use PSO to fit the parameters in the LPPL model. PSO first randomly initializes the particle velocity and position within the value range, and then iteratively optimizes until the stop optimization objective is met, and obtains the nonlinear and linear parameters of the LPPL, and the LPPL model and critical point are established.
具体地,临界点的LPPL模型的形式如下:Specifically, the LPPL model of the critical point is of the form:

其中,3个线性参数m为幂次加速度,


在实际的拟合中,设定

同时如图2所示,在用PSO求解LPPL模型中的非线性待估参数时,每个候选解称为一个粒子,并表示4维空间中的一个点。At the same time, as shown in Figure 2, when using PSO to solve the nonlinear parameters to be estimated in the LPPL model, each candidate solution is called a particle and represents a point in the 4-dimensional space.
假设4维搜索空间中共有M个粒子,每个粒子i的位置为


其中,


粒子的轨迹依赖于系统对个体和全局最优解的贡献以及这两个学习因子的随机加权,属于半随机过程。The trajectory of the particle depends on the contribution of the system to the individual and global optimal solutions and the random weighting of these two learning factors, which belongs to a semi-random process.
PSO首先在取值范围内随机初始化粒子速度和位置,然后迭代优化,直到满足停止优化目标。根据PSO得到4个非线性参数后,将3个线性参数也表示为其他非线性参数的函数,然后采用PSO进行拟合,3个线性参数也可求得,LPPL模型可确立。其中,
S4,运用Lomb周期图测试PSO得到的LPPL模型的周期性频率

Lomb周期图首先预设频率序列


其中,

然后从生成的
其中,无效值包括以下情况:Among them, invalid values include the following:


S6,对所有子区间的LPPL模型获得的预测临界点进行统计检验,由Lomb周期图分析统计验证的转折点被认为是发泡材料气泡破裂临界点。S6, perform a statistical test on the predicted critical points obtained by the LPPL model of all sub-intervals, and the turning point statistically verified by Lomb periodogram analysis is considered as the critical point of bubble collapse of the foamed material.
Lomb周期图分析方法不仅能够客观地评价临界时间转折点,而且适用于非均匀时间序列。The Lomb periodogram analysis method can not only objectively evaluate critical time turning points, but also be suitable for non-uniform time series.
以下通过具体案例进一步说明本方法的效果,选用的是聚合物微孔发泡材料,是特指泡孔尺寸小于100μm,孔密度大于1.0×10⁶个/cm3的聚合物多孔发泡材料。主要关注的一个过程是希望在气泡消失之前(即模具被填充之前)检查流场的行为和气泡的形状。特别是,提前知道气泡消失点的位置可能很重要,以防止模具中出现不需要的气泡。当气泡接近破裂点时,观察气泡在生长运动过程中的尺寸变化,发现气泡在孔口生长过程中由于受到表面张力作用而呈半球形,随着气体不断注入,气泡向上拉伸,颈部开始向内凹陷,最终体积胀大到一定值后脱离孔口。气泡在上升过程中速度呈现出先增大后趋于稳定的现象,同时气泡由起始的圆球形发展为椭球形,纵横比明显减小。气泡急剧增大的生长过程的变化对应于临界行为,是对数周期震荡和幂律增长的典型特征。The effect of this method is further illustrated by a specific case below. The polymer microcellular foam material is selected, which is a polymer porous foam material with a cell size of less than 100 μm and a pore density of more than 1.0×10⁶ cells/cm3 . One process of primary concern is the desire to examine the behavior of the flow field and the shape of the bubble before the bubble disappears (ie before the mold is filled). In particular, it may be important to know the location of the bubble vanishing point in advance to prevent unwanted bubbles from forming in the mold. When the bubble is close to the breaking point, the size change of the bubble during the growth movement is observed. It is found that the bubble is hemispherical due to the effect of surface tension during the growth of the orifice. As the gas is continuously injected, the bubble stretches upward, and the neck begins to It is concave inward, and the final volume expands to a certain value and then leaves the orifice. During the ascent of the bubbles, the velocity first increases and then tends to be stable. At the same time, the bubbles develop from spherical to ellipsoidal, and the aspect ratio decreases significantly. The changes in the growth process with the sharply enlarged bubbles correspond to critical behavior and are typical of log-periodic oscillations and power-law growth.
由于温度和压力的增加,发泡塑料制品的内部会形成气泡,形成的气泡看作一个组;把这个气泡组分成多个气泡小组;对于每个气泡小组,采用PSO拟合LPPL模型中的参数,PSO首先在气泡小组中随机初始化粒子速度和位置,然后不断迭代优化,直到找到气泡破裂前最频繁发生小气泡体积扩大为大气泡的位置后停止优化目标;根据粒子群优化算法PSO得到LPPL的非线性参数;将3个线性参数也表示为其他非线性参数的函数,然后采用PSO进行拟合求得3个线性参数,确立LPPL模型并获得临界点;通过Lomb周期图分析统计验证的转折点被认为是发泡材料气泡破裂临界点。气泡破裂临界点如图3所示在峰值处,数据模拟出来的各参数的具体数值分别为,A=0.0299,B=-0.4817,C=0.7923,m=0.9000,


气泡破裂的最终崩溃点是对数周期振荡的高潮,从图4中可以看到振荡的Lomb周期图有非常显著的频率峰值。峰值代表着大气泡破裂发生前的小气泡挤压活动异常明显,即将发生大的破裂。通过该方法,可以提前获知可能的气泡破裂临界点并采取措施避免,提高发泡材料的机械性能。The final collapse point of bubble collapse is the climax of the log-periodic oscillation, and from Fig. 4 it can be seen that the Lomb periodogram of the oscillation has a very significant frequency peak. The peak represents that the small bubble extrusion activity before the large bubble collapse is abnormally obvious, and the large collapse is about to occur. Through this method, the possible critical point of bubble collapse can be known in advance and measures can be taken to avoid it, so as to improve the mechanical properties of the foamed material.
基于同一发明构思,本实施例还提供了一种预测发泡材料气泡破裂的系统,包括区域选择模块、PSO-LPPL模块、以及Lomb周期图分析模块;区域选择模块用于获得样本空间并将样本空间划分为多个子区间;PSO-LPPL模块用于拟合各个子区间的对数周期幂律模型,获得每个子区间的临界点;Lomb周期图分析模块用于验证对数周期幂律模型拟合的曲线和临界点是否有效,验证的转折点为气泡破裂临界点。Based on the same inventive concept, this embodiment also provides a system for predicting bubble bursting of foamed materials, including a region selection module, a PSO-LPPL module, and a Lomb periodogram analysis module; the region selection module is used to obtain a sample space and analyze the sample The space is divided into multiple sub-intervals; the PSO-LPPL module is used to fit the log-periodic power-law model of each sub-interval to obtain the critical point of each sub-interval; the Lomb periodogram analysis module is used to verify the log-periodic power-law model fitting Whether the curve and critical point are valid, the turning point of verification is the critical point of bubble collapse.
基于同一发明构思,本实施例还提供了一种计算机可读存储介质,其上存储有计算机程序,该程序被处理器执行时实现前述的预测发泡材料气泡破裂的方法。Based on the same inventive concept, the present embodiment also provides a computer-readable storage medium on which a computer program is stored, and when the program is executed by a processor, implements the aforementioned method for predicting bubble collapse of a foamed material.
该计算机可读介质包括但不限于任何类型的盘(包括软盘、硬盘、光盘、CD-ROM、和磁光盘)、ROM、RAM、EPROM(Erasable Programmable Read-Only Memory,可擦写可编程只读存储器)、EEPROM、闪存、磁性卡片或光线卡片。也就是说,可读介质包括由设备(例如计算机)以能够读的形式存储或传输信息的任何介质。The computer-readable medium includes, but is not limited to, any type of disk (including floppy disk, hard disk, optical disk, CD-ROM, and magneto-optical disk), ROM, RAM, EPROM (Erasable Programmable Read-Only Memory, Erasable Programmable Read-Only Memory) memory), EEPROM, flash memory, magnetic or optical cards. That is, a readable medium includes any medium that stores or transmits information in a form that can be read by a device (eg, a computer).
本实施例提供的系统及计算机可读存储介质,与前述的方法具有相同的发明构思及相同的有益效果,在此不再赘述。The system and the computer-readable storage medium provided in this embodiment have the same inventive concept and the same beneficial effects as the aforementioned method, which will not be repeated here.
以上所述是本发明的优选实施方式,应当指出,对于本技术领域的普通技术人员来说,在不脱离本发明所述原理的前提下,还可以作出若干改进和润饰,这些改进和润饰也应视为本发明的保护范围。The above are the preferred embodiments of the present invention. It should be pointed out that for those skilled in the art, without departing from the principles of the present invention, several improvements and modifications can be made. It should be regarded as the protection scope of the present invention.
Claims (7)
Translated fromChinese


Priority Applications (1)
| Application Number | Priority Date | Filing Date | Title |
|---|---|---|---|
| CN202210754706.1ACN114818519B (en) | 2022-06-30 | 2022-06-30 | Method, system and computer readable medium for predicting bubble collapse of foamed materials |
Applications Claiming Priority (1)
| Application Number | Priority Date | Filing Date | Title |
|---|---|---|---|
| CN202210754706.1ACN114818519B (en) | 2022-06-30 | 2022-06-30 | Method, system and computer readable medium for predicting bubble collapse of foamed materials |
Publications (2)
| Publication Number | Publication Date |
|---|---|
| CN114818519Atrue CN114818519A (en) | 2022-07-29 |
| CN114818519B CN114818519B (en) | 2022-10-11 |
Family
ID=82522919
Family Applications (1)
| Application Number | Title | Priority Date | Filing Date |
|---|---|---|---|
| CN202210754706.1AActiveCN114818519B (en) | 2022-06-30 | 2022-06-30 | Method, system and computer readable medium for predicting bubble collapse of foamed materials |
Country Status (1)
| Country | Link |
|---|---|
| CN (1) | CN114818519B (en) |
Cited By (1)
| Publication number | Priority date | Publication date | Assignee | Title |
|---|---|---|---|---|
| CN116108763A (en)* | 2023-04-13 | 2023-05-12 | 湖南工商大学 | Method for predicting bubble collapse critical point of foaming material based on temperature |
Citations (8)
| Publication number | Priority date | Publication date | Assignee | Title |
|---|---|---|---|---|
| US5043706A (en)* | 1990-10-19 | 1991-08-27 | Eastman Kodak Company | System and method for detecting bubbles in a flowing fluid |
| US20140184496A1 (en)* | 2013-01-03 | 2014-07-03 | Meta Company | Extramissive spatial imaging digital eye glass apparatuses, methods and systems for virtual or augmediated vision, manipulation, creation, or interaction with objects, materials, or other entities |
| CN107563051A (en)* | 2017-08-30 | 2018-01-09 | 南京大学 | Micro-interface enhanced reactor bubble scale structure imitates regulation-control model modeling method |
| CN110705015A (en)* | 2019-08-26 | 2020-01-17 | 中南大学 | Foam improved soil permeability prediction method based on interaction of foam and soil particles |
| KR20200102382A (en)* | 2019-02-21 | 2020-08-31 | 숙명여자대학교산학협력단 | System for detecting underwater bacteria in real time using bubble |
| CN112149238A (en)* | 2019-06-10 | 2020-12-29 | 中国石油天然气股份有限公司 | Method and device for determining floating speed of bubbles in gas-liquid separator |
| US20210192107A1 (en)* | 2019-12-24 | 2021-06-24 | Canon Kabushiki Kaisha | Simulation method, simulation device, and storage device |
| CN114091203A (en)* | 2021-11-25 | 2022-02-25 | 南京林业大学 | A method of crankshaft accelerated fatigue test |
- 2022
- 2022-06-30CNCN202210754706.1Apatent/CN114818519B/enactiveActive
Patent Citations (8)
| Publication number | Priority date | Publication date | Assignee | Title |
|---|---|---|---|---|
| US5043706A (en)* | 1990-10-19 | 1991-08-27 | Eastman Kodak Company | System and method for detecting bubbles in a flowing fluid |
| US20140184496A1 (en)* | 2013-01-03 | 2014-07-03 | Meta Company | Extramissive spatial imaging digital eye glass apparatuses, methods and systems for virtual or augmediated vision, manipulation, creation, or interaction with objects, materials, or other entities |
| CN107563051A (en)* | 2017-08-30 | 2018-01-09 | 南京大学 | Micro-interface enhanced reactor bubble scale structure imitates regulation-control model modeling method |
| KR20200102382A (en)* | 2019-02-21 | 2020-08-31 | 숙명여자대학교산학협력단 | System for detecting underwater bacteria in real time using bubble |
| CN112149238A (en)* | 2019-06-10 | 2020-12-29 | 中国石油天然气股份有限公司 | Method and device for determining floating speed of bubbles in gas-liquid separator |
| CN110705015A (en)* | 2019-08-26 | 2020-01-17 | 中南大学 | Foam improved soil permeability prediction method based on interaction of foam and soil particles |
| US20210192107A1 (en)* | 2019-12-24 | 2021-06-24 | Canon Kabushiki Kaisha | Simulation method, simulation device, and storage device |
| CN114091203A (en)* | 2021-11-25 | 2022-02-25 | 南京林业大学 | A method of crankshaft accelerated fatigue test |
Non-Patent Citations (2)
| Title |
|---|
| 安志波等: "氮气泡沫压裂液体系在水平管段中的流动规律", 《科学技术与工程》* |
| 许星明等: "气泡在幂律流体中长大过程的有限元数值模拟", 《高分子材料科学与工程》* |
Cited By (1)
| Publication number | Priority date | Publication date | Assignee | Title |
|---|---|---|---|---|
| CN116108763A (en)* | 2023-04-13 | 2023-05-12 | 湖南工商大学 | Method for predicting bubble collapse critical point of foaming material based on temperature |
Also Published As
| Publication number | Publication date |
|---|---|
| CN114818519B (en) | 2022-10-11 |
Similar Documents
| Publication | Publication Date | Title |
|---|---|---|
| US11635340B2 (en) | Leakage detection system and method for long petroleum pipeline based on AFPSO-K-means | |
| CN104156984B (en) | PHD (Probability Hypothesis Density) method for multi-target tracking in uneven clutter environment | |
| CN109374986B (en) | Thunder and lightning positioning method and system based on cluster analysis and grid search | |
| CN105392146B (en) | Based on the modified WSN coverage hole detection method of dimensional topography | |
| CN114818519B (en) | Method, system and computer readable medium for predicting bubble collapse of foamed materials | |
| CN114817837B (en) | Troposphere parameter profile inversion method based on buoy platform microwave radiometer | |
| CN112884198A (en) | Dam crest settlement prediction method combining threshold regression and improved support vector machine panel dam | |
| CN109460608B (en) | A Method of Predicting the Deformation of High and Steep Slopes Based on Fuzzy Time Series | |
| CN116611002A (en) | Slope safety coefficient prediction method based on whale algorithm optimization support vector machine | |
| CN117370846A (en) | Hydraulic fracturing three-dimensional fracture network construction method and system based on microseism event | |
| CN115496103B (en) | A fluid pipeline leakage identification method based on improved PSO-LSTSVM in compressed sensing domain | |
| Wang et al. | Bayesian-based optimization of concrete infill pattern for enhancing thermal insulation performance | |
| CN108830043A (en) | Protein function site estimation method based on structural network model | |
| CN105677963A (en) | Method, server and system for constructing porous medium model | |
| CN107273532A (en) | A kind of data stream clustering method based on density and Expanding grid | |
| CN118798057A (en) | Mass concrete temperature prediction method and terminal equipment | |
| WO2019128018A1 (en) | Method for determining wind resource, and apparatus | |
| CN110824478B (en) | Automatic classification method and device for precipitation cloud types based on diversified 3D radar echo characteristics | |
| CN106126571B (en) | The increment type k nearest Neighbor of surface sampled data in kind | |
| CN108920787B (en) | An Analysis Method of Fuzzy Uncertainty of Structure Based on Adaptive Collocation | |
| JP5280864B2 (en) | Completion judgment of computer simulation | |
| CN116108763B (en) | Method for predicting bubble collapse critical point of foaming material based on temperature | |
| CN103177169B (en) | A kind of method and apparatus of the parameter that obtains super material cell structure | |
| CN114004154B (en) | Penetration depth prediction method based on multi-partition model integration | |
| CN118966090B (en) | Airfoil pressure distribution test result densification method |
Legal Events
| Date | Code | Title | Description |
|---|---|---|---|
| PB01 | Publication | ||
| PB01 | Publication | ||
| SE01 | Entry into force of request for substantive examination | ||
| SE01 | Entry into force of request for substantive examination | ||
| GR01 | Patent grant | ||
| GR01 | Patent grant |