CN114783591A - A three-dimensional visualization auxiliary diagnosis system for brain tumors - Google Patents
A three-dimensional visualization auxiliary diagnosis system for brain tumorsDownload PDFInfo
- Publication number
- CN114783591A CN114783591ACN202210428647.9ACN202210428647ACN114783591ACN 114783591 ACN114783591 ACN 114783591ACN 202210428647 ACN202210428647 ACN 202210428647ACN 114783591 ACN114783591 ACN 114783591A
- Authority
- CN
- China
- Prior art keywords
- display
- brain tumor
- model
- module
- dimensional
- Prior art date
- Legal status (The legal status is an assumption and is not a legal conclusion. Google has not performed a legal analysis and makes no representation as to the accuracy of the status listed.)
- Pending
Links
Images


Classifications
- G—PHYSICS
- G16—INFORMATION AND COMMUNICATION TECHNOLOGY [ICT] SPECIALLY ADAPTED FOR SPECIFIC APPLICATION FIELDS
- G16H—HEALTHCARE INFORMATICS, i.e. INFORMATION AND COMMUNICATION TECHNOLOGY [ICT] SPECIALLY ADAPTED FOR THE HANDLING OR PROCESSING OF MEDICAL OR HEALTHCARE DATA
- G16H50/00—ICT specially adapted for medical diagnosis, medical simulation or medical data mining; ICT specially adapted for detecting, monitoring or modelling epidemics or pandemics
- G16H50/20—ICT specially adapted for medical diagnosis, medical simulation or medical data mining; ICT specially adapted for detecting, monitoring or modelling epidemics or pandemics for computer-aided diagnosis, e.g. based on medical expert systems
- G—PHYSICS
- G06—COMPUTING OR CALCULATING; COUNTING
- G06T—IMAGE DATA PROCESSING OR GENERATION, IN GENERAL
- G06T7/00—Image analysis
- G06T7/0002—Inspection of images, e.g. flaw detection
- G06T7/0012—Biomedical image inspection
- G—PHYSICS
- G06—COMPUTING OR CALCULATING; COUNTING
- G06T—IMAGE DATA PROCESSING OR GENERATION, IN GENERAL
- G06T7/00—Image analysis
- G06T7/10—Segmentation; Edge detection
- G06T7/136—Segmentation; Edge detection involving thresholding
- G—PHYSICS
- G06—COMPUTING OR CALCULATING; COUNTING
- G06T—IMAGE DATA PROCESSING OR GENERATION, IN GENERAL
- G06T2207/00—Indexing scheme for image analysis or image enhancement
- G06T2207/10—Image acquisition modality
- G06T2207/10004—Still image; Photographic image
- G06T2207/10012—Stereo images
- G—PHYSICS
- G06—COMPUTING OR CALCULATING; COUNTING
- G06T—IMAGE DATA PROCESSING OR GENERATION, IN GENERAL
- G06T2207/00—Indexing scheme for image analysis or image enhancement
- G06T2207/30—Subject of image; Context of image processing
- G06T2207/30004—Biomedical image processing
- G06T2207/30096—Tumor; Lesion
Landscapes
- Engineering & Computer Science (AREA)
- Health & Medical Sciences (AREA)
- Medical Informatics (AREA)
- Biomedical Technology (AREA)
- Computer Vision & Pattern Recognition (AREA)
- Physics & Mathematics (AREA)
- General Physics & Mathematics (AREA)
- Theoretical Computer Science (AREA)
- General Health & Medical Sciences (AREA)
- Public Health (AREA)
- Nuclear Medicine, Radiotherapy & Molecular Imaging (AREA)
- Quality & Reliability (AREA)
- Data Mining & Analysis (AREA)
- Databases & Information Systems (AREA)
- Pathology (AREA)
- Radiology & Medical Imaging (AREA)
- Epidemiology (AREA)
- Primary Health Care (AREA)
- Image Processing (AREA)
Abstract
Translated fromChinese
Description
Translated fromChinese技术领域technical field
本发明属于脑肿瘤医学影像三维重建技术领域,涉及一种脑肿瘤医学影像三维可视化辅助诊断系统。The invention belongs to the technical field of three-dimensional reconstruction of brain tumor medical images, and relates to a three-dimensional visualization auxiliary diagnosis system for brain tumor medical images.
背景技术Background technique
三维可视化技术与可视化系统在医疗诊疗领域发挥着越来越不可替代的作用。利用三维医学可视化技术,医生可以全面直观地把握肿瘤的形状、大小和位置。方便了医生对肿瘤进行综合观察与分析,但现有的多数三维医学影像系统虽然是三维显示,但是立体显示效果较差,肿瘤与脑组织的区分不明显,且系统的辅助功能不完善,影响医生的诊断效率。3D visualization technology and visualization system are playing an increasingly irreplaceable role in the field of medical diagnosis and treatment. Using 3D medical visualization technology, doctors can fully and intuitively grasp the shape, size and location of tumors. It is convenient for doctors to comprehensively observe and analyze tumors. However, although most of the existing 3D medical imaging systems are 3D display, the stereoscopic display effect is poor, the distinction between tumor and brain tissue is not obvious, and the auxiliary functions of the system are not perfect. Physician's diagnostic efficiency.
发明内容SUMMARY OF THE INVENTION
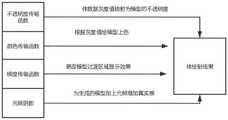
针对现有技术存在的问题,本发明提供了一种脑肿瘤医学影像三维可视化辅助诊断系统。本发明是这样实现的,系统通过新建算法来提取的肿瘤,并将肿瘤与脑组织三维融合绘制实现增强两者区分效果增强模型显示效果的目的,系统还添加了多个功能来辅助诊断。系统设置了文件模块,三维模型模块、传输函数模块、测量模块、显示模块五大模块,其中:Aiming at the problems existing in the prior art, the present invention provides a three-dimensional visualization auxiliary diagnosis system for brain tumor medical images. The present invention is implemented in this way, the system extracts the tumor through a new algorithm, and draws the tumor and brain tissue 3D fusion to achieve the purpose of enhancing the difference between the two and enhancing the display effect of the model, and the system also adds multiple functions to assist diagnosis. The system has set up five modules: file module, 3D model module, transfer function module, measurement module and display module, among which:
文件模块:负责打开与保存文件;File module: responsible for opening and saving files;
三维模型模块:负责对医学图像的三维模型进行操作,内置了模型切割功能用于分割模型来观察大脑内部构造。还内置了切片提取功能用于三个方向提取切片并进行显示。3D model module: It is responsible for operating the 3D model of medical images. The built-in model cutting function is used to segment the model to observe the internal structure of the brain. There is also a built-in slice extraction function for extracting slices in three directions and displaying them.
传输函数调节模块:用于调节三维模型的显示效果包括颜色、不透明度等。Transfer function adjustment module: used to adjust the display effect of the 3D model, including color, opacity, etc.
测量模块:用于测量角度与长度。Measuring module: used to measure angle and length.
显示模块:用于通过显示器显示三个方向的图像与大脑的三维模型。内置了用于提取肿瘤的脑肿瘤提取功能;还内置了脑组织与脑肿瘤进行融合绘制三维融合绘制功能。Display module: used to display images in three directions and the three-dimensional model of the brain through the display. There is a built-in brain tumor extraction function for extracting tumors; it also has a built-in 3D fusion rendering function for fusion rendering of brain tissue and brain tumors.
进一步的,所述脑肿瘤提取功能的算法包括以下步骤:Further, the algorithm of the brain tumor extraction function includes the following steps:
(1)读取脑肿瘤的切片数据;(1) Read the slice data of the brain tumor;
(2)对图像进行幂计算与均值滤波处理,来增强肿瘤特征;(2) Perform power calculation and mean filter processing on the image to enhance tumor characteristics;
(3)采用基于直方图的自适应阈值分割算法先对图像进行预分割;(3) The image is pre-segmented by using the histogram-based adaptive threshold segmentation algorithm;
(4)得到预分割的图像后,选择分割结果中的最大区域;(4) After obtaining the pre-segmented image, select the largest area in the segmentation result;
(5)在最大区域的中心选择区域增长分割的种子点;(5) In the center of the largest region, select the seed point for region growth and segmentation;
(6)将自适应阈值分割计算出的阈值与种子点的灰度值做加减运算作为区域生长法的阈值上下限,进行二次分割掩膜处理。(6) Add and subtract the threshold calculated by the adaptive threshold segmentation and the gray value of the seed point as the upper and lower thresholds of the region growing method, and perform secondary segmentation mask processing.
本发明的另一目的在于通过脑肿瘤医学影像三维重建融合绘制方法增强区分效果,所述脑肿瘤医学影像三维融合绘制的方法包括以下步骤:Another object of the present invention is to enhance the distinguishing effect through a three-dimensional reconstruction and fusion rendering method of a brain tumor medical image, and the method for three-dimensional fusion and rendering of a brain tumor medical image includes the following steps:
第一步:获取医学图像数据。Step 1: Obtain medical image data.
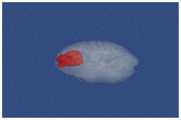
第二步:图像分割处理,基于脑肿瘤提取功能,对脑肿瘤进行分割处理,将脑肿瘤从三维数据中分割出来。The second step: image segmentation processing. Based on the brain tumor extraction function, the brain tumor is segmented, and the brain tumor is segmented from the three-dimensional data.
第三步:三维融合重建,通过面绘制算法算法,重构出上一步分割出来的脑肿瘤的全视角三维立体图像,通过体绘制算法,绘制出脑组织的三维立体图像,最后将两者融合绘制。The third step: 3D fusion reconstruction, reconstruct the full-view 3D stereo image of the brain tumor segmented in the previous step through the surface rendering algorithm, and draw the 3D stereo image of the brain tissue through the volume rendering algorithm, and finally fuse the two draw.
进一步,所述构建三维模型切割功能的方法,通过创建一个切割部件,移动旋转切割部件的对模型进行切割,并将切割后的模型在另外一个窗口进行显示。实现步骤如下:Further, in the method for constructing a three-dimensional model cutting function, a cutting part is created, the model is cut by moving the rotating cutting part, and the cut model is displayed in another window. The implementation steps are as follows:
第一步:定义切割部件,移动时调用回调函数;The first step: define the cutting part, and call the callback function when moving;
第二步:定义回调函数,用于实现在另外一个窗口对切割后的模型进行绘制;Step 2: Define a callback function to draw the cut model in another window;
第三步:设置切割部件的初始位置;Step 3: Set the initial position of the cutting part;
第四步:运行程序,通过鼠标自由控制切割部件的位置,移动切割部件时调用回调函数,实现切割功能。Step 4: Run the program, freely control the position of the cutting part through the mouse, and call the callback function when moving the cutting part to realize the cutting function.
进一步,切片提取功能的实现方法原理为:系统需要首先将二维医学影像序列合成体数据,然后将体数据可以看做是立方体,最后再将图像向三个方向进行投影显示为二维图像。确定数据三个方向的切片数量,依据切片数来确定滑块的最大值。利用Qt的信号槽机制将滑动块位置更改信号关联到函数上,当滑块滑动时就会向函数发射信号从而更改切片位置,模型上会显示插件反映当前提取切片的具体位置。Further, the realization method of the slice extraction function is as follows: the system needs to first synthesize the two-dimensional medical image sequence into volume data, then treat the volume data as a cube, and finally project the image in three directions to display it as a two-dimensional image. Determine the number of slices in the three directions of the data, and determine the maximum value of the slider according to the number of slices. Use Qt's signal slot mechanism to associate the slider position change signal with the function. When the slider slides, it will send a signal to the function to change the slice position. The plug-in will display on the model to reflect the specific position of the currently extracted slice.
进一步,所述构建体绘制传输函数模块实现方式如下:Further, the implementation manner of the construct rendering transfer function module is as follows:
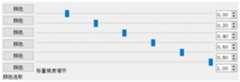
上方设计不透明度与颜色传递界面,分别由6个滑动块,QDoubleSpinBox和颜色选择按钮组成,滑动块可以调节灰度值,后方的QDoubleSpinBox可以调节相应的不透明值。颜色选择按钮会弹出颜色选择对话框,用户选择颜色后,软件将选择的颜色的RBG值输入到颜色传输函数中,实现颜色传输函数的映射。如果用户想更加直观地了解当前传输函数,可以在菜单栏按下相应的传输函数功能按钮,这样会显示传输函数曲线图,传输函数曲线图会同时显示当前灰度值、不透明度、颜色三者的映射关系。The opacity and color transfer interface is designed above, which consists of 6 sliders, QDoubleSpinBox and color selection buttons. The slider can adjust the gray value, and the rear QDoubleSpinBox can adjust the corresponding opacity value. The color selection button will pop up a color selection dialog box. After the user selects a color, the software inputs the RBG value of the selected color into the color transfer function to realize the color transfer function mapping. If the user wants to understand the current transfer function more intuitively, he can press the corresponding transfer function function button in the menu bar, which will display the transfer function curve graph, which will simultaneously display the current gray value, opacity, and color. mapping relationship.
下方的参数调节界面用来调整光照强度与梯度不透明度函数,光照调节组件由三个QDoubleSpinBox组成,由上至下负责调节环境光、散射光、反射光。梯度调节界面由三个滑动块和QDoubleSpinBox组成,滑动块对应模型的梯度值,后面的QDoubleSpinBox用来调整不透明度。The parameter adjustment interface below is used to adjust the light intensity and gradient opacity function. The light adjustment component consists of three QDoubleSpinBoxes, which are responsible for adjusting ambient light, scattered light, and reflected light from top to bottom. The gradient adjustment interface consists of three sliders and QDoubleSpinBox. The slider corresponds to the gradient value of the model, and the latter QDoubleSpinBox is used to adjust the opacity.
进一步,测量模块的实现:Further, the implementation of the measurement module:
系统采用交互式测量的方法,交互式测量要求用户通过鼠标拾取的方法获取空间中两个测量点的坐标值,求取两个点之间的欧氏距离。将计算的结果显示到线的上方即为感兴趣的组织和器官之间的距离。同时,可通过鼠标的拖动将图中的十字架进行任意角度的拖曳,以测量其他组织和器官之间的角度,从而达到交互式测量的目的。The system adopts the method of interactive measurement. Interactive measurement requires the user to obtain the coordinate values of two measurement points in the space by picking up the mouse, and to obtain the Euclidean distance between the two points. Displaying the calculated result above the line is the distance between the tissue and organ of interest. At the same time, the cross in the figure can be dragged at any angle by dragging the mouse to measure the angle between other tissues and organs, so as to achieve the purpose of interactive measurement.
本发明的优点及积极效果为:The advantages and positive effects of the present invention are:
1.本发明通过图像提取功能能够实现全自动脑部肿瘤区域分割提取;通过三维模型的构建对脑肿瘤区域进行还原,模拟操作更方便,真实性更好,脑肿瘤与脑组织的融合绘制,使两者的区分效果更加明显。1. The present invention can realize automatic segmentation and extraction of brain tumor region through the image extraction function; restore the brain tumor region through the construction of a three-dimensional model, the simulation operation is more convenient, the authenticity is better, and the fusion rendering of brain tumor and brain tissue, Make the difference between the two more obvious.
2.本发明创建了传输函数动调节界面,优点是用户自己可以根据需要自由调节传输函数,调节模型的显示效果,满足不同的需求。2. The present invention creates a transfer function dynamic adjustment interface, which has the advantage that the user can freely adjust the transfer function as required, adjust the display effect of the model, and meet different needs.
3.本发明添加了模型分割功能,可以对图像进行分割操作来观察模型内部结构。3. The present invention adds a model segmentation function, which can perform image segmentation operations to observe the internal structure of the model.
4.显示模块可以同时观察到三视图的图像信息,来更加便捷的诊断病情,实现了矢状面、冠状面和横断面图像的显示。4. The display module can observe the image information of three views at the same time, to diagnose the disease more conveniently, and realize the display of sagittal, coronal and cross-sectional images.
5.测量模块可以精准测量组织的长度与角度。5. The measurement module can accurately measure the length and angle of the tissue.
6.系统功能完善,绘制效果清晰,肿瘤与脑组织的区分效果明显。6. The function of the system is perfect, the drawing effect is clear, and the difference between tumor and brain tissue is obvious.
附图说明Description of drawings
图1系统UI界面Figure 1 System UI interface
图2系统的功能分布Figure 2 Functional distribution of the system
图3肿瘤提取流程图Figure 3 Flow chart of tumor extraction
图4肿瘤提取效果图Figure 4 Tumor extraction effect diagram
图5融合绘制流程图Figure 5 Fusion rendering flowchart
图6三维融合绘制效果图Figure 6 3D fusion rendering renderings
图7切割插件Figure 7 Cutting Insert
图8切割原理流程图Figure 8 Flow chart of cutting principle
图9模型切割效果图Figure 9 Model cutting effect diagram
图10传输函数关系图Figure 10. Transfer function diagram
图11传输函数调节界面Figure 11 Transfer function adjustment interface
图12不透明度与颜色调节界面Figure 12 Opacity and color adjustment interface
图13灰度值、不透明度与颜色映射关系曲线Figure 13 The relationship between gray value, opacity and color mapping
图14光照与梯度调节界面Figure 14 Lighting and gradient adjustment interface
图15测量流程图Figure 15 Measurement flow chart
图16测量结果Figure 16 Measurement results
图17切片提取流程图Figure 17 Slice extraction flow chart
图18切片提取效果图Figure 18 Slice extraction renderings
具体实施方式Detailed ways
现结合实例、附图对本发明作进一步描述:Now in conjunction with example, accompanying drawing the present invention is further described:
系统界面,如图1所示,人机交互系统的UI界面,由三个大部分组成:菜单界面,功能调节界面与视图界面,软件最上方是相应的菜单内置不同功能子菜单1。功能调节界面最上方为体绘制传输函数曲线界面3,点击传输函数功能按钮后会展示当前体绘制的传输函数映射曲线,下面是不透明度与颜色调节界面4,再下方为信息展示界面5,显示当前序列影像的页数、长度、宽度等信息,也可以将测量的距离与角度的大小以及像素单位等信息展示出来,方便使用者了解当前操作的具体信息。最下面则是梯度与光照调节界面6用于调节人体绘制的梯度传输函数与光照强度。The system interface, as shown in Figure 1, the UI interface of the human-computer interaction system consists of three major parts: the menu interface, the function adjustment interface and the view interface. The top of the software is the corresponding menu built-in submenu with different functions. The top of the function adjustment interface is the volume rendering transfer function curve interface 3. After clicking the transfer function function button, the current volume rendering transfer function mapping curve will be displayed. The following is the opacity and color adjustment interface 4, and the bottom is the information display interface 5. Display Information such as the number of pages, length, and width of the current sequence of images can also be displayed, as well as information such as the measured distance, angle, and pixel unit, so that the user can understand the specific information of the current operation. At the bottom is the gradient and illumination adjustment interface 6 for adjusting the gradient transfer function and illumination intensity of the human body rendering.
显示界面2,系统设置了四个分界面,分别为(从左到右,从上到下)体绘制三维模型展示界面(第一分界面),冠状面展示界面(第二分界面)、矢状面展示界面(第三分界面)、横断面展示界面(第四分界面),在每一分界面下均有一滑动块,使用切片功能时,可以通过滑块调节显示的切片位置。Display interface 2, the system sets four interfaces, namely (from left to right, top to bottom) volume rendering 3D model display interface (first interface), coronal plane display interface (second interface), vector There is a sliding block under each interface, and the displayed slice position can be adjusted by the slider when using the slicing function.
系统功能设计了五个大部分,系统的功能分布如图2所示:文件功能部分负责文件的打开与保存功能,文件打开目前支持nii.gz、dicom、mhd三种格式的文件,文件保存支持使用面绘制算法绘制的模型进行保存。三维模型功能部分主要负责用户旋转、放大、切割模型以及模型的切片提取,来帮助使用者更好的观察模型结构及其内部构造。测量功能部分支持角度与长度的测量。体绘制传输调节功能负责调节模型显示效果可以使用户在梯度、不透明度、颜色、光照四个方面调节体绘制模型的显示效果。The system function is designed with five major parts. The function distribution of the system is shown in Figure 2. The file function part is responsible for the file opening and saving functions. File opening currently supports files in three formats: nii.gz, dicom, and mhd, and file saving supports Save the model drawn using the face drawing algorithm. The 3D model function part is mainly responsible for the user to rotate, enlarge, cut the model and extract the slice of the model to help the user better observe the model structure and its internal structure. The measurement function part supports the measurement of angle and length. The volume rendering transmission adjustment function is responsible for adjusting the display effect of the model, which enables the user to adjust the display effect of the volume rendering model in four aspects: gradient, opacity, color, and illumination.
肿瘤提取功能使用:The tumor extraction function uses:
点击冠状面、矢状面或者横断面下方的分割按钮,启动肿瘤提取模块,肿瘤提取模块通过系统分割算法对影像进行分割操作。Click the segmentation button below the coronal plane, sagittal plane or transverse plane to start the tumor extraction module, which will segment the image through the system segmentation algorithm.
系统分割算法具体实现步骤如下:The specific implementation steps of the system segmentation algorithm are as follows:
(1)读取脑肿瘤的切片数据;(1) Read the slice data of the brain tumor;
(2)对图像进行幂计算数据增强与均值滤波处理,来增强肿瘤特征;(2) Perform power calculation data enhancement and mean filter processing on the image to enhance tumor characteristics;
(3)采用基于直方图的自适应阈值分割算法先对图像进行预分割;(3) The image is pre-segmented by using the histogram-based adaptive threshold segmentation algorithm;
(4)得到预分割的图像后,选择分割结果中的最大区域;(4) After obtaining the pre-segmented image, select the largest area in the segmentation result;
(5)在最大区域的中心选择区域增长分割的种子点;(5) In the center of the largest region, select the seed point for region growth and segmentation;
(6)将自适应阈值分割计算出的阈值与种子点的灰度值做加减运算作为区域生长法的阈值上下限,进行二次分割掩膜处理。(6) Add and subtract the threshold calculated by the adaptive threshold segmentation and the gray value of the seed point as the upper and lower thresholds of the region growing method, and perform secondary segmentation mask processing.
流程图如图3所示,得到最终分割结果如图4所示。The flowchart is shown in Figure 3, and the final segmentation result is shown in Figure 4.
三维融合绘制模块使用:The 3D fusion rendering module uses:
需要首先使用肿瘤提取模块,然后点击体绘制下方的融合重建按钮,启动三维融合重建模块。三维融合重建过程包含三个方面:医学序列图像的读取、肿瘤图像的分割、三维重融合绘制。具体步骤如下:You need to use the tumor extraction module first, and then click the fusion reconstruction button below the volume rendering to start the 3D fusion reconstruction module. The 3D fusion reconstruction process includes three aspects: the reading of medical sequence images, the segmentation of tumor images, and the 3D refusion rendering. Specific steps are as follows:
第一步:医学图像数据的获取。The first step: the acquisition of medical image data.
第二步:图像分割处理,基于系统的分割功能,对脑肿瘤进行分割处理,将脑肿瘤从三维数据中分割出来。The second step: image segmentation processing, based on the segmentation function of the system, the brain tumor is segmented, and the brain tumor is segmented from the three-dimensional data.
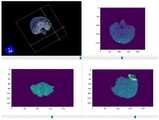
第三步:三维融合重建,首先使用面绘制算法,重构出上一步分割出来的脑肿瘤的全视角三维立体图像,再通过体绘制算法,绘制出脑组织的三维立体图像,最后将两者融合绘制。基本流程如图5所示,绘制结构如图6所示。The third step: 3D fusion reconstruction, first use the surface rendering algorithm to reconstruct the full-view 3D stereo image of the brain tumor segmented in the previous step, then use the volume rendering algorithm to draw the 3D stereo image of the brain tissue, and finally combine the two Fusion drawing. The basic process is shown in Figure 5, and the drawing structure is shown in Figure 6.
三维模型切割模块的使用:Use of 3D model cutting module:
打开文件后,点击体绘制下方的切割按钮,就会在屏幕上创建一个可以交互式放置的平面,如图7所示。通过控制此平面的任意地移动和旋转平面,这样就会生成各种不同角度和方向的平面,程序会将生成的平面数据输入到切割模型的函数中,这样就可以实现实时交互切割三维模型,切割流程图如图8所示,具体步骤如下:After opening the file, click the cut button below the volume rendering to create a plane on the screen that can be placed interactively, as shown in Figure 7. By controlling the arbitrary movement and rotation of this plane, various planes with different angles and directions will be generated, and the program will input the generated plane data into the function of cutting model, so that real-time interactive cutting of 3D models can be realized. The cutting flow chart is shown in Figure 8, and the specific steps are as follows:
第一步:定义切割部件,移动时调用回调函数;The first step: define the cutting part, and call the callback function when moving;
第二步:读取脑部医学影像序列并进行三维重建;通过类函数VTkPlane创建切割平面实体,将切割平面实体的位置与切割部件的位置绑定起来;The second step: read the brain medical image sequence and perform 3D reconstruction; create a cutting plane entity through the class function VTkPlane, and bind the position of the cutting plane entity to the position of the cutting part;
第三步:定义回调函数,调用时实现切割模型的绘制;The third step: define the callback function, and realize the drawing of the cutting model when it is called;
第四步:设置切割部件的初始位置;Step 4: Set the initial position of the cutting part;
第五步:运行程序,通过鼠标自由控制切割部件的位置,移动切割部件时调用回调函数,实现切割功能。Step 5: Run the program, freely control the position of the cutting part through the mouse, and call the callback function when moving the cutting part to realize the cutting function.
分割过程与结果如图9所示。The segmentation process and results are shown in Figure 9.
传输函数模块调用:Transfer function module call:
体绘制传输函数模块如图11所示,分为不透明度传输函数、梯度不透明度传输函数、颜色传输函数和光照阴影设置四个方面,不同的传输函数有不同的效果,关系如图10所示。The volume rendering transfer function module is shown in Figure 11, which is divided into four aspects: opacity transfer function, gradient opacity transfer function, color transfer function and light and shadow settings. Different transfer functions have different effects, and the relationship is shown in Figure 10 .
系统根据体绘制传输函数的特点,开发了传输函数调节模块不透明度与颜色传递界面,如图12所示,分别由6个滑动块,QDoubleSpinBox和颜色选择按钮组成,滑动块可以调节灰度值,后方的QDoubleSpinBox可以调节相应的不透明值。颜色选择按钮会弹出颜色选择对话框,用户选择颜色后,软件将选择的颜色的RBG值输入到颜色传输函数中,实现颜色传输函数的映射。如果用户想更加直观地了解当前传输函数,可以在菜单栏点击相应的传输函数功能按钮,这样会显示传输函数曲线图,如图13所示,为传输函数曲线图该曲线图会同时显示当前灰度值、不透明度、颜色三者的映射关系。According to the characteristics of the volume rendering transfer function, the system develops the opacity and color transfer interface of the transfer function adjustment module, as shown in Figure 12, which consists of 6 sliders, QDoubleSpinBox and color selection buttons. The slider can adjust the gray value, The rear QDoubleSpinBox can adjust the corresponding opacity value. The color selection button will pop up a color selection dialog box. After the user selects a color, the software inputs the RBG value of the selected color into the color transfer function to realize the color transfer function mapping. If the user wants to understand the current transfer function more intuitively, he can click the corresponding transfer function function button in the menu bar, which will display the transfer function curve graph, as shown in Figure 13, for the transfer function curve graph, the curve graph will also display the current grayscale The mapping relationship between degree value, opacity, and color.
下方的参数调节界面用来调整光照强度与梯度不透明度函数,如图14所示,光照调节组件由三个QDoubleSpinBox组成,由上至下负责调节环境光、散射光、反射光。梯度调节界面由三个滑动块和QDoubleSpinBox组成,滑动块对应模型的梯度值,后面的QDoubleSpinBox用来调整不透明度。The parameter adjustment interface below is used to adjust the light intensity and gradient opacity function. As shown in Figure 14, the light adjustment component consists of three QDoubleSpinBoxes, which are responsible for adjusting ambient light, scattered light, and reflected light from top to bottom. The gradient adjustment interface consists of three sliders and QDoubleSpinBox. The slider corresponds to the gradient value of the model, and the latter QDoubleSpinBox is used to adjust the opacity.
长度与角度测量模块使用:The length and angle measurement module uses:
系统的交互式测量要求用户通过鼠标拾取的方法获取空间中两个测量点的坐标值,求取两个点之间的欧氏距离,将计算的结果显示到线的上方即为感兴趣的组织和器官之间的距离。同时,可通过鼠标的拖动将图中的十字架进行任意角度的拖曳,以测量其他组织和器官之间的角度,从而达到交互式测量的目的。The interactive measurement of the system requires the user to obtain the coordinate values of two measurement points in the space by picking up the mouse, obtain the Euclidean distance between the two points, and display the calculated result above the line, which is the tissue of interest. distance from the organ. At the same time, the cross in the figure can be dragged at any angle by dragging the mouse to measure the angle between other tissues and organs, so as to achieve the purpose of interactive measurement.
长度流程图与角度流程图如图15所示。在评估一些比较复杂的情况时,需要对各个相关结构之间的角度关系进行测量分析;角度测量与长度测量的流程相似,测量流程如图15所示。长度角度测量的模型结果如图16所示。The length flow chart and angle flow chart are shown in Figure 15. When evaluating some complex situations, it is necessary to measure and analyze the angular relationship between various related structures; the process of angle measurement is similar to that of length measurement, and the measurement process is shown in Figure 15. The model results for the length angle measurement are shown in Figure 16.
切片提取功能调用:Slice extraction function call:
系统可以实现三个方向的切片的提取。要实现这个功能,首先需要编写一个回调函数VTKIPWCALLBACK用于滑动块可以调整切片的位置,然后使用插件显示所提取的切片在三维模型中的位置,最后在系统显示界面中来显示三个方向的切片图像,切片提取模块的功能实现流程图如图17所示。The system can realize the extraction of slices in three directions. To achieve this function, you first need to write a callback function VTKIPWCALLBACK for the slider to adjust the position of the slice, then use the plug-in to display the position of the extracted slice in the 3D model, and finally display the slice in three directions in the system display interface The function realization flow chart of the image and slice extraction module is shown in Figure 17.
第一步:实例化VTKImagePlaneWidget类来定义插件,类中定义函数SetSlicePosition用来调整插件的位置。The first step: instantiate the VTKImagePlaneWidget class to define the plug-in. The function SetSlicePosition is defined in the class to adjust the position of the plug-in.
第二步:读取医学影像序列三个方向的切片数量,依据切片数来确定滑动块的最大值,移动滑动块时,调用回调函数VTKIPWCALLBACK。Step 2: Read the number of slices in the three directions of the medical image sequence, determine the maximum value of the slider according to the number of slices, and call the callback function VTKIPWCALLBACK when the slider is moved.
第三步:利用Qt的信号槽机制将滑动块位置更改信号关联到SetSlicePos-ition上,当滑块滑动时就会向函数发射信号更改插件的位置与切片的提取位置。Step 3: Use Qt's signal slot mechanism to associate the slider position change signal with SetSlicePos-ition. When the slider slides, it will send a signal to the function to change the position of the plug-in and the extraction position of the slice.
功能使用:点击切片按钮后,三个窗口会显示不同的切面,第二窗口切面是冠状面;第三窗口切面是矢状面;第四窗口切面是横断面。移动相应的窗口下方的滑动块就可以改变切片,模型上会显示插件反映当前显示切片的提取位置,实现结果如图18所示。Function usage: After clicking the slice button, three windows will display different slices, the second window slice is the coronal plane; the third window slice is the sagittal plane; the fourth window slice is the transverse plane. The slice can be changed by moving the slider at the bottom of the corresponding window. The plug-in will be displayed on the model to reflect the extraction position of the currently displayed slice. The result is shown in Figure 18.
以上所述仅是对本发明的较佳实施例而已,并非对本发明作任何形式上的限制,凡是依据本发明的技术实质对以上实施例所做的任何简单修改,等同变化与修饰,均属于本发明技术方案的范围内。The above is only the preferred embodiment of the present invention, and does not limit the present invention in any form. Any simple modifications, equivalent changes and modifications made to the above embodiments according to the technical essence of the present invention belong to the present invention. within the scope of the technical solution of the invention.
Claims (6)
Translated fromChinesePriority Applications (1)
| Application Number | Priority Date | Filing Date | Title |
|---|---|---|---|
| CN202210428647.9ACN114783591A (en) | 2022-04-22 | 2022-04-22 | A three-dimensional visualization auxiliary diagnosis system for brain tumors |
Applications Claiming Priority (1)
| Application Number | Priority Date | Filing Date | Title |
|---|---|---|---|
| CN202210428647.9ACN114783591A (en) | 2022-04-22 | 2022-04-22 | A three-dimensional visualization auxiliary diagnosis system for brain tumors |
Publications (1)
| Publication Number | Publication Date |
|---|---|
| CN114783591Atrue CN114783591A (en) | 2022-07-22 |
Family
ID=82430355
Family Applications (1)
| Application Number | Title | Priority Date | Filing Date |
|---|---|---|---|
| CN202210428647.9APendingCN114783591A (en) | 2022-04-22 | 2022-04-22 | A three-dimensional visualization auxiliary diagnosis system for brain tumors |
Country Status (1)
| Country | Link |
|---|---|
| CN (1) | CN114783591A (en) |
Cited By (3)
| Publication number | Priority date | Publication date | Assignee | Title |
|---|---|---|---|---|
| CN115346032A (en)* | 2022-08-16 | 2022-11-15 | 珠海赛纳数字医疗技术有限公司 | Display method, device, equipment and storage medium |
| CN117218150A (en)* | 2023-09-12 | 2023-12-12 | 厦门大学 | Quantitative analysis method for spleen white spot infection degree of large yellow croaker based on machine learning |
| CN118448056A (en)* | 2024-05-20 | 2024-08-06 | 暨南大学附属第一医院(广州华侨医院) | A system for building a visual model of brain tumors based on network search and machine learning |
Citations (11)
| Publication number | Priority date | Publication date | Assignee | Title |
|---|---|---|---|---|
| CN1518719A (en)* | 2001-04-23 | 2004-08-04 | 西门子共同研究公司 | Method and system for automatically detecting lung nodules from multi-slice high resolution computed tomography (MSHR CT) images |
| US20070276214A1 (en)* | 2003-11-26 | 2007-11-29 | Dachille Frank C | Systems and Methods for Automated Segmentation, Visualization and Analysis of Medical Images |
| CN102982238A (en)* | 2012-11-13 | 2013-03-20 | 深圳市环球博洋机电科技有限公司 | Three-dimensional kidney neoplasm surgery simulation method and platform based on computed tomography (CT) film |
| CN104599270A (en)* | 2015-01-18 | 2015-05-06 | 北京工业大学 | Breast neoplasms ultrasonic image segmentation method based on improved level set algorithm |
| CN105005998A (en)* | 2015-08-05 | 2015-10-28 | 大连理工大学 | Cerebrovascular image segmentation method based on multi-angle serialized image space feature point set |
| CN108986106A (en)* | 2017-12-15 | 2018-12-11 | 浙江中医药大学 | Retinal vessel automatic division method towards glaucoma clinical diagnosis |
| CN111815663A (en)* | 2020-06-29 | 2020-10-23 | 浙江工贸职业技术学院 | Hepatic vessel segmentation system based on Hessian matrix and gray scale method |
| CN111932665A (en)* | 2020-06-15 | 2020-11-13 | 浙江工贸职业技术学院 | Hepatic vessel three-dimensional reconstruction and visualization method based on vessel tubular model |
| CN112150477A (en)* | 2019-11-15 | 2020-12-29 | 复旦大学 | Brain imaging arterial automatic segmentation method and device |
| CN112233791A (en)* | 2020-10-16 | 2021-01-15 | 东北大学 | Device and method for preparing mammary gland prosthesis based on point cloud data clustering |
| CN113658193A (en)* | 2021-07-08 | 2021-11-16 | 西安理工大学 | A tumor segmentation method in liver CT images based on information fusion |
- 2022
- 2022-04-22CNCN202210428647.9Apatent/CN114783591A/enactivePending
Patent Citations (11)
| Publication number | Priority date | Publication date | Assignee | Title |
|---|---|---|---|---|
| CN1518719A (en)* | 2001-04-23 | 2004-08-04 | 西门子共同研究公司 | Method and system for automatically detecting lung nodules from multi-slice high resolution computed tomography (MSHR CT) images |
| US20070276214A1 (en)* | 2003-11-26 | 2007-11-29 | Dachille Frank C | Systems and Methods for Automated Segmentation, Visualization and Analysis of Medical Images |
| CN102982238A (en)* | 2012-11-13 | 2013-03-20 | 深圳市环球博洋机电科技有限公司 | Three-dimensional kidney neoplasm surgery simulation method and platform based on computed tomography (CT) film |
| CN104599270A (en)* | 2015-01-18 | 2015-05-06 | 北京工业大学 | Breast neoplasms ultrasonic image segmentation method based on improved level set algorithm |
| CN105005998A (en)* | 2015-08-05 | 2015-10-28 | 大连理工大学 | Cerebrovascular image segmentation method based on multi-angle serialized image space feature point set |
| CN108986106A (en)* | 2017-12-15 | 2018-12-11 | 浙江中医药大学 | Retinal vessel automatic division method towards glaucoma clinical diagnosis |
| CN112150477A (en)* | 2019-11-15 | 2020-12-29 | 复旦大学 | Brain imaging arterial automatic segmentation method and device |
| CN111932665A (en)* | 2020-06-15 | 2020-11-13 | 浙江工贸职业技术学院 | Hepatic vessel three-dimensional reconstruction and visualization method based on vessel tubular model |
| CN111815663A (en)* | 2020-06-29 | 2020-10-23 | 浙江工贸职业技术学院 | Hepatic vessel segmentation system based on Hessian matrix and gray scale method |
| CN112233791A (en)* | 2020-10-16 | 2021-01-15 | 东北大学 | Device and method for preparing mammary gland prosthesis based on point cloud data clustering |
| CN113658193A (en)* | 2021-07-08 | 2021-11-16 | 西安理工大学 | A tumor segmentation method in liver CT images based on information fusion |
Non-Patent Citations (5)
| Title |
|---|
| KAHINA AMARA: "HOLOTumor: 6 DoF Phantom Head Pose Estimation-Based Deep Learning and Brain Tumor Segmentation for AR Visualization and Interaction", IEEE SENSORS JOURNAL, vol. 23, no. 19, 31 December 2023 (2023-12-31), pages 23367 - 23376, XP011950418, DOI: 10.1109/JSEN.2023.3305596* |
| 方驰华: "数字化胰腺外科学", 31 December 2015, 人民军医出版社, pages: 167* |
| 汪文星;吴效明;: "基于MITK的CT图像三维可视化研究", 医疗卫生装备, no. 07, 15 July 2011 (2011-07-15), pages 20 - 22* |
| 王锦程;郁芸;胡新华;杨坤;: "基于Matlab GUI的脑胶质瘤三维显示辅助诊断系统的设计", 生物医学工程研究, no. 04, 15 December 2017 (2017-12-15), pages 336 - 339* |
| 黄荔丽;王博亮;黄晓阳;: "基于DICOM格式的肝脏肿瘤CT图像分割", 计算机技术与发展, no. 01, 10 January 2008 (2008-01-10), pages 48 - 51* |
Cited By (4)
| Publication number | Priority date | Publication date | Assignee | Title |
|---|---|---|---|---|
| CN115346032A (en)* | 2022-08-16 | 2022-11-15 | 珠海赛纳数字医疗技术有限公司 | Display method, device, equipment and storage medium |
| WO2024037109A1 (en)* | 2022-08-16 | 2024-02-22 | 珠海赛纳数字医疗技术有限公司 | Display method and apparatus, and device and storage medium |
| CN117218150A (en)* | 2023-09-12 | 2023-12-12 | 厦门大学 | Quantitative analysis method for spleen white spot infection degree of large yellow croaker based on machine learning |
| CN118448056A (en)* | 2024-05-20 | 2024-08-06 | 暨南大学附属第一医院(广州华侨医院) | A system for building a visual model of brain tumors based on network search and machine learning |
Similar Documents
| Publication | Publication Date | Title |
|---|---|---|
| JP6837551B2 (en) | HMDS-based medical imaging device | |
| CN114783591A (en) | A three-dimensional visualization auxiliary diagnosis system for brain tumors | |
| CN107808156B (en) | Region of Interest Extraction Method | |
| CN112529834B (en) | Spatial distribution of pathological image patterns in 3D image data | |
| Ritter et al. | Medical image analysis | |
| CN101706843B (en) | Interactive film Interpretation method of mammary gland CR image | |
| Stytz et al. | Three-dimensional medical imaging: algorithms and computer systems | |
| CN102222352B (en) | Image processing method and image processing apparatus | |
| CN101849248B (en) | Method and apparatus for volume rendering of datasets | |
| CN101710420B (en) | A Method of Anti-segmentation of Medical Image | |
| CN104574263A (en) | Quick three-dimensional ultrasonic reconstruction and display method on basis of GPU (graphics processing unit) | |
| CN103077557B (en) | The implementation method that a kind of adaptive layered time big data of chest show | |
| CN114723893A (en) | A method and system for rendering the spatial relationship of organs and tissues based on medical images | |
| Allison et al. | Breast3D: An augmented reality system for breast CT and MRI | |
| CN103530902A (en) | Two-dimensional processing and three-dimensional reconstruction system of medical images | |
| CN108694726A (en) | medical image three-dimensional reconstruction system | |
| JP2012085833A (en) | Image processing system for three-dimensional medical image data, image processing method for the same, and program | |
| US12062427B2 (en) | Method and system for tissue density analysis | |
| US20220343605A1 (en) | Computer implemented method and system for navigation and display of 3d image data | |
| Xiang et al. | Skeleton cuts—An efficient segmentation method for volume rendering | |
| WO2020173054A1 (en) | Vrds 4d medical image processing method and product | |
| CN103646417B (en) | Based on gray scale-3D SUSAN operator two-dimensional histogram volume visualization method | |
| Yang et al. | Region space guided transfer function design for nonlinear neural network augmented image visualization | |
| CN108280871A (en) | Medical image three-dimensional reconstruction system | |
| Chen et al. | 3D Visualization System of Breast Magnetic Resonance Images Based on Deep Learning and Volume Rendering |
Legal Events
| Date | Code | Title | Description |
|---|---|---|---|
| PB01 | Publication | ||
| PB01 | Publication | ||
| SE01 | Entry into force of request for substantive examination | ||
| SE01 | Entry into force of request for substantive examination |