CN114631027A - Cancer diagnosis method based on quantitative biomarkers and database thereof - Google Patents
Cancer diagnosis method based on quantitative biomarkers and database thereofDownload PDFInfo
- Publication number
- CN114631027A CN114631027ACN202080076711.0ACN202080076711ACN114631027ACN 114631027 ACN114631027 ACN 114631027ACN 202080076711 ACN202080076711 ACN 202080076711ACN 114631027 ACN114631027 ACN 114631027A
- Authority
- CN
- China
- Prior art keywords
- cancer
- database
- patient
- clinical
- biomarker
- Prior art date
- Legal status (The legal status is an assumption and is not a legal conclusion. Google has not performed a legal analysis and makes no representation as to the accuracy of the status listed.)
- Pending
Links
- 206010028980NeoplasmDiseases0.000titleclaimsabstractdescription131
- 239000000090biomarkerSubstances0.000titleclaimsabstractdescription120
- 201000011510cancerDiseases0.000titleclaimsabstractdescription117
- 238000000034methodMethods0.000titleclaimsabstractdescription77
- 238000003745diagnosisMethods0.000titleclaimsdescription47
- 101150029707ERBB2 geneProteins0.000claimsdescription54
- 238000004393prognosisMethods0.000claimsdescription54
- 238000004458analytical methodMethods0.000claimsdescription43
- 102000015694estrogen receptorsHuman genes0.000claimsdescription41
- 108010038795estrogen receptorsProteins0.000claimsdescription41
- 102000003998progesterone receptorsHuman genes0.000claimsdescription39
- 108090000468progesterone receptorsProteins0.000claimsdescription39
- 206010006187Breast cancerDiseases0.000claimsdescription17
- 208000026310Breast neoplasmDiseases0.000claimsdescription17
- 238000003119immunoblotMethods0.000claimsdescription4
- 101100314454Caenorhabditis elegans tra-1 geneProteins0.000claims2
- 239000012474protein markerSubstances0.000claims1
- 238000011002quantificationMethods0.000abstractdescription6
- 230000004083survival effectEffects0.000description57
- 239000000523sampleSubstances0.000description37
- 102000004169proteins and genesHuman genes0.000description36
- 108090000623proteins and genesProteins0.000description36
- 238000011282treatmentMethods0.000description27
- 238000002512chemotherapyMethods0.000description22
- 229920001940conductive polymerPolymers0.000description21
- 238000009616inductively coupled plasmaMethods0.000description21
- 201000010099diseaseDiseases0.000description20
- 208000037265diseases, disorders, signs and symptomsDiseases0.000description20
- 210000001519tissueAnatomy0.000description16
- 238000003364immunohistochemistryMethods0.000description14
- 238000009261endocrine therapyMethods0.000description12
- 229940034984endocrine therapy antineoplastic and immunomodulating agentDrugs0.000description12
- 208000026534luminal B breast carcinomaDiseases0.000description11
- 208000026535luminal A breast carcinomaDiseases0.000description10
- 238000003759clinical diagnosisMethods0.000description9
- 230000004807localizationEffects0.000description9
- 210000002925A-likeAnatomy0.000description8
- 238000003556assayMethods0.000description7
- 238000001574biopsyMethods0.000description7
- 230000000875corresponding effectEffects0.000description7
- 238000011156evaluationMethods0.000description7
- 108050006400CyclinProteins0.000description6
- 102100036691Proliferating cell nuclear antigenHuman genes0.000description6
- 210000001165lymph nodeAnatomy0.000description6
- 238000002965ELISAMethods0.000description5
- 239000012491analyteSubstances0.000description5
- 238000013459approachMethods0.000description5
- 230000008901benefitEffects0.000description5
- 238000001325log-rank testMethods0.000description5
- 238000005259measurementMethods0.000description5
- 238000012216screeningMethods0.000description5
- 238000010824Kaplan-Meier survival analysisMethods0.000description4
- 241000283973Oryctolagus cuniculusSpecies0.000description4
- 238000007792additionMethods0.000description4
- 239000003153chemical reaction reagentSubstances0.000description4
- 230000003247decreasing effectEffects0.000description4
- 230000000694effectsEffects0.000description4
- 238000005516engineering processMethods0.000description4
- 239000006166lysateSubstances0.000description4
- 239000003550markerSubstances0.000description4
- 238000004949mass spectrometryMethods0.000description4
- 239000000463materialSubstances0.000description4
- 238000011269treatment regimenMethods0.000description4
- 241000283074Equus asinusSpecies0.000description3
- PEDCQBHIVMGVHV-UHFFFAOYSA-NGlycerineChemical compoundOCC(O)COPEDCQBHIVMGVHV-UHFFFAOYSA-N0.000description3
- 238000002405diagnostic procedureMethods0.000description3
- 229940079593drugDrugs0.000description3
- 239000003814drugSubstances0.000description3
- 229940088597hormoneDrugs0.000description3
- 239000005556hormoneSubstances0.000description3
- 238000007619statistical methodMethods0.000description3
- 239000000126substanceSubstances0.000description3
- 238000011277treatment modalityMethods0.000description3
- 241001609030Brosme brosmeSpecies0.000description2
- 102100022183E3 ubiquitin-protein ligase MIB1Human genes0.000description2
- 101000973503Homo sapiens E3 ubiquitin-protein ligase MIB1Proteins0.000description2
- 108010042653IgA receptorProteins0.000description2
- 241000023320Luma <angiosperm>Species0.000description2
- 102100034014Prolyl 3-hydroxylase 3Human genes0.000description2
- 206010060862Prostate cancerDiseases0.000description2
- 208000000236Prostatic NeoplasmsDiseases0.000description2
- FAPWRFPIFSIZLT-UHFFFAOYSA-MSodium chlorideChemical compound[Na+].[Cl-]FAPWRFPIFSIZLT-UHFFFAOYSA-M0.000description2
- 208000003721Triple Negative Breast NeoplasmsDiseases0.000description2
- 210000000481breastAnatomy0.000description2
- 230000001364causal effectEffects0.000description2
- 238000011161developmentMethods0.000description2
- 239000000104diagnostic biomarkerSubstances0.000description2
- 229940042399direct acting antivirals protease inhibitorsDrugs0.000description2
- 230000002068genetic effectEffects0.000description2
- 210000005260human cellAnatomy0.000description2
- 238000002991immunohistochemical analysisMethods0.000description2
- 239000002609mediumSubstances0.000description2
- OSWPMRLSEDHDFF-UHFFFAOYSA-Nmethyl salicylateChemical compoundCOC(=O)C1=CC=CC=C1OOSWPMRLSEDHDFF-UHFFFAOYSA-N0.000description2
- 239000013610patient sampleSubstances0.000description2
- 239000000137peptide hydrolase inhibitorSubstances0.000description2
- YBYRMVIVWMBXKQ-UHFFFAOYSA-Nphenylmethanesulfonyl fluorideChemical compoundFS(=O)(=O)CC1=CC=CC=C1YBYRMVIVWMBXKQ-UHFFFAOYSA-N0.000description2
- 238000004445quantitative analysisMethods0.000description2
- 238000003753real-time PCRMethods0.000description2
- 238000011160researchMethods0.000description2
- 208000022679triple-negative breast carcinomaDiseases0.000description2
- 238000001262western blotMethods0.000description2
- JKMHFZQWWAIEOD-UHFFFAOYSA-N2-[4-(2-hydroxyethyl)piperazin-1-yl]ethanesulfonic acidChemical compoundOCC[NH+]1CCN(CCS([O-])(=O)=O)CC1JKMHFZQWWAIEOD-UHFFFAOYSA-N0.000description1
- 108010039627AprotininProteins0.000description1
- 238000000035BCA protein assayMethods0.000description1
- 206010009944Colon cancerDiseases0.000description1
- 208000001333Colorectal NeoplasmsDiseases0.000description1
- KCXVZYZYPLLWCC-UHFFFAOYSA-NEDTAChemical compoundOC(=O)CN(CC(O)=O)CCN(CC(O)=O)CC(O)=OKCXVZYZYPLLWCC-UHFFFAOYSA-N0.000description1
- 102000004190EnzymesHuman genes0.000description1
- 108090000790EnzymesProteins0.000description1
- 241000729176Fagopyrum dibotrysSpecies0.000description1
- 208000034951Genetic TranslocationDiseases0.000description1
- WQZGKKKJIJFFOK-GASJEMHNSA-NGlucoseNatural productsOC[C@H]1OC(O)[C@H](O)[C@@H](O)[C@@H]1OWQZGKKKJIJFFOK-GASJEMHNSA-N0.000description1
- 239000007995HEPES bufferSubstances0.000description1
- 101001012157Homo sapiens Receptor tyrosine-protein kinase erbB-2Proteins0.000description1
- GDBQQVLCIARPGH-UHFFFAOYSA-NLeupeptinNatural productsCC(C)CC(NC(C)=O)C(=O)NC(CC(C)C)C(=O)NC(C=O)CCCN=C(N)NGDBQQVLCIARPGH-UHFFFAOYSA-N0.000description1
- 206010058467Lung neoplasm malignantDiseases0.000description1
- 102100030086Receptor tyrosine-protein kinase erbB-2Human genes0.000description1
- 239000006180TBST bufferSubstances0.000description1
- 241000656145Thyrsites atunSpecies0.000description1
- 229940100198alkylating agentDrugs0.000description1
- 239000002168alkylating agentSubstances0.000description1
- 239000003242anti bacterial agentSubstances0.000description1
- 230000000340anti-metaboliteEffects0.000description1
- 230000000259anti-tumor effectEffects0.000description1
- 229940088710antibiotic agentDrugs0.000description1
- 229940100197antimetaboliteDrugs0.000description1
- 239000002256antimetaboliteSubstances0.000description1
- 229960004405aprotininDrugs0.000description1
- 239000012472biological sampleSubstances0.000description1
- 239000000091biomarker candidateSubstances0.000description1
- 210000004369bloodAnatomy0.000description1
- 239000008280bloodSubstances0.000description1
- 230000036772blood pressureEffects0.000description1
- 238000004364calculation methodMethods0.000description1
- 238000004113cell cultureMethods0.000description1
- 239000006143cell culture mediumSubstances0.000description1
- 230000001413cellular effectEffects0.000description1
- 238000005119centrifugationMethods0.000description1
- 238000002648combination therapyMethods0.000description1
- 239000013065commercial productSubstances0.000description1
- 230000002596correlated effectEffects0.000description1
- 238000007405data analysisMethods0.000description1
- 230000001419dependent effectEffects0.000description1
- 238000001514detection methodMethods0.000description1
- 230000002124endocrineEffects0.000description1
- 238000002474experimental methodMethods0.000description1
- 239000012530fluidSubstances0.000description1
- 239000008103glucoseSubstances0.000description1
- 238000003018immunoassayMethods0.000description1
- 238000013388immunohistochemistry analysisMethods0.000description1
- 238000000338in vitroMethods0.000description1
- 239000003112inhibitorSubstances0.000description1
- ZPNFWUPYTFPOJU-LPYSRVMUSA-NiniprolChemical compoundC([C@H]1C(=O)NCC(=O)NCC(=O)N[C@H]2CSSC[C@H]3C(=O)N[C@@H](CCCCN)C(=O)N[C@@H](C)C(=O)N[C@@H](CCCNC(N)=N)C(=O)N[C@H](C(N[C@H](C(=O)N[C@@H](CCCNC(N)=N)C(=O)N[C@@H](CC=4C=CC(O)=CC=4)C(=O)N[C@@H](CC=4C=CC=CC=4)C(=O)N[C@@H](CC=4C=CC(O)=CC=4)C(=O)N[C@@H](CC(N)=O)C(=O)N[C@@H](C)C(=O)N[C@@H](CCCCN)C(=O)N[C@@H](C)C(=O)NCC(=O)N[C@@H](CC(C)C)C(=O)N[C@@H](CSSC[C@H](NC(=O)[C@H](CC(O)=O)NC(=O)[C@H](CCC(O)=O)NC(=O)[C@H](C)NC(=O)[C@H](CO)NC(=O)[C@H](CCCCN)NC(=O)[C@H](CC=4C=CC=CC=4)NC(=O)[C@H](CC(N)=O)NC(=O)[C@H](CC(N)=O)NC(=O)[C@H](CCCNC(N)=N)NC(=O)[C@H](CCCCN)NC(=O)[C@H](C)NC(=O)[C@H](CCCNC(N)=N)NC2=O)C(=O)N[C@@H](CCSC)C(=O)N[C@@H](CCCNC(N)=N)C(=O)N[C@@H]([C@@H](C)O)C(=O)N[C@@H](CSSC[C@H](NC(=O)[C@H](CC=2C=CC=CC=2)NC(=O)[C@H](CC(O)=O)NC(=O)[C@H]2N(CCC2)C(=O)[C@@H](N)CCCNC(N)=N)C(=O)N[C@@H](CC(C)C)C(=O)N[C@@H](CCC(O)=O)C(=O)N2[C@@H](CCC2)C(=O)N2[C@@H](CCC2)C(=O)N[C@@H](CC=2C=CC(O)=CC=2)C(=O)N[C@@H]([C@@H](C)O)C(=O)NCC(=O)N2[C@@H](CCC2)C(=O)N3)C(=O)NCC(=O)NCC(=O)N[C@@H](C)C(O)=O)C(=O)N[C@@H](CCC(N)=O)C(=O)N[C@H](C(=O)N[C@@H](CC=2C=CC=CC=2)C(=O)N[C@H](C(=O)N1)C(C)C)[C@@H](C)O)[C@@H](C)CC)=O)[C@@H](C)CC)C1=CC=C(O)C=C1ZPNFWUPYTFPOJU-LPYSRVMUSA-N0.000description1
- -1ki67Proteins0.000description1
- GDBQQVLCIARPGH-ULQDDVLXSA-NleupeptinChemical compoundCC(C)C[C@H](NC(C)=O)C(=O)N[C@@H](CC(C)C)C(=O)N[C@H](C=O)CCCN=C(N)NGDBQQVLCIARPGH-ULQDDVLXSA-N0.000description1
- 108010052968leupeptinProteins0.000description1
- 201000005202lung cancerDiseases0.000description1
- 208000020816lung neoplasmDiseases0.000description1
- 239000012139lysis bufferSubstances0.000description1
- 238000012067mathematical methodMethods0.000description1
- 238000000691measurement methodMethods0.000description1
- 238000002493microarrayMethods0.000description1
- 230000000394mitotic effectEffects0.000description1
- 239000002773nucleotideSubstances0.000description1
- 125000003729nucleotide groupChemical group0.000description1
- 229950000964pepstatinDrugs0.000description1
- 108010091212pepstatinProteins0.000description1
- FAXGPCHRFPCXOO-LXTPJMTPSA-Npepstatin AChemical compoundOC(=O)C[C@H](O)[C@H](CC(C)C)NC(=O)[C@H](C)NC(=O)C[C@H](O)[C@H](CC(C)C)NC(=O)[C@H](C(C)C)NC(=O)[C@H](C(C)C)NC(=O)CC(C)CFAXGPCHRFPCXOO-LXTPJMTPSA-N0.000description1
- 210000004976peripheral blood cellAnatomy0.000description1
- 210000004910pleural fluidAnatomy0.000description1
- 229920001184polypeptidePolymers0.000description1
- 238000002360preparation methodMethods0.000description1
- 230000002265preventionEffects0.000description1
- 108090000765processed proteins & peptidesProteins0.000description1
- 102000004196processed proteins & peptidesHuman genes0.000description1
- 238000003498protein arrayMethods0.000description1
- 238000009790rate-determining step (RDS)Methods0.000description1
- 210000003296salivaAnatomy0.000description1
- 238000013207serial dilutionMethods0.000description1
- 210000002966serumAnatomy0.000description1
- 239000011780sodium chlorideSubstances0.000description1
- 239000000243solutionSubstances0.000description1
- 239000006228supernatantSubstances0.000description1
- 210000001138tearAnatomy0.000description1
- 238000002560therapeutic procedureMethods0.000description1
- 239000000107tumor biomarkerSubstances0.000description1
- 210000002700urineAnatomy0.000description1
Images


Classifications
- G—PHYSICS
- G16—INFORMATION AND COMMUNICATION TECHNOLOGY [ICT] SPECIALLY ADAPTED FOR SPECIFIC APPLICATION FIELDS
- G16H—HEALTHCARE INFORMATICS, i.e. INFORMATION AND COMMUNICATION TECHNOLOGY [ICT] SPECIALLY ADAPTED FOR THE HANDLING OR PROCESSING OF MEDICAL OR HEALTHCARE DATA
- G16H10/00—ICT specially adapted for the handling or processing of patient-related medical or healthcare data
- G16H10/40—ICT specially adapted for the handling or processing of patient-related medical or healthcare data for data related to laboratory analysis, e.g. patient specimen analysis
- G—PHYSICS
- G01—MEASURING; TESTING
- G01N—INVESTIGATING OR ANALYSING MATERIALS BY DETERMINING THEIR CHEMICAL OR PHYSICAL PROPERTIES
- G01N33/00—Investigating or analysing materials by specific methods not covered by groups G01N1/00 - G01N31/00
- G01N33/48—Biological material, e.g. blood, urine; Haemocytometers
- G01N33/50—Chemical analysis of biological material, e.g. blood, urine; Testing involving biospecific ligand binding methods; Immunological testing
- G01N33/53—Immunoassay; Biospecific binding assay; Materials therefor
- G01N33/574—Immunoassay; Biospecific binding assay; Materials therefor for cancer
- G01N33/57407—Specifically defined cancers
- G01N33/57415—Specifically defined cancers of breast
- G—PHYSICS
- G01—MEASURING; TESTING
- G01N—INVESTIGATING OR ANALYSING MATERIALS BY DETERMINING THEIR CHEMICAL OR PHYSICAL PROPERTIES
- G01N33/00—Investigating or analysing materials by specific methods not covered by groups G01N1/00 - G01N31/00
- G01N33/48—Biological material, e.g. blood, urine; Haemocytometers
- G01N33/50—Chemical analysis of biological material, e.g. blood, urine; Testing involving biospecific ligand binding methods; Immunological testing
- G01N33/53—Immunoassay; Biospecific binding assay; Materials therefor
- G01N33/574—Immunoassay; Biospecific binding assay; Materials therefor for cancer
- G01N33/57484—Immunoassay; Biospecific binding assay; Materials therefor for cancer involving compounds serving as markers for tumor, cancer, neoplasia, e.g. cellular determinants, receptors, heat shock/stress proteins, A-protein, oligosaccharides, metabolites
- G—PHYSICS
- G16—INFORMATION AND COMMUNICATION TECHNOLOGY [ICT] SPECIALLY ADAPTED FOR SPECIFIC APPLICATION FIELDS
- G16B—BIOINFORMATICS, i.e. INFORMATION AND COMMUNICATION TECHNOLOGY [ICT] SPECIALLY ADAPTED FOR GENETIC OR PROTEIN-RELATED DATA PROCESSING IN COMPUTATIONAL MOLECULAR BIOLOGY
- G16B25/00—ICT specially adapted for hybridisation; ICT specially adapted for gene or protein expression
- G16B25/10—Gene or protein expression profiling; Expression-ratio estimation or normalisation
- G—PHYSICS
- G16—INFORMATION AND COMMUNICATION TECHNOLOGY [ICT] SPECIALLY ADAPTED FOR SPECIFIC APPLICATION FIELDS
- G16B—BIOINFORMATICS, i.e. INFORMATION AND COMMUNICATION TECHNOLOGY [ICT] SPECIALLY ADAPTED FOR GENETIC OR PROTEIN-RELATED DATA PROCESSING IN COMPUTATIONAL MOLECULAR BIOLOGY
- G16B40/00—ICT specially adapted for biostatistics; ICT specially adapted for bioinformatics-related machine learning or data mining, e.g. knowledge discovery or pattern finding
- G—PHYSICS
- G16—INFORMATION AND COMMUNICATION TECHNOLOGY [ICT] SPECIALLY ADAPTED FOR SPECIFIC APPLICATION FIELDS
- G16H—HEALTHCARE INFORMATICS, i.e. INFORMATION AND COMMUNICATION TECHNOLOGY [ICT] SPECIALLY ADAPTED FOR THE HANDLING OR PROCESSING OF MEDICAL OR HEALTHCARE DATA
- G16H50/00—ICT specially adapted for medical diagnosis, medical simulation or medical data mining; ICT specially adapted for detecting, monitoring or modelling epidemics or pandemics
- G16H50/20—ICT specially adapted for medical diagnosis, medical simulation or medical data mining; ICT specially adapted for detecting, monitoring or modelling epidemics or pandemics for computer-aided diagnosis, e.g. based on medical expert systems
Landscapes
- Health & Medical Sciences (AREA)
- Engineering & Computer Science (AREA)
- Life Sciences & Earth Sciences (AREA)
- Medical Informatics (AREA)
- General Health & Medical Sciences (AREA)
- Biomedical Technology (AREA)
- Immunology (AREA)
- Physics & Mathematics (AREA)
- Public Health (AREA)
- Molecular Biology (AREA)
- Epidemiology (AREA)
- Hematology (AREA)
- Urology & Nephrology (AREA)
- Chemical & Material Sciences (AREA)
- Biotechnology (AREA)
- Pathology (AREA)
- Data Mining & Analysis (AREA)
- Primary Health Care (AREA)
- Databases & Information Systems (AREA)
- Cell Biology (AREA)
- General Physics & Mathematics (AREA)
- Evolutionary Biology (AREA)
- Analytical Chemistry (AREA)
- Medicinal Chemistry (AREA)
- Food Science & Technology (AREA)
- Microbiology (AREA)
- Oncology (AREA)
- Hospice & Palliative Care (AREA)
- Theoretical Computer Science (AREA)
- Spectroscopy & Molecular Physics (AREA)
- Biophysics (AREA)
- Biochemistry (AREA)
- Bioinformatics & Computational Biology (AREA)
- Bioinformatics & Cheminformatics (AREA)
- Software Systems (AREA)
- Evolutionary Computation (AREA)
- Computer Vision & Pattern Recognition (AREA)
- Bioethics (AREA)
- Artificial Intelligence (AREA)
- Genetics & Genomics (AREA)
Abstract
Translated fromChineseDescription
Translated fromChinese相关申请的交叉引用CROSS-REFERENCE TO RELATED APPLICATIONS
本申请主张基于2019年11月1号递交的美国临时专利申请62/929,396的所有权益并且在此将该公开的全部内容通过参照而并入本申请中。This application claims all benefit based on US Provisional Patent Application 62/929,396, filed November 1, 2019 and the entire disclosure of this disclosure is hereby incorporated by reference into this application.
技术领域technical field
本发明涉及基于一组生物标志物(biomarker)的定量水平对癌症患者进行诊断(diagnostics)、预估(prediction)和预后(prognosis)的方法、系统和软件。具体而言,本发明涉及参照数据库中同一组生物标志物的定量水平对癌症患者进行诊断、预估和预后。The present invention relates to methods, systems and software for the diagnosis, prediction and prognosis of cancer patients based on quantitative levels of a panel of biomarkers. In particular, the present invention relates to the diagnosis, prediction and prognosis of cancer patients with reference to quantitative levels of the same set of biomarkers in a database.
背景技术Background technique
对于大多数癌症患者来说,它们的肿瘤组织经手术移除后会以福尔马林固定-石蜡包埋(FFPE)的形式保存在医院或其它医疗机构中。因此,储存的数百万FFPE样本以及与之相关联的包括治疗方案和临床结局的详细病例,作为数量庞大且尚未得到充分利用的医疗资源积累起来。这些FFPE样本的巨大数量足以涵盖个体水平上的不同分子特征(molecular identity)。结合其已知的临床结局,这些样本成为面向临床个性化治疗研究的无与伦比的资源。在这里,我们可以为世界上任何一个癌症患者识别出具有相似分子特征的已知病例。For most cancer patients, their tumor tissue is surgically removed and stored in a hospital or other medical facility in formalin-fixed-paraffin-embedded (FFPE) form. As a result, the millions of FFPE samples stored and their associated case details including treatment regimens and clinical outcomes have accumulated as a vast and underutilized medical resource. The large number of these FFPE samples is sufficient to cover different molecular identities at the individual level. Combined with their known clinical outcomes, these samples become an unparalleled resource for clinical personalized treatment research. Here, we can identify known cases with similar molecular signatures for any cancer patient in the world.
在临床实践中,出于临床诊断和预后的目的,免疫组化分析(IHC)被广泛用于在蛋白质水平上评估生物标志物。典型的生物标志物的IHC报告表述为“+”或“-”或者进而分类成“0、1+、2+、3+”。例如,通过IHC方法分析常用于乳腺癌诊断的生物标志物——人表皮生长因子受体2(Her2)的表达水平,以确定是否在治疗过程中包括Her2针对性疗法(Her2-dependent therapy)。IHC的结果被分成三组:0和1+、2+和3+。0组和1+组的结果被认为是阴性,3+组被认为是阳性,而2+组被认为是两可。In clinical practice, immunohistochemical analysis (IHC) is widely used to evaluate biomarkers at the protein level for clinical diagnostic and prognostic purposes. IHC reporting of typical biomarkers is expressed as "+" or "-" or further classified as "0, 1+, 2+, 3+". For example, the expression level of human epidermal growth factor receptor 2 (Her2), a biomarker commonly used in breast cancer diagnosis, is analyzed by IHC methods to determine whether to include Her2-dependent therapy in the course of treatment. The results of IHC were divided into three groups: 0 and 1+, 2+ and 3+. Results in
结合IHC结果进行诊断和预后是临床实践中的常规操作。例如,对于乳腺癌患者来说,4个肿瘤生物标志物,包括雌激素受体(ER)、孕激素受体(PR)、Ki67和Her2被用于将患者区分为管腔A(Luminal A)型、管腔B(Lumina B)型、Her2型和三阴型4个亚型。Her2和ER/PR的IHC结果被用于将患者分为管腔型、Her2型和三阴型,而Ki67的表达水平进一步将管腔型分为管腔A型和管腔B型。Combining IHC results for diagnosis and prognosis is routine in clinical practice. For example, in breast cancer patients, 4 tumor biomarkers including estrogen receptor (ER), progesterone receptor (PR), Ki67 and Her2 were used to differentiate patients into Luminal A There are 4 subtypes: Lumina B type, Her2 type and triple negative type. The IHC results of Her2 and ER/PR were used to classify patients into luminal, Her2, and triple-negative types, while the expression level of Ki67 further divided the luminal type into luminal A and luminal B.
IHC的分类结果也难以用于进一步临床实践。例如,虽然在阳性的个体患者中存在显著差异,它们在临床实践中被归结为同一类别。因而,来自IHC分析的结果难以用来进行充分的数据分析以提供更准确、更有预见性的诊断和预后。The classification results of IHC are also difficult to use in further clinical practice. For example, although there are significant differences among individual patients who are positive, they are lumped into the same category in clinical practice. Thus, results from IHC analysis are difficult to use for adequate data analysis to provide more accurate and predictive diagnosis and prognosis.
IHC方法也严重受制于内在的主观性和不一致性。肿瘤组织的异质性也使诊断过程更为复杂化。IHC methods are also severely subject to inherent subjectivity and inconsistency. The heterogeneity of tumor tissue also complicates the diagnostic process.
很多科学家致力于在组织水平将生物标志物测定为绝对的且连续的变量。例如,酶联免疫法(ELISA)可以用来测定新鲜和冰冻组织中生物标志物的表达水平。然而,这种方法无法用于测定FFPE样本中生物标志物的表达水平。因此也严重限制了其在临床诊断和预后中的应用。Many scientists aim to measure biomarkers as absolute and continuous variables at the tissue level. For example, enzyme-linked immunosorbent assays (ELISA) can be used to determine the expression levels of biomarkers in fresh and frozen tissues. However, this method cannot be used to measure the expression levels of biomarkers in FFPE samples. Therefore, its application in clinical diagnosis and prognosis is severely limited.
量化斑点免疫印迹分析(QDB)法能够以高通量的形式测定新鲜、冰冻和FFPE样本中的生物标志物表达水平作为绝对的且连续的变量。当引入标准蛋白时,不管以重组蛋白形式还是以纯化蛋白形式,都可以将这种方法非常方便地转化为绝对定量的方法以对某特定蛋白的含量在细胞或组织水平上进行绝对定量测定。The quantitative dot blot analysis (QDB) method enables the determination of biomarker expression levels as absolute and continuous variables in fresh, frozen and FFPE samples in a high-throughput format. When a standard protein is introduced, whether in recombinant or purified form, this method can be easily converted into an absolute quantitative method for absolute quantification of the content of a particular protein at the cellular or tissue level.
在QDB方法应用之前,数百万计的储存FFPE样本无法通过现有可用的蛋白技术进行处理,因为现有技术无法在群体水平上有效区分单个FFPE样本。目前常用的蛋白分析方法,包括免疫组化(IHC)、西式印迹分析、反相蛋白质阵列分析(RPPA)、以及质谱分析均已用于分析FFPE样本。然而,这些方法都不足以用于分析数量庞大的FFPE样本。Before the application of the QDB approach, the millions of stored FFPE samples could not be processed by currently available protein technologies because existing technologies could not effectively discriminate individual FFPE samples at the population level. Commonly used protein analysis methods, including immunohistochemistry (IHC), Western blot analysis, reversed-phase protein array analysis (RPPA), and mass spectrometry, have been used to analyze FFPE samples. However, none of these methods are sufficient for analyzing large numbers of FFPE samples.
对于IHC和西式印迹分析来说,它们的定性的内在特征会使群体水平上的个体间差异变得模糊。For IHC and Western blot analysis, their qualitative intrinsic characteristics can obscure inter-individual differences at the population level.
其它方法能够定量测定蛋白质表达水平以揭示群体水平上的个体差异,但提供了相对结果从而限制研究规模。我们可以通过举例来更好地说明这种限制。蛋白质的表达水平可以表示为绝对值(例如nmole/g)或者表示为相对值(参考蛋白质B的百分比%)。虽然可以很容易在多个(本文中的“多个(a plurality of)”均特指“两个以上”)分析中比较以绝对形式表达的蛋白含量,但很难比较在多个分析中比较基于各不相同的参考蛋白B含量的结果。Other methods can quantify protein expression levels to reveal individual differences at the population level, but provide relative results that limit study size. We can better illustrate this limitation with an example. The expression level of a protein can be expressed as an absolute value (eg nmole/g) or as a relative value (% of reference protein B). While it is easy to compare protein levels expressed in absolute form in multiple (herein "a plurality of" refers specifically to "two or more") assays, it is difficult to compare across multiple assays Results based on varying reference protein B content.
MS和RPPA都属于这种情形。其结果都表述为相对于一个参考蛋白质的值,而该参考蛋白质的含量在每次研究中都可能各不相同[Boellner,et al,Microarrays,4(2):98-114,2015,DeSouza,et al,Clin.Biochem.46:421-431,2013]。因此,基于这些方法的研究规模也就受限于每次研究中样本的数量,无法通过合并其它研究结果来扩大研究规模。实时荧光定量PCR(RT-PCR)方法产生的数据集也存在同样的问题。This is the case for both MS and RPPA. Results are expressed relative to a reference protein, which may vary from study to study [Boellner, et al, Microarrays, 4(2):98-114, 2015, DeSouza, et al, Clin. Biochem. 46:421-431, 2013]. Therefore, the size of studies based on these methods is limited by the number of samples in each study and cannot be expanded by combining the results of other studies. The same problem exists with datasets generated by real-time PCR (RT-PCR) methods.
另一方面,QDB方法可以提供一种能处理庞大的具有绝对性和连续性的FFPE样本数据集的方法。关于连续性,需要量化的结果来体现在群体水平上个体间的细微差异。关于绝对性,无论时间、地点等如何变化,每个蛋白的定量应该一致,由此确保数据可以共享、相互印证及合并以保证数据集的急需增长来应对数量庞大的FFPE样本。On the other hand, the QDB method can provide a method that can handle a huge dataset of FFPE samples with absolute and continuous properties. With regard to continuity, quantitative results are needed to capture subtle differences between individuals at the group level. Regarding absoluteness, the quantification of each protein should be consistent regardless of time, location, etc., thereby ensuring that data can be shared, corroborated, and merged to ensure the much-needed growth of the dataset to cope with the large number of FFPE samples.
本发明提供了方法、系统和软件以利用世界上广泛储存的FFPE样本来辅助患者的诊断。在临床中采用该方法可以显著提高治疗的有效性以实现个性化治疗的目的。The present invention provides methods, systems and software to aid in patient diagnosis using the world's widely stored FFPE samples. Adopting this method in the clinic can significantly improve the effectiveness of treatment for the purpose of personalized treatment.
发明内容SUMMARY OF THE INVENTION
本发明提供了利用作为连续变量的三个或者更多的生物标志物对癌症进行诊断、预估和预后的方法。本发明对生物标志物的评估是通过定量而不是现行的通用定性的测量,然后表达为绝对单元从而可以很容易合并到现有的数据库中。The present invention provides methods for the diagnosis, prediction and prognosis of cancer using three or more biomarkers as continuous variables. The assessment of biomarkers in the present invention is by quantitative rather than current general qualitative measures, and then expressed as absolute units that can be easily incorporated into existing databases.
实验样品可以是来自个体(subject)的组织。在本发明的一实施方式中,组织是指活检组织。在本发明的另一实施方式中,组织是指经过福尔马林固定·石蜡包埋的样本(FFPE样本)。The experimental sample can be tissue from a subject. In one embodiment of the invention, tissue refers to biopsy tissue. In another embodiment of the present invention, tissue refers to a formalin-fixed, paraffin-embedded sample (FFPE sample).
个体可以是患者。更具体而言,个体可以是癌症患者。在本发明一实施方式中,个体可以是乳腺癌患者。An individual can be a patient. More specifically, the individual may be a cancer patient. In one embodiment of the invention, the individual may be a breast cancer patient.
利用绝对定量的蛋白生物标志物含量可以用来开发一个回顾性癌症概况(profile)数据库(RC)或者更准确地说不同癌症类型的数据库(包括乳腺癌、结直肠癌或者前列腺癌)以充分利用巨量的储存的FFPE样品(在本文中的“癌症概况”对应英文表达为“cancer profile”,有时单独称其为“癌症概况信息”或者根据语境简称为“概况信息”或“信息”)。The use of absolute quantitative protein biomarker content can be used to develop a retrospective cancer profile database (RC) or more precisely a database of different cancer types (including breast, colorectal or prostate cancer) to take full advantage of A large amount of stored FFPE samples ("cancer profile" in this text corresponds to the English expression "cancer profile", sometimes referred to as "cancer profile information" alone or simply "profile information" or "information" depending on the context) .
通过组合多个绝对定量的蛋白标志物,足以从数百万储存的FFPE样本中区分单个FFPE样本。在某种意义上,这些蛋白标志物的组合成为数据库中每一个FFPE样本独特的“指纹”。By combining multiple absolute quantitative protein markers, it is sufficient to distinguish a single FFPE sample from millions of stored FFPE samples. In a sense, the combination of these protein markers becomes the unique "fingerprint" of each FFPE sample in the database.
以这个独特的“指纹”为核心,可以结合与之匹配的临床记录,包括传统临床病理参数、治疗方案和相应的临床结局,为每一个FFPE样本提供全方位的信息。With this unique "fingerprint" as the core, it can be combined with matching clinical records, including traditional clinicopathological parameters, treatment plans and corresponding clinical outcomes, to provide a full range of information for each FFPE sample.
来自这些不同方面的所有信息构成了数据库中每个FFPE样本的个体癌症概况信息(ICP)。任何其它临床相关的性状表现(trait)均可包括在这些癌症概况信息中。例如,包括单核苷酸变异(SNV)、染色体错位以及各种基因预测分析的评分在内的遗传信息均可以包括在癌症概况信息中。All the information from these different aspects constitutes the individual cancer profile information (ICP) for each FFPE sample in the database. Any other clinically relevant traits can be included in these cancer profiles. For example, genetic information including single nucleotide variants (SNVs), chromosomal translocations, and scores for various genetic prediction analyses can be included in cancer profile information.
数据库的绝对特征保证数据库可以不断成长。虽然ICP的来源不同,但基于其数据的绝对特征可以有效结合在一起。新的癌症简况也可以随时间不断增加、填补。在未来可预期该数据库会容纳相当多的储存的FFPE样品的简况来支持基于“大数据”的临床诊断。The absolute nature of the database ensures that the database can continue to grow. Although the sources of ICPs are different, absolute features based on their data can be effectively combined. New cancer profiles can also be added and filled in over time. In the future it is expected that the database will accommodate a considerable number of profiles of stored FFPE samples to support "big data" based clinical diagnosis.
此外,上述方法进一步还包括构建一个回顾性癌症(RC)数据库以提供癌症的诊断、预估和预后的方法,该方法包括:提供患有已知临床结局的癌症的多个个体;为所述多个个体中的每个生成ICP,其中所述ICP包括:i)经过绝对定量测定的多个蛋白标志物、以及ii)癌症的已知临床结局,以及将生成的所述多个个体的ICP存储于数据库中。In addition, the above method further comprises a method of constructing a retrospective cancer (RC) database to provide diagnosis, prediction and prognosis of cancer, the method comprising: providing a plurality of individuals with cancer of known clinical outcome; each of the plurality of individuals generates an ICP, wherein the ICP includes: i) a plurality of protein markers determined by absolute quantification, and ii) a known clinical outcome of cancer, and the ICP of the plurality of individuals to be generated stored in the database.
在本发明的一实施方式中,生物标志物的表达水平可以被测定为绝对的且连续的变量。In one embodiment of the invention, the expression level of the biomarker can be determined as an absolute and continuous variable.
在本发明的一实施方式中,生物标志物的表达水平可以通过质谱分析法进行测定。In one embodiment of the invention, the expression level of the biomarker can be determined by mass spectrometry.
在本发明的一实施方式中,生物标志物的表达水平可以通过酶联免疫法(ELISA)进行测定。In one embodiment of the present invention, the expression level of the biomarker can be determined by enzyme-linked immunosorbent assay (ELISA).
在本发明的一实施方式中,生物标志物的表达水平可以通过量化斑点免疫印迹分析(QDB)法进行测定。In one embodiment of the present invention, the expression level of the biomarker can be determined by quantitative dot blot analysis (QDB).
在本发明的一实施方式中,三个以上(包括三个)的生物标志物的蛋白表达水平可以通过ELISA、QDB和质谱分析任意组合的方法进行测定。In one embodiment of the present invention, the protein expression levels of three or more (including three) biomarkers can be determined by any combination of ELISA, QDB and mass spectrometry.
数据库中ICP的生物标志物定量表达量水平可以与其相关的临床信息结合以用于医学用途的数学分析。例如可以探索生物标志物的绝对量与无病生存期(DFS)的潜在关系,为患者提供预测性的临床预后。Quantitative expression levels of biomarkers of ICP in the database can be combined with their associated clinical information for mathematical analysis for medical use. For example, the potential relationship between absolute amounts of biomarkers and disease-free survival (DFS) can be explored to provide patients with predictive clinical outcomes.
在本发明的一实施方式中,来自ICP的以连续变量形式表示的多种生物标志物的量可以与相关临床信息(包括但不限于无病生存期、总生存期(overall survival:OS)、副作用、年龄、疾病的不同发展期)结合以便寻找潜在的因果关系,并且该因果关系可以用于癌症诊断和预后的目的。In one embodiment of the present invention, the amount of multiple biomarkers expressed as continuous variables from ICP can be correlated with relevant clinical information (including but not limited to disease-free survival, overall survival (OS), side effects, age, different stages of disease development) are combined to find potential causal relationships that can be used for cancer diagnosis and prognosis purposes.
在本发明的一实施方式中,来自ICP的三个以上的生物标志物的绝对量可以作为(x,y,z)的坐标,将个体定位在由X、Y、Z轴决定的空间里(定位点)。样品的定位点与相关临床信息(包括但不限于无病生存期、总生存期、副作用、年龄、疾病的不同发展期)结合以寻找空间相关性,并且该相关性可以用于诊断和预后的目的。In one embodiment of the present invention, the absolute amounts of three or more biomarkers from ICP can be used as (x, y, z) coordinates to locate the individual in the space determined by the X, Y, and Z axes ( location point). The location of the sample is combined with relevant clinical information (including but not limited to disease-free survival, overall survival, side effects, age, different stages of disease development) to find spatial correlations, and the correlations can be used for diagnosis and prognosis. Purpose.
在本发明的一实施方式中,在X、Y、Z轴决定的空间中多于一个ICP的定位点可以被分成与临床诊断、预估和预后相关的临床亚群。In one embodiment of the present invention, more than one ICP locator in the space determined by the X, Y, and Z axes can be divided into clinical subgroups related to clinical diagnosis, prediction and prognosis.
本发明的另一方面涉及一种参考数据库,该数据库用于根据患者活检样品中多于一种标志物的定量分析来用于癌症的诊断。参考数据库包括多个ICP,其中每个ICP均通过以下步骤构建:(a)从癌症患者中获得已知临床诊断的活检样品;(b)在活检样品中测定三个以上的所述生物标志物水平作为绝对的且连续的变量;(c)利用三种生物标志物水平作为x、y、z坐标点,在空间中定位每个ICP(定位点);(d)将每个ICP按照定位点与该癌症患者已知的临床诊断、预估和预后相关联,从而基于空间定位获得参考概况信息(referenceprofile)。Another aspect of the invention relates to a reference database for use in the diagnosis of cancer based on quantitative analysis of more than one marker in a biopsy sample of a patient. The reference database includes multiple ICPs, where each ICP is constructed by: (a) obtaining biopsy samples of known clinical diagnoses from cancer patients; (b) determining three or more of the biomarkers in the biopsy samples level as an absolute and continuous variable; (c) using the three biomarker levels as x, y, z coordinate points to locate each ICP (anchor point) in space; (d) assigning each ICP to an anchor point A reference profile is obtained based on spatial localization by correlating with the known clinical diagnosis, prediction and prognosis of the cancer patient.
另一方面,本发明提供了对患者进行癌症诊断的方法。该方法包括以下步骤:(i)提供上述参考空间数据库;(ii)从患者中获得活检样品;(iii)对所述活检样品中三种生物标志物进行测定,其结果表达为绝对的且连续的变量,测定结果是所述活检样品中三种标志物的连续变量;(iv)将所述三种生物标志物水平分别作为(x,y,z)坐标将样品定位于参考空间数据库中;以及(v)在参考空间数据库中识别与患者样品最匹配的参考空间概况信息,输出与识别的参考概况信息相关联的已知临床诊断。In another aspect, the present invention provides methods of diagnosing cancer in a patient. The method comprises the steps of: (i) providing the aforementioned reference space database; (ii) obtaining a biopsy sample from a patient; (iii) determining three biomarkers in the biopsy sample, the results of which are expressed as absolute and continuous The variable of , the determination result is a continuous variable of the three markers in the biopsy sample; (iv) the three biomarker levels are respectively used as (x, y, z) coordinates to locate the sample in the reference space database; and (v) identifying the reference space profile information that best matches the patient sample in the reference space database, outputting the known clinical diagnosis associated with the identified reference profile information.
本发明的另一方面涉及一种用于提供癌症的诊断、预估或预后的数据库,所述数据库含有多个由已知癌症临床结局的个体生成的ICP。此外,ICP包括:i)从来自储存的个体的FFPE样本的定量测定的多个临床参数,以及ii)癌症的已知临床结局。此外,多个临床参数中的每个临床参数代表生物标志物的定量测定结果。此外,定量测定结果是连续的而且是样本中的生物标志物的绝对的量。Another aspect of the invention relates to a database for providing a diagnosis, prediction or prognosis of cancer, the database containing a plurality of ICPs generated by individuals with known clinical outcomes of cancer. In addition, ICP includes: i) a number of clinical parameters determined quantitatively from FFPE samples from stored individuals, and ii) known clinical outcomes of cancer. In addition, each of the plurality of clinical parameters represents a quantitative determination of the biomarker. Furthermore, the quantitative determination results are continuous and are the absolute amount of the biomarker in the sample.
本发明的另一方面涉及提供患者癌症的诊断、预估或预后的方法。该方法包括:1)采集患者的FFPE样本;2)从上述数据库中获得i)存储的ICP以及ii)数据库中使用的临床参数集(即一组临床参数);3)将数据库中每个ICP中所述临床参数集的定量水平与患者的FFPE样本中的同一临床参数集的定量水平进行比较;4)通过比较来识别出数据库中与患者最相配的ICP;5)将数据库中识别出的ICP的临床结局输出。Another aspect of the invention relates to a method of providing a diagnosis, prediction or prognosis of cancer in a patient. The method includes: 1) collecting FFPE samples from patients; 2) obtaining i) stored ICPs and ii) a set of clinical parameters (ie, a set of clinical parameters) used in the database from the above database; 3) converting each ICP in the database The quantitative levels of the clinical parameter set described in are compared with the quantitative levels of the same clinical parameter set in the patient's FFPE sample; 4) identify the ICP in the database that best matches the patient by comparison; Clinical outcome output of ICP.
在上述方法中,所述比较旨在确定ICP中的所述临床参数集与从患者的FFPE样本中测定的相同临床参数集之间的最大相似度。In the above method, the comparison is aimed at determining the maximum similarity between the set of clinical parameters in the ICP and the same set of clinical parameters determined from the patient's FFPE sample.
在本发明的一实施方式中,相似度可以通过比较一组蛋白标志物的绝对水平来判断。通过使用患者的生物标志物的定量水平来识别鉴定在同一生物标志物的预设范围内的ICP。对于一组生物标志物中每种生物标志物的水平都处于患者的该同一组生物标志物中相应的生物标志物的预设范围内的ICP而言,其被认为是与该患者相似的。In one embodiment of the present invention, similarity can be judged by comparing the absolute levels of a set of protein markers. ICPs identified within a preset range of the same biomarker were identified by using the quantitative levels of the biomarkers in the patient. An ICP for which the level of each biomarker in a panel of biomarkers is within a predetermined range for the corresponding biomarker in the same panel of biomarkers is considered similar to that patient.
在本发明的一实施方式中,一组生物标志物中每种生物标志物的预设范围可以相同。In one embodiment of the invention, the predetermined range for each biomarker in a set of biomarkers may be the same.
在本发明的另一实施方式中,用于评估ICP与患者的相似度的一组蛋白标志物中的不同生物标志物的预设范围可以不同。In another embodiment of the present invention, the preset ranges for different biomarkers in a panel of protein markers used to assess the similarity of ICP to a patient may be different.
在本发明的一实施方式中,ICP与患者的相似度可以基于两组定量的临床参数集之间的欧氏距离(Euclidean distance)来计算。In one embodiment of the present invention, the similarity between the ICP and the patient can be calculated based on the Euclidean distance between two sets of quantitative clinical parameters.
可以基于相似度从数据库中识别出多个ICP。并且通过对其临床结局进行数学分析来为患者提供个性化预后。Multiple ICPs can be identified from the database based on similarity. And by mathematical analysis of their clinical outcomes to provide patients with personalized prognosis.
可以基于相似度从数据库中识别出多个ICP。并且通过对其治疗方案及临床结局进行数学分析来为患者提供预后最好的治疗方案。Multiple ICPs can be identified from the database based on similarity. And through the mathematical analysis of its treatment plan and clinical outcome to provide patients with the best prognosis treatment plan.
在本发明的另一实施方式中,其它的临床表现(包括如年龄、肿瘤大小、肿瘤等级以及淋巴结状态在内的传统的临床参数)可以用于进一步提高ICP与患者的相似度。In another embodiment of the present invention, other clinical manifestations (including traditional clinical parameters such as age, tumor size, tumor grade, and lymph node status) can be used to further improve the similarity of ICP to the patient.
本发明的详情也反映于附图以及在下面的描述中阐述。本发明的其它特征、目的和优势在本领域技术人员阅读这些附图和描述以及附加的权利要求书时应显而易见。The details of the invention are also reflected in the drawings and set forth in the description below. Other features, objects, and advantages of the present invention will become apparent to those skilled in the art from a reading of the drawings and description, together with the appended claims.
附图简要说明Brief Description of Drawings
图1示出了利用来自1049个乳腺癌样本的PR、ER和Her2的表达水平作为坐标构建的三维散点图。ER、PR和Her2的表达水平是通过QDB方法进行测定,其数值被用于利用Origin软件构建三维散点图,以X轴表示PR、Y轴表示ER、Z轴表示Her2。来自每个患者的定位点的分布将空间分成不同的区域,包括激素区(激素组:Hormone group)样品完全分布在X和Y轴所呈现的平面上、Her2区(Her2组:Her2 group)围绕在Z轴上,以及角落区(角落组:corner group)(样品堆积在X、Y和Z轴的交界处。角落区包括了三阴型(三阴组:triplenegative group)和正常样型(正常样组:normal like group,也称类正常组)。Figure 1 shows a three-dimensional scatter plot constructed using the expression levels of PR, ER and Her2 from 1049 breast cancer samples as coordinates. The expression levels of ER, PR, and Her2 were determined by the QDB method, and their values were used to construct a three-dimensional scatterplot using Origin software, with PR on the X-axis, ER on the Y-axis, and Her2 on the Z-axis. The distribution of anchor points from each patient divides the space into distinct regions, including the hormone zone (hormone group) samples are completely distributed on the plane presented by the X and Y axes, the Her2 zone (Her2 group: Her2 group) surrounding On the Z axis, as well as the corner area (corner group: corner group) (samples are stacked at the junction of the X, Y and Z axes. The corner area includes the triple negative type (triplenegative group) and the normal type (normal type). Sample group: normal like group, also called normal group).
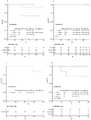
图2示出了使用Kaplan-Meier生存分析法针对基于ER、PR、Her2和Ki67的绝对水平识别出的5名假定患者的相似组(similarity groups)的总生存期(OS)与相应临床亚型的总生存期进行的比较。基于IHC的替代分析将数据库中的概况信息分为管腔A样亚型、管腔B样亚型、Her2阳性亚型和三阴性(TNBC)亚型,它们的总生存期被用作为参考,使用Log-Rank检验与5名假定患者的相似组进行比较,p<0.05被认为具有统计显著性。(a)#1388和#1843患者的相似组与TNBC亚型的总生存期比较;(b)#1445患者的相似组与Her2阳性亚型的总生存期比较;(c)##1807患者的相似组与管腔A样亚型的总生存期比较;以及(d)#1519*患者的相似组与管腔B样亚型的总生存期比较。作为低于两倍定量限[2×Limit of Quantitation(LOQ)]的生物标志物的水平被认为没有区别,以增加可供分析的概况信息数量。Figure 2 shows overall survival (OS) versus corresponding clinical subtypes using Kaplan-Meier survival analysis for similarity groups of 5 putative patients identified based on absolute levels of ER, PR, Her2 and Ki67 comparison of overall survival. An IHC-based surrogate analysis divided the profile information in the database into luminal A-like, luminal B-like, Her2-positive, and triple-negative (TNBC) subtypes, and their overall survival was used as a reference, Comparison with a similar group of 5 putative patients was performed using the Log-Rank test and p<0.05 was considered statistically significant. (a) Comparison of overall survival between similar groups of patients #1388 and #1843 with TNBC subtypes; (b) Comparison of overall survival between similar groups of patients #1445 and Her2 positive subtypes; (c) Comparison of overall survival of similar groups of patients #1807 Comparison of overall survival in the similar group with the luminal A-like subtype; and (d) overall survival in the similar group with the luminal B-like subtype in
图3示出了使用Kaplan-Meier生存分析法针对基于ER、PR、Her2、Ki67和cyclinD1的绝对水平识别的5名假定患者的相似组的总生存期与相应临床亚型的总生存期进行的比较。基于IHC的替代分析将数据库中的概况信息分成管腔A样亚型、管腔B样亚型、Her2阳性亚型和三阴性(TNBC)亚型,它们的总生存期被作为参考,使用Log-Rank检验与5名假定患者的相似组进行比较,p<0.05被认为具有统计显著性。(a)#1388和#1843患者的相似组与TNBC亚型的总生存期进行比较;(b)#1445患者的相似组与Her2阳性亚型的总生存期进行比较;(c)#1807患者的相似组与管腔A样亚型的总生存期进行比较;以及(d)#1519*患者的相似组与管腔B样亚型的总生存期进行比较。在两倍定量限(LOQ)以内的生物标志物的量被认为没有区别以增加可供分析的概况信息数量。Figure 3 shows overall survival for a similar group of 5 putative patients identified based on absolute levels of ER, PR, Her2, Ki67 and cyclinD1 versus the corresponding clinical subtype using Kaplan-Meier survival analysis Compare. An IHC-based surrogate analysis divided the profile information in the database into luminal A-like, luminal B-like, Her2-positive, and triple-negative (TNBC) subtypes, and their overall survival was used as a reference, using Log -Rank test was compared to a similar group of 5 putative patients and p<0.05 was considered statistically significant. (a) Overall survival in a similar group of patients #1388 and #1843 compared with TNBC subtype; (b) Similar group in
图4示出了使用Kaplan-Meier生存分析法针对基于ER、PR、Her2、Ki67的绝对量识别的5名假定患者的相似组内接受不同的临床治疗的概况信息的总生存期进行的比较。治疗方案不清的概况信息未包括在分析内。(a)#1388患者的相似组内接受化疗(Chemo)、内分泌治疗(ET)以及化疗和内分泌联合治疗(CET:本说明书及其附图中也记作“C&E”或“C+E”,下同)的概况信息的总生存期分析;(b)#1843患者的相似组内接受化疗(Chemo)、内分泌治疗(ET)以及化疗和内分泌联合治疗(CET)的概况信息的总生存期分析;(c)#1807患者的相似组内接受化疗(Chemo)的概况信息的总生存期分析;(d)#1519*患者的相似组内接受化疗(Chemo)以及化疗和内分泌联合治疗(CET)的概况信息的总生存期分析。在两倍定量限(LOQ)以内的生物标志物的水平被认为相同以增加可供分析的概况信息数量Figure 4 shows a comparison of overall survival using Kaplan-Meier survival analysis for profile information receiving different clinical treatments within a similar group of 5 putative patients identified based on absolute amounts of ER, PR, Her2, Ki67. Profile information for unclear treatment regimens was not included in the analysis. (a) A similar group of patient #1388 received chemotherapy (Chemo), endocrine therapy (ET), and combined chemotherapy and endocrine therapy (CET: also referred to as "C&E" or "C+E" in this specification and the accompanying drawings, Overall survival analysis of profile information of the same below); (b) overall survival analysis of profile information of chemotherapy (Chemo), endocrine therapy (ET) and chemotherapy and endocrine combination therapy (CET) in a similar group of
具体实施方式Detailed ways
在描述本发明的方法之前,需要声明的是,本发明在具体应用中会存在变化而不仅仅局限于在此所述的这些方法和装置。本说明书中所记载的术语仅仅是出于描述特定实施方式的目的,而并非限制这些实施方式,本发明的保护范围仅受附加的权利要求书的限制。Before describing the method of the present invention, it should be stated that the present invention may vary in specific applications and is not limited to the methods and apparatuses described herein. The terms described in this specification are only for the purpose of describing specific embodiments, rather than limiting these embodiments, and the protection scope of the present invention is only limited by the appended claims.
除非另有说明,本说明书中使用的所有科技术语与本领域技术人员的理解相同。Unless otherwise specified, all technical and scientific terms used in this specification are the same as understood by those skilled in the art.
本发明涉及的内容主要出于临床诊断的目的。因而,在本说明书中,“决定或鉴定或测定(determining)”、“测量或检测(measuring)”、“评估(assessing)”和“分析(assaying)”可混用,并且包括了定量和定性两种测量方式。这些术语既可以指定量也可以指半定量,因此,“决定或鉴定或测定(determining)”和“分析(assaying)”、“测量或检测(measuring)”及其类似的描述可以混用。当要说明定量测量时,则会用到“测定分析物的量”或类似的描述。当要说明定量或半定量时,则会用到“测定分析物的水平”或者“检定(detecting)分析物”的描述。The content involved in the present invention is mainly for the purpose of clinical diagnosis. Thus, in this specification, "determining or identifying or determining", "measuring", "assessing" and "assaying" are used interchangeably and include both quantitative and qualitative a measurement method. These terms can refer either to quantitative or semi-quantitative, and thus, "determining or identifying or determining" and "assaying", "measuring" and similar descriptions can be used interchangeably. When a quantitative measurement is to be stated, "determining the amount of the analyte" or a similar description is used. When quantitative or semi-quantitative is intended, the description "determining the level of the analyte" or "detecting the analyte" is used.
本说明书中描述的“量化”分析通常提供样品中的分析物与参比物(对照)的相对水平的信息,一般以数字呈现,其中“0”值可指定为分析物的量低于检测极限(LOD)。The "quantitative" assays described in this specification generally provide information on the relative levels of the analyte in the sample to the reference (control), typically presented numerically, where a "0" value can be assigned as the amount of analyte below the detection limit (LOD).
“个体(subject)”、“宿主(host)”、“患者”和“个人(individual)”在本说明书可以混用,指任何需要诊断或治疗的哺乳类(特别是人类)对象。"Subject", "host", "patient" and "individual" are used interchangeably herein to refer to any mammalian (especially human) subject in need of diagnosis or treatment.
“空间”和“三维”(3D)可以互换地描述在三维空间中对代表样品的定位点(斑点:spot)的定位,其中定位点的强度代表了作为连续变量的第四种生物标志物的量。"Spatial" and "three-dimensional" (3D) are used interchangeably to describe the localization of anchor points (spots) representing a sample in three-dimensional space, where the intensity of the anchor points represents a fourth biomarker as a continuous variable amount.
在组织水平对生物标志物的蛋白表达水平的定量测定可以通过任何方法来实现。该方法应该在其最广泛的文脉(语境)下考虑,只要生物标志物的表达水平可以被定量为连续变量的方法都包含其中。这些方法包括但不限于质谱分析或免疫分析以及两种方法的组合。Quantitative determination of protein expression levels of biomarkers at the tissue level can be accomplished by any method. The method should be considered in its broadest context (context), as long as the expression level of the biomarker can be quantified as a continuous variable. These methods include, but are not limited to, mass spectrometry or immunoassay and combinations of the two methods.
本发明的测定结果可以是相对的结果,也可以是利用标准蛋白而表达为绝对的结果。术语“相对”和“绝对”是指两种测定方式,应该包含其最广泛的文脉。相对测定的是一种物质与另一种物质的比较结果,绝对测定利用标准单位测定一种物质的已知水平。也许,这两种方法最显著的区别在于其应用范围。相对结果只有在同样的实验条件下才有意义,而绝对结果可以在许多不同的分析中进行比较,即使分析是在完全不同的时间和地点进行的。The measurement result of the present invention may be a relative result or an absolute result expressed using a standard protein. The terms "relative" and "absolute" refer to both assays and should be embraced in their broadest context. Relative measurements compare the results of one substance to another, and absolute measurements use standard units to measure a known level of a substance. Perhaps the most striking difference between the two approaches is their scope of application. Relative results are only meaningful under the same experimental conditions, whereas absolute results can be compared across many different assays, even when the assays are performed at completely different times and locations.
在本说明书中混用的“样品(sample)”、“患者样品(patient sample)”或“样本(specimen)”和“生物样品(biological sample)”一般是指可用于测量特定分子的样品,优选诸如下文中所述的生物标志物等的与生物特征相关联的特定的标志物分子。样品可以包括但不限于外周血细胞、CNS液、血清、血浆、口腔拭子(swab)、尿液、唾液、泪液、胸水及其类似物。在本发明中的样品一般指组织。"sample", "patient sample" or "specimen" and "biological sample" used interchangeably in this specification generally refer to a sample that can be used to measure a particular molecule, preferably such as Specific marker molecules associated with biological features, such as the biomarkers described below. Samples can include, but are not limited to, peripheral blood cells, CNS fluid, serum, plasma, buccal swabs (swabs), urine, saliva, tears, pleural fluid, and the like. A sample in the present invention generally refers to tissue.
术语“标志物”和“生物标志物”应定义为其最广泛的文脉。在此可互换混用的“标志物”和“生物标志物”一般是指,在来自一种表型(例如患者)的样品中与来自另一种表型(例如没有患病或患有不同疾病)的相比是存在不同的分子(例如多肽)。一种生物标志物的确立基于其在两种不同的表型中表达不同,也就是当其在第一种表型中的平均或者中位水平同其在第二种表型中经过计算呈现具有统计学意义的不同。The terms "marker" and "biomarker" should be defined in their broadest context. "Marker" and "biomarker" are used interchangeably herein to generally mean that in a sample from one phenotype (eg, a patient) is different from another phenotype (eg, not having the disease or having disease) is the presence of different molecules (eg polypeptides). A biomarker is established on the basis that it is expressed differently in two different phenotypes, that is, when its mean or median level in the first phenotype is the same as that calculated in the second phenotype. statistically significant difference.
在本发明中,生物标志物是指与生物或者疾病状态相关联的可测量的分子。它可以是已充分确立的临床诊断用生物标志物(例如免疫组化分析用临床生物标志物)或者是新发现的体外诊断用生物标志物。In the present invention, a biomarker refers to a measurable molecule associated with a biological or disease state. It can be a well established clinical diagnostic biomarker (eg immunohistochemical analysis clinical biomarker) or a newly discovered in vitro diagnostic biomarker.
在本说明书中“参考”或“对照”是可被互换性地来指可用来针对观察的数据相比较的已知数据或已知数据组。已知数据代表两个参数之间的已知相互关系,例如生物标志物的表达水平与其相关的表型之间的相互关系。在此,已知数据构成了参考数据库中的参考概况信息。In this specification "reference" or "control" are used interchangeably to refer to known data or a set of known data that can be compared against observed data. Known data represents a known correlation between two parameters, such as the correlation between the expression level of a biomarker and its associated phenotype. Here, the known data constitute the reference profile information in the reference database.
相应地,参考数据库可以通过存储多个参考概况信息以用于诊断目的,每个参考概况信息包括从已知诊断结果或治疗后已知临床疗效结果的对象个体获得的样品中生物标志物的水平。Accordingly, the reference database can be used for diagnostic purposes by storing a plurality of reference profiles, each reference profile comprising a level of a biomarker in a sample obtained from a subject with known diagnostic results or known clinical efficacy results after treatment. .
在一实施方式中,本发明涉及构建一种为癌症患者提供诊断、预估和预后的RC数据库的方法,该方法包括:提供多个已知癌症临床结局的个体;为多个个体中的每个个体构建ICP,该ICP包括i)多个绝对定量的蛋白标志物以及ii)癌症的已知临床结局;以及将生成的多个个体的ICP存储于数据库中。In one embodiment, the present invention relates to a method of constructing an RC database that provides diagnosis, prediction and prognosis for cancer patients, the method comprising: providing a plurality of individuals with known clinical outcomes of cancer; for each of the plurality of individuals; Individuals construct an ICP that includes i) a plurality of absolute quantitative protein markers and ii) a known clinical outcome of cancer; and the generated ICPs of the plurality of individuals are stored in a database.
在每个ICP中不仅仅包括多个蛋白标志物,还可以包括其它的临床表现(包括年龄、肿瘤大小、肿瘤等级和淋巴结状态)。其它来自临床分析的结果(包括血液生物标志物的水平以及各种酶的水平)都可以包括在ICP内。Not only multiple protein markers are included in each ICP, but other clinical manifestations (including age, tumor size, tumor grade, and lymph node status) may also be included. Other results from clinical analysis, including levels of blood biomarkers and levels of various enzymes, can be included in the ICP.
本发明还涉及如何从回顾性癌症数据库中识别与患者的概况信息最匹配的一个以上的参考ICP的方法。该方法包括:(a)在合适的程序控制计算机上,将患者的一组蛋白标志物的表达水平与数据库中每个ICP的表达水平进行比较;(b)在合适的程序控制计算机上,识别与患者高度相似的ICP;以及(c)将同患者的概况信息最匹配的参考数据库中的ICP的最大相似度或其相关表型输出到用户界面设备、计算机可读存储介质或者区域性或可远程接入的计算机系统,或者直接显示。The present invention also relates to a method of how to identify from a retrospective cancer database more than one reference ICP that best matches the patient's profile information. The method comprises: (a) on a suitably programmed computer, comparing the patient's expression level of a panel of protein markers with the expression level of each ICP in the database; (b) on a suitably programmed computer, identifying ICPs that are highly similar to the patient; and (c) output to a user interface device, computer readable storage medium, or regional or accessible Remote access to computer systems, or direct display.
有多种用于比较患者与数据库中ICP的相似度的方法,其包括:基于针对预设的蛋白标志物的数学分析的评估,或者通过一组生物标志物的表达量逐步筛选ICP。There are various methods for comparing the similarity of patients to ICPs in the database, including: evaluation based on mathematical analysis of predefined protein markers, or stepwise screening of ICPs by the expression of a panel of biomarkers.
生物标志物的表达水平在通过数学分析比较ICP与患者的相似度的过程中可以进行校正,也可以在这一过程中不进行校正。The expression levels of the biomarkers may or may not be corrected in the process of comparing the similarity of the ICP to the patient through a mathematical analysis.
生物标志物的表达水平在通过数学分析比较ICP与患者的相似度的过程中可以进行加权,也可以在这一过程中不进行加权。The expression levels of biomarkers may or may not be weighted in the process of comparing the similarity of ICP to patients by mathematical analysis.
在一实施方式中,相似度是通过基于一组生物标志物计算ICP与患者的欧氏距离来实现。In one embodiment, similarity is achieved by calculating the Euclidean distance of the ICP to the patient based on a set of biomarkers.
与患者相似的ICP也可以通过基于一组生物标志物表达水平逐步筛选来识别。这种方法包括:a)筛选其生物标志物a在患者的生物标志物a预设表达范围内的所有ICP;b)从筛选的ICP中进一步筛选其生物标志物b在患者的生物标志物b的预设表达范围内该的所有ICP;c)在进一步筛选的ICP中,进一步筛选其生物标志物c在患者的生物标志物c的预设表达范围的所有ICP;……n)在进一步筛选的ICP中进一步筛选其生物标志物n在患者的生物标志物n的预设表达范围内的所有ICP。ICPs that are similar to patients can also be identified by stepwise screening based on expression levels of a panel of biomarkers. This method includes: a) screening all ICPs whose biomarker a is within a preset expression range of the patient's biomarker a; b) further screening from the screened ICPs whose biomarker b is in the patient's biomarker b All ICPs within the preset expression range of the patient; c) in the further screened ICPs, further screen all ICPs whose biomarker c is within the preset expression range of the patient’s biomarker c; n) in the further screening All ICPs whose biomarker n is within the preset expression range of the patient's biomarker n are further screened in the ICP.
在预先设定的生物标志物中,每种生物标志物的预设范围可以相同,也可以不同。Among the preset biomarkers, the preset range of each biomarker can be the same or different.
在本发明的一实施方式中,经过上述过程筛选后的ICP可以进一步通过其它临床表现,包括年龄、性别、肿瘤大小、肿瘤等级等进行筛选。例如,对于一个59岁的男性肺癌患者,肿瘤大小为2级、肿瘤等级为三级、淋巴结状态为N2的患者,基于蛋白标志物的相似ICP可以进一步缩小限制至相似的年龄(55到60岁)、男性、肿瘤大小为2级、肿瘤等级为三级、淋巴结状态为N2的ICP来提高对患者的临床诊断的准确性。In one embodiment of the present invention, the ICP screened by the above process can be further screened by other clinical manifestations, including age, gender, tumor size, tumor grade, and the like. For example, for a 59-year-old male lung cancer patient with a tumor size of 2, a tumor grade of 3, and a lymph node status of N2, similar ICP based on protein markers can be further narrowed to a similar age (55 to 60 years old). ), male, tumor size of
一种基于空间关系的方法可以包括:(a)测定作为连续变量的三个以上的生物标志物的样品;(b)利用三种生物标志物(A,B,C)的值作为坐标(x,y,z),在由X、Y、Z轴确立的空间中定位一个代表样品的点(定位点);(c)根据患者在空间的定位点对患者进行评估,特别是步骤(c)包括了对患者癌症的诊断和预后。对患者癌症的诊断和预后的例子包括无病生存期、总生存期或癌症治疗预测。A method based on spatial relationships may include: (a) determining a sample of more than three biomarkers as continuous variables; (b) using the values of the three biomarkers (A, B, C) as coordinates (x , y, z), locate a point in the space established by the X, Y, Z axes that represents the sample (anchor point); (c) evaluate the patient according to the patient's anchor point in space, especially step (c) The diagnosis and prognosis of a patient's cancer are included. Examples of diagnosis and prognosis for a patient's cancer include disease-free survival, overall survival, or cancer treatment prediction.
在上述方法中还可以包括:(d)第四种生物标志物(D)可以用来替代上述三种生物标志物中的一个,例如(A,B,D)来确立样品在新空间的定位点;然后(e)基于新空间的定位点进一步评估患者,特别是步骤(e)包括了对患者癌症的诊断和预后。对患者癌症的诊断和预后的例子包括无病生存期、总生存期或癌症治疗预测。In the above method can also include: (d) a fourth biomarker (D) can be used to replace one of the above three biomarkers, eg (A, B, D) to establish the localization of the sample in the new space point; then (e) further assessing the patient based on the new spatial location point, in particular step (e) involves the diagnosis and prognosis of the patient's cancer. Examples of diagnosis and prognosis for a patient's cancer include disease-free survival, overall survival, or cancer treatment prediction.
此外,在上述方法中还可以是:(d)第四和第五种生物标志物(D和E)可以用来替代上述三种生物标志物中的一个,例如(A,D,E)来确立样品在新空间的定位点;以及(e)基于新空间的定位点进一步评估患者,特别是在步骤(e)中包括了对患者癌症的诊断和预后。对患者癌症的诊断和预后的例子包括无病生存期、总生存期或癌症治疗预测。In addition, in the above method: (d) the fourth and fifth biomarkers (D and E) can be used to replace one of the above three biomarkers, for example (A, D, E) to establishing a localization point for the sample in the new space; and (e) further evaluating the patient based on the localization point in the new space, particularly in step (e) involving the diagnosis and prognosis of the patient's cancer. Examples of diagnosis and prognosis for a patient's cancer include disease-free survival, overall survival, or cancer treatment prediction.
此外,在上述的方法中还可以是:(d)第四、第五和第六种生物标志物(D、E和F)可以用来将样品在新空间中定位;以及(e)基于新空间的定位点进一步评估患者,特别是步骤(e)中包括了对患者癌症的诊断和预后。对患者癌症的诊断和预后的例子包括无病生存期、总生存期或癌症治疗预测。In addition, in the above method it can also be: (d) the fourth, fifth and sixth biomarkers (D, E and F) can be used to localize the sample in the new space; and (e) based on the new The spatial location points further evaluate the patient, especially step (e) includes the diagnosis and prognosis of the patient's cancer. Examples of diagnosis and prognosis for a patient's cancer include disease-free survival, overall survival, or cancer treatment prediction.
由A、B、C决定的空间定位点位置以及由A、B、D决定的新的定位点可以依次用于进一步评估患者,包括对患者癌症的诊断和预后。对患者癌症的诊断和预后的例子包括无病生存期、总生存期或癌症治疗预测。The location of the spatial anchor points determined by A, B, C and the new anchor points determined by A, B, D can in turn be used for further evaluation of the patient, including the diagnosis and prognosis of the patient's cancer. Examples of diagnosis and prognosis for a patient's cancer include disease-free survival, overall survival, or cancer treatment prediction.
由A、B、C决定的空间定位点位置以及由A、B、D决定的新的定位点可以同步用于进一步评估患者,包括对患者癌症的诊断和预后。对患者癌症的诊断和预后包括无病生存期、总生存期或癌症治疗预测。The location of the spatial anchor points determined by A, B, and C and the new anchor points determined by A, B, and D can be simultaneously used for further evaluation of the patient, including the diagnosis and prognosis of the patient's cancer. The diagnosis and prognosis of a patient's cancer include disease-free survival, overall survival, or cancer treatment prediction.
由A、B、C决定的空间定位点位置以及由A、D、E决定的新的定位点可以依次用于进一步评估患者,包括对患者癌症进行诊断和预后。对患者癌症的诊断和预后包括无病生存期、总生存期或癌症治疗预测。The location of the spatial anchor points determined by A, B, C and the new anchor points determined by A, D, E can in turn be used for further evaluation of the patient, including diagnosis and prognosis of the patient's cancer. The diagnosis and prognosis of a patient's cancer include disease-free survival, overall survival, or cancer treatment prediction.
由A、B、C决定的空间定位点位置以及由A、D、E决定的新的定位点可以同步用于进一步评估患者,包括对患者癌症的诊断和预后。对患者癌症的诊断和预后包括无病生存期、总生存期或癌症治疗预测。The location of the spatial anchor points determined by A, B, and C and the new anchor points determined by A, D, and E can be simultaneously used for further evaluation of the patient, including the diagnosis and prognosis of the patient's cancer. The diagnosis and prognosis of a patient's cancer include disease-free survival, overall survival, or cancer treatment prediction.
由A、B、C决定的空间定位点位置以及由D、E、F决定的新的定位点可以依次用来于进一步评估患者,包括对患者癌症的诊断和预后。对患者癌症的诊断和预后包括无病生存期、总生存期或癌症治疗预测。The locations of the spatial anchor points determined by A, B, and C and the new anchor points determined by D, E, and F can in turn be used for further evaluation of the patient, including the diagnosis and prognosis of the patient's cancer. Diagnosis and prognosis of a patient's cancer include disease-free survival, overall survival, or cancer treatment prediction.
由A、B、C决定的空间定位点位置以及由D、E、F决定的新的定位点可以同步用于进一步评估患者,包括对患者癌症的诊断和预后。对患者癌症的诊断和预后包括无病生存期、总生存期或癌症治疗预测。The locations of the spatial anchor points determined by A, B, and C and the new anchor points determined by D, E, and F can be simultaneously used for further evaluation of the patient, including the diagnosis and prognosis of the patient's cancer. The diagnosis and prognosis of a patient's cancer include disease-free survival, overall survival, or cancer treatment prediction.
在一实施方式中,本发明还包括确定与患者概况信息最匹配的参考空间数据库中的一个亚组(sub-group)的参考空间概况信息(reference spatial profile)(sub-group)的方法。这个方法包括如下步骤:(a)在合适的程序控制计算机上,使用三种生物标志物的水平作为坐标,比较来自患者样品在空间中的定位(定位点);以及(b)与在参考空间数据库中的参考空间概况信息的亚组进行比较,以确定与参考空间概况信息的亚组的接近度(closeness);(b)在合适的程序控制计算机上,识别在参考数据库中与定位点最近的参考空间概况信息的亚组;以及(c)将同患者的空间概况信息最匹配的、参考数据库中的参考空间概况信息的亚组的最大相似度或其相关表型输出到用户界面设备、计算机可读存储介质或者区域性或可远程接入的计算机系统,或者直接显示。In one embodiment, the present invention also includes a method of determining reference spatial profile (sub-group) of a sub-group in the reference spatial database that best matches patient profile information. This method includes the steps of: (a) comparing the location in space (anchor point) of a sample from a patient, on a suitable programmed computer, using the levels of the three biomarkers as coordinates; Subgroups of reference spatial profile information in the database are compared to determine closeness to the subgroup of reference spatial profile information; (b) on a suitable programmed computer, identify the closest location to the anchor point in the reference database and (c) output to the user interface device, to the user interface device, the maximum similarity of the subgroup of reference spatial profile information in the reference database, or its associated phenotype, that best matches the patient's spatial profile information, Computer readable storage medium or regional or remotely accessible computer system, or direct display.
使用数学方法来探究患者的定位点与一个临床表现的推定关系。作为例子包括但不限于在由ER、PR和Her2的表达水平构成的三维散点图中定位点与无病生存期的关系。这些信息可以在同类分析中为其它患者提供预后。Mathematical methods were used to explore the putative relationship of a patient's anchor point to a clinical presentation. Examples include, but are not limited to, the relationship between anchor points and disease-free survival in a three-dimensional scatterplot composed of expression levels of ER, PR, and Her2. This information can provide prognosis for other patients in a homogeneous analysis.
上述RC数据库可用于探索ICP与临床结局之间的关系。使用数学分析来探究同每个ICP相关的已知临床结局与生物标志物的表达水平之间的因果关系。The aforementioned RC database can be used to explore the relationship between ICP and clinical outcomes. Mathematical analysis was used to explore the causal relationship between the known clinical outcomes associated with each ICP and the expression levels of the biomarkers.
临床“表现(trait)”和临床“信息(information)”可互换并且应该在其最广泛的文脉下考虑。临床表现(clinical trait)包括但不限于年龄、性别、血压、葡萄糖水平、癌症分级、无病生存期或者任何与患者的诊断、预防和治疗相关的信息。Clinical "trait" and clinical "information" are interchangeable and should be considered in their broadest context. Clinical traits include, but are not limited to, age, gender, blood pressure, glucose level, cancer grade, disease-free survival, or any information relevant to the diagnosis, prevention, and treatment of the patient.
数据库的多个ICP的临床结局可以集合起来用于统计分析来为患者提供个性化诊断、预估和预后。统计方法包括了单因素生存分析、多因素生存分析、C指数分析、Kaplan-Meier生存分析以及Log-Rank生存分析。The clinical outcomes of multiple ICPs in the database can be aggregated for statistical analysis to provide individualized diagnosis, prediction, and prognosis for patients. Statistical methods included univariate survival analysis, multivariate survival analysis, C index analysis, Kaplan-Meier survival analysis and Log-Rank survival analysis.
不同于现在流行的用于乳腺癌和前列腺癌诊断的分型方法,本发明利用世界上广泛存在的大量储存的FFPE样本以单个患者为中心,以识别与该患者高度相似的一组ICP,并分析其临床结局从而为每个癌症患者提供个性化的诊断、预估和预后。Unlike the currently popular typing methods for breast and prostate cancer diagnosis, the present invention utilizes the world's widely available and massively stored FFPE samples to focus on a single patient to identify a group of ICPs that are highly similar to that patient, and Its clinical outcomes are analyzed to provide individualized diagnosis, prediction and prognosis for each cancer patient.
显而易见,可供使用的储存的FFPE样本越多,为患者提供的诊断、预估和预后越准确。Clearly, the more stored FFPE samples are available, the more accurate the diagnosis, prediction, and prognosis provided to the patient.
简而言之,现有的诊断方法是画几个圆,然后把每个癌症患者放入这些圆里,由此为癌症患者提供精准治疗。相反,本发明用每个患者作为圆心以包含与其相似的ICP来画出其个性化的圆。结果,有多少位癌症患者就会有多少个圆来利用RC数据库为每个癌症患者提供个性化的诊断、预估和预后。In a nutshell, the current diagnostic method is to draw a few circles, and then put each cancer patient into these circles, thereby providing cancer patients with precise treatment. Instead, the present invention draws its individualized circle with each patient as the center to contain ICPs similar to it. As a result, there are as many circles as there are cancer patients to utilize the RC database to provide individualized diagnoses, estimates and prognosis for each cancer patient.
需要说明的是,在这里描述的示例性实施方式是当前优选的实施方式,因此应该仅作为描述而不局限于此。在每个实施方式中的特征或方案的描述通常应该视为也可用于其它实施方式中的其它类似特征或方案中。It should be noted that the exemplary embodiments described herein are currently preferred embodiments, and thus should only be used for description and not limitation. Descriptions of features or aspects in each embodiment should generally be considered to be available for other similar features or aspects in other embodiments as well.
实施例1Example 1
材料和方法Materials and methods
个体及人源细胞系福尔马林固定石蜡包埋(FFPE)的乳腺癌组织切片及其临床信息取自当地医院(位于山东烟台的烟台毓璜顶医院和滨州医学院附属医院)。Formalin-fixed paraffin-embedded (FFPE) breast cancer tissue sections of individual and human cell lines and their clinical information were obtained from local hospitals (Yantai Yuhuangding Hospital in Yantai, Shandong and Affiliated Hospital of Binzhou Medical College).
通用试剂用于细胞培养的所有通用试剂均购自Thermo Fisher Scientifics(美国马萨诸塞州沃尔瑟姆),包括细胞培养基和培养皿。蛋白酶抑制剂购自Sigma Aldrich公司(美国密苏里州圣路易斯市)。所有其它化学药品购自国药集团化学试剂有限公司(中国北京)。Universal Reagents All universal reagents for cell culture were purchased from Thermo Fisher Scientifics (Waltham, MA, USA), including cell culture media and petri dishes. Protease inhibitors were purchased from Sigma Aldrich (St. Louis, MO, USA). All other chemicals were purchased from Sinopharm Chemical Reagent Co., Ltd. (Beijing, China).
裂解液的制备将两个2×15μm的福尔马林固定石蜡包埋的组织块切片收集到Eppendorf离心管中。将切片脱石蜡,在加有蛋白酶抑制剂(2μg/ml亮抑酶肽、2μg/ml抑肽酶、1μg/ml胃酶抑素、2mM PMSF、2mM NaF)的300μl的裂解缓冲液(50mM HEPES、137mM NaCl、5mM EDTA、1mM MgCl2、10mM Na2P2O7、1%TritonX-100、10%glycerol)中进行超声处理2分钟,然后以12000×g进行离心5分钟。收集上清液进行免疫印迹分析。总蛋白质浓度根据制造商的说明使用Pierce BCA蛋白质测定试剂盒进行测量。Lysate preparation Two 2 x 15 μm sections of formalin-fixed paraffin-embedded tissue blocks were collected into Eppendorf centrifuge tubes. Sections were deparaffinized and lysed in 300 μl of lysis buffer (50 mM HEPES) supplemented with protease inhibitors (2 μg/ml leupeptin, 2 μg/ml aprotinin, 1 μg/ml pepstatin, 2 mM PMSF, 2 mM NaF). , 137 mM NaCl, 5 mM EDTA, 1 mM MgCl2 , 10 mM Na2 P2 O7 , 1% TritonX-100, 10% glycerol) for 2 minutes, followed by centrifugation at 12000 xg for 5 minutes. The supernatant was collected for immunoblot analysis. Total protein concentration was measured using the Pierce BCA protein assay kit according to the manufacturer's instructions.
QDB分析特异性抗体(针对Her2的EP3或4B5克隆,针对Ki67的MIB1克隆,针对雌激素受体(ER)的SP1和孕激素受体的1E2、针对cyclinD1的SA38-08)各自的线性范围是用来自几个分别对这些生物标志物呈阳性反应的患者的裂解物加以混合的混合液来确定的。首先混合等量的3至4个来自乳腺癌组织的组织裂解液,将混合的裂解液从0至2μg进行梯度稀释以确定QDB分析的线性范围。对于作为商品购入的或者由公司内部自行表达并纯化的标准蛋白也按0pg至500pg的梯度稀释以用于确定QDB分析的线性范围。The respective linear ranges for QDB analysis-specific antibodies (EP3 or 4B5 clones against Her2, MIB1 clones against Ki67, SP1 and progesterone receptors for estrogen receptor (ER) and 1E2 for progesterone receptors, SA38-08 for cyclinD1) are Determined using a pool of lysates from several patients who were individually positive for these biomarkers. Equal amounts of 3 to 4 tissue lysates from breast cancer tissue were first mixed, and the mixed lysates were serially diluted from 0 to 2 μg to determine the linear range of the QDB analysis. Serial dilutions from 0 pg to 500 pg were also used to determine the linear range of the QDB analysis for standard proteins either purchased as a commercial product or expressed and purified in-house.
将样品按一式三份以2μl/单元加到QDB板上,并如现有技术中所述进行处理。在每孔中加入100μl第一抗体,在4℃下孵育过夜。再在室温下将驴抗兔或驴抗小鼠第二抗体与QDB板孵育4小时。先用TBST简单冲洗QDB板两次,再清洗5次,每次10分钟,然后将它们放入白色96孔板中3分钟,该白色96孔板预先加有100μl/孔根据制造商的说明书制备的ECL溶液。然后使用Tecan Infiniti 200pro酶标仪,通过在用户界面上选择“带盖的板”来定量测量来自组合板(recombinant plate)的每个孔的化学发光信号。Samples were added to QDB plates in triplicate at 2 μl/unit and processed as described in the prior art. Add 100 μl of primary antibody to each well and incubate overnight at 4°C. Donkey anti-rabbit or donkey anti-mouse secondary antibodies were incubated with the QDB plates for an additional 4 hours at room temperature. The QDB plates were briefly rinsed twice with TBST and then washed 5 times for 10 min each before placing them for 3 min in a white 96-well plate pre-loaded with 100 μl/well prepared according to the manufacturer’s instructions ECL solution. The chemiluminescent signal from each well of the recombinant plate was then quantitatively measured using a Tecan Infiniti 200pro microplate reader by selecting "plate with lid" on the user interface.
使用所获得的读数通过对照标准蛋白(蛋白标准品)来测定FFPE样本中生物标志物水平。将测得的PR、ER、Her2和Ki67的生物标志物水平输入数据库。将样本分为三组用于QDB分析。从每组中选取6个样本(2个强表达、2个弱表达和2个中等表达)在相同实验中进行测定以验证结果的一致性。The obtained reads were used to determine biomarker levels in FFPE samples by reference to standard proteins (protein standards). The measured biomarker levels of PR, ER, Her2 and Ki67 were entered into the database. The samples were divided into three groups for QDB analysis. Six samples from each group (2 strong, 2 weak and 2 moderate) were tested in the same experiment to verify the consistency of the results.
将这些结果使用OriginPro 9.1软件绘制3D散点图。These results were plotted as 3D scatter plots using OriginPro 9.1 software.
实施例1介绍了如何使用ER、PR和Her2的蛋白水平来创建3D散点图,并使用该散点图来确定患者的治疗计划。Example 1 describes how to use the protein levels of ER, PR, and Her2 to create a 3D scatterplot and use the scatterplot to determine a patient's treatment plan.
利用QDB方法将PR、ER和Her2的蛋白质水平测定为绝对的且连续的变量,将结果输入QDB数据库。The protein levels of PR, ER and Her2 were determined as absolute and continuous variables using the QDB method, and the results were entered into the QDB database.
将更多的样品的结果输入该QDB数据库以确保数据库的增长。The results of more samples are entered into the QDB database to ensure database growth.
使用QDB数据库中ER、PR和Her2水平创建3D散点图,并不断调整该散点图以确保其准确性和全面性(图1)。A 3D scatterplot was created using the ER, PR, and Her2 levels from the QDB database and continuously adjusted to ensure its accuracy and comprehensiveness (Figure 1).
每个定位点代表一个样本的3D散点图定义为参考空间数据库。A 3D scatter plot where each anchor point represents a sample is defined as a reference spatial database.
使用数学分析将临床信息(包括DFS和OS)与参考空间数据库中的每个定位点相关联。Clinical information, including DFS and OS, was associated with each locus in the reference spatial database using mathematical analysis.
使用QDB方法测定患者FFPE样本的ER、PR和Her2的水平。The levels of ER, PR, and Her2 in patient FFPE samples were determined using the QDB method.
将代表该患者的定位点定位于参考空间数据库中。An anchor point representing the patient is located in the reference space database.
根据患者在参考空间分布图中定位点来识别参考空间概况信息,并对来自该参考空间概况信息的临床信息进行分析,以用于该患者的诊断、预估和预后。The reference space profile information is identified according to the positioning points of the patient in the reference space distribution map, and the clinical information from the reference space profile information is analyzed for diagnosis, prediction and prognosis of the patient.
或者,根据空间定位可将参考空间概况信息划分为不同的亚组。Alternatively, the reference spatial profile information can be divided into different subgroups according to spatial localization.
将临床信息(包括DFS和OS)与参考空间概况信息的每个亚组相关联。在此情况下是指激素组、Her2组和角落组。Clinical information, including DFS and OS, were associated with each subgroup of reference spatial profile information. In this case the hormone group, the Her2 group and the corner group.
利用QDB方法测定患者的FFPE样本中ER、PR和Her2的水平,通过空间定位将其定位点定位于某亚组中。The levels of ER, PR and Her2 in patients' FFPE samples were determined by QDB method, and their localization points were located in a subgroup by spatial localization.
根据定位点所在的亚组为患者提供临床诊断、预估和预后。Provide clinical diagnosis, prediction and prognosis for patients according to the subgroup in which the anchor point is located.
实施例2Example 2
材料和方法的详细描述见实施例1。See Example 1 for a detailed description of the materials and methods.
本实施例介绍了如何利用基于临床研究的3D模型为患者提供诊断、预估和预后。This example describes how 3D models based on clinical studies can be used to provide diagnosis, prediction, and prognosis for patients.
通过分析大量具有匹配临床信息的研究空间信息,构建了一个将空间定位与临床信息(包括DFS和OS)相关联的3D模型。By analyzing a large amount of study spatial information with matching clinical information, a 3D model was constructed that correlates spatial localization with clinical information, including DFS and OS.
将患者的三种生物标志物的蛋白水平测定为绝对的且连续的变量。The patient's protein levels of the three biomarkers were determined as absolute and continuous variables.
在由仪器或软件支持的3D模型中,根据三种生物标志物的表达水平对患者进行空间定位。In a 3D model supported by an instrument or software, patients were spatially localized based on the expression levels of three biomarkers.
通过3D模型,基于三种生物标志物的水平对病人进行的空间定位,为患者提供诊断、预估或预后。Through the 3D model, the spatial positioning of the patient based on the levels of the three biomarkers provides a diagnosis, prediction or prognosis for the patient.
实施例3Example 3
材料和方法的详细描述见实施例1。See Example 1 for a detailed description of the materials and methods.
本实施例介绍了如何针对亚亚组(sub-sub-group)患者依次使用两个3D散点图以进行临床诊断、预估和预后。This example describes how to sequentially use two 3D scatterplots for sub-sub-group patients for clinical diagnosis, prediction and prognosis.
使用QDB方法测定两例患者FFPE样本中6种生物标志物ER、PR、Her2、ki67、PCNA以及p53的水平。The levels of six biomarkers ER, PR, Her2, ki67, PCNA and p53 in FFPE samples from two patients were determined using the QDB method.
在以ER、PR、Her2表达水平为X、Y、Z轴的参考空间数据库3D散点图中,根据这两例患者ER、PR及Her2表达水平确定的定位点的空间位置,将其划分到同一亚组。In the 3D scatter plot of the reference spatial database with the expression levels of ER, PR, and Her2 as the X, Y, and Z axes, according to the spatial positions of the positioning points determined by the expression levels of ER, PR, and Her2 in these two patients, they were divided into the same subgroup.
将基于这两例患者Ki67、PCNA、p53表达水平确定的两个定位点,定位于以Ki67、PCNA、p53为X、Y、Z轴的3D散点图中。The two positioning points determined based on the expression levels of Ki67, PCNA, and p53 in these two patients were positioned in a 3D scatterplot with Ki67, PCNA, and p53 as the X, Y, and Z axes.
定位点201位于由Ki67和PCNA构建的侧壁上,并且p53不表达,并且定位点202因Ki67、PCNA和p53的强表达而导致其漂浮在空间中。The anchor 201 is located on the sidewall constructed by Ki67 and PCNA and p53 is not expressed, and the anchor 202 is caused to float in space due to the strong expression of Ki67, PCNA and p53.
因此,尽管患者201和202在ER、PR、Her2的3D散点图中属于同一亚组(管腔A组),但在以Ki67、PCNA、p53的3D散点图中属于不同的亚组。Therefore, although patients 201 and 202 belonged to the same subgroup (Luminal Group A) in the 3D scatter plot of ER, PR, Her2, they belonged to different subgroups in the 3D scatter plot of Ki67, PCNA, p53.
实施例4Example 4
使用从本地采集的427例FFPE样本开发的乳腺癌概况数据库进行研究。临床结局仅限于本研究中患者的总生存期(OS)。虽然用于评估相似度的最优选的一组蛋白标志物尚待探索,但已经利用QDB方法完成了对这些FFPE样本中乳腺癌常用的几种生物标志物(ER、PR、Her2、Ki67以及cyclinD1)的绝对定量测定。这些蛋白标志物的测定结果,结合记录在案的临床病理参数(年龄、肿瘤大小、肿瘤分级、淋巴结状态)、治疗方案以及得到的临床结局,对这个初级的癌症概况数据库中的每个样本创建了ICP。The study was conducted using a breast cancer profile database developed from 427 locally collected FFPE samples. Clinical outcomes were limited to overall survival (OS) of the patients in this study. Although the most preferred set of protein markers for assessing similarity remains to be explored, several biomarkers (ER, PR, Her2, Ki67, and cyclinD1 commonly used in breast cancer in these FFPE samples have been completed using the QDB approach) ) for the absolute quantification of . Measurements of these protein markers, combined with documented clinicopathological parameters (age, tumor size, tumor grade, lymph node status), treatment regimens, and resulting clinical outcomes, were created for each sample in this primary cancer profile database ICP.
从癌症概况数据库中随机选取至少一种生物标志物水平相互存在显著差异的5个FFPE样本(#1388、#1843、#1445、#1807、#1519)的概况信息被用来作为假定的新增患者(表1)。另外,这些样本还代表基于IHC替代分型(分析)的四种临床亚型,其中#1388和#1843为三阴性(TNBC)亚型、#1445为Her2阳性亚型、#1807为管腔A样亚型、#1519为管腔B样亚型。Profile information of 5 FFPE samples (#1388, #1843, #1445, #1807, #1519) randomly selected from the cancer profile database with significantly different levels of at least one biomarker from each other were used as putative additions patients (Table 1). In addition, these samples also represent four clinical subtypes based on IHC surrogate typing (analysis), with #1388 and #1843 being triple negative (TNBC) subtype, #1445 being Her2 positive subtype, and #1807 being Lumen A B-like subtype, #1519 is a luminal B-like subtype.
在临床实践中,ER、PR、Her2及Ki67这4种生物标志物最先被用于定义患者的临床亚型。在本研究中,这4种标志物也首先被用来评估不同的假定患者与数据库中每个癌症概况信息的相似度。计算每名假定患者与数据库中每个癌症概况信息的欧氏距离并按照从低到高进行排序。如果生物标志物的水平都低于最低定量限(LOQ),则认为它们的表达水平相同。此外,由于数据库的规模较小,若某癌症概况信息的一种或多种生物标志物水平低于假定患者的50%或高于假定患者的2倍,则该癌症概况信息不予采用。例如#1519假定患者的ER水平为2nmole/g,则认为数据库中任何ER小于1nmole/g或大于4nmole/g的癌症概况信息都与#1519患者不相似而拒绝。In clinical practice, four biomarkers, ER, PR, Her2, and Ki67, were first used to define the clinical subtypes of patients. In this study, these 4 markers were also first used to assess the similarity of different putative patients with each cancer profile information in the database. The Euclidean distance of each hypothetical patient to each cancer profile in the database was calculated and sorted from low to high. If the levels of the biomarkers were all below the lower limit of quantitation (LOQ), they were considered to be expressed at the same level. In addition, due to the small size of the database, a cancer profile was not used if the level of one or more biomarkers was less than 50% of the presumed patients or more than 2 times the presumed patient. For
在这个小型数据库中,分别为假定患者#1388、#1843、#1445、#1807找到了18、35、10、14例相似癌症概况信息,与患者#1519相似的只有3个癌症概况信息(表1)。显然,数据库的规模极大地限制了使用者或研究者的分析能力,这进一步强调了需要将数据库扩大到成千上万甚至数百万的癌症概况信息,才能充分发挥这种方法的潜力。In this small database, 18, 35, 10, 14 similar cancer profiles were found for putative patients #1388, #1843, #1445, #1807, respectively, and only 3 cancer profiles were similar to patient #1519 (Table 1). 1). Clearly, the size of the database greatly limits the analytical capabilities of the user or researcher, further underscoring the need to scale the database to tens of thousands or even millions of cancer profiles in order to realize the full potential of this approach.
将每一组的相似的癌症概况信息(相似组)的OS与假定患者相应的临床亚型的OS进行比较(图2)。如图2中a部分所示,#1388的相似组(本说明书及其附图中也称“#1388相似组”或“#1388组”,其它类推)和#1843的相似组的10年生存率(简称:10y SP)均略高于TNBC亚型。然而,这些差异尚未达到统计显著性(p=0.057)。对于作为Her2阳性亚型的#1445的相似组的OS较整个Her2阳性组略有提高,10y SP从72%提高到88%(p=0.27)。对于与作为管腔A样亚型的#1807相似的14个癌症概况信息,其10y SP与整个管腔A样亚型高度相似(p=0.91)。The OS for each group of similar cancer profiles (similar groups) was compared to the OS for the corresponding clinical subtype of the putative patient (Figure 2). As shown in part a in Figure 2, the 10-year survival of the similar group of #1388 (also referred to as "#1388 similar group" or "#1388 group" in this specification and its accompanying drawings, and the like) and the similar group of #1843 The rate (abbreviation: 10y SP) was slightly higher than that of TNBC subtypes. However, these differences did not reach statistical significance (p=0.057). The OS for the similar group for #1445, which is a Her2 positive subtype, was slightly improved over the entire Her2 positive group, from 72% to 88% at 10y SP (p=0.27). For 14 cancer profiles similar to #1807 as a luminal A-like subtype, its 10y SP was highly similar to the overall luminal A-like subtype (p=0.91).
由于数据库规模较小,只有3个癌症概况信息与作为管腔B样亚型的#1519相似。为了从该数据集中提取潜在的指示信息以供参考,略微放宽了针对相似度的限制,即把生物标志物水平低于2×LOQ的癌症概况信息也纳入其中。例如,若Her2的LOQ为0.15nmole/g,则任何Her2小于0.3nmole/g的概况信息都被认为有相同的Her2水平。在该放宽的条件下,16个癌症概况信息被确认为与#1519相似,并且该相似组与整个管腔B样亚型相比10y SP显著变差(p=0.0096)。Due to the small size of the database, only 3 cancer profiles were similar to #1519 as a luminal B-like subtype. In order to extract potential indicators from this dataset for reference, the restriction on similarity was slightly relaxed to include cancer profiles with biomarker levels below 2×LOQ. For example, if the LOQ of Her2 is 0.15 nmole/g, any profile information with Her2 less than 0.3 nmole/g is considered to have the same Her2 level. Under this relaxed condition, 16 cancer profiles were confirmed to be similar to #1519, and this similar group was significantly worse at 10y SP compared to the entire luminal B-like subtype (p=0.0096).
可想而知,评估中包含的生物标志物越多,概况信息与新患者之间的相似度就越能达到更高的水平。因此,鉴于cyclinD1在预测管腔样亚型患者的总生存期方面是独立于Ki67之外的生物标志物,将其纳入评估中以识别5名假定患者各自的相似组。分别计算数据库中每个概况信息与这5名假定患者之间的欧氏距离,并按照距离进行排序(表2)。任何与假定患者的生物标志物水平相比低于其50%或高于其2倍的癌症概况信息,都不被纳入相似组。Conceivably, the more biomarkers included in the assessment, the higher the level of similarity between profile information and new patients. Therefore, given that cyclinD1 is a biomarker independent of Ki67 in predicting overall survival in patients with the luminal subtype, it was included in the assessment to identify similar groups of each of the 5 putative patients. The Euclidean distances between each profile information in the database and these 5 putative patients were calculated separately and sorted by distance (Table 2). Any cancer profile information that was less than 50% or more than 2-fold compared to the putative patient's biomarker level was excluded from the similar group.
不出所料,在所有病例中能发现与假定患者相似的癌症概况信息更少。#1388相似组由18例降为7例、#1843相似组由35例降为20例、#1445相似组由10例降为7例、#1807相似组由14例降为5例、#1519相似组由16例降为9例。采用Log Rank检验,将各相似组的OS与假定患者相应临床亚型的OS进行比较(图3)。出乎意料的是,cyclinD1的加入能够使#1843组、#1388组与TNBC组的差异均达到统计显著性(p=0.023),#1843组的10y SP(100%)显著高于,而#1388组的10y SP(57%)显著低于TNBC亚型的10y SP(75%)(图3的a)。另一方面,cyclinD1的加入对#1445组的预后帮助不大(图3的b)。cyclinD1的加入使#1807组的预后比管腔A样亚型更差,但这种差异未达到统计学差异(p=0.095)。对于#1519组,其OS仍然比管腔B样亚型差,其Log Rank检验值为p=0.034。Unsurprisingly, less information on the cancer profile similar to the putative patient was found in all cases. #1388 similar group decreased from 18 cases to 7 cases, #1843 similar group decreased from 35 cases to 20 cases, #1445 similar group decreased from 10 cases to 7 cases, #1807 similar group decreased from 14 cases to 5 cases, #1519 The similar group was reduced from 16 cases to 9 cases. Using the Log Rank test, OS in each similar group was compared to that of the corresponding clinical subtype of the hypothetical patient (Figure 3). Unexpectedly, the addition of cyclinD1 can make the difference between #1843 group, #1388 group and TNBC group reach statistical significance (p=0.023), the 10y SP (100%) of #1843 group is significantly higher than that of #1843 group, while # The 10y SP (57%) of the 1388 group was significantly lower than that of the TNBC subtype (75%) (Fig. 3a). On the other hand, the addition of cyclinD1 had little effect on the prognosis of the #1445 group (Fig. 3b). The addition of cyclinD1 resulted in a worse prognosis in the #1807 group than the luminal A-like subtype, but this difference did not reach statistical significance (p=0.095). For
该方法最大的用处是为新患者提供量身定制的治疗建议。因此,每个相似组内的概况信息根据其所接受的治疗被进一步分组,并进行OS分析以确定疗效最佳的治疗方案。由于数据库规模较小,治疗方式被简单分为化疗(CT)、内分泌治疗(ET)以及化疗内分泌联合治疗(CET)。该研究使用了基于ER、PR、Her2和Ki67四种生物标志物确定的相似组,以引入更多的概况信息以供分析。The most useful use of this method is to provide tailored treatment recommendations for new patients. Therefore, profiles within each similar group were further grouped according to the treatment they received, and OS analysis was performed to determine the most effective treatment regimen. Due to the small size of the database, treatment modalities are simply divided into chemotherapy (CT), endocrine therapy (ET), and combined chemotherapy and endocrine therapy (CET). The study used a similar panel determined based on four biomarkers, ER, PR, Her2 and Ki67, to introduce more profile information for analysis.
对于#1388相似组(图4的a),仅接受CT的患者(n=12)的5年生存率(简称:5y SP)为92%,而接受CET治疗的患者(n=3)的5y SP为67%。对于#1843组,无论接受何种治疗,所有患者均存活。对于#1445组,由于该组所有患者都仅接受了CT,因此无法提取到任何相关信息。对于#1807组,仅接受CT的患者(n=4)的10y SP为100%,而接受CET的患者(n=8)的10y SP为71%。对于#1519组,虽然接受CET的患者(n=6)的5y SP比仅接受CT的患者(n=9)表现出优势,但这种优势在后期消失了。For the #1388 similar group (Fig. 4a), the 5-year survival rate (abbreviation: 5y SP) was 92% for patients who received CT only (n=12) compared to 5y for patients who received CET (n=3) SP is 67%. For
因此,本文显示了基于相邻原则的诊断方法为5名假定患者提供个性化OS预测的可行性。#1388、#1843和#1519的10y SP与相应临床亚型的10y SP存在显著差异。通过OS分析,还对5名假定患者的相似组进行了各种治疗方式的有效性评估。然而,由于数据库规模的限制,他们的差异没有统计显著性,无法为这些假定患者提供指导。Therefore, this paper shows the feasibility of a diagnostic approach based on the adjacency principle to provide personalized OS predictions for 5 putative patients. The 10y SP of #1388, #1843 and #1519 were significantly different from the 10y SP of the corresponding clinical subtypes. A similar group of 5 putative patients was also evaluated for the effectiveness of various treatment modalities by OS analysis. However, due to database size limitations, their differences were not statistically significant to provide guidance for these putative patients.
值得注意的是,尽管#1843属于预后最差的临床亚型TNBC,但其相似组的所有患者不论接受何种治疗也仍然在研究结束时存活(图3的a以及图4的b)。这令人怀疑#1843属于最初分子分型研究中描述的正常样亚型(Normal-like subtype,也称“类正常亚型”)。Notably, despite #1843 being the worst-prognostic clinical subtype of TNBC, all patients in a similar group were still alive at the end of the study regardless of treatment (Figure 3a and Figure 4b). This raises the suspicion that #1843 belongs to the normal-like subtype (also called "normal-like subtype") described in the initial molecular typing study.
显然,随着概念和技术的成熟,在日常临床实践中应用这种新型诊断方法的限速步骤是开发一个比本研究中使用的数据库大得多的癌症概况数据库。例如,若有大于10000例乳腺癌概况信息(breast cancer profile),基于5种生物标志物可以确定大约500个(10000/400×20)概况信息与#1843高度相似,125个概况信息与#1807高度相似,175个概况信息与#1388和#1445高度相似,从而为这5名假定患者提供可靠的指导。Clearly, as the concept and technology mature, the rate-limiting step in applying this novel diagnostic method in daily clinical practice is to develop a database of cancer profiles that is much larger than the one used in this study. For example, if there are more than 10,000 breast cancer profiles, about 500 (10,000/400×20) profiles can be determined based on 5 biomarkers that are highly similar to #1843, and 125 profiles are highly similar to #1807 Highly similar, 175 profiles were highly similar to #1388 and #1445, thus providing reliable guidance for these 5 putative patients.
然而,即使在这种规模下,仍然难以识别出足够数量的与#1519相似的癌症概况信息,因为基于4种生物标志物只能识别75个概况信息,如果评估相似度时使用5种生物标志物,则能识别的概况信息就更少了。可想而知,像#1519这样的患者在目前的临床实践中更有可能被过度治疗或治疗不足,这是由于在涉及成百上千病例的临床试验中这些患者不太可能得到充分应对。However, even at this scale, it is still difficult to identify a sufficient number of cancer profiles similar to #1519, as only 75 profiles can be identified based on 4 biomarkers, if 5 biomarkers are used when assessing similarity object, the profile information that can be identified is even less. It is conceivable that patients like #1519 are more likely to be over- or under-treated in current clinical practice, as these patients are less likely to be adequately addressed in clinical trials involving hundreds of thousands of cases.
同样,由于数据库规模有限,本研究将治疗方式分为CT、ET和CET。然而,单就化疗而言,至少有4种类型的药物:烷化剂、抗肿瘤抗生素、抗代谢药和有丝分裂抑制剂。在每种类型中,还有几种不同的药物可供选择。显然,只有通过扩展数据库才能找出对新患者具有最佳疗效结局的确切药物。Again, due to the limited size of the database, this study divided treatment modalities into CT, ET, and CET. However, for chemotherapy alone, there are at least 4 types of drugs: alkylating agents, antitumor antibiotics, antimetabolites, and mitotic inhibitors. Within each type, there are also several different medicines to choose from. Clearly, the exact drug with the best efficacy outcome for new patients can only be identified by expanding the database.
所有这些考虑都强调了广泛扩展数据库的必要性。幸运的是,由于QDB技术绝对定量的特性,前面所述的癌症概况数据库是一个不断成长的数据库。随着这种方法在全球范围内被接受,预计在不久的将来该数据库将呈指数级增长。All of these considerations underscore the need for extensive database expansion. Fortunately, due to the absolutely quantitative nature of QDB technology, the aforementioned database of cancer profiles is a growing database. This database is expected to grow exponentially in the near future as this method is accepted globally.
本研究中使用的5种生物标志物不一定是评估乳腺癌患者相似度的最佳选择。然而,它们可以作为从所有现有生物标志物和候选生物标志物中识别最优选数量和组合的基础,以评估乳腺癌患者之间的相似度。能够对患者提供可靠指导所需的相似的概况信息最低数量还需要通过全球肿瘤学家和统计学家的合作努力来确定。The 5 biomarkers used in this study are not necessarily the best for assessing similarity in breast cancer patients. However, they can serve as a basis for identifying the most preferred quantities and combinations from all existing biomarkers and candidate biomarkers to assess similarity between breast cancer patients. The minimum amount of similar profile information required to provide reliable guidance to patients will also need to be determined through a collaborative effort of oncologists and statisticians worldwide.
不可否认,欧氏距离在本研究中的作用有限,因为所有生物标志物水平与假定患者相比都大于其50%且小于其200%的癌症概况信息数量有限。然而,可以想象其对于显著扩张的数据库的巨大作用,可以确立一个基于欧氏距离的切断(cut)值以识别那些与新患者具有最高相似度的癌症概况信息。Admittedly, the Euclidean distance had a limited role in this study because of the limited amount of cancer profile information for which all biomarker levels were greater than 50% and less than 200% of the hypothetical patient. However, it is conceivable to have a great effect on a significantly expanded database, where a cut value based on Euclidean distance can be established to identify those cancer profiles with the highest similarity to new patients.
同样值得一提的是,尽管在本研究中,相似度评估是完全基于一组蛋白标志物的表达水平,但其它临床病理参数(如年龄、肿瘤大小、淋巴结状态、基于Oncotype测定的RS分数、基于PAM50测定的ROR评分)也可以结合到评估中以提高相似度的水平。同样,虽然本研究仅限于OS分析,但包括复发在内的其它临床结局也可在需要的时候用于评估。It is also worth mentioning that although in this study the similarity assessment was based solely on the expression level of a set of protein markers, other clinicopathological parameters (such as age, tumor size, lymph node status, RS score based on Oncotype assay, The ROR score based on PAM50 determination) can also be incorporated into the assessment to increase the level of similarity. Likewise, although this study was limited to an OS analysis, other clinical outcomes, including recurrence, could be assessed if needed.
材料和方法Materials and methods
个体及人源细胞系:由滨州医学院烟台附属医院和青岛大学附属烟台毓璜顶医院(中国烟台市)共同提供490例福尔马林固定石蜡包埋(FFPE)的乳腺癌组织的切片(2×15μm/例),其中427例具有总生存期(OS)数据。包括样品采集和研究方案在内的所有研究均符合《赫尔辛基宣言》,并经滨州医学院烟台附属医院伦理委员会(批准号:#20191127001–郝俊梅)和毓璜顶医院伦理委员会(批准号:[2017]76–于国华)批准。由于这两项研究中的个体是医院大量保存的匿名的、具有回顾性临床数据的FFPE样本,因此豁免了提供知情同意书的要求。Individual and human cell lines: Sections of 490 cases of formalin-fixed paraffin-embedded (FFPE) breast cancer tissue (2× 15 μm/case), of which 427 had overall survival (OS) data. All studies, including sample collection and research protocols, were in compliance with the Declaration of Helsinki and were approved by the Ethics Committee of Yantai Affiliated Hospital of Binzhou Medical College (Approval No.: #20191127001 – Hao Junmei) and the Ethics Committee of Yuhuangding Hospital (Approval No.: [2017]76 – Yu Guohua) approved. The requirement to provide informed consent was waived because the individuals in these two studies were large-scale hospital-held anonymous FFPE samples with retrospective clinical data.
除了生物标志物水平是采用QDB方法测定外,所有临床信息均来自病历。QDB流程在其它文献中也有详细描述。All clinical information was obtained from medical records, except that biomarker levels were determined using the QDB method. The QDB process is also described in detail in other literature.
通用试剂:所有的通用试剂均在别处描述过,ER(SP1)兔单克隆抗体购自AbcamInc,PR(1E2)兔单克隆抗体购自Roche Diagnostics GmbH,Her2(EP3)兔单抗、Ki67(MIB1)鼠单抗及cyclinD1(EP12)兔单抗均购自中杉金桥生物技术有限公司(中国北京,www.zsbio.com)。HRP标记的驴抗兔IgG二抗购自Jackson ImmunoResearch实验室(美国PA,Pike West Grove)。QDB板由Quanticision Diagnostics Inc提供(美国NC,RTP)。Universal reagents: All universal reagents were described elsewhere, ER(SP1) rabbit mAb was purchased from AbcamInc, PR(1E2) rabbit mAb was purchased from Roche Diagnostics GmbH, Her2(EP3) rabbit mAb, Ki67(MIB1) ) mouse mAb and cyclinD1 (EP12) rabbit mAb were purchased from Zhongshan Jinqiao Biotechnology Co., Ltd. (Beijing, China, www.zsbio.com). HRP-labeled donkey anti-rabbit IgG secondary antibody was purchased from Jackson ImmunoResearch Laboratories (Pike West Grove, PA, USA). The QDB plates were provided by Quanticision Diagnostics Inc (NC, RTP, USA).
欧氏距离的计算:用以下公式分别计算样品a(ER、PR、Her2、Ki67)与样品b(ER’、PR’、Her2’、Ki67’)以及样品c(ER、PR、Her2、Ki67和cyclinD1)与样品d(ER’、PR’、Her2’、Ki67’、cyclinD1’)之间的距离:Calculation of Euclidean distance: Calculate sample a (ER, PR, Her2, Ki67) and sample b (ER', PR', Her2', Ki67') and sample c (ER, PR, Her2, Ki67 and Distance between cyclinD1) and sample d (ER', PR', Her2', Ki67', cyclinD1'):
d_ab=√((ER-ER')^2+(PR-PR')^2+(Her2-Her2')^2+(Ki67-Ki67')^2)d_ab=√((ER-ER')^2+(PR-PR')^2+(Her2-Her2')^2+(Ki67-Ki67')^2)
d_cd=√((ER-ER')^2+(PR-PR')^2+(Her2-Her2')^2+(Ki67-Ki67')^2+(cyclinD1-cyclinD1')^2)。d_cd=√((ER-ER')^2+(PR-PR')^2+(Her2-Her2')^2+(Ki67-Ki67')^2+(cyclinD1-cyclinD1')^2).
预先对所有样品中每种生物标志物的QDB结果标准化(通过z-score转化)。定量限(LOQ):Her2为0.15nmol/g,ER为0.1nmol/g,PR为0.25nmol/g,Ki67为1.3nmol/g。QDB results for each biomarker in all samples were pre-normalized (transformed by z-score). Limit of Quantitation (LOQ): 0.15 nmol/g for Her2, 0.1 nmol/g for ER, 0.25 nmol/g for PR, and 1.3 nmol/g for Ki67.
生存分析:不同亚组的总生存期采用Kaplan-Meier法显示,并通过log-rank检验进行比较。P<0.05被认为有统计显著性。所有的统计分析均使用R4.0.1进行(http://www.r-project.org)。Survival analysis: The overall survival of different subgroups was displayed by Kaplan-Meier method and compared by log-rank test. P<0.05 was considered statistically significant. All statistical analyses were performed using R4.0.1 (http://www.r-project.org).
相信所附权利要求书中特别指出了来自于上述披露的本发明中某些特征组合及子组合,具备新颖性和创造性。作为体现在以特征、功能、元件或属性的其它组合和子组合的发明,可以通过修改本权利要求或在本申请或相关申请中提出新的权利要求而得到保护。这些修改的或新的权利要求,无论它们是针对不同的发明还是针对同一发明,无论它们在范围上与原权利要求不同、更宽、更窄或相同,都被视为包括在本发明的所披露的对象范围内。It is believed that the novel and inventive aspects of the certain combinations and sub-combinations of features of the present invention arising from the foregoing disclosure are particularly pointed out in the appended claims. Inventions embodied in other combinations and subcombinations of features, functions, elements, or properties may be claimed through amendment of the present claims or presentation of new claims in this or a related application. Such amended or new claims, whether directed to a different invention or to the same invention, and whether they are different, broader, narrower, or the same in scope as the original claims, are deemed to be included within the scope of the present invention. within the scope of disclosure.
表1:基于ER、PR、Her2及Ki67蛋白绝对定量水平的相似癌症概况信息组(相似组)Table 1: Similar cancer profile information panel based on absolute quantitative levels of ER, PR, Her2 and Ki67 proteins (similar panel)
表1-1#1388相似组Table 1-1#1388 Similar group

表1-2#1843相似组Table 1-2#1843 Similar group

表1-3#1445相似组Table 1-3#1445 Similar group

表1-4#1807相似组Table 1-4#1807 Similar group

表1-5#1519*相似组Table 1-5#1519*Similar group

缩略词:所有临床病理因子均符合美国癌症联合委员会的定义(AJCC)。C:化疗;E:内分泌治疗;LumA与LumB:管腔A样与管腔B样临床亚型;TNBC:三阴型乳腺癌;Her2:Her2阳性亚型;生存结局:0-活,1-死。Abbreviations: All clinicopathological factors met the American Joint Committee on Cancer (AJCC) definition. C: chemotherapy; E: endocrine therapy; LumA and LumB: luminal A-like and luminal B-like clinical subtypes; TNBC: triple-negative breast cancer; Her2: Her2-positive subtype; survival outcome: 0-live, 1- die.
注意:所有在定量限(LOQ)范围内的生物标志物水平均被视为是相同的。至少有一种生物标志物水平量与假定患者有显著差异(<50%或>200%)的那些样品被淘汰。*:在2×LOQ范围内的生物标志物水平被认为是相同的。至少有一种生物标志物水平量与假定患者有显著差异(<50%或>200%)的那些样品被淘汰。Note: All biomarker levels within the limit of quantitation (LOQ) are considered identical. Those samples with at least one biomarker level that differed significantly (<50% or >200%) from the putative patients were eliminated. *: Biomarker levels within the 2×LOQ range were considered identical. Those samples with at least one biomarker level that differed significantly (<50% or >200%) from the putative patients were eliminated.
表2:基于ER、PR、Her2、Ki67及cyclinD1蛋白绝对定量水平的相似癌症概括信息组(相似组)Table 2: Similar cancer summary information group based on absolute quantitative levels of ER, PR, Her2, Ki67 and cyclinD1 proteins (similar group)
表2-1#1388相似组Table 2-1#1388 Similar group

表2-2#1843相似组Table 2-2#1843 Similar group

表2-3#1445相似组Table 2-3#1445 Similar group

表2-4#1807相似组Table 2-4#1807 Similar group

表2-5#1519*相似组Table 2-5#1519*Similar group

缩略词:所有临床病理因子均符合美国癌症联合委员会的定义(AJCC)。C:化疗;E:内分泌治疗;LumA与LumB:管腔A样与管腔B样临床亚型;TNBC:三阴型乳腺癌;Her2:Her2阳性亚型;生存结局:0-活,1-死。Abbreviations: All clinicopathological factors met the American Joint Committee on Cancer (AJCC) definition. C: chemotherapy; E: endocrine therapy; LumA and LumB: luminal A-like and luminal B-like clinical subtypes; TNBC: triple-negative breast cancer; Her2: Her2-positive subtype; survival outcome: 0-live, 1- die.
注意:所有在定量限(LOQ)范围内的生物标志物水平均被视为是相同的。至少有一种生物标志物水平与假定患者有显著差异(<50%或>200%)的那些样品被淘汰。*:在2×LOQ范围内的生物标志物水平被认为是相同的。至少有一种生物标志物水平与假定患者有显著差异(<50%或>200%)的那些样品被淘汰。Note: All biomarker levels within the limit of quantitation (LOQ) are considered identical. Those samples with at least one biomarker level that differed significantly (<50% or >200%) from the putative patients were eliminated. *: Biomarker levels within the 2×LOQ range were considered identical. Those samples with at least one biomarker level that differed significantly (<50% or >200%) from the putative patients were eliminated.
Claims (15)
Applications Claiming Priority (5)
| Application Number | Priority Date | Filing Date | Title |
|---|---|---|---|
| US201962929396P | 2019-11-01 | 2019-11-01 | |
| US62/929,396 | 2019-11-01 | ||
| US201962946742P | 2019-12-11 | 2019-12-11 | |
| US62/946,742 | 2019-12-11 | ||
| PCT/US2020/058582WO2021087477A1 (en) | 2019-11-01 | 2020-11-02 | Method for diagnosis of cancer based on quantitative biomarkers and a database thereof |
Publications (1)
| Publication Number | Publication Date |
|---|---|
| CN114631027Atrue CN114631027A (en) | 2022-06-14 |
Family
ID=75715410
Family Applications (1)
| Application Number | Title | Priority Date | Filing Date |
|---|---|---|---|
| CN202080076711.0APendingCN114631027A (en) | 2019-11-01 | 2020-11-02 | Cancer diagnosis method based on quantitative biomarkers and database thereof |
Country Status (6)
| Country | Link |
|---|---|
| US (1) | US20230049100A1 (en) |
| EP (1) | EP4052041A4 (en) |
| JP (1) | JP7538223B2 (en) |
| CN (1) | CN114631027A (en) |
| CA (1) | CA3156445A1 (en) |
| WO (1) | WO2021087477A1 (en) |
Citations (4)
| Publication number | Priority date | Publication date | Assignee | Title |
|---|---|---|---|---|
| US20100068717A1 (en)* | 2007-01-30 | 2010-03-18 | Indiana University Research And Technology Corporation | Cancer therapy prognosis |
| WO2018157074A1 (en)* | 2017-02-24 | 2018-08-30 | Massachusetts Institute Of Technology | Methods for diagnosing neoplastic lesions |
| WO2019006156A1 (en)* | 2017-06-29 | 2019-01-03 | Quanticision Diagnostics Inc. | Apparatus and method for absolute quantification of biomarkers for solid tumor diagnosis |
| CN109844534A (en)* | 2016-05-24 | 2019-06-04 | 欧恩克斯特姆诊断学(毛里求斯)私人有限公司 | Prognosis and prediction breast cancer relapse method, in the marker and its kit wherein used |
Family Cites Families (1)
| Publication number | Priority date | Publication date | Assignee | Title |
|---|---|---|---|---|
| KR20050008644A (en) | 2001-12-21 | 2005-01-21 | 엘지 바이오메디컬 인스티튜트 | Gene expression profiles in stomach cancer |
- 2020
- 2020-11-02CACA3156445Apatent/CA3156445A1/enactivePending
- 2020-11-02CNCN202080076711.0Apatent/CN114631027A/enactivePending
- 2020-11-02JPJP2022525397Apatent/JP7538223B2/enactiveActive
- 2020-11-02WOPCT/US2020/058582patent/WO2021087477A1/ennot_activeCeased
- 2020-11-02EPEP20881262.8Apatent/EP4052041A4/enactivePending
- 2020-11-02USUS17/758,673patent/US20230049100A1/enactivePending
Patent Citations (4)
| Publication number | Priority date | Publication date | Assignee | Title |
|---|---|---|---|---|
| US20100068717A1 (en)* | 2007-01-30 | 2010-03-18 | Indiana University Research And Technology Corporation | Cancer therapy prognosis |
| CN109844534A (en)* | 2016-05-24 | 2019-06-04 | 欧恩克斯特姆诊断学(毛里求斯)私人有限公司 | Prognosis and prediction breast cancer relapse method, in the marker and its kit wherein used |
| WO2018157074A1 (en)* | 2017-02-24 | 2018-08-30 | Massachusetts Institute Of Technology | Methods for diagnosing neoplastic lesions |
| WO2019006156A1 (en)* | 2017-06-29 | 2019-01-03 | Quanticision Diagnostics Inc. | Apparatus and method for absolute quantification of biomarkers for solid tumor diagnosis |
Non-Patent Citations (2)
| Title |
|---|
| ALI SEYED SHIRKHORSHIDI ET AL.,: "A Comparison Study on Similarity and Dissimilarity Measures in Clustering Continuous Data", 《PLOS ONE》, 11 December 2015 (2015-12-11), pages 1 - 20* |
| JIANDI ZHANG ET AL.,: "Developing a growing cancer profile database based on quantitative analysis of protein biomarkers in formalin-fixed paraffin-embedded specimens", 《FUTURE ONCOL.》, vol. 16, no. 31, 8 August 2020 (2020-08-08), pages 2471 - 2474, XP093204724, DOI: 10.2217/fon-2020-0480* |
Also Published As
| Publication number | Publication date |
|---|---|
| CA3156445A1 (en) | 2021-05-06 |
| JP7538223B2 (en) | 2024-08-21 |
| US20230049100A1 (en) | 2023-02-16 |
| JP2022554301A (en) | 2022-12-28 |
| WO2021087477A1 (en) | 2021-05-06 |
| EP4052041A4 (en) | 2023-11-01 |
| EP4052041A1 (en) | 2022-09-07 |
Similar Documents
| Publication | Publication Date | Title |
|---|---|---|
| Jézéquel et al. | Validation of tumor‐associated macrophage ferritin light chain as a prognostic biomarker in node‐negative breast cancer tumors: A multicentric 2004 national PHRC study | |
| AU2016202107B2 (en) | Ratio based biomarkers and methods of use thereof | |
| Cho | Contribution of oncoproteomics to cancer biomarker discovery | |
| CN102985819B (en) | Lung cancer biomarkers and their uses | |
| US20100070191A1 (en) | Lung Cancer Biomarkers and Uses Thereof | |
| US20090275057A1 (en) | Diagnostic markers predictive of outcomes in colorectal cancer treatment and progression and methods of use thereof | |
| US20100099093A1 (en) | Biomarkers for the Identification Monitoring and Treatment of Head and Neck Cancer | |
| US20120143805A1 (en) | Cancer Biomarkers and Uses Thereof | |
| CN102016589A (en) | DNA repair proteins associated with triple negative breast cancers and methods of use thereof | |
| US20130225442A1 (en) | Lung Cancer Tests | |
| He et al. | Aberrant expression of proteins involved in signal transduction and DNA repair pathways in lung cancer and their association with clinical parameters | |
| Duangkumpha et al. | Discovery and qualification of serum protein biomarker candidates for cholangiocarcinoma diagnosis | |
| TW201643429A (en) | Prostate antigen standard and its use | |
| US20130210648A1 (en) | Ratio based biomarkers and methods of use thereof | |
| Sonntag et al. | Reverse phase protein array based tumor profiling identifies a biomarker signature for risk classification of hormone receptor-positive breast cancer | |
| Bonotti et al. | A novel panel of serum biomarkers for MPM diagnosis | |
| Morris | Genomic and proteomic profiling for cancer diagnosis in dogs | |
| US20140248293A1 (en) | Novel risk biomarkers for lung cancer | |
| EP2972374A2 (en) | Ratio based biomarkers and methods of use thereof | |
| Wang et al. | Afamin expression in breast cancer | |
| CN114631027A (en) | Cancer diagnosis method based on quantitative biomarkers and database thereof | |
| Rižner et al. | The discovery of biomarkers for endometrial cancer: update over the last years | |
| McDunn et al. | Metabolomics and its application to the development of clinical laboratory tests for prostate cancer | |
| EP2472263A1 (en) | Methods for the prognostic assessment of breast cancer | |
| JP2024540836A (en) | Lung cancer prediction and its applications |
Legal Events
| Date | Code | Title | Description |
|---|---|---|---|
| PB01 | Publication | ||
| PB01 | Publication | ||
| SE01 | Entry into force of request for substantive examination | ||
| SE01 | Entry into force of request for substantive examination |