CN114330007A - A system and method for visualizing energy management - Google Patents
A system and method for visualizing energy managementDownload PDFInfo
- Publication number
- CN114330007A CN114330007ACN202111678680.9ACN202111678680ACN114330007ACN 114330007 ACN114330007 ACN 114330007ACN 202111678680 ACN202111678680 ACN 202111678680ACN 114330007 ACN114330007 ACN 114330007A
- Authority
- CN
- China
- Prior art keywords
- power
- model
- module
- display
- data
- Prior art date
- Legal status (The legal status is an assumption and is not a legal conclusion. Google has not performed a legal analysis and makes no representation as to the accuracy of the status listed.)
- Pending
Links
Images

Landscapes
- Remote Monitoring And Control Of Power-Distribution Networks (AREA)
Abstract
Description
Translated fromChinese技术领域technical field
本发明涉及能源管理技术领域,特别涉及一种能源管理可视化展示系统及方法。The invention relates to the technical field of energy management, in particular to a visual display system and method for energy management.
背景技术Background technique
光储直柔(PEDF),是在建筑领域应用太阳能光伏(Photovoltaic)、储能(Energystorage)、直流配电(Direct current)和柔性交互(Flexibility)四项技术的简称。“光”即太阳能光伏技术。太阳能光伏发电是未来主要的可再生电源之一,而体量巨大的建筑外表面是发展分布式光伏的空间资源;“储”即储能技术。在未来的电力系统中,储能是不可或缺的组成部分;“直”即直流技术。直流与交流相比具有形式简单、易于控制、传输效率高、能量损耗小等特点;“柔”即柔性用电技术。柔性是指用电负载能够根据能源供给情况调节自身功率的能力。Photovoltaic storage direct flexible (PEDF) is an abbreviation for the application of solar photovoltaic (Photovoltaic), energy storage (Energystorage), direct current distribution (Direct current) and flexible interaction (Flexibility) in the field of construction. "Light" is solar photovoltaic technology. Solar photovoltaic power generation is one of the main renewable power sources in the future, and the outer surface of the huge building is a space resource for the development of distributed photovoltaics; "storage" means energy storage technology. In the power system of the future, energy storage is an integral part; "straight" is DC technology. Compared with AC, DC has the characteristics of simple form, easy control, high transmission efficiency, and low energy loss; "soft" refers to flexible power consumption technology. Flexibility refers to the ability of an electrical load to adjust its own power according to the energy supply.
“光储直柔”作为实现建筑碳中和目标的一种新型、有效方法,尚不被大众所熟知,这不利于该方法的推广,进而影响建筑碳中和目标的实现。具体来说,当前的能源管理系统对于“光储直柔”的介绍都是基于抽象的文字描述,且用词都较为专业晦涩,难以让非专业民众理解“光储直柔”系统的含义和优势,从而阻碍了普通民众对于“光储直柔”的认可与接纳。As a new and effective method to achieve the goal of carbon neutrality in buildings, "light storage, direct flexibility" is not well known to the public, which is not conducive to the promotion of this method, which in turn affects the realization of the goal of carbon neutrality in buildings. Specifically, the current energy management system's introduction of "optical storage, direct and flexible" is based on abstract text descriptions, and the terms are relatively professional and obscure, making it difficult for non-professionals to understand the meaning and Advantages, thus hindering the general public's recognition and acceptance of "light storage, straight and soft".
此外,现有能源管理系统的界面大都为二维画面,且多为静态,呈现形式较为单一抽象,不仅非专业人员难以看懂系统运行状况,即使对于专业运维人员也不够直观形象。In addition, the interfaces of the existing energy management systems are mostly two-dimensional screens, and most of them are static, and the presentation form is relatively simple and abstract. Not only is it difficult for non-professionals to understand the operating status of the system, even for professional operation and maintenance personnel, it is not intuitive enough.
发明内容SUMMARY OF THE INVENTION
本发明的主要目的是提出一种能源管理可视化展示系统及方法,旨在解决现有的能源管理系统界面的表达单一抽象,并且不够直观形象的技术问题。The main purpose of the present invention is to propose an energy management visualization display system and method, which aims to solve the technical problem that the interface of the existing energy management system is single abstract and not intuitive enough.
为实现上述目的,本发明提出一种能源管理可视化展示系统,包括:In order to achieve the above purpose, the present invention proposes an energy management visualization display system, including:
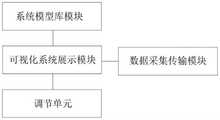
系统模型库模块,所述系统模型库模块包括三维的供电设备模型、用电设备模型;a system model library module, the system model library module includes a three-dimensional power supply equipment model and an electrical equipment model;
数据采集传输模块,所述数据采集传输模块用于采集供电设备以及用电设备的用电数据;a data acquisition and transmission module, the data acquisition and transmission module is used to collect the power consumption data of the power supply equipment and the power consumption equipment;
调节单元,用于输出柔性控制指令给电网配电柜和负载,电网配电柜和负载执行相应的操作;The adjustment unit is used to output flexible control commands to the power grid distribution cabinet and the load, and the power grid power distribution cabinet and the load perform corresponding operations;
可视化系统展示模块,所述可视化系统展示模块用于展示所述系统模型库模块,并且根据所述数据采集传输模块采集的用电数据使所述系统模型库模块以预设的方式进行变换。A visualization system display module, which is used to display the system model library module, and transforms the system model library module in a preset manner according to the electricity consumption data collected by the data acquisition and transmission module.
作为本发明的进一步改进:所述预设的方式包括缩放、旋转。As a further improvement of the present invention: the preset manner includes scaling and rotation.
作为本发明的进一步改进:所述系统模型库模块还包括连接所述供电设备模型与所述用电设备模型的能量流线模型。As a further improvement of the present invention: the system model library module further includes an energy streamline model connecting the power supply equipment model and the power consumption equipment model.
作为本发明的进一步改进:所述数据采集传输模块包括数据采集模块、数据处理模块和数据传输模块,所述数据采集模块用于采集供电设备以及用电设备的用电数据,所述数据处理模块用于将用电数据转化成显示数据,所述数据传输模块用于将显示数据发送至所述可视化系统展示模块。As a further improvement of the present invention: the data acquisition and transmission module includes a data acquisition module, a data processing module and a data transmission module, the data acquisition module is used to collect the power consumption data of the power supply equipment and the power consumption equipment, and the data processing module It is used for converting the electricity consumption data into display data, and the data transmission module is used for sending the display data to the visualization system display module.
作为本发明的进一步改进:所述可视化系统展示模块包括指标展示区、系统功率展示区、系统三维模型展示区,所述指标展示区用于展示系统碳中和贡献指标,所述系统功率展示区用于展示系统功率,所述系统三维模型展示区用于通过所述系统模型库模块以展示系统用电运行状态。As a further improvement of the present invention: the visualization system display module includes an indicator display area, a system power display area, and a system three-dimensional model display area. The indicator display area is used to display the carbon neutrality contribution index of the system, and the system power display area It is used for displaying system power, and the system three-dimensional model display area is used to display the power consumption operation state of the system through the system model library module.
作为本发明的进一步改进:所述系统功率展示区包括系统功率曲线图,所述系统功率曲线图用于展示系统进入柔性用电模式前与进入柔性用电模式后的用电对比状态。As a further improvement of the present invention: the system power display area includes a system power curve graph, and the system power curve graph is used to display the power consumption comparison state of the system before entering the flexible power consumption mode and after entering the flexible power consumption mode.
作为本发明的进一步改进:所述可视化系统展示模块基于网页浏览器进行展示。As a further improvement of the present invention: the visualization system display module is displayed based on a web browser.
本发明还提出一种能源管理可视化展示方法,包括如下步骤:The present invention also proposes a visual display method for energy management, comprising the following steps:
建立三维的供电设备模型、用电设备模型以及连接所述供电设备模型与所述用电设备模型的能量流线模型;establishing a three-dimensional power supply equipment model, an electrical equipment model, and an energy streamline model connecting the power supply equipment model and the electrical equipment model;
获取数据采集传输模块采集的供电设备以及用电设备的用电数据;Obtain the power consumption data of the power supply equipment and the power consumption equipment collected by the data acquisition and transmission module;
根据所述用电数据以判断是否开启柔性用电模式;according to the power consumption data to determine whether to enable the flexible power consumption mode;
若开启柔性用电模式,将所述供电设备模型、用电设备模型以及能量流线模型以预设的方式进行变换。If the flexible power consumption mode is enabled, the power supply equipment model, the power consumption equipment model and the energy streamline model are transformed in a preset manner.
作为本发明的进一步改进:所述预设的方式包括缩放、旋转。As a further improvement of the present invention: the preset manner includes scaling and rotation.
作为本发明的进一步改进:所述若开启电网柔性调节,所述若开启柔性用电模式,将所述供电设备模型、用电设备模型以及能量流线模型以预设的方式进行变换的步骤之后,还包括:As a further improvement of the present invention: if the flexible adjustment of the power grid is enabled, if the flexible power consumption mode is enabled, after the step of transforming the power supply equipment model, the power consumption equipment model and the energy streamline model in a preset manner ,Also includes:
根据系统用电功率生成系统功率曲线图。The system power curve graph is generated according to the power consumption of the system.
本技术方案提供一种能源管理可视化展示系统,通过三维的模型的方式展示供电设备以及用电设备,使用户更直观清楚地了解系统用电运行构造,并且在系统进入柔性用电模式后,供电设备模型、用电设备模型以预设的方式进行变换,通过对比的方法使用户了解系统在开启柔性用电模式前与开启柔性用电模式后的区别,系统运行状况展示更直观形象,用户使用体验更佳。The technical solution provides a visual display system for energy management, which displays power supply equipment and power consumption equipment through a three-dimensional model, so that users can more intuitively and clearly understand the power consumption operation structure of the system, and after the system enters the flexible power consumption mode, power supply The equipment model and the power-consuming equipment model are transformed in a preset way. Through the comparison method, users can understand the difference between the system before and after the flexible power consumption mode is turned on. Better experience.
附图说明Description of drawings
为了更清楚地说明本发明实施例或现有技术中的技术方案,下面将对实施例或现有技术描述中所需要使用的附图作简单地介绍,显而易见地,下面描述中的附图仅仅是本发明的一些实施例,对于本领域普通技术人员来讲,在不付出创造性劳动的前提下,还可以根据这些附图示出的结构获得其他的附图。In order to explain the embodiments of the present invention or the technical solutions in the prior art more clearly, the following briefly introduces the accompanying drawings that need to be used in the description of the embodiments or the prior art. Obviously, the accompanying drawings in the following description are only These are some embodiments of the present invention, and for those of ordinary skill in the art, other drawings can also be obtained according to the structures shown in these drawings without creative efforts.
图1为本申请能源管理可视化展示系统一实施例的结构示意图;FIG. 1 is a schematic structural diagram of an embodiment of an energy management visualization display system of the present application;
图2为本申请能源管理可视化展示方法一实施例的流程示意图;FIG. 2 is a schematic flowchart of an embodiment of an energy management visualization display method of the present application;
本发明目的的实现、功能特点及优点将结合实施例,参照附图做进一步说明。The realization, functional characteristics and advantages of the present invention will be further described with reference to the accompanying drawings in conjunction with the embodiments.
具体实施方式Detailed ways
下面将结合本发明实施例中的附图,对本发明实施例中的技术方案进行清楚、完整地描述,显然,所描述的实施例仅仅是本发明的一部分实施例,而不是全部的实施例。基于本发明中的实施例,本领域普通技术人员在没有作出创造性劳动前提下所获得的所有其他实施例,都属于本发明保护的范围。The technical solutions in the embodiments of the present invention will be clearly and completely described below with reference to the accompanying drawings in the embodiments of the present invention. Obviously, the described embodiments are only a part of the embodiments of the present invention, not all of the embodiments. Based on the embodiments of the present invention, all other embodiments obtained by those of ordinary skill in the art without creative efforts shall fall within the protection scope of the present invention.
需要说明,若本发明实施例中有涉及方向性指示(诸如上、下、左、右、前、后……),则该方向性指示仅用于解释在某一特定姿态下各部件之间的相对位置关系、运动情况等,如果该特定姿态发生改变时,则该方向性指示也相应地随之改变。It should be noted that if there are directional indications (such as up, down, left, right, front, back, etc.) involved in the embodiments of the present invention, the directional indications are only used to explain the relationship between various components in a specific posture If the specific posture changes, the directional indication also changes accordingly.
另外,若本发明实施例中有涉及“第一”、“第二”等的描述,则该“第一”、“第二”等的描述仅用于描述目的,而不能理解为指示或暗示其相对重要性或者隐含指明所指示的技术特征的数量。由此,限定有“第一”、“第二”的特征可以明示或者隐含地包括至少一个该特征。另外,若全文中出现的“和/或”或者“及/或”,其含义包括三个并列的方案,以“A和/或B”为例,包括A方案、或B方案、或A和B同时满足的方案。另外,各个实施例之间的技术方案可以相互结合,但是必须是以本领域普通技术人员能够实现为基础,当技术方案的结合出现相互矛盾或无法实现时应当认为这种技术方案的结合不存在,也不在本发明要求的保护范围之内。In addition, if there are descriptions involving "first", "second", etc. in the embodiments of the present invention, the descriptions of "first", "second", etc. are only used for the purpose of description, and should not be construed as indicating or implying Its relative importance or implicitly indicates the number of technical features indicated. Thus, a feature delimited with "first", "second" may expressly or implicitly include at least one of that feature. In addition, if "and/or" or "and/or" appears in the whole text, its meaning includes three parallel schemes, taking "A and/or B" as an example, including scheme A, or scheme B, or scheme A and A scheme that satisfies both B. In addition, the technical solutions between the various embodiments can be combined with each other, but must be based on the realization by those of ordinary skill in the art. When the combination of technical solutions is contradictory or cannot be realized, it should be considered that the combination of such technical solutions does not exist. , is not within the scope of protection required by the present invention.
“光储直柔”作为实现建筑碳中和目标的一种新型、有效方法,尚不被大众所熟知,这不利于该方法的推广,进而影响建筑碳中和目标的实现。具体来说,当前的能源管理系统对于“光储直柔”的介绍都是基于抽象的文字描述,且用词都较为专业晦涩,难以让非专业民众理解“光储直柔”系统的含义和优势,从而阻碍了普通民众对于“光储直柔”的认可与接纳。As a new and effective method to achieve the goal of carbon neutrality in buildings, "light storage, direct flexibility" is not well known to the public, which is not conducive to the promotion of this method, which in turn affects the realization of the goal of carbon neutrality in buildings. Specifically, the current energy management system's introduction of "optical storage, direct and flexible" is based on abstract text descriptions, and the terms are relatively professional and obscure, making it difficult for non-professionals to understand the meaning and Advantages, thus hindering the general public's recognition and acceptance of "light storage, straight and soft".
此外,现有能源管理系统的界面大都为二维画面,且多为静态,呈现形式较为单一抽象,不仅非专业人员难以看懂系统运行状况,即使对于专业运维人员也不够直观形象。In addition, the interfaces of the existing energy management systems are mostly two-dimensional screens, and most of them are static, and the presentation form is relatively simple and abstract. Not only is it difficult for non-professionals to understand the operating status of the system, even for professional operation and maintenance personnel, it is not intuitive enough.
本技术方案主要目的是提出一种能源管理可视化展示系统及方法,旨在解决现有的能源管理系统模块的表达单一抽象,并且不够直观形象的技术问题。The main purpose of this technical solution is to propose an energy management visualization display system and method, which aims to solve the technical problem that the existing energy management system modules have a single abstract expression and are not intuitive enough.
请参阅图1,本技术方案的能源管理可视化展示系统一实施例中,所述能源管理可视化展示系统包括:Referring to FIG. 1, in an embodiment of the energy management visualization display system of the present technical solution, the energy management visualization display system includes:
系统模型库模块,所述系统模型库模块包括三维的供电设备模型以及用电设备模型;a system model library module, the system model library module includes a three-dimensional power supply equipment model and an electrical equipment model;
在本实施例中,所述供电设备包括电网配电柜,光伏阵列,所述用电设备包括直流自律电器(例如洗衣机、空调、热水壶、灯)、双向柔性充电桩、电动汽车等电力电子器件,所述供电设备模型以及用电设备模型根据上述电力电子器件的外形而建立,从而便于用户更直观清晰地区分该电力电子器件以及该电力电子器件的用途。In this embodiment, the power supply equipment includes a grid power distribution cabinet and a photovoltaic array, and the electrical equipment includes DC self-regulating electrical appliances (such as washing machines, air conditioners, kettles, lamps), two-way flexible charging piles, electric vehicles and other power electronics The power supply equipment model and the power consumption equipment model are established according to the shape of the above-mentioned power electronic device, so as to facilitate the user to more intuitively and clearly distinguish the power electronic device and the purpose of the power electronic device.
数据采集传输模块,所述数据采集传输模块用于采集供电设备以及用电设备的用电数据;a data acquisition and transmission module, the data acquisition and transmission module is used to collect the power consumption data of the power supply equipment and the power consumption equipment;
所述数据采集传输模块与各供电设备以及用电设备连接,通过检测供电设备以及用电设备的电流信息,继而转换成可用于系统识别的显示数据,显示数据传输至可视化系统展示模块。The data acquisition and transmission module is connected with each power supply equipment and electrical equipment, and converts the current information of the power supply equipment and electrical equipment into display data that can be used for system identification by detecting the current information of the power supply equipment and the electrical equipment, and the display data is transmitted to the visualization system display module.
调节单元,用于输出柔性控制指令给电网配电柜和负载,电网配电柜和负载执行相应的操作;The adjustment unit is used to output flexible control commands to the power grid distribution cabinet and the load, and the power grid power distribution cabinet and the load perform corresponding operations;
所述调节单元属于具备启停以及调节系统柔性度大小的开关,其输出的柔性控制指令给电网配电柜,电网配电柜使系统进入柔性用电模式,电网配电柜调整为直流输出,通过配合光伏发电,从而实现系统柔性用电。The adjusting unit belongs to a switch capable of starting and stopping and adjusting the degree of flexibility of the system, and the output flexible control command is sent to the power grid power distribution cabinet, the power grid power distribution cabinet makes the system enter the flexible power consumption mode, and the power grid power distribution cabinet is adjusted to DC output, By cooperating with photovoltaic power generation, the system can realize flexible electricity consumption.
可视化系统展示模块,所述可视化系统展示模块用于展示所述系统模型库模块,并且根据所述数据采集传输模块采集的用电数据使所述系统模型库模块以预设的方式进行变换;a visualization system display module, which is used for displaying the system model library module, and transforms the system model library module in a preset manner according to the power consumption data collected by the data acquisition and transmission module;
所述可视化系统展示模块设有一显示界面,所述可视化系统展示模块与采集传输模块连接,通过获取供电设备以及用电设备的用电数据,使系统模型库模块的三维模型在可视化系统展示模块的显示界面上做相应的变换。The visualization system display module is provided with a display interface, the visualization system display module is connected with the acquisition and transmission module, and the three-dimensional model of the system model library module is displayed in the visualization system display module by acquiring the power consumption data of the power supply equipment and the power consumption equipment. Make corresponding transformations on the display interface.
值得注意的是,为了获得更佳的直观体验,便于用户快速了解,所有供电设备模型以及用电设备模型均以三维立体方式进行展示。在本实施例中,所有三维的模型均使用Cinema 4D软件对设备建模而得。It is worth noting that, in order to obtain a better intuitive experience and facilitate users' quick understanding, all power supply equipment models and power consumption equipment models are displayed in three-dimensional form. In this embodiment, all three-dimensional models are obtained by modeling the equipment using Cinema 4D software.
本发明的能源管理可视化展示系统,通过三维的模型的方式展示供电设备以及用电设备,使用户更直观清楚地了解系统用电运行构造,并且在系统进入柔性用电模式后,供电设备模型、用电设备模型以预设的方式进行变换,通过对比的方法使用户了解系统在开启柔性用电模式前与开启柔性用电模式后的区别,系统运行状况展示更直观形象,用户使用体验更佳。The energy management visualization display system of the present invention displays the power supply equipment and the power consumption equipment by means of a three-dimensional model, so that the user can understand the power consumption operation structure of the system more intuitively and clearly, and after the system enters the flexible power consumption mode, the power supply equipment model, The electric equipment model is transformed in a preset way, and the user can understand the difference between the system before and after the flexible power consumption mode is turned on through the method of comparison. The system operation status is displayed more intuitively, and the user experience is better. .
进一步地,所述系统模型库模块还包括连接所述供电设备模型与所述用电设备模型的能量流线模型。该能量流线模型具体为条状,能量流线模型的直径可根据系统的供电设备以及用电设备实时用电数据而变化,当用电数据即系统电流越大,表示系统用电功率越大,能量流线模型的直径越粗,并且能量流线模型的方向即表示各个供电设备以及用电设备的电流的流动方向。当系统处于刚性用电模式,即没有开启电网柔性调节,此时能量流线模型显示为红色,当系统处于柔性用电模式,即开启电网柔性调节,此时能量流为绿色。Further, the system model library module further includes an energy streamline model connecting the power supply equipment model and the power consumption equipment model. The energy streamline model is in the form of a strip, and the diameter of the energy streamline model can be changed according to the power supply equipment of the system and the real-time power consumption data of the power consumption equipment. The diameter of the energy streamline model is thicker, and the direction of the energy streamline model represents the flow direction of the current of each power supply device and the power consumer. When the system is in the rigid power consumption mode, that is, the power grid flexible adjustment is not turned on, the energy streamline model is displayed in red. When the system is in the flexible power consumption mode, the power grid flexible adjustment is turned on, and the energy flow is green at this time.
进一步地,所述预设的方式包括缩放、旋转。所述供电设备模型、用电设备模型以及能量流线模型在系统进入柔性用电模式后,可发生缩放、旋转的动作,从而在界面上产生明显的区别变化,从而以此提醒用户已开启柔性用电模式。同时,在进入柔性用电模式后,能量流线模型可变换颜色以及变粗变细,同样地通过明显的区别变化,以提醒用户已开启柔性用电模式。此外,供电设备模型以及用电设备模型可根据实时时间或系统当前用电状态而变换自身的显示状态,例如当处于夜晚时,光伏阵列模型上方出现月亮图标,此时光伏阵列模型为灰色,表示此时光伏没有发电;当处于白天时,光伏阵列模型上方出现太阳图标,此时光伏阵列模型为白色,表示此时光伏处于发电状态。Further, the preset manner includes scaling and rotation. The power supply equipment model, the power consumption equipment model and the energy streamline model can zoom and rotate after the system enters the flexible power consumption mode, so as to produce obvious differences and changes on the interface, thereby reminding the user that the flexible power consumption mode has been turned on. Power mode. At the same time, after entering the flexible power consumption mode, the energy streamline model can change color and become thicker and thinner, and also change through obvious differences to remind the user that the flexible power consumption mode has been turned on. In addition, the power supply equipment model and the power consumption equipment model can change their display states according to the real-time time or the current power consumption status of the system. For example, when it is night, the moon icon appears above the photovoltaic array model. At this time, the photovoltaic array model is gray, indicating that At this time, the photovoltaic does not generate electricity; when it is in the daytime, the sun icon appears above the photovoltaic array model, and the photovoltaic array model is white at this time, indicating that the photovoltaic is in the power generation state at this time.
进一步地,所述数据采集传输模块包括数据采集模块、数据处理模块和数据传输模块,所述数据采集模块用于采集供电设备以及用电设备的用电数据,所述数据处理模块用于将用电数据转化成显示数据,所述数据传输模块用于将显示数据发送至所述可视化系统展示模块。在本实施例中,所述数据采集模块采用电流传感器。所述电流传感器是一种检测设备的电流装置,其能将检测到的电流信号,按一定规律变换成为符合一定标准需要的检测信号或其他所需形式的信息输出,以满足信息的传输、处理、存储、显示、记录和控制等要求。所述数据处理模块用于将数据采集模块的检测信号转换成本系统可识别的显示数据,随后通过数据传输模块利用有线或无线通讯的方式,将显示数据发送至可视化系统展示模块,可视化系统展示模块根据该显示数据,使系统模型库模块的所有模型以预设的方式进行变换。Further, the data acquisition and transmission module includes a data acquisition module, a data processing module and a data transmission module, the data acquisition module is used to collect the power consumption data of the power supply equipment and the power consumption equipment, and the data processing module is used to The electrical data is converted into display data, and the data transmission module is configured to send the display data to the visualization system display module. In this embodiment, the data acquisition module adopts a current sensor. The current sensor is a current device of a detection device, which can transform the detected current signal into a detection signal that meets certain standards or other required forms of information output according to certain rules, so as to meet the transmission and processing of information. , storage, display, recording and control requirements. The data processing module is used to convert the detection signal of the data acquisition module into display data that can be recognized by the system, and then send the display data to the visualization system display module by means of wired or wireless communication through the data transmission module, and the visualization system display module According to the displayed data, all models of the system model library module are transformed in a preset manner.
进一步地,所述可视化系统展示模块包括指标展示区、系统功率展示区、系统三维模型展示区。所述指标展示区用于展示系统碳中和贡献指标,在本实施例中,所述指标展示区包括碳中和贡献指标形象化展示区域,该碳中和贡献指标形象化展示区域以点亮的绿叶数量多少来表征系统的二氧化碳减排量,以点亮的太阳数量多少来表征系统的太阳能利用率。所述指标展示区还包括碳中和贡献指标定量展示区域,该碳中和贡献指标定量展示区域展示系统当前时间段的二氧化碳减排量值和太阳能利用率值。所述系统三维模型展示区包含上述系统模型库模块的供电设备模型、用电设备模型、能量流线模型,其通过三维的模型以及三维模型变换的效果以展示系统用电运行状态。Further, the visualization system display module includes an indicator display area, a system power display area, and a system three-dimensional model display area. The indicator display area is used to display the carbon neutrality contribution indicators of the system. In this embodiment, the indicator display area includes a carbon neutrality contribution indicator visualization display area, and the carbon neutrality contribution indicator visualization display area is lit up. The number of green leaves is used to characterize the carbon dioxide emission reduction of the system, and the number of lit suns is used to characterize the solar energy utilization rate of the system. The indicator display area also includes a carbon neutrality contribution indicator quantitative display area, where the carbon neutrality contribution indicator quantitative display area displays the carbon dioxide emission reduction value and the solar energy utilization value of the current time period of the system. The system three-dimensional model display area includes the power supply equipment model, the power consumption equipment model, and the energy streamline model of the system model library module, which displays the power consumption operation state of the system through the three-dimensional model and the effect of the three-dimensional model transformation.
进一步地,所述系统功率展示区用于展示系统用电功率。所述系统功率展示区包括系统功率曲线图,该系统功率曲线图的系统功率曲线采用WebGL库Three.js开发,该系统功率曲线图包括暗红色背景区以及绿色背景区,用于展示电网柔性调节前与调节后的系统用电对比状态,通过该曲线来定量的展示系统功耗和系统削峰填谷效果。其中,暗红色背景区域表示的是没有采用光储直柔技术时的系统功率曲线,此时系统的功率是不可调的,为刚性系统,这个时候建筑的实际功率曲线为红色曲线,峰谷差很大,没有规律;绿色背景区域表示的是采用光储直柔技术后的系统功率曲线,此时建筑系统具备了柔性调节能力,其功率能够随着预期用电曲线走,同时可以充分消纳新能源发电,进而实现了碳中和。Further, the system power display area is used to display the electrical power of the system. The system power display area includes a system power curve graph. The system power curve of the system power curve graph is developed using the WebGL library Three.js. The system power curve graph includes a dark red background area and a green background area, which is used to display the flexible adjustment of the power grid. The power consumption of the system before and after adjustment is compared, and the power consumption of the system and the effect of system peak shaving and valley filling are quantitatively displayed through this curve. Among them, the dark red background area represents the power curve of the system when the optical storage, direct and flexible technology is not used. At this time, the power of the system is not adjustable, and it is a rigid system. At this time, the actual power curve of the building is a red curve, and the peak-to-valley difference It is very large and irregular; the green background area represents the power curve of the system after adopting the optical storage, direct and flexible technology. At this time, the building system has the ability to adjust flexibly, and its power can follow the expected power consumption curve and can be fully absorbed at the same time. New energy power generation, thereby achieving carbon neutrality.
进一步地,所述可视化系统展示模块基于网页浏览器进行展示。Further, the visualization system display module performs display based on a web browser.
基于上述实施例,请参阅图2,本实施例还提出一种能源管理可视化展示方法,包括如下步骤:Based on the foregoing embodiment, please refer to FIG. 2 , this embodiment also proposes a method for visualizing energy management, including the following steps:
S10:建立三维的供电设备模型、用电设备模型以及连接所述供电设备模型与所述用电设备模型的能量流线模型;S10: Establish a three-dimensional power supply equipment model, an electrical equipment model, and an energy streamline model connecting the power supply equipment model and the electrical equipment model;
S20:获取数据采集传输模块采集的供电设备以及用电设备的用电数据;S20: Obtain the power consumption data of the power supply equipment and the power consumption equipment collected by the data acquisition and transmission module;
S30:根据所述用电数据以判断是否开启柔性用电模式;S30: Determine whether to enable the flexible power consumption mode according to the power consumption data;
S40:若开启柔性用电模式,将所述供电设备模型、用电设备模型以及能量流线模型以预设的方式进行变换。S40: If the flexible power consumption mode is enabled, transform the power supply equipment model, the power consumption equipment model, and the energy streamline model in a preset manner.
本能源管理可视化展示方法,通过三维的模型的方式展示供电设备以及用电设备,使用户更直观清楚地了解系统用电运行构造,并且在系统进入柔性用电模式后,供电设备模型、用电设备模型以及能量流线模型以预设的方式进行变换,通过对比的方法使用户更直观形象地了解系统在开启柔性用电模式前后的区别,用户使用体验更佳。This energy management visualization display method displays power supply equipment and power consumption equipment through a three-dimensional model, so that users can understand the power consumption operation structure of the system more intuitively and clearly, and after the system enters the flexible power consumption mode, the power supply equipment model, power consumption The equipment model and the energy streamline model are transformed in a preset way. Through the comparison method, the user can more intuitively understand the difference between the system before and after the flexible power consumption mode is turned on, and the user experience is better.
进一步地,所述预设的方式包括缩放、旋转。所述供电设备模型、用电设备模型以及能量流线模型在系统进入柔性用电模式后,可发生缩放、旋转的动作,从而在界面上产生明显的区别变化,从而以此提醒用户已开启柔性用电模式。同时,在进入柔性用电模式后,能量流线模型可变换颜色以及变粗变细,同样地通过明显的区别变化,以提醒用户已开启柔性用电模式。Further, the preset manner includes scaling and rotation. The power supply equipment model, the power consumption equipment model and the energy streamline model can be zoomed and rotated after the system enters the flexible power consumption mode, so as to produce obvious differences and changes on the interface, thereby reminding the user that the flexible power consumption mode has been turned on. Power mode. At the same time, after entering the flexible power consumption mode, the energy streamline model can change color, become thicker and thinner, and also change through obvious differences to remind the user that the flexible power consumption mode has been turned on.
进一步地,所述若开启柔性用电模式,将所述供电设备模型、用电设备模型以及能量流线模型以预设的方式进行变换的步骤之后,还包括:Further, after the step of transforming the power supply equipment model, the power consumption equipment model and the energy streamline model in a preset manner if the flexible power consumption mode is enabled, the method further includes:
根据系统用电功率生成系统功率曲线图。The system power curve graph is generated according to the power consumption of the system.
在本实施例中,所述数据采集传输模块包括数据采集模块、数据处理模块和数据传输模块。在本实施例中,所述数据采集模块采用电流传感器。所述数据采集模块采集到供电设备以及用电设备的电流数据通过数据处理模块转换成系统功率数据,继而通过数据传输模块发送至可视化系统展示模块,可视化系统展示模块根据系统功率数据以生成系统功率曲线图,从而便于用户了解系统实时用电功率。In this embodiment, the data acquisition and transmission module includes a data acquisition module, a data processing module and a data transmission module. In this embodiment, the data acquisition module adopts a current sensor. The current data collected by the data acquisition module of the power supply equipment and the electrical equipment is converted into system power data through the data processing module, and then sent to the visualization system display module through the data transmission module, and the visualization system display module generates the system power according to the system power data. Curve graph, so that users can understand the real-time power consumption of the system.
以上所述仅为本发明的可选实施例,并非因此限制本发明的专利范围,凡是在本发明的发明构思下,利用本发明说明书及附图内容所作的等效结构变换,或直接/间接运用在其他相关的技术领域均包括在本发明的专利保护范围内。The above descriptions are only optional embodiments of the present invention, and are not intended to limit the scope of the present invention. Under the inventive concept of the present invention, any equivalent structural transformations made by using the contents of the description and drawings of the present invention, or direct/indirect Applications in other related technical fields are included in the scope of patent protection of the present invention.
Claims (10)
Priority Applications (1)
| Application Number | Priority Date | Filing Date | Title |
|---|---|---|---|
| CN202111678680.9ACN114330007A (en) | 2021-12-31 | 2021-12-31 | A system and method for visualizing energy management |
Applications Claiming Priority (1)
| Application Number | Priority Date | Filing Date | Title |
|---|---|---|---|
| CN202111678680.9ACN114330007A (en) | 2021-12-31 | 2021-12-31 | A system and method for visualizing energy management |
Publications (1)
| Publication Number | Publication Date |
|---|---|
| CN114330007Atrue CN114330007A (en) | 2022-04-12 |
Family
ID=81022062
Family Applications (1)
| Application Number | Title | Priority Date | Filing Date |
|---|---|---|---|
| CN202111678680.9APendingCN114330007A (en) | 2021-12-31 | 2021-12-31 | A system and method for visualizing energy management |
Country Status (1)
| Country | Link |
|---|---|
| CN (1) | CN114330007A (en) |
Citations (5)
| Publication number | Priority date | Publication date | Assignee | Title |
|---|---|---|---|---|
| CN102723781A (en)* | 2012-06-12 | 2012-10-10 | 上海市电力公司 | Energy management system for urban power network |
| CN102969791A (en)* | 2012-11-23 | 2013-03-13 | 国电南瑞科技股份有限公司 | Flexible load management system and method of power system based on bidirectional intelligent electric meter |
| CN106300652A (en)* | 2015-05-23 | 2017-01-04 | 上海嘉柒网络科技有限公司 | A kind of user side energy-saving electric management system |
| CN112117767A (en)* | 2020-09-02 | 2020-12-22 | 中国科学院电工研究所 | Power supply and distribution system based on multi-station integration |
| CN112134355A (en)* | 2020-09-03 | 2020-12-25 | 珠海许继芝电网自动化有限公司 | Intelligent power distribution room visual display method and system |
- 2021
- 2021-12-31CNCN202111678680.9Apatent/CN114330007A/enactivePending
Patent Citations (5)
| Publication number | Priority date | Publication date | Assignee | Title |
|---|---|---|---|---|
| CN102723781A (en)* | 2012-06-12 | 2012-10-10 | 上海市电力公司 | Energy management system for urban power network |
| CN102969791A (en)* | 2012-11-23 | 2013-03-13 | 国电南瑞科技股份有限公司 | Flexible load management system and method of power system based on bidirectional intelligent electric meter |
| CN106300652A (en)* | 2015-05-23 | 2017-01-04 | 上海嘉柒网络科技有限公司 | A kind of user side energy-saving electric management system |
| CN112117767A (en)* | 2020-09-02 | 2020-12-22 | 中国科学院电工研究所 | Power supply and distribution system based on multi-station integration |
| CN112134355A (en)* | 2020-09-03 | 2020-12-25 | 珠海许继芝电网自动化有限公司 | Intelligent power distribution room visual display method and system |
Similar Documents
| Publication | Publication Date | Title |
|---|---|---|
| US20130207466A1 (en) | Home energy management apparatus and method for interworking with new renewable energy | |
| EP2670022B1 (en) | Power monitoring system and method of displaying power system information | |
| CN203365585U (en) | Photovoltaic panel dust detector | |
| CN102130403B (en) | Bidirectional metering socket and system | |
| CN103257289A (en) | Single CPU power quality detecting and two-way power metering combination system | |
| CN106786789A (en) | Microgrid generated energy real-time control system and method | |
| CN114330007A (en) | A system and method for visualizing energy management | |
| JP2014032574A (en) | Energy management device, communication terminal, energy management system, and energy management method | |
| CN207473381U (en) | A kind of universal energy station control system | |
| CN205283152U (en) | Solar photovoltaic power generation intelligent control system | |
| CN204575780U (en) | A kind of photovoltaic generation electrical quantity acquisition and analysis device | |
| CN116245296A (en) | A collaborative scheduling method for an integrated energy system | |
| CN107681767A (en) | Power generation system and power supply method | |
| CN209280775U (en) | A kind of indoor electric detection device | |
| CN209281471U (en) | Building energy consumption monitoring and forecasting systems | |
| CN220173272U (en) | Monitoring and management system for energy storage converter | |
| JP6243464B2 (en) | Management device, management system, and management method | |
| CN218669660U (en) | A monitoring system for wind turbines in the power spot scene | |
| TWI690852B (en) | Operating method of energy-aware system | |
| KR200481193Y1 (en) | Apparatus for Displaying State of Electricity Generation and Status Board of Solar Light Power Generation | |
| CN111176184A (en) | Energy consumption monitoring and management system and method for energy-just room and computer equipment | |
| CN120074029B (en) | Energy storage system status display method, device, equipment and program product | |
| CN219061902U (en) | A monitoring system for wind turbines in the power spot scene | |
| CN211701616U (en) | Wind power photovoltaic power distribution network intelligent monitoring system | |
| CN102622268A (en) | Power generation dispatching multi-Agent visualization system and method |
Legal Events
| Date | Code | Title | Description |
|---|---|---|---|
| PB01 | Publication | ||
| PB01 | Publication | ||
| SE01 | Entry into force of request for substantive examination | ||
| SE01 | Entry into force of request for substantive examination |