CN113610268A - Carbon emission prediction method based on residential area space form - Google Patents
Carbon emission prediction method based on residential area space formDownload PDFInfo
- Publication number
- CN113610268A CN113610268ACN202110718836.5ACN202110718836ACN113610268ACN 113610268 ACN113610268 ACN 113610268ACN 202110718836 ACN202110718836 ACN 202110718836ACN 113610268 ACN113610268 ACN 113610268A
- Authority
- CN
- China
- Prior art keywords
- model
- residential area
- prediction model
- residential
- spatial
- Prior art date
- Legal status (The legal status is an assumption and is not a legal conclusion. Google has not performed a legal analysis and makes no representation as to the accuracy of the status listed.)
- Pending
Links
Images

Classifications
- G—PHYSICS
- G06—COMPUTING OR CALCULATING; COUNTING
- G06Q—INFORMATION AND COMMUNICATION TECHNOLOGY [ICT] SPECIALLY ADAPTED FOR ADMINISTRATIVE, COMMERCIAL, FINANCIAL, MANAGERIAL OR SUPERVISORY PURPOSES; SYSTEMS OR METHODS SPECIALLY ADAPTED FOR ADMINISTRATIVE, COMMERCIAL, FINANCIAL, MANAGERIAL OR SUPERVISORY PURPOSES, NOT OTHERWISE PROVIDED FOR
- G06Q10/00—Administration; Management
- G06Q10/04—Forecasting or optimisation specially adapted for administrative or management purposes, e.g. linear programming or "cutting stock problem"
- G—PHYSICS
- G06—COMPUTING OR CALCULATING; COUNTING
- G06Q—INFORMATION AND COMMUNICATION TECHNOLOGY [ICT] SPECIALLY ADAPTED FOR ADMINISTRATIVE, COMMERCIAL, FINANCIAL, MANAGERIAL OR SUPERVISORY PURPOSES; SYSTEMS OR METHODS SPECIALLY ADAPTED FOR ADMINISTRATIVE, COMMERCIAL, FINANCIAL, MANAGERIAL OR SUPERVISORY PURPOSES, NOT OTHERWISE PROVIDED FOR
- G06Q50/00—Information and communication technology [ICT] specially adapted for implementation of business processes of specific business sectors, e.g. utilities or tourism
- G06Q50/10—Services
- G06Q50/26—Government or public services
- Y—GENERAL TAGGING OF NEW TECHNOLOGICAL DEVELOPMENTS; GENERAL TAGGING OF CROSS-SECTIONAL TECHNOLOGIES SPANNING OVER SEVERAL SECTIONS OF THE IPC; TECHNICAL SUBJECTS COVERED BY FORMER USPC CROSS-REFERENCE ART COLLECTIONS [XRACs] AND DIGESTS
- Y02—TECHNOLOGIES OR APPLICATIONS FOR MITIGATION OR ADAPTATION AGAINST CLIMATE CHANGE
- Y02A—TECHNOLOGIES FOR ADAPTATION TO CLIMATE CHANGE
- Y02A90/00—Technologies having an indirect contribution to adaptation to climate change
- Y02A90/10—Information and communication technologies [ICT] supporting adaptation to climate change, e.g. for weather forecasting or climate simulation
Landscapes
- Business, Economics & Management (AREA)
- Engineering & Computer Science (AREA)
- Strategic Management (AREA)
- Economics (AREA)
- Tourism & Hospitality (AREA)
- Human Resources & Organizations (AREA)
- Theoretical Computer Science (AREA)
- Physics & Mathematics (AREA)
- Marketing (AREA)
- Development Economics (AREA)
- General Physics & Mathematics (AREA)
- General Business, Economics & Management (AREA)
- Quality & Reliability (AREA)
- Game Theory and Decision Science (AREA)
- Entrepreneurship & Innovation (AREA)
- Operations Research (AREA)
- Educational Administration (AREA)
- Health & Medical Sciences (AREA)
- General Health & Medical Sciences (AREA)
- Primary Health Care (AREA)
- Management, Administration, Business Operations System, And Electronic Commerce (AREA)
Abstract
Translated fromChinese
Description
Translated fromChinese技术领域technical field
本发明涉及二氧化碳预测技术领域,具体涉及一种基于居住区空间形态的碳排放量预测方法。The invention relates to the technical field of carbon dioxide prediction, in particular to a carbon emission prediction method based on the spatial form of a residential area.
背景技术Background technique
碳排放引发的全球变暖问题已成为世界关注的焦点,我国是碳排放大国,城市是碳排放的主体,我国约有85%碳排放来源于城市,根据相关统计数据,中国居住能耗占城市建筑部门能耗的16%-25%。住区作为居住的基本单元,其整体碳排放水平与居住区空间形态密切相关。The issue of global warming caused by carbon emissions has become the focus of the world. my country is a big carbon emitter, and cities are the main source of carbon emissions. About 85% of my country's carbon emissions come from cities. 16%-25% of energy consumption in the building sector. As the basic unit of residence, the overall carbon emission level of the residential area is closely related to the spatial form of the residential area.
目前居住区碳排放计算依赖于单体建筑能耗模拟,受到住区空置率和居住特点差异,模拟结果与实际碳排放千差万别,基于能耗软件的统一模拟往往很难准确核算不同住区的燃气碳排放。同时能耗模拟结果很难应用与城市规划管理,不适应未来城市可持续发展需求。At present, the calculation of carbon emissions in residential areas relies on the energy consumption simulation of individual buildings. Due to the differences in the vacancy rate and residential characteristics of residential areas, the simulation results and actual carbon emissions are very different. It is often difficult to accurately calculate the gas consumption of different residential areas in a unified simulation based on energy consumption software. carbon emission. At the same time, the energy consumption simulation results are difficult to apply to urban planning and management, and do not meet the needs of sustainable urban development in the future.
因此如何从规划领域入手实现居住区碳排放的准确预测,成为亟待解决的问题。Therefore, how to realize the accurate prediction of carbon emissions in residential areas from the planning field has become an urgent problem to be solved.
发明内容SUMMARY OF THE INVENTION
有鉴于此,本发明实施例提供了一种基于居住区空间形态的碳排放量预测方法,以解决现有技术中基于能耗软件的统一模拟对不同住区的燃气碳排放核算准确度不够高,无法对接城市规划和城市管理的问题。In view of this, the embodiment of the present invention provides a carbon emission prediction method based on the spatial form of a residential area, so as to solve the problem that the unified simulation based on energy consumption software in the prior art is not accurate enough for gas carbon emission accounting in different residential areas. , unable to connect the issues of urban planning and urban management.
本发明实施例提供了一种基于居住区空间形态的碳排放量预测方法,包括:An embodiment of the present invention provides a method for predicting carbon emissions based on the spatial form of a residential area, including:
获取样本数据;样本数据包括居住区空间形态特征参数与居住区单位用地面积碳排放值;根据空间形态特征参数建立初步预测模型;Obtain sample data; the sample data includes the spatial morphological characteristic parameters of the residential area and the carbon emission value per unit land area of the residential area; establish a preliminary prediction model according to the spatial morphological characteristic parameters;
根据模型结果对模型进行参数优化;Optimize the parameters of the model according to the model results;
输出最终预测模型,获得预测结果。Output the final prediction model to obtain the prediction result.
可选地,居住区空间形态参数包括:容积率、建筑密度、平均层数、地块长宽比。Optionally, the spatial form parameters of the residential area include: plot ratio, building density, average number of floors, and plot aspect ratio.
可选地,所述的基于居住区空间形态的碳排放量预测方法,其特征在于,根据空间形态特征参数建立初步预测模型包括:Optionally, the method for predicting carbon emissions based on the spatial form of a residential area is characterized in that establishing a preliminary prediction model according to the characteristic parameters of the spatial form includes:
用极端梯度提升算法建立所述预测模型;Building the predictive model with an extreme gradient boosting algorithm;
通过所述预测模型特征训练所述初步预测模型;Train the preliminary prediction model by using the prediction model feature;
可选地,根据初步预测模型训练结果对模型进行参数优化包括:Optionally, performing parameter optimization on the model according to the training result of the preliminary prediction model includes:
对数据集按照3:1的比例随机划分10个训练集和测试集;The data set is randomly divided into 10 training sets and test sets according to the ratio of 3:1;
在划分的10个训练集和测试集进行模型重复训练;The model is repeatedly trained in the divided 10 training sets and test sets;
通过tuned_data函数对10个模型进行参数优化以获得最佳结果;Parameter optimization of 10 models through the tuned_data function to obtain the best results;
可选地,通过tuned_data函数对10个模型进行参数优化以获得最佳结果包括:Optionally, parameter optimization of the 10 models via the tuned_data function for best results includes:
评判模型结果的指标包括决定系数和均方误差,将决定系数用R2表示,均方误差用MSE表示,计算每个所述模型的决定系数和均方误差:The indicators for judging the model results include the coefficient of determination and the mean square error. The coefficient of determination is represented by R2 and the mean square error is represented by MSE, and the coefficient of determination and the mean square error of each of the models are calculated:


其中,

如果结果是0,说明模型拟合效果很差;If the result is 0, the model fitting effect is poor;
如果结果是1,说明模型无错误。If the result is 1, the model is error free.
根据MSE的取值判定模型预测能力的好坏。According to the value of MSE, the prediction ability of the model is judged.
可选地,根据所述输出最终预测模型,获得预测结果包括:Optionally, obtaining a prediction result according to the output final prediction model includes:
用优化极端梯度提升算法所得模型参数建立所述最终预测模型;establishing the final prediction model with model parameters obtained by optimizing the extreme gradient boosting algorithm;
通过所述预测模型特征训练所述最终预测模型;Train the final prediction model by using the prediction model features;
将待测居住区空间形态参数代入所述预测模型,获得所述待测居住区的预测单位用地面积碳排放量;Substitute the spatial shape parameters of the residential area to be measured into the prediction model, and obtain the predicted carbon emissions per unit land area of the residential area to be measured;
可选地,根据权利要求1所述的基于居住区空间形态的碳排放量预测方法,其特征在于,所述居住区单位用地面积碳排放值的计算如下:Optionally, the method for predicting carbon emissions based on the spatial form of a residential area according to claim 1, wherein the calculation of the carbon emission value per unit land area of the residential area is as follows:

其中,E为居住区单位用地面积碳排放量,Pi为统计一年居住区i种能源消耗量,Di为i种能源的二氧化然排放因子,S为居住区的用地面积。Among them, E is the carbon emission per unit land area of the residential area, Pi is the consumption ofi energy in the residential area for one year, Di is the CO2 emission factor of thei energy, and S is the land area of the residential area.
可选地,在根据空间形态特征参数建立初步预测模型之前,还包括:采用数据空值填充规则对所述样本数据进行预处理;Optionally, before establishing the preliminary prediction model according to the spatial morphological feature parameters, the method further includes: preprocessing the sample data by using a data null value filling rule;
对所述样本数据的各个特征进行归一化处理。Normalize each feature of the sample data.
可选地,对所述样本数据的各个特征进行归一化处理包括:Optionally, normalizing each feature of the sample data includes:

其中,X为所述样本数据的特征值,Xmin为所述特征值的最小值,Xmax为所述特征值的最大值,Xstd为所述特征值的归一化结果。Wherein, X is the eigenvalue of the sample data,Xmin is the minimum value of the eigenvalue,Xmax is the maximum value of the eigenvalue, and Xstdis the normalization result of the eigenvalue.
可选地,通过所述预测模型特征训练所述最终预测模型:Optionally, the final prediction model is trained by the prediction model features:
获取每个所述最终预测模型的预测结果:Get the predictions for each of the final prediction models:

其中,
选取最优预测模型:Choose the optimal prediction model:

其中,yt表示经过训练的第t棵树的优化预测结果,t∈[1,n],N为样本数据总数,Ω(fi)表示正则项优化函数,
本发明实施例提供的一种基于居住区空间特征的碳排放预测方法,根据居住区空间形态指标建立了居住单位用地面积碳排放预测模型,通过预测模型可以为规划中的居住小区、居住用地提供减碳建议,相较于传统线性回归预测模型、本模型具有更高的精度。本预测模型将规划居住小区空间形态指标输入预测模型,得出规划小区居住区的单位用地面积碳排放量,在未来城市规划中,通过模型预测可以比选确定最低碳的居住区规划形式,实现了居住区规划时控制碳排放量的目标。The embodiment of the present invention provides a carbon emission prediction method based on the spatial characteristics of a residential area. A carbon emission prediction model for the land area of a residential unit is established according to the spatial form index of the residential area. Compared with the traditional linear regression prediction model, this model has higher accuracy. In this prediction model, the spatial form index of the planned residential area is input into the prediction model, and the carbon emission per unit land area of the planned residential area is obtained. The goal of controlling carbon emissions in residential area planning is achieved.
附图说明Description of drawings
通过参考附图会更加清楚的理解本发明的特征和优点,附图是示意性的而不应理解为对本发明进行任何限制,在附图中:The features and advantages of the present invention will be more clearly understood by reference to the accompanying drawings, which are schematic and should not be construed as limiting the invention in any way, in which:
图1示出了本发明实施例一种基于居住区空间特征的碳排放预测方法的流程图;Fig. 1 shows a flowchart of a carbon emission prediction method based on the spatial characteristics of a residential area according to an embodiment of the present invention;
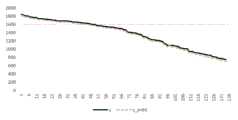
图2示出了本发明实施例中一种预测结果与实际结果的拟合曲线对比图。FIG. 2 shows a comparison diagram of a fitting curve between a predicted result and an actual result in an embodiment of the present invention.
具体实施方式Detailed ways
为使本发明实施例的目的、技术方案和优点更加清楚,下面将结合本发明实施例中的附图,对本发明实施例中的技术方案进行清楚、完整地描述,显然,所描述的实施例是本发明一部分实施例,而不是全部的实施例。基于本发明中的实施例,本领域技术人员在没有作出创造性劳动前提下所获得的所有其他实施例,都属于本发明保护的范围。In order to make the purposes, technical solutions and advantages of the embodiments of the present invention clearer, the technical solutions in the embodiments of the present invention will be clearly and completely described below with reference to the accompanying drawings in the embodiments of the present invention. Obviously, the described embodiments These are some embodiments of the present invention, but not all embodiments. Based on the embodiments of the present invention, all other embodiments obtained by those skilled in the art without creative efforts shall fall within the protection scope of the present invention.
本发明实施例提供了一种基于居住区空间特征的碳排放预测方法,如图 1所示,包括:The embodiment of the present invention provides a carbon emission prediction method based on the spatial characteristics of a residential area, as shown in FIG. 1 , including:
步骤S10,获取样本数据。样本数据包括居住区空间形态特征参数与居住区单位用地面积碳排放值。Step S10, acquiring sample data. The sample data includes the spatial morphological characteristic parameters of the residential area and the carbon emission value per unit land area of the residential area.
在本实施例中,居住区空间形态特征参数包括容积率、建筑密度、平均层数、地块长宽比;其中,地块长宽比指居住区地块南北向长度与东西向长度的比值。例如同一地区中高层小区和多层小区在容积率、建筑排布上有很大的差异,因此造成了能耗的差异。通过居住区空间规划参数可以将不同类型小区分类,使居住区的空间特征碳排放量互相关联,针对同一地区不同开发类型的小区,均能够取得较为精确的预测结果。In this embodiment, the spatial morphological characteristic parameters of the residential area include plot ratio, building density, average number of floors, and the aspect ratio of the plot; wherein, the plot aspect ratio refers to the ratio of the north-south length to the east-west length of the plot in the residential area . For example, there are great differences in floor area ratio and building layout between medium and high-rise residential areas and multi-storey residential areas in the same area, thus resulting in differences in energy consumption. Different types of residential areas can be classified through the spatial planning parameters of residential areas, so that the spatial characteristic carbon emissions of residential areas can be correlated with each other, and more accurate prediction results can be obtained for residential areas of different development types in the same area.
在具体实施例中,居住区指根据控制性详细规划划分的用地性质为居住用地的单独地块,获取居住区内所有居住建筑的用水、用电和燃气排放数据、居住区容积率、建筑密度、平均层数以及地块的长宽比。In a specific embodiment, the residential area refers to a separate plot of land that is divided into residential land according to the detailed control plan, and the water, electricity and gas emission data of all residential buildings in the residential area, the plot ratio of the residential area, and the building density are obtained. , the average number of floors, and the aspect ratio of the plot.
居住区单位用地面积碳排放值的计算如下:The calculation of the carbon emission value per unit land area in the residential area is as follows:

其中,E为居住区单位用地面积碳排放量,Pi为统计一年居住区i种能源消耗量,Di为i种能源的二氧化然排放因子,S为居住区的用地面积。Among them, E is the carbon emission per unit land area of the residential area, Pi is the consumption ofi energy in the residential area for one year, Di is the CO2 emission factor of thei energy, and S is the land area of the residential area.
步骤S20,根据空间形态特征参数样本数据建立初步预测模型。Step S20, establishing a preliminary prediction model according to the sample data of the spatial morphological characteristic parameters.
在本实施例中,通过XGBoost算法创建模型,将样本数据集按照3:1的训练集和验证集比例随机划分,根据居住区空间形态特征参数建立得到初步预测模型。In this embodiment, a model is created by the XGBoost algorithm, the sample data set is randomly divided according to the ratio of training set and verification set of 3:1, and a preliminary prediction model is established according to the spatial morphological characteristic parameters of the residential area.
步骤S30,根据初步预测模型表现,对初步预测模型进行参数优化。Step S30, according to the performance of the preliminary prediction model, perform parameter optimization on the preliminary prediction model.
在本实施例中,将步骤S20使用的样本数据集,使用k交叉验证设立 N=10,使用kf=StratifiedKFold()函数构建10折交叉验证数据集,将步骤 S20所得的初步预测模型用于新划分的数据集进行应用,输出10个模型评价结果,使用决定系数和均方误差两个参数作为评价模型的好坏结果。通过 tune_data函数对初步预测模型进行参数优化,获取决定系数和均方误差较好的模型设定参数。In this embodiment, the sample data set used in step S20 is set to N=10 using k cross-validation, the kf=StratifiedKFold() function is used to construct a 10-fold cross-validation data set, and the preliminary prediction model obtained in step S20 is used for the new The divided data set is applied, and 10 model evaluation results are output, and the two parameters of determination coefficient and mean square error are used as the evaluation results of the model. The parameters of the preliminary prediction model are optimized by the tune_data function, and the model setting parameters with better coefficient of determination and mean square error are obtained.
在具体实施例中,步骤S30包括In a specific embodiment, step S30 includes
步骤S301,将随机从样本数据集中抽取75%的样本作为训练集,抽取10 次构建10个随机数据集。Step S301, randomly select 75% of the samples from the sample data set as the training set, and extract 10 times to construct 10 random data sets.
步骤S302,将10个随机数据集带入初步预测模型中,得到10个模型的决定系数和均方误差。In step S302, 10 random data sets are brought into the preliminary prediction model, and the determination coefficients and mean square errors of the 10 models are obtained.
步骤S303,通过tune_data函数对初步预测模型进行参数优化,获得优化后模型的设定参数。In step S303, parameters of the preliminary prediction model are optimized by using the tune_data function, and the set parameters of the optimized model are obtained.
步骤S40,将步骤S30中经过优化所得的XGBoost模型参数用于建立最终预测模型,以利用所述模型进行居住区单位用地面积碳排放预测。将预测结果与居住区面积相乘,得到居住区用地碳排放总量。In step S40, the parameters of the XGBoost model obtained by the optimization in step S30 are used to establish a final prediction model, so as to use the model to predict the carbon emission per unit land area of the residential area. Multiply the predicted result by the area of the residential area to obtain the total amount of carbon emissions from the residential area.
在具体实施例中,步骤S40包括:In a specific embodiment, step S40 includes:
步骤S401,优化后参数重新建立XGBoost模型。Step S401, the optimized parameters re-establish the XGBoost model.
步骤S402,通过样本数据集重新训练预测模型。Step S402, retrain the prediction model through the sample data set.
步骤S403,将待测居住区的空间形态参数代入预测模型,获得待测居住区的预测单位用地面积碳排放量。Step S403: Substitute the spatial form parameters of the residential area to be measured into the prediction model to obtain the predicted carbon emission per unit land area of the residential area to be measured.
步骤S404,将预测单位用地面积碳排放量与待测居住区的用地面积相乘,得到待测居住区的预测碳排放总量。Step S404: Multiply the predicted carbon emission per unit land area by the land area of the residential area to be measured to obtain the predicted total carbon emission of the residential area to be measured.
本发明实施例提供的一种基于居住区空间特征的碳排放预测方法,根据居住去空间形态指标建立了居住单位用地面积碳排放预测模型,通过预测模型可以为规划中的居住小区、居住用地提供减碳建议,相较于传统线性回归预测模型、本模型具有更高的精度。本预测模型将规划居住小区空间形态指标输入预测模型,得出规划小区居住区的单位用地面积碳排放量,在未来城市规划中,通过模型预测可以比选确定最低碳的居住区规划形式,实现了居住区规划时控制碳排放量的目标。The embodiment of the present invention provides a carbon emission prediction method based on the spatial characteristics of a residential area. A carbon emission prediction model for the land area of a residential unit is established according to the residential space shape index. Compared with the traditional linear regression prediction model, this model has higher accuracy. In this prediction model, the spatial form index of the planned residential area is input into the prediction model, and the carbon emission per unit land area of the planned residential area is obtained. The goal of controlling carbon emissions in residential area planning is achieved.
作为可选的实施方式,步骤S20包括:As an optional implementation manner, step S20 includes:
步骤S201,根据3:1的比例将样本数据集随机划分为测试集合训练集。Step S201, randomly dividing the sample data set into a test set training set according to a ratio of 3:1.
步骤S202,采用极端梯度提升算法,初步训练构建预测模型。Step S202, an extreme gradient boosting algorithm is used to initially train and construct a prediction model.
作为可选的实施方式,在步骤S20之前,还包括:As an optional implementation manner, before step S20, it also includes:
步骤S11,采用数据空值填充规则对样本数据进行预处理。In step S11, the sample data is preprocessed by adopting the data null value filling rule.
在本实施例中,数据空值填充规则为,单位用地面积碳排放数据如果为空值,首先用处于相同容积率、建筑密度和层数的居住区值填充,若无相同值,则采用该居住区周边居住区值的平均朱进行填充。因为周边小区具有相似性,因此用周边小区的特征参数均值对空值部分进行填充,能够提高预测结果的精度。In this embodiment, the data null value filling rule is, if the carbon emission data per unit land area is null, first fill it with the value of the residential area with the same plot ratio, building density and number of floors, if there is no same value, use the The average Zhu of the residential area values around the residential area is filled. Because the surrounding cells are similar, filling the empty value part with the average value of the characteristic parameters of the surrounding cells can improve the accuracy of the prediction result.
步骤S12,对样本数据的各个特征进行归一化处理。Step S12, normalize each feature of the sample data.
在本实施例中,对样本数据的各个特征进行归一化处理通过以下公式计算:In this embodiment, each feature of the sample data is normalized and calculated by the following formula:

其中,X为样本数据的特征值,Xmin为特征值的最小值,Xmax为特征值的最大值,Xstd为特征值的归一化结果。Among them, X is the eigenvalue of the sample data,Xmin is the minimum value of the eigenvalue,Xmax is the maximum value of the eigenvalue, and Xstdis the normalization result of the eigenvalue.
对样本数据的各个特征进行归一化处理的作用是剔除不同数据间不同量纲的影响。The function of normalizing each feature of the sample data is to eliminate the influence of different dimensions between different data.
作为可选的实施方式,步骤S302包括:As an optional implementation manner, step S302 includes:
步骤S3021,对新构建的10个随机数据集按照3:1的比例随机划分为训练集和测试集。Step S3021, randomly divide the newly constructed 10 random data sets into a training set and a test set according to a ratio of 3:1.
在本实施例中,构建XGBoost初步预测模型参数如下:In this embodiment, the parameters of the XGBoost preliminary prediction model are constructed as follows:
booster='gbtree',计算模型选用树模型,解决模型预测中非线性问题;booster='gbtree', the calculation model selects the tree model to solve the nonlinear problem in the model prediction;
最大增量步长(max_delta_step)=0(取值范围为:[0,∞]),设置每棵树的权重最大增量步长为0表示没有约束;The maximum incremental step size (max_delta_step) = 0 (the value range is: [0, ∞]), setting the maximum incremental step size of the weight of each tree to 0 means there is no constraint;
最大深度(max_depth)=1(取值范围为:[1,∞])树的最大深度为1;Maximum depth (max_depth) = 1 (value range: [1, ∞]) The maximum depth of the tree is 1;
进行分支所需的损失减少的最小值(gamma)=0.3(取值范围为:[0,1])The minimum value of the loss reduction required for branching (gamma) = 0.3 (value range: [0,1])
学习率(learning_rate)=0.3(取值范围为:[0,1]);Learning rate (learning_rate) = 0.3 (value range: [0,1]);
树的最小样本数(min_child_weight)=4(取值范围为:[0,∞]),指节点中最小样本权重和,如果一个节点样本权重和小于4则拆分过程结束,在现行回归模型中,这个参数是指建立每个模型所需要的最小样本数。The minimum number of samples of the tree (min_child_weight) = 4 (the value range is: [0, ∞]), which refers to the minimum sample weight sum in the node. If the sample weight sum of a node is less than 4, the splitting process ends. In the current regression model , this parameter refers to the minimum number of samples required to build each model.
步骤S3022,按照划定数据集进行测试,输出每个数据集额决定系数和均方误差。Step S3022, test according to the defined data set, and output the determination coefficient and mean square error of each data set.
作为可选的实施方式,步骤S303包括:As an optional implementation manner, step S303 includes:
步骤S3031,通过tune_data函数对步骤S302的初步模型进行多次优化;Step S3031, performing multiple optimizations on the preliminary model of step S302 through the tune_data function;
步骤S3032,选取均方误差和决定系数在10个数据集内平均效果最好(均方误差最小,决定系数最大)的模型参数作为最终优化的参数。In step S3032, the model parameters with the mean square error and the coefficient of determination having the best average effect (the smallest mean square error and the largest coefficient of determination) in the 10 data sets are selected as the final optimized parameters.
在本实施例中,优化后XGBoost预测模型参数如下:In this embodiment, the optimized XGBoost prediction model parameters are as follows:
booster='gbtree';最大增量步长(max_delta_step)=0.2;最大深度 (max_depth)=6;进行分支所需的损失减少的最小值(gamma)=0.1(取值范围为:[0,1]);学习率(learning_rate)=0.025(取值范围为:[0,1]);树的最小样本数(min_child_weight)=3。booster='gbtree'; maximum incremental step size (max_delta_step)=0.2; maximum depth (max_depth)=6; minimum value of loss reduction required for branching (gamma)=0.1 (value range: [0,1 ]); learning rate (learning_rate) = 0.025 (value range: [0, 1]); the minimum number of samples of the tree (min_child_weight) = 3.
作为可选的实施方式,步骤S402包括:As an optional implementation manner, step S402 includes:
步骤S4021,将S3032所得最优参数带入构建新XGBoost模型;Step S4021, bringing the optimal parameters obtained in S3032 into the construction of a new XGBoost model;
步骤S4022,按预设次数重复训练Step S4022, repeat the training according to a preset number of times
在本实施例中,重复训练次数设置为十次In this embodiment, the number of repetitions of training is set to ten times
步骤S4023,选取均方误差小于等于样本数据平均值10%的预测模型为最优预测模型。In step S4023, a prediction model with a mean square error less than or equal to 10% of the average value of the sample data is selected as the optimal prediction model.
在本实施例中,预测模型的计算过程如下:In this embodiment, the calculation process of the prediction model is as follows:
获取每个预测模型的预测结果:Get the predictions for each prediction model:

其中,
选取最优预测模型:Choose the optimal prediction model:

其中,yt表示经过训练的第t棵树的优化预测结果,ft为第t轮的训练模型,t∈[1,n],N为样本数据总数,Ω(fi)表示正则项优化函数,
选取最优预测模型的过程即为优化预测模型的过程,通过误差函数以及正则项优化函数优化预测模型,使预测模型的结果误差缩小到10%以内。The process of selecting the optimal prediction model is the process of optimizing the prediction model. The prediction model is optimized by the error function and the regular term optimization function, so that the result error of the prediction model is reduced to less than 10%.
计算训练集预测结果同测试集预测结果之间的均方误差(MSE),由于训练次数有限,因此设置了均方误差比样本数据平均值小于或等于10%的判断条件,从而选出最优预测模型。在具体实施例中,可以增加训练次数,同时降低均方误差的参考值,从而进一步提高模型的预测精度。Calculate the mean square error (MSE) between the prediction results of the training set and the prediction results of the test set. Due to the limited number of training times, the judgment condition that the mean square error is less than or equal to 10% of the average value of the sample data is set, so as to select the optimal one. prediction model. In a specific embodiment, the number of training times can be increased, while the reference value of the mean square error can be reduced, thereby further improving the prediction accuracy of the model.
以四川省金堂县居住区碳排放数据作为研究对象,具体步骤如下:Taking the carbon emission data of the residential area of Jintang County, Sichuan Province as the research object, the specific steps are as follows:
步骤1:获取居住区碳排放数据、居住区用地面积数据、居住区空间形态特征数据。Step 1: Obtain the carbon emission data of the residential area, the land area data of the residential area, and the spatial morphological characteristic data of the residential area.
步骤2:利用所述居住区碳排放数据、居住区用地面积数据将所述居住建筑燃气排放数据转化为居住区单位用地面积碳排放数据。Step 2: using the residential area carbon emission data and the residential area land area data to convert the residential building gas emission data into the residential area unit land area carbon emission data.
步骤3:将所述居住区单位用地面积碳排放数据、所述居住区空间形态特征进行预处理,得到样本数据集。Step 3: Preprocess the carbon emission data per unit land area of the residential area and the spatial morphological characteristics of the residential area to obtain a sample data set.
步骤4:通过XGBoost算法构建初步预测模型。Step 4: Build a preliminary prediction model through the XGBoost algorithm.
步骤5:根据步骤4所得到的初步预测模型,将步骤3所得数据集随机抽样划分,划分为10个新数据集。在应用XGBoost算法下tune_data函数对模型进行优化,在10个新数据集上验证优化结果,选取效果最好的优化参数。Step 5: According to the preliminary prediction model obtained in Step 4, the data set obtained in Step 3 is randomly sampled and divided into 10 new data sets. The tune_data function is applied to optimize the model under the XGBoost algorithm, and the optimization results are verified on 10 new data sets, and the optimal parameters with the best effect are selected.
步骤6:将步骤5选择出的模型优化参数,重新建立预测模型,用XGBoost 算法建立对所述居住区单位用地面积碳排放预测模型,以利用所述模型进行居住区单位用地面积碳排放预测。将预测结果与居住区用地面积相乘,得到居住区碳排放总量。Step 6: Rebuild the prediction model by optimizing the parameters of the model selected in Step 5, and use the XGBoost algorithm to establish a carbon emission prediction model for the unit land area of the residential area, so as to use the model to predict the carbon emission per unit land area of the residential area. Multiply the predicted result by the land area of the residential area to obtain the total carbon emission of the residential area.
一个预测模型的结果拟合曲线如图2所示,实线y为实际结果,虚线 y_pred为预测结果。The result fitting curve of a prediction model is shown in Figure 2. The solid line y is the actual result, and the dotted line y_pred is the prediction result.
模型参数根据数据样本结合tune_data函数进行自优化调整,本方法应用于其他数据时,应根据步骤6所述模型选择最优模型作为最终预测模型,其模型具体参数根据数据样本进行调整,即可应用于不同地区进行居住区碳排放量预测,并且预测拟合度较高,可靠性强。The model parameters are self-optimized and adjusted according to the data samples combined with the tune_data function. When this method is applied to other data, the optimal model should be selected as the final prediction model according to the model described in
上述居住建筑燃气碳排放量预测终端具体细节可以对应参阅图1和图2 所示的实施例中对应的相关描述和效果进行理解,此处不再赘述。The specific details of the above-mentioned residential building gas carbon emission prediction terminal can be understood by referring to the corresponding descriptions and effects in the embodiments shown in FIG. 1 and FIG. 2 , and will not be repeated here.
本领域技术人员可以理解,实现上述实施例方法中的全部或部分流程,是可以通过计算机程序来指令相关的硬件来完成,所述的程序可存储于一计算机可读取存储介质中,该程序在执行时,可包括如上述各方法的实施例的流程。其中,所述存储介质可为磁碟、光盘、只读存储记忆体(Read-Only Memory,ROM)、随机存储记忆体(Random AccessMemory,RAM)、快闪存储器(Flash Memory)、硬盘(Hard Disk Drive,缩写:HDD)或固态硬盘(Solid-State Drive,SSD)等;所述存储介质还可以包括上述种类的存储器的组合。Those skilled in the art can understand that all or part of the processes in the methods of the above embodiments can be completed by instructing relevant hardware through a computer program, and the program can be stored in a computer-readable storage medium. During execution, the processes of the embodiments of the above-mentioned methods may be included. Wherein, the storage medium may be a magnetic disk, an optical disk, a read-only memory (Read-Only Memory, ROM), a random access memory (Random Access Memory, RAM), a flash memory (Flash Memory), a hard disk (Hard Disk) Drive, abbreviation: HDD) or solid-state drive (Solid-State Drive, SSD), etc.; the storage medium may also include a combination of the above-mentioned types of memories.
由上所述,本发明实施例提供的一种基于居住区空间特征的碳排放预测方法,根据居住区空间形态指标建立了居住单位用地面积碳排放预测模型,通过预测模型可以为规划中的居住小区、居住用地提供减碳建议,相较于传统线性回归预测模型、本模型具有更高的精度。本预测模型将规划居住小区空间形态指标输入预测模型,得出规划小区居住区的单位用地面积碳排放量,在未来城市规划中,通过模型预测可以比选确定最低碳的居住区规划形式,实现了居住区规划时控制碳排放量的目标。From the above, the embodiment of the present invention provides a carbon emission prediction method based on the spatial characteristics of a residential area. Compared with the traditional linear regression prediction model, this model has higher accuracy. In this prediction model, the spatial form index of the planned residential area is input into the prediction model, and the carbon emission per unit land area of the planned residential area is obtained. The goal of controlling carbon emissions in residential area planning is achieved.
虽然结合附图描述了本发明的实施例,但是本领域技术人员可以在不脱离本发明的精神和范围的情况下作出各种修改和变型,这样的修改和变型均落入由所附权利要求所限定的范围之内。Although the embodiments of the present invention have been described in conjunction with the accompanying drawings, various modifications and variations can be made by those skilled in the art without departing from the spirit and scope of the present invention, such modifications and variations falling within the scope of the appended claims within the limited range.
Claims (10)
Translated fromChinese


Priority Applications (1)
| Application Number | Priority Date | Filing Date | Title |
|---|---|---|---|
| CN202110718836.5ACN113610268A (en) | 2021-06-28 | 2021-06-28 | Carbon emission prediction method based on residential area space form |
Applications Claiming Priority (1)
| Application Number | Priority Date | Filing Date | Title |
|---|---|---|---|
| CN202110718836.5ACN113610268A (en) | 2021-06-28 | 2021-06-28 | Carbon emission prediction method based on residential area space form |
Publications (1)
| Publication Number | Publication Date |
|---|---|
| CN113610268Atrue CN113610268A (en) | 2021-11-05 |
Family
ID=78303780
Family Applications (1)
| Application Number | Title | Priority Date | Filing Date |
|---|---|---|---|
| CN202110718836.5APendingCN113610268A (en) | 2021-06-28 | 2021-06-28 | Carbon emission prediction method based on residential area space form |
Country Status (1)
| Country | Link |
|---|---|
| CN (1) | CN113610268A (en) |
Cited By (5)
| Publication number | Priority date | Publication date | Assignee | Title |
|---|---|---|---|---|
| CN114970968A (en)* | 2022-04-26 | 2022-08-30 | 西华大学 | Data processing system based on carbon peak reaching |
| CN115099450A (en)* | 2022-04-22 | 2022-09-23 | 清华大学深圳国际研究生院 | Household carbon emission monitoring and accounting platform based on fusion model |
| CN115293461A (en)* | 2022-09-28 | 2022-11-04 | 四川中电启明星信息技术有限公司 | Building heating carbon emission prediction method and system |
| CN119558876A (en)* | 2025-02-05 | 2025-03-04 | 中国科学院合肥物质科学研究院 | A method and device for analyzing carbon emissions from residential land, and a storage medium |
| CN120317458A (en)* | 2025-06-17 | 2025-07-15 | 武汉理工大学三亚科教创新园 | Prediction and control method of building carbon emissions based on machine learning and multi-objective optimization |
Citations (3)
| Publication number | Priority date | Publication date | Assignee | Title |
|---|---|---|---|---|
| CN111445060A (en)* | 2020-03-06 | 2020-07-24 | 华南理工大学珠海现代产业创新研究院 | Community carbon emission monitoring and predicting system and method |
| CN111882033A (en)* | 2020-07-15 | 2020-11-03 | 南京航空航天大学 | A Keras-based active and passive carbon emission prediction method for regional civil aviation |
| CN112329262A (en)* | 2020-11-24 | 2021-02-05 | 天津大学城市规划设计研究院有限公司 | Residential building gas carbon emission prediction method |
- 2021
- 2021-06-28CNCN202110718836.5Apatent/CN113610268A/enactivePending
Patent Citations (3)
| Publication number | Priority date | Publication date | Assignee | Title |
|---|---|---|---|---|
| CN111445060A (en)* | 2020-03-06 | 2020-07-24 | 华南理工大学珠海现代产业创新研究院 | Community carbon emission monitoring and predicting system and method |
| CN111882033A (en)* | 2020-07-15 | 2020-11-03 | 南京航空航天大学 | A Keras-based active and passive carbon emission prediction method for regional civil aviation |
| CN112329262A (en)* | 2020-11-24 | 2021-02-05 | 天津大学城市规划设计研究院有限公司 | Residential building gas carbon emission prediction method |
Cited By (7)
| Publication number | Priority date | Publication date | Assignee | Title |
|---|---|---|---|---|
| CN115099450A (en)* | 2022-04-22 | 2022-09-23 | 清华大学深圳国际研究生院 | Household carbon emission monitoring and accounting platform based on fusion model |
| CN114970968A (en)* | 2022-04-26 | 2022-08-30 | 西华大学 | Data processing system based on carbon peak reaching |
| CN115293461A (en)* | 2022-09-28 | 2022-11-04 | 四川中电启明星信息技术有限公司 | Building heating carbon emission prediction method and system |
| CN115293461B (en)* | 2022-09-28 | 2022-12-16 | 四川中电启明星信息技术有限公司 | Building heating carbon emission prediction method and system |
| CN119558876A (en)* | 2025-02-05 | 2025-03-04 | 中国科学院合肥物质科学研究院 | A method and device for analyzing carbon emissions from residential land, and a storage medium |
| CN120317458A (en)* | 2025-06-17 | 2025-07-15 | 武汉理工大学三亚科教创新园 | Prediction and control method of building carbon emissions based on machine learning and multi-objective optimization |
| CN120317458B (en)* | 2025-06-17 | 2025-09-23 | 武汉理工大学三亚科教创新园 | Prediction and control method of building carbon emissions based on machine learning and multi-objective optimization |
Similar Documents
| Publication | Publication Date | Title |
|---|---|---|
| CN113610268A (en) | Carbon emission prediction method based on residential area space form | |
| CN109313670B (en) | Method and system for generating lattice proposals in computer aided design applications | |
| CN115270635B (en) | Bayesian-Neural Network Method for Seismic Demand and Vulnerability Prediction of Tall Buildings | |
| CN112329262A (en) | Residential building gas carbon emission prediction method | |
| CN115600650B (en) | Automated convolutional neural network quantization pruning method, device and storage medium based on reinforcement learning | |
| CN109034223A (en) | A kind of Study on prediction technology of chaotic series and system | |
| CN105822301A (en) | Method for establishing logging prediction mathematic model about TOC (Total Organic Carbon) | |
| CN119442404B (en) | Rural house structure optimization design method and system based on building information modeling | |
| CN110096805A (en) | Based on the quantization of structural parameters uncertainty and transmission method for improving bootstrap under a kind of finite observation data | |
| CN118410721B (en) | Energy consumption diagonal bracing design parameter optimization method for highway pile plate structure | |
| CN113343504A (en) | Three-dimensional landslide motion risk probability evaluation method | |
| CN116485036A (en) | A short-term prediction method for multi-energy flow carbon emissions based on multi-task learning mechanism | |
| CN113449257A (en) | Power distribution network line loss prediction method, control device, and storage medium | |
| CN118551669A (en) | Multi-objective energy-saving optimization method and device for building envelope structure based on climate prediction | |
| CN116362076A (en) | Sensor optimal arrangement method and system considering damage degree of metal structure | |
| CN108763648A (en) | Method and apparatus based on nuclear magnetic resonance T2 distributed acquisition capillary pressure curves | |
| CN114818418A (en) | Slope reliability analysis method based on active learning multivariate adaptive regression spline | |
| CN115186936B (en) | Optimal well pattern construction method for oil field based on GNN model | |
| CN103839113A (en) | Microscopic simulation method based on house selecting models of house-renting selectors and house selecting models of house-purchasing selectors | |
| CN114943060B (en) | Shale gas total organic carbon prediction method based on deep learning and interpolation regression | |
| CN111811465A (en) | A method for predicting the effective wave height of ocean waves based on multi-sine function decomposition neural network | |
| CN115688600A (en) | Oil reservoir well position optimization method, electronic equipment and storage medium | |
| CN119444104A (en) | Construction site early warning method, equipment, storage medium and program product | |
| CN112580885A (en) | Method, device and equipment for predicting accessory qualification rate and storage medium | |
| CN115712977A (en) | Gear reducer robust optimization design method based on assistance of Kriging surrogate model |
Legal Events
| Date | Code | Title | Description |
|---|---|---|---|
| PB01 | Publication | ||
| PB01 | Publication | ||
| SE01 | Entry into force of request for substantive examination | ||
| SE01 | Entry into force of request for substantive examination | ||
| RJ01 | Rejection of invention patent application after publication | ||
| RJ01 | Rejection of invention patent application after publication | Application publication date:20211105 |