CN113366473A - Method and system for automatic selection of models for time series prediction of data streams - Google Patents
Method and system for automatic selection of models for time series prediction of data streamsDownload PDFInfo
- Publication number
- CN113366473A CN113366473ACN201980090455.8ACN201980090455ACN113366473ACN 113366473 ACN113366473 ACN 113366473ACN 201980090455 ACN201980090455 ACN 201980090455ACN 113366473 ACN113366473 ACN 113366473A
- Authority
- CN
- China
- Prior art keywords
- time series
- events
- window
- statistical
- model
- Prior art date
- Legal status (The legal status is an assumption and is not a legal conclusion. Google has not performed a legal analysis and makes no representation as to the accuracy of the status listed.)
- Granted
Links
Images


Classifications
- G—PHYSICS
- G06—COMPUTING OR CALCULATING; COUNTING
- G06F—ELECTRIC DIGITAL DATA PROCESSING
- G06F17/00—Digital computing or data processing equipment or methods, specially adapted for specific functions
- G06F17/10—Complex mathematical operations
Landscapes
- Engineering & Computer Science (AREA)
- Physics & Mathematics (AREA)
- Theoretical Computer Science (AREA)
- Mathematical Physics (AREA)
- Data Mining & Analysis (AREA)
- General Physics & Mathematics (AREA)
- Mathematical Analysis (AREA)
- Mathematical Optimization (AREA)
- Computational Mathematics (AREA)
- Pure & Applied Mathematics (AREA)
- Databases & Information Systems (AREA)
- Software Systems (AREA)
- General Engineering & Computer Science (AREA)
- Algebra (AREA)
- Management, Administration, Business Operations System, And Electronic Commerce (AREA)
Abstract
Translated fromChinese
Description
Translated fromChinese背景技术Background technique
在当前的大数据时代,数据正在以极高的速率和数量产生。在许多情况下,数据的形式是时间序列数据流,使得离线存储和查询数据是不可行的。如本领域技术人员所知,数据流是连续序列事件。每个事件可以是由单个源(例如,传感器、机器或人类)生成的单个数据,也可以是由一个或多个源生成的数据组合或数据对(例如,n元组)。时间序列数据流是事件按时间顺序排列的数据流。在许多应用中,能够实时预测时间序列数据流中的下一个值或一组值将是有价值的,在此称为时间序列数据流预测或时间序列数据流预报。此类应用的示例包括但不限于预测性维护系统、交通控制/监控系统和污染分布估计系统。In the current era of big data, data is being generated at an extremely high rate and volume. In many cases, the data is in the form of a time-series data stream, making it impractical to store and query the data offline. As known to those skilled in the art, a data stream is a continuous sequence of events. Each event can be a single piece of data generated by a single source (eg, sensor, machine, or human), or a combination of data or a pair of data (eg, n-tuple) generated by one or more sources. A time series data stream is a data stream in which events are arranged in chronological order. In many applications, it would be valuable to be able to predict the next value or set of values in a time series data stream in real time, referred to herein as time series data stream forecasting or time series data stream forecasting. Examples of such applications include, but are not limited to, predictive maintenance systems, traffic control/monitoring systems, and pollution distribution estimation systems.
大多数数据流处理系统用于一次处理事件的子集。具体来说,大多数数据流处理系统用于在任何时候处理时间序列数据流106中的事件104的窗口102,如图1所示。窗口102是关于时间或事件的逻辑序列的定界,包括边界内的事件104。窗口102中的事件104通常随着时间的推移而变化,因为新事件到达并位于边界内,旧事件位于边界外并从窗口102中删除。以这种方式,数据流可以在不同的时间点产生新的窗口实例,其中窗口实例包括窗口中特定时间实例的事件。也就是说,使用可变或固定大小的滑动窗口从时间序列中提取事件序列。例如,如图1所示,滑动窗口102包含或包括数据流中最近的N个事件,其中N是大于或等于1的整数。Most data stream processing systems are used to process a subset of events at a time. Specifically, most data stream processing systems are used to process a
执行时间序列数据流预测通常包括选择和/或生成准确描述和预测时间序列数据流的预测模型;以及使用选择的预测模型从窗口中的事件预测未来事件。在某些情况下,预测模型是根据时间序列数据流的已知特征提前选择和参数化的。然而,模型的选择和参数化通常是通过耗时的手动过程或通过资源贪婪和计算成本高的自动化过程来完成的。此外,提前选择和参数化预测模型往往不适用于时间序列数据流,其中其特征(例如,统计度量)随着时间的推移而变化或演变(例如,概念漂移)。因此,为了能够为不断演变的时间序列数据流提供准确的预测,期望能够随着时间序列数据流的特征变化而实时动态地选择和参数化预测模型。例如,如图1所示,期望具有预测模型选择器108,能够根据当前在窗口102中的事件104从多个预测模型110中为演变的时间序列数据流实时(即,相对于最新事件的时间基准具有非常低的延迟)动态地选择一个预测模型110。Performing time-series data stream forecasting generally involves selecting and/or generating a forecasting model that accurately describes and predicts the time-series data stream; and using the selected forecasting model to predict future events from events in a window. In some cases, forecasting models are pre-selected and parameterized based on known characteristics of the time series data stream. However, model selection and parameterization is usually done through time-consuming manual processes or through automated processes that are resource greedy and computationally expensive. Furthermore, advance selection and parametric forecasting models are often inappropriate for time-series data streams, where their characteristics (eg, statistical measures) change or evolve over time (eg, concept drift). Therefore, in order to be able to provide accurate forecasts for an evolving time-series data stream, it is desirable to be able to dynamically select and parameterize a forecasting model in real-time as the characteristics of the time-series data stream change. For example, as shown in FIG. 1, it is desirable to have a
用于处理数据流的已知系统用于动态或实时处理数据。用于处理数据流的已知系统的示例包括但不限于Apache Flink、Spark Streaming、Storm、Samza和Dataflow。这些系统用于根据流中事件的时间顺序提供处理能力。根据特定系统,时间可以设置为参考事件时间、处理时间、计算机时间或事件的到达时间。许多系统允许以某种形式将事件分组到窗口中。然而,这些系统的窗口操作符通常与用户定义的函数一起工作,因此根据函数属性进行优化。此外,这些系统通常保留位于窗口范围(通常在内存中)的所有数据,以便由窗口函数处理,即使窗口函数只使用其中的一部分。如本领域技术人员所知,窗口函数是应用于窗口中的一组事件的函数。示例性窗口函数包括但不限于排序函数或确定窗口中事件最大值的函数。虽然这些系统可以动态处理数据流,但它们不支持动态选择用于数据流时间序列预测的预测模型。Known systems for processing data streams are used to process data dynamically or in real time. Examples of known systems for processing data streams include, but are not limited to, Apache Flink, Spark Streaming, Storm, Samza, and Dataflow. These systems are used to provide processing power based on the chronological order of events in the stream. Depending on the specific system, the time can be set to reference event time, processing time, computer time, or the arrival time of the event. Many systems allow some form of grouping of events into windows. However, the window operators of these systems usually work with user-defined functions and are therefore optimized according to function properties. Also, these systems typically keep all data located at the window's extent (usually in memory) for processing by the window function, even if the window function only uses a portion of it. As known to those skilled in the art, a window function is a function applied to a set of events in a window. Exemplary window functions include, but are not limited to, ranking functions or functions that determine the maximum value of events in a window. While these systems can process data streams dynamically, they do not support dynamic selection of forecasting models for data stream time series forecasting.
存在用于自动选择时间序列的预测模型并使用所选择的预测模型对时间序列进行预测的已知系统。这些系统用于确定时间序列的适当预测模型,估计模型的参数,并根据模型计算预测。这些系统通常设计为能够为可能具有不寻常的时间序列模式的大量时间序列选择预测模型。这些系统最流行的版本是基于指数平滑或自回归积分移动平均(AutoRegressive Integrated Moving Average,ARIMA)模型。对于时间序列,这些系统通常用于:(i)应用适合时间序列的所有模型,并更新和优化每个模型的参数(平滑参数和初始状态变量);(ii)根据误差度量选择应用模型中的最佳模型,例如,误差度量包括但不限于均方根误差(Root Mean Square Error,RMSE)或平均绝对百分比误差(Mean AbsolutePercentage Error,MAPE);(iii)为一个或多个未来事件生成预测;(iv)获得最佳模型的预测间隔。这些系统的示例在R.J Hyndman等人于2008年在统计软件杂志“自动时间序列预报:R的预报包(Automatic time series forecasting:The forecast package for R)”中以及R.Hyndman、A.B.Koehler、J.K.Ord和R.D.Snyder于2008年在施普林格科学和商业媒体“使用指数平滑进行预报:状态空间方法(Forecasting with exponential smoothing:thestate space approach)”中加以描述。There are known systems for automatically selecting a forecasting model for a time series and using the selected forecasting model to forecast the time series. These systems are used to determine an appropriate forecasting model for a time series, estimate the parameters of the model, and compute forecasts from the model. These systems are often designed to be able to select a forecasting model for a large number of time series that may have unusual time series patterns. The most popular versions of these systems are based on exponential smoothing or AutoRegressive Integrated Moving Average (ARIMA) models. For time series, these systems are typically used to: (i) apply all models that fit the time series, and update and optimize the parameters of each model (smoothing parameters and initial state variables); (ii) select the applied model based on the error metric Best model, for example, error metrics including but not limited to Root Mean Square Error (RMSE) or Mean Absolute Percentage Error (MAPE); (iii) generating forecasts for one or more future events; (iv) Obtain the prediction interval of the best model. Examples of these systems are in R.J Hyndman et al., 2008 in the Journal of Statistical Software "Automatic time series forecasting: The forecast package for R" and R.Hyndman, A.B.Koehler, J.K.Ord and R.D. Snyder in Springer Science and Business Media "Forecasting with exponential smoothing: the state space approach" in 2008.
然而,这些系统已经设计用于静态时间序列(例如,时间序列已经被捕获,并且离线(例如,不实时)选择用于预测的模型,并且这些系统不适合实时预测数据流。首先,如上所述,已知的时间序列自动模型选择和预测系统将所有合适的模型应用于时间序列,并根据时间序列更新和优化每个模型的参数。更新和优化模型需要一个时间和资源密集型的收敛过程,这可能会使更新和优化许多模型并实时预测变得困难,特别是对于高频数据流。其次,时间序列预测误差度量,如RMSE和MAPE,通常可用于选择具有最佳预测精度的模型,前提是误差是从用于估计建模的数据集不同的数据集计算的。然而,样本外错误往往太少,无法得出可靠的结论。However, these systems have been designed for static time series (e.g., the time series has been captured and the model selected for prediction offline (e.g., not in real time), and these systems are not suitable for real-time prediction data streams. First, as discussed above , known automatic model selection and forecasting systems for time series apply all suitable models to the time series and update and optimize the parameters of each model based on the time series. Updating and optimizing the model requires a time and resource intensive convergence process, This can make it difficult to update and optimize many models and forecast in real time, especially for high-frequency data streams. Second, time series forecast error measures, such as RMSE and MAPE, can often be used to select the model with the best forecast accuracy, provided that is that the error is computed from a dataset different from the one used for estimation modeling. However, the out-of-sample error is often too small to draw reliable conclusions.
已经开发了基于机器学习的系统,用于自动选择时间序列的预测模型并使用选定的预测模型对时间序列进行预测,以解决上述统计系统的一些问题。用于自动选择时间序列的预测模型并使用所选择的预测模型对时间序列进行预测的已知基于机器学习的系统侧重于实现贝叶斯积分、支持向量回归、非线性最小二乘法、集成方法、神经网络和专家系统的选择过程。R.Fonsca等人于2016年8月在IEEE会刊第14卷第8期第3811页至3819页“时间序列预报的集成中的自动模型选择(Automatic Model Selection in Ensembles forTime Series Forecasting)”中描述了机器学习系统的一个示例。本文认为,相关模型的多样性和准确性是选择模型时最重要的因素,从而描述了一个基于自组织映射(Self-Organizing Map,SOM)神经网络和元特征进行多步骤预测的系统。所述系统在模型选择中自动调整多样性和准确性之间的平衡,并能够为高度非线性的时间序列产生良好的结果。然而,所述系统需要神经网络的离线无监督训练和复杂的模型训练,使得所述系统不适合实现数据流的实时模型选择和预测。Machine learning-based systems have been developed for automatically selecting a forecasting model for time series and using the selected forecasting model to forecast time series to address some of the problems of statistical systems described above. Known machine learning based systems for automatically selecting a forecasting model for a time series and using the selected forecasting model for forecasting a time series focus on implementing Bayesian integration, support vector regression, nonlinear least squares, ensemble methods, The selection process of neural networks and expert systems. R.Fonsca et al. IEEE Proceedings, Vol. 14, No. 8, pp. 3811-3819, "Automatic Model Selection in Ensembles for Time Series Forecasting", August 2016 An example of a machine learning system. This paper argues that the diversity and accuracy of relevant models are the most important factors when choosing a model, thereby describing a system for multi-step prediction based on Self-Organizing Map (SOM) neural networks and meta-features. The system automatically adjusts the balance between diversity and accuracy in model selection and is able to produce good results for highly nonlinear time series. However, the system requires offline unsupervised training of neural networks and complex model training, making the system unsuitable for real-time model selection and prediction of data streams.
机器学习系统的另一个示例在M.Adya等人于2016年在决策支持系统(DecisionSupport Systems)第83卷“基于规则的时间序列复杂性评分技术的开发和验证,以支持自适应预报DSS的设计(Development and validation of rule-based time seriescomplexity scoring technique to support design of adaptive forecasting DSS)”中加以描述。本文认为,时间序列复杂性可以使设计一个自适应预报决策支持系统,以积极支持预报行为和结果的准确性。预报决策支持系统(forecasting decision supportsystem,FDSS)是以基于规则的复杂性评分技术为基础,该技术使用依赖于序列的14个特征的12条规则生成时间序列的复杂性评分。然而,大量的规则和特征使得难以做出实时决策,使其不适合预测时间序列数据流。此外,FDSS使用复杂的特征,如不连续性水平、基本趋势方向和领域知识,这增加了系统的适应性,但也增加了系统的复杂性和计算时间。Another example of a machine learning system is described in M. Adya et al., 2016 in Decision Support Systems Volume 83 "Development and Validation of a Rule-Based Time Series Complexity Scoring Technique to Support the Design of Adaptive Forecasting DSS" (Development and validation of rule-based time seriescomplexity scoring technique to support design of adaptive forecasting DSS)". This paper argues that time series complexity enables the design of an adaptive forecast decision support system to actively support forecast behavior and the accuracy of results. The forecasting decision support system (FDSS) is based on a rule-based complexity scoring technique that generates a complexity score for a time series using 12 rules that depend on 14 features of the sequence. However, the large number of rules and features make it difficult to make real-time decisions, making it unsuitable for forecasting time-series data streams. Furthermore, FDSS uses complex features such as discontinuity levels, fundamental trend directions, and domain knowledge, which increase the adaptability of the system, but also increase the complexity and computation time of the system.
因此,需要实时自动选择时间序列数据流的预测模型的系统和方法,该模型只需要单次传递窗口中的事件。Accordingly, there is a need for a system and method for automatically selecting, in real-time, a predictive model of a time series data stream that requires only a single pass of events in a window.
下面描述的实施例仅作为示例提供,并且不限制解决用于数据流时间序列预测的已知系统和方法的任何或所有缺点的实现。The embodiments described below are provided by way of example only, and are not limiting of implementations that address any or all of the disadvantages of known systems and methods for data stream time series forecasting.
发明内容SUMMARY OF THE INVENTION
发明内容介绍了一些概念,在具体实施方式中会进一步描述这些概念。本发明内容的目的旨在识别权利要求书保护的主题的关键特征或必要特征,也非旨在限制权利要求书保护的主题的范围。This Summary introduces concepts that are further described in the Detailed Description. This Summary is intended to identify key features or essential features of the claimed subject matter, and is not intended to limit the scope of the claimed subject matter.
本文中描述了用于动态选择时间序列事件的预测模型的方法和系统。所述系统包括:统计逻辑,用于为窗口中的一组事件生成一个或多个统计度量;关联逻辑,用于为所述窗口中的事件生成一个或多个时间序列关联度量;模型搜索逻辑,用于根据每个预测模型根据所述一个或多个时间序列关联度量与所述时间序列之间的匹配程度,从多个预测模型中选择预测模型的子集;聚类逻辑,用于根据所述统计度量,对所述子集中的所述预测模型进行聚类;控制逻辑,用于根据所述预测模型的聚类和所述统计度量,选择所述子集中的一个预测模型;预测逻辑,用于使用所选择的预测模型从所述窗口中的所述多个事件实时生成预测输出。Described herein are methods and systems for dynamically selecting predictive models for time series events. The system includes: statistical logic for generating one or more statistical measures for a set of events in a window; correlation logic for generating one or more time-series correlation measures for events in the window; model search logic , which is used to select a subset of prediction models from multiple prediction models according to the degree of matching between the one or more time series correlation measures and the time series according to each prediction model; clustering logic is used to select a subset of prediction models according to the the statistical measure, for clustering the prediction models in the subset; control logic for selecting a prediction model in the subset according to the clustering of the prediction models and the statistical measure; the prediction logic , for generating a prediction output in real time from the plurality of events in the window using the selected prediction model.
第一方面提供了一种用于动态选择时间序列事件的预测模型的计算机实现方法,其中,所述方法在一个或多个处理器中包括以下步骤:(a)为窗口中的多个事件生成一个或多个统计度量,其中,所述窗口包括一系列时间序列事件;(b)为所述窗口中的所述多个事件生成一个或多个时间序列关联度量;(c)根据所述一个或多个时间序列关联度量,基于表示每个预测模型与所述时间序列之间的匹配的质量测量,从多个预测模型中选择预测模型的子集;(d)根据所述统计度量,对所述子集中的所述预测模型进行聚类;(e)根据所述预测模型的聚类和所述统计度量,选择所述子集中的一个预测模型;(f)使用所选择的预测模型从所述窗口中的所述多个事件实时生成预测输出。步骤(a)至(f)可以以任意顺序交叉进行,其中一些步骤可以同时执行,例如(a)和(b)。A first aspect provides a computer-implemented method for dynamically selecting a prediction model for time-series events, wherein the method includes, in one or more processors, the steps of: (a) generating for a plurality of events in a window one or more statistical measures, wherein the window includes a series of time series events; (b) generating one or more time series correlation measures for the plurality of events in the window; (c) according to the one or a plurality of time series association metrics, selecting a subset of predictive models from a plurality of predictive models based on a quality measure representing a match between each predictive model and the time series; (d) based on the statistical metric, for Clustering the predictive models in the subset; (e) selecting a predictive model in the subset based on the clustering of the predictive models and the statistical measure; (f) using the selected predictive model from The plurality of events in the window generate a prediction output in real time. Steps (a) to (f) may be performed alternately in any order, some of which may be performed simultaneously, eg (a) and (b).
所述方法还可以包括对所述时间序列中所述多个事件的后续窗口重复(a)至(f)。在下文中,所有步骤(a)至(f)都在一段时间内重复。计算是增量计算,因为在时间t+1生成的结果是基于时间t的结果。前一个窗口是指在时间t时紧随窗口之前的事件窗口,而后续窗口是指在时间t时紧随窗口之后的窗口。The method may also include repeating (a) through (f) for subsequent windows of the plurality of events in the time series. In the following, all steps (a) to (f) are repeated over a period of time. The calculation is incremental because the result generated at time t+1 is based on the result at time t. The previous window refers to the event window immediately preceding the window at time t, and the subsequent window refers to the window immediately following the window at time t.
所述一个或多个统计度量可以从所述时间序列中所述多个事件的前一个窗口的一个或多个统计度量增量生成的。The one or more statistical measures may be incrementally generated from one or more statistical measures of a previous window of the plurality of events in the time series.
所述一个或多个时间序列关联度量可以从所述时间序列中所述多个事件的所述前一个窗口的一个或多个时间序列关联度量增量生成的。The one or more time series correlation metrics may be incrementally generated from one or more time series correlation metrics for the previous window of the plurality of events in the time series.
每个统计度量可以描述所述窗口中所述多个事件的数学属性。Each statistical measure may describe a mathematical property of the plurality of events in the window.
所述一个或多个统计度量包括所述窗口中所述多个事件的偏度、峰度、标准偏差和均值中的一个或多个。The one or more statistical measures include one or more of skewness, kurtosis, standard deviation, and mean of the plurality of events in the window.
每个时间序列关联度量可以根据事件参数描述所述窗口中所述多个事件之间的关系。具体来说,时间序列事件包括事件发生的时间和/或事件发生的位置等参数。Each time series correlation metric may describe the relationship between the multiple events in the window according to event parameters. Specifically, a time-series event includes parameters such as the time and/or location of the event.
所述一个或多个时间序列关联度量可以包括协方差、自相关函数、部分自相关函数、时空协方差函数、时空自相关函数和时空部分自相关函数中的一个或多个。The one or more time series association measures may include one or more of covariance, autocorrelation function, partial autocorrelation function, spatiotemporal covariance function, spatiotemporal autocorrelation function, and spatiotemporal partial autocorrelation function.
根据所述一个或多个时间序列关联度量表示每个预测模型与所述时间序列之间的匹配的所述质量测量可以基于包括对所述预测模型中参数数量的处罚的准则。换句话说,所述质量测量表示每个预测模型根据所述一个或多个时间序列关联度量与所述时间序列匹配的程度。所述质量测量可以是自然数或百分比,表示预测模型和所述时间序列之间的重叠(匹配)程度。The quality measure representing a match between each prediction model and the time series according to the one or more time series association metrics may be based on criteria including a penalty for the number of parameters in the prediction model. In other words, the quality measure represents how well each predictive model fits the time series according to the one or more time series correlation measures. The quality measure may be a natural number or a percentage representing the degree of overlap (match) between the forecasting model and the time series.
确定所述质量测量表示预测模型根据所述一个或多个时间序列关联度量与所述时间序列之间的匹配程度可以包括:将所述一个或多个时间序列关联度量的统计属性相组合,并确定所述预测模型与由此产生的时间序列匹配的统计似然。换句话说,每个模型都将提供时间序列的预测。模型的好坏取决于质量测量,质量测量反过来可能取决于与所述模型相关的对应统计似然。具体来说,模型“更接近”实时序列的似然越高,因此质量测量的值就越高。另一方面,低似然是质量测量值低的指示。Determining how well the quality measure represents a prediction model according to the one or more time series correlation measures and the time series may include combining statistical properties of the one or more time series correlation measures, and A statistical likelihood of the predictive model being matched to the resulting time series is determined. In other words, each model will provide forecasts for the time series. The quality of a model depends on a measure of quality, which in turn may depend on the corresponding statistical likelihood associated with the model. Specifically, the higher the likelihood that the model is "closer" to the real-time sequence, the higher the value of the quality measure. On the other hand, a low likelihood is an indication of a low quality measure.
确定所述质量测量表示每个预测模型根据所述一个或多个时间序列关联度量与所述时间序列之间的匹配程度可以是基于贝叶斯信息准则(Bayesian InformationCriterion,BIC)。Determining that the quality measure represents how well each prediction model matches the time series according to the one or more time series correlation measures may be based on a Bayesian Information Criterion (BIC).
根据所述统计度量对所述子集中的所述预测模型进行聚类可以包括生成所述一个或多个统计度量与所述子集中的每个预测模型的值之间的映射关系。Clustering the predictive models in the subset according to the statistical metrics may include generating a mapping relationship between the one or more statistical metrics and values for each predictive model in the subset.
所述聚类可以是模糊聚类。The clusters may be fuzzy clusters.
选择所述子集中的一个预测模型可以是基于模糊干扰系统的。The selection of a predictive model in the subset may be based on a fuzzy interference system.
所述模糊干扰系统可以使用实现从所述聚类生成的if-then规则的一阶逻辑语句。The fuzzy interference system may use first-order logic statements implementing if-then rules generated from the clusters.
步骤(a)至(f)可以在时间序列事件的滑动窗口上连续执行。Steps (a) to (f) can be performed continuously over a sliding window of time series events.
所述时间序列可以是多维时间序列。The time series may be a multidimensional time series.
第二方面提供了一种用于动态选择时间序列事件的预测模型的系统,其中,所述系统包括:统计逻辑,用于为窗口中的多个事件生成一个或多个统计度量,其中,所述窗口包括一系列时间序列事件;关联逻辑,用于为所述窗口中的所述多个事件生成一个或多个时间序列关联度量;模型搜索逻辑,用于根据质量测量从多个预测模型中选择预测模型的子集,其中,所述质量测量表示每个预测模型根据所述一个或多个时间序列关联度量与所述时间序列之间的匹配程度;聚类逻辑,用于根据所述统计度量,对所述子集中的所述预测模型进行聚类;控制逻辑,用于根据所述预测模型的聚类和所述统计度量,选择所述子集中的一个预测模型;预测逻辑,用于使用所选择的预测模型从所述窗口中的所述多个事件实时生成预测输出。A second aspect provides a system for dynamically selecting a prediction model for time series events, wherein the system includes statistical logic for generating one or more statistical measures for a plurality of events in a window, wherein the the window includes a series of time series events; correlation logic for generating one or more time series correlation metrics for the plurality of events in the window; model search logic for extracting data from a plurality of prediction models based on quality measures selecting a subset of forecasting models, wherein the quality measure represents how well each forecasting model matches the time series according to the one or more time series correlation measures; clustering logic for metrics, for clustering the prediction models in the subset; control logic for selecting a prediction model in the subset according to the clustering of the prediction models and the statistical measure; prediction logic for A prediction output is generated in real-time from the plurality of events in the window using the selected prediction model.
可以提供用于执行本文所述的方法的计算机程序代码。可以提供一种非瞬时性计算机可读存储介质,所述非瞬时性计算机可读存储介质上存储有计算机可读指令,当在计算机系统处执行时,使计算机系统执行本文所述的方法。Computer program code for performing the methods described herein may be provided. A non-transitory computer-readable storage medium may be provided having computer-readable instructions stored thereon that, when executed at a computer system, cause the computer system to perform the methods described herein.
上述特征可以适当地组合,这对技术人员而言是显而易见的,并且可以与本文描述的示例的任何方面组合。The above features may be combined as appropriate, as will be apparent to the skilled person, and may be combined with any aspect of the examples described herein.
附图说明Description of drawings
现在参考附图详细地描述示例,其中:Examples are now described in detail with reference to the accompanying drawings, in which:
图1为动态选择用于对数据流进行时间序列预测的预测模型的系统示意图;1 is a schematic diagram of a system for dynamically selecting a forecasting model for performing time series forecasting on a data stream;
图2为说明窗口特征运算计算的典型方法的示意图;FIG. 2 is a schematic diagram illustrating a typical method of window feature operation calculation;
图3为动态选择用于对数据流进行时间序列预测的预测模型的系统的示例性实现方式的框图;3 is a block diagram of an exemplary implementation of a system for dynamically selecting a forecasting model for time-series forecasting of a data stream;
图4为由图3的统计逻辑执行的窗口处理和数据流量编排的示意图;4 is a schematic diagram of window processing and data traffic orchestration performed by the statistical logic of FIG. 3;
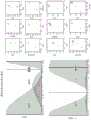
图5是示例模型的自相关函数、似然函数、AIC和BIC的示意图;Figure 5 is a schematic diagram of the autocorrelation function, likelihood function, AIC and BIC of an example model;
图6为根据偏度、均值、标准偏差和峰度的三个示例性预测模型的聚类的示意图;6 is a schematic diagram of clustering according to three exemplary prediction models of skewness, mean, standard deviation, and kurtosis;
图7为图3的控制逻辑的高级操作的示意图;FIG. 7 is a schematic diagram of high-level operation of the control logic of FIG. 3;
图8为图3的控制逻辑的示例性实现方式的示意图;FIG. 8 is a schematic diagram of an exemplary implementation of the control logic of FIG. 3;
图9为图3的系统在一个实施例中的操作的示意图;Figure 9 is a schematic diagram of the operation of the system of Figure 3 in one embodiment;
图10为动态选择用于对数据流进行时间序列预测的预测模型的示例性方法的流程图;10 is a flowchart of an exemplary method of dynamically selecting a forecasting model for time-series forecasting of a data stream;
图11为使用图3的系统执行交通预测的示意图;FIG. 11 is a schematic diagram of performing traffic prediction using the system of FIG. 3;
图12为使用图3的系统执行污染浓度估计的示意图;12 is a schematic diagram of performing pollution concentration estimation using the system of FIG. 3;
图13为示例性计算设备的框图。13 is a block diagram of an exemplary computing device.
附图说明了各种示例。本领域技术人员将理解,附图中所示的元素边界(例如,框、框组或其它形状)代表边界的一个示例。在一些示例中,一个元素可以设计为多个元素,或者多个元素可以设计为一个元素。在适当的情况下,在整个附图中使用共同的参考数字来表示类似的特征。The figures illustrate various examples. Those skilled in the art will appreciate that element boundaries (eg, boxes, groups of boxes, or other shapes) shown in the figures represent one example of a boundary. In some examples, one element may be designed as multiple elements, or multiple elements may be designed as one element. Where appropriate, common reference numerals are used throughout the drawings to refer to like features.
具体实施方式Detailed ways
以下描述通过举例提出,以使本领域技术人员能够制作和使用本发明。本发明不限于本文所述的实施例,对所公开实施例的各种修改对本领域技术人员而言是显而易见的。实施例仅通过举例描述。The following description is presented by way of example to enable any person skilled in the art to make and use the present invention. The present invention is not limited to the embodiments described herein, and various modifications to the disclosed embodiments will be apparent to those skilled in the art. The embodiments are described by way of example only.
本文描述了实时动态地选择时间序列数据流的预测模型的方法和系统,它们使用机器学习技术和统计分析的组合。所述系统包括:统计逻辑,用于为窗口中的一组事件生成一个或多个统计度量;关联逻辑,用于为所述窗口中的事件生成一个或多个时间序列关联度量;模型搜索逻辑,用于根据质量测量从多个预测模型中选择预测模型的子集,所述质量测量表示每个所述预测模型根据所述一个或多个时间序列关联度量与所述时间序列之间的匹配程度(即,根据每个所述预测模型与时间序列之间的匹配程度);聚类逻辑,用于根据所述统计度量,对所述子集中的所述预测模型进行聚类;控制逻辑,用于根据所述预测模型的聚类和所述统计度量,选择所述子集中的一个预测模型;预测逻辑,用于使用所选择的预测模型从所述窗口中的所述多个事件实时生成预测输出。This paper describes methods and systems for dynamically selecting predictive models for time-series data streams in real-time, using a combination of machine learning techniques and statistical analysis. The system includes: statistical logic for generating one or more statistical measures for a set of events in a window; correlation logic for generating one or more time-series correlation measures for events in the window; model search logic , for selecting a subset of forecasting models from a plurality of forecasting models based on a quality measure representing a match between each of said forecasting models and said time series according to said one or more time series correlation measures degree (i.e., according to the degree of matching between each of the prediction models and the time series); clustering logic for clustering the prediction models in the subset according to the statistical measure; control logic, for selecting a predictive model in the subset based on the clustering of the predictive models and the statistical measure; predictive logic for generating in real time from the plurality of events in the window using the selected predictive model prediction output.
本文描述的系统和方法根据从传入事件生成的度量(例如,统计度量和时间序列关联度量)适应性地调整模型搜索参数以及模型。本文描述的系统和方法能够在输入数据流上进行低延迟优化的预测模型搜索,即使对于高速率的传入事件。The systems and methods described herein adaptively adjust model search parameters and models based on metrics generated from incoming events (eg, statistical metrics and time series correlation metrics). The systems and methods described herein enable low-latency optimized predictive model searches on input data streams, even for high rates of incoming events.
本文描述的系统和方法可以实时建模和预测高度异质的时间序列和非平稳的时空过程。本文描述的系统和方法还可以利用描述大规模现象的不同、非平稳、确定性时间序列之间的时空相关性。使用数据分布形状测量、时间序列关联度量和似然统计,本文描述的系统和方法可以找到最佳描述现象的模型的参数和结构配置。The systems and methods described herein can model and predict highly heterogeneous time series and non-stationary spatiotemporal processes in real time. The systems and methods described herein can also exploit spatiotemporal correlations between distinct, non-stationary, deterministic time series that describe large-scale phenomena. Using data distribution shape measures, time-series association measures, and likelihood statistics, the systems and methods described herein can find the parameter and structural configurations of models that best describe a phenomenon.
现在参考图3,示出了用于动态选择包括一系列事件304的时间序列数据流302的预测模型的示例性系统300。系统300可以由基于计算的设备实现,例如但不限于以下结合图13描述的基于计算的设备1300。例如,可以存在存储在其上的计算机可读存储介质上的计算机可读指令,当在基于计算的设备上执行时,使基于计算的设备实现图3的系统300。Referring now to FIG. 3, an
系统300用于一次处理数据流302的事件304的窗口306。如上文所述,窗口是关于时间或事件的逻辑序列的定界,包括边界内的事件。位于窗口306中的事件304通常随着时间的推移而变化,因为新事件到达并位于窗口的边界内,旧事件位于边界外并从窗口中删除。在一些情况下,如图3所示,窗口306可以是滑动窗口,包含或包括最近的N个事件,其中N是大于或等于2的整数。系统300可用于响应于触发器处理窗口中的事件。在某些情况下,触发器可能是窗口中事件的更改。如果窗口是滑动窗口,则触发器可以收到新事件。The
系统300包括:统计逻辑308,用于为窗口306中的多个事件生成一个或多个统计度量;关联逻辑310,用于为所述窗口306中的所述多个事件生成一个或多个时间序列关联度量;模型搜索逻辑312,用于根据每个预测模型根据所述一个或多个时间序列关联度量与所述时间序列之间的匹配程度,从多个预测模型中选择预测模型的子集;聚类逻辑308,用于根据所述统计度量,对所述子集中的所述预测模型进行聚类;控制逻辑310,用于根据所述预测模型的聚类和所述统计度量,选择所述子集中的一个预测模型;预测逻辑312,用于使用所选择的预测模型从所述窗口中的所述多个事件实时生成预测输出。
统计逻辑statistical logic
统计逻辑308也可以称为统计模块,用于在每个触发器处(例如,每次接收到新事件时)实时为窗口中的事件生成一个或多个统计度量。统计度量,也可以称为统计或统计度量,是一组数据的数学或统计描述。统计度量的示例包括但不限于标准偏差、均值/平均值、偏度、峰度和中心矩。统计度量可用于描述时间序列,因此可用于选择最佳建模或匹配时间序列的模型。如果时间序列的统计属性随着时间的推移而变化(例如,时间序列是非平稳的),定期测量或确定一个或多个统计度量有助于实时动态选择与当前时间序列最匹配的预测模型。
许多用于处理数据流的现有技术系统包括窗口操作符,该窗口操作符将窗口中的所有事件存储在存储器中,并且在每个触发器中处理所有事件(例如,对窗口中的事件执行窗口处理)。然而,数据流的预测系统通常使用大窗口大小(例如,具有数百万个事件),(i)需要大量的内存来存储所有事件;(ii)使得难以(基本上)实时(例如在下一个触发时刻或触发器之前)处理窗口中的所有事件,如图2所示。Many prior art systems for processing data streams include a window operator that stores all events in the window in memory and processes all events in each trigger (eg, performs a window handling). However, prediction systems for data streams typically use large window sizes (e.g. with millions of events), (i) require a large amount of memory to store all events; (ii) make it difficult to (substantially) real-time (e.g. at the next trigger time or before triggers) process all events in the window, as shown in Figure 2.
因此,在某些情况下,统计逻辑308可以用于使用滑动窗口上的累积/回退方法增量生成一个或多个统计度量,而不是每次(例如,从窗口中的所有事件)从头开始生成统计度量。当增量生成统计度量时,前一个统计度量(例如,前一个窗口实例的统计度量)用于生成新的统计度量(即,当前窗口实例的统计度量)。Thus, in some cases,
图4在402示出了统计逻辑308如何使用累积/回退方法增量生成窗口中事件的平均值的示例。从图4可以看出,时间t-1时窗口中的n个事件集的平均值

然后,可以根据等式(2)所示的时间t-1的平均值


这可以使用累积/回退方法来实现,当新事件xa添加到窗口时,对时间t+1时窗口中事件的数量n、总和s和平均值
n(t+1)=n(t)+1 (3)n(t+1)=n(t)+1 (3)
sn(t+1)=sn(t+1)+xa (4)sn (t+1)=sn (t+1)+xa (4)

当事件xr从窗口中删除时,对时间t+1时窗口中事件的数量n、总和s和平均值执行多个回退运算,如等式(6)、(7)和(8)所示:When an eventxr is removed from the window, perform multiple backoff operations on the number n, sum s, and average of events in the window at
n(t+1)=n(t+1)-1 (6)n(t+1)=n(t+1)-1 (6)
sn(t+1)=sn(t+1)-xr (7)sn (t+1)=sn (t+1)-xr (7)

在某些情况下,统计逻辑308可以用于在数据流量编排或架构中使用高速缓存存储器和第三方存储器,以支持统计度量的低延迟高吞吐量计算。如本领域技术人员所知,高速缓存存储器也可以称为中央处理器(central processing unit,CPU)存储器,高速缓存存储器是高速的(通常是静态随机存取存储器(static random access memory,SRAM)),CPU可以比常规随机存取存储器(random access memory,RAM)更快地访问。相比之下,第三方存储器更大,但数据存储速度较慢,例如,但不限于硬盘,硬盘通常离CPU更远。In some cases,
这种数据流量编排或架构的示例在图4的404中示出。在图4所示的示例中,数据流量架构包括回退高速缓存406和用于存储“热”事件(即,与统计度量的增量计算相关的事件,例如最近已添加到窗口和即将从窗口中删除的事件)的累积高速缓存408和第三方存储器410,例如硬盘驱动器,用于存储“冷”事件(即与统计矩阵的增量计算无关的事件,例如窗口中最近没有接收到的事件或很快会被删除的事件)。具体来说,累积高速缓存408在事件被添加到窗口时存储事件。当新事件被添加到累积高速缓存408时,累积高速缓存408中的最早事件被移动到第三方存储器410。累积高速缓存408中的新事件还可以触发累积事件(例如,可以触发待执行的等式(3)、(4)和(5)中的累积运算)。当新事件被添加到第三方存储器410时,第三方存储器410中的最早事件被移动到回退高速缓存406。当新事件被添加到回退高速缓存406时,回退高速缓存406中的最早事件从触发回退事件的回退高速缓存406中删除(例如,可以触发待执行的等式(6)、(7)和(8)中的回退运算)。因此,当事件是“热”事件(即与统计度量的增量计算相关)时,存储在高速缓存之一中,当事件是“冷”事件(即与统计度量的增量计算无关)时,存储在第三方存储器中。这样的数据流量编排或架构为高频输入数据流提供固定的资源分配。An example of such a data traffic orchestration or architecture is shown at 404 of FIG. 4 . In the example shown in Figure 4, the data traffic architecture includes a
示例性数据流量编排或架构还可以用于存储计数或频率信息412,该计数或频率信息412表示窗口中当前事件的数量。例如,如果事件是整数,则计数或频率信息可以表示当前窗口中“1”的数量和当前窗口中“2”的数量等。当新事件被添加到窗口时,以及当事件将从窗口中删除时,可以更新计数。例如,如图4所示为“情况2”,如果计数或频率信息如表1所示,当新事件“12”被添加到窗口时,则“12”的频率值递增到2,如表2所示。The exemplary data traffic schedule or architecture may also be used to store count or
表1Table 1
表2Table 2
在另一个示例中,如图4所示为“情况3”,如果当事件“1”从窗口中删除时,计数或频率信息如表2所示,则由于窗口中不存在其它“1”,所以“1”列被删除或清除,如表3所示。In another example, as shown in Figure 4 as "
表3table 3
在另一个示例中,如图4所示为“情况1”,如果当新事件“13”被添加到窗口时,计数或频率信息如表3所示,则由于窗口中原本没有“13”,所以为“13”添加新的一列,并将频率设置为1,如表4所示。In another example, as shown in Figure 4 for "
表4Table 4
在另一个示例中,如图4所示为“情况4”,如果当事件“2”从窗口中删除时,计数或频率信息如表4所示,则“2”的频率值从3递减到2,如表5所示。In another example, shown as "
表5table 5
在一些情况下,统计逻辑308可以包括低延迟、高吞吐量引擎,例如通过引用结合在本文中的申请人递交的申请号为PCT/EP2017/073956、标题为“流处理的系统和方法(ASYSTEM AND METHOD FOR STREAM PROCESSING)”的国际专利申请中描述的引擎,用于增量计算一个或多个统计度量。具体来说,PCT/EP2017/073956描述了全局特征提取器(GlobalFeature Extractor,GFE),它是用于特征提取的流运算符,能够以固定资源增量计算更新函数,但支持适应性优化,以进一步节省用于更新(例如,缓存机制)的热数据和用于中长期特征更新的冷数据存储器(例如,磁盘或第三方存储器)的资源。GFE通过优化的函数执行来实现这一目标,该函数旨在确保具有高传入事件速率的流的恒定响应时间。In some cases,
在某些情况下,如果有多个统计度量,则统计度量可以分层生成。例如,可以使用计数生成均值,可以使用均值生成标准偏差,并且可以通过使用封闭形式增量公式从标准偏差和均值生成峰度和偏度。这样可以提高统计逻辑308的效率。In some cases, if there are multiple statistical measures, statistical measures can be generated hierarchically. For example, counts can be used to generate mean, mean can be used to generate standard deviation, and kurtosis and skewness can be generated from standard deviation and mean by using closed-form incremental formulas. This may improve the efficiency of the
关联逻辑Associative logic
关联逻辑310也可以称为关联模块,用于在每个触发器处(例如,每次接收到新事件时)为窗口中的事件生成一个或多个时间序列关联度量。时间序列关联度量是一种将一组数据之间的关系描述为时间和/或空间函数的度量。示例性时间序列关联度量包括但不限于协方差(COV)、自相关函数(autocorrelation function,ACF)、部分自相关函数(partial autocorrelation function,PACF)、空间时间协方差(spatial temporalcovariance,STCOV)、时空自相关函数(spatiotemporal autocorrelation function,STACF)和时空部分自相关函数(spatiotemporal partial autocorrelation function,STPACF)。自相关性描述了近事件或观测比远观测更相似的趋势,STACF和STPACF分别描述了空间邻居之间时间序列数据的时空自相关性和部分自相关性。
时间序列关联度量通常用于为时间序列设计预测器,因此可用于为时间序列选择准确的预测模型。在数据流的时间序列关联度量随着时间的推移而变化的情况下,定期测量或确定一个或多个时间序列关联度量(例如,对于每个窗口实例)有助于动态选择准确进行时间序列预测的预测模型。Time series association measures are often used to design predictors for time series and thus can be used to select accurate forecasting models for time series. Periodically measuring or determining one or more time series correlation measures (e.g., for each window instance) facilitates dynamic selection for accurate time series forecasting in situations where time series correlation measures of a data stream change over time prediction model.
在某些情况下,关联逻辑310用于针对每个触发器生成ACF、STACF和STPACF。如本领域技术人员所知,ACF、STACF和STPACF可用于识别和测量迭代时空(space-time,ST)时间序列模型,例如但不限于ARIMA模型。具体而言,STACF计算时间滞后t下s阶邻居和0阶邻居之间的序列数据的时空自相关性,空间滞后的范围为从0到权重列表的长度(这是每个k阶邻居的权重矩阵的列表,第一个是标识),t的范围为从1到最大时间滞后。STPACF可以通过迭代求解增加时间滞后和空间滞后的Yule Walter等式来计算。应注意,如果部分自相关函数没有用足够的空间滞后计算,则识别可能会有偏差,因为Yule Walker等式对给定的最大空间滞后敏感。In some cases,
在某些情况下,关联逻辑310用于使用时间序列关联度量的理论定义来生成时间序列关联度量。可由关联逻辑310用于计算STCOV的众所周知的STCOV示例性理论定义如等式(9)所示:In some cases,

可由关联逻辑310用于计算STACF或STPACF的众所周知的STACF或STPACF示例性理论公式如等式(10)所示:A well-known exemplary theoretical formula for STACF or STPACF that may be used by

在某些情况下,关联逻辑310可以用于使用一个或多个启发式规则来从一个或多个时间序列关联度量确定模型搜索逻辑312将使用的参数来选择和参数化相关预测模型。例如,在一些情况下,关联逻辑310可以用于根据表6中所示的时间序列关联度量的形状确定所需预测模型的结构以及空间和时间顺序。例如,如果自回归(auto-regression,AR)模型合适,则ACF和PACF将各自具有特定的形状或图案。具体来说,如果AR模型合适,则ACF将具有减弱的无限阻尼指数和/或阻尼符号波的形状或模式,而PACF将具有在p滞后后截止的有限模式或形状。类似地,如果移动平均(moving average,MA)模型合适,则ACF和PACF将各自具有特定的形状或模式。具体来说,如果MA模型合适,则ACF将是有限的,并将在q滞后后截止,PACF将具有减弱的无限阻尼指数和/或阻尼符号波的形状或模式。类似地,如果自回归-移动平均(auto-regressive-moving average,ARMA)模型是合适的,则ACF和PACF将各自具有特定的形状和/或模式。具体来说,如果ARMA模型合适,则ACF和PACF将具有减弱的无限阻尼指数和/或阻尼符号波的形状。如表6所示,最大AR和MA阶数p和q可分别从PACF和ACF的截止值确定。In some cases,
表6Table 6

在一些情况下,关联逻辑310可以包括低延迟、高吞吐量引擎,例如通过引用结合在本文中的申请人递交的申请号为PCT/EP2017/073956、标题为“流处理的系统和方法(ASYSTEM AND METHOD FOR STREAM PROCESSING)”的国际专利申请中描述的引擎,用于增量计算一个或多个时间序列关联度量。In some cases,
模型搜索逻辑Model search logic
模型搜索逻辑312也可以称为模型搜索模块,用于根据由关联逻辑310计算的一个或多个时间序列关联度量,从多个预测模型中选择预测模型的子集。在某些情况下,模型搜索逻辑312可以用于从关联逻辑310中接收搜索参数,根据搜索参数来参数化合适的预测模型,然后根据每个预测模型与时间序列的匹配程度选择参数化的预测模型的子集。例如,如上文所述,关联逻辑310可以用于根据时间序列关联度量确定所需预测模型的结构以及空间和时间顺序。例如,可以从PACF和ACF的形状中选择所需结构(例如,AR、MA或ARMA),并且可以分别从PACF和ACF截止值中选择最大MA和AR阶数,该截止值可以提供给模型搜索逻辑312作为搜索参数。给定这些搜索参数(例如结构和阶数),模型搜索逻辑312估计具有所需结构的预测模型的参数。估计过程可以推断基础响应序列的残差,并通过最大似然将预测模型拟合到响应数据,以生成参数化的预测模型。质量度量表示拟合的质量,即预测模型与时间序列的匹配程度。然后,模型搜索逻辑312根据每个预测模型根据一个或多个时间序列关联度量与时间序列匹配的程度来选择参数化的预测模型的子集。
在某些情况下,模型搜索逻辑312用于根据基于所述一个或多个时间序列关联度量的似然度量,确定每个参数化的预测模型与时间序列的匹配程度。如上文所述,许多用于(非流)时间序列自动模型选择的已知系统使用标准预测或预测度量或测量,例如但不限于均方根误差(Root Mean Squared Error,RMSE)或平均绝对百分比误差(Mean AbsolutePercentage Error,MAPE),但是,当来自两个模型的点预报(即预测)相同时,这些度量无法在误差类型之间进行选择。但是,基于似然而不是一步预报的度量能够在错误类型之间进行选择。In some cases,
在某些情况下,模型的似然度量X可以根据等式(11)计算,其中,L是模型的最大化对数似然目标函数:In some cases, the model's likelihood metric X can be calculated according to equation (11), where L is the model's maximizing log-likelihood objective function:

其中,in,

在某些情况下,模型搜索逻辑312用于根据包括对预测模型中参数数量的处罚的似然度量,确定多个预测模型中的每个预测模型与时间序列的匹配程度。当将模型拟合到时间序列时,可以通过添加参数来增大似然性,但这样做可能会导致过拟合。如本领域技术人员所知,过拟合是产生与一组数据太接近或精确对应的模型,使得难以可靠地准确预测未来事件或数据点。因此,使用处罚参数数量的似然度量显著降低了选择过拟合模型的风险。施加处罚的似然度量包括但不限于赤池信息准则(Akaike Information Criterion,AIC)和贝叶斯信息准则(Bayesian Information Criterion,BIC)。In some cases,
AIC从信息熵的角度来比较模型,通过Kullback-Leibler散度来衡量。给定模型的AIC可根据等式(13)根据对数似然L计算,其中,k是模型中参数的数量:AIC compares models in terms of information entropy, measured by the Kullback-Leibler divergence. The AIC for a given model can be calculated from the log-likelihood L according to equation (13), where k is the number of parameters in the model:

BIC也可称为西沃兹信息准则(Schwarz Information Criterion),与AIC密切相关。BIC从决策理论的角度来比较模型,以预期损失衡量。给定模型的BIC可根据等式(14)计算,其中,k是模型中参数的数量,N是数据点的数量:BIC can also be called Schwarz Information Criterion (Schwarz Information Criterion), which is closely related to AIC. BIC compares models from a decision theory perspective, as measured by expected loss. The BIC for a given model can be calculated according to equation (14), where k is the number of parameters in the model and N is the number of data points:

BIC是对特定贝叶斯设置下模型后验概率为真的函数的估计,因此BIC越低,模型就越有可能成为真模型。由于BIC中的处罚项较大,BIC可能更擅长确保不选择过拟合模型。BIC还可以提供关于模型的有用信息,而不管预测模型的类型如何。The BIC is an estimate of the function that the model's posterior probability is true under a specific Bayesian setting, so the lower the BIC, the more likely the model is to be true. Due to the larger penalty term in BIC, BIC may be better at ensuring that an overfit model is not selected. BIC can also provide useful information about the model, regardless of the type of predictive model.
在某些情况下,可以增量生成AIC或BIC。具体来说,在某些情况下,可以通过使用雅可比(Jacobian)自由迭代估计过程增量计算对数似然,该估计过程不执行典型的(非增量)成本高的协方差矩阵计算。在其它情况下,可以使用基于神经网络的增量对数似然估计器增量计算对数似然,该估计器是基于小波的径向基函数网络。这种估计器类似于经典的径向基函数(radial basis function,RBF)网络,但径向基函数是多尺度小波和缩放函数。In some cases, AIC or BIC can be generated incrementally. Specifically, in some cases the log-likelihood can be computed incrementally by using a Jacobian free iterative estimation procedure that does not perform the typical (non-incremental) expensive covariance matrix computation. In other cases, the log-likelihood can be calculated incrementally using a neural network-based incremental log-likelihood estimator, which is a wavelet-based radial basis function network. This estimator is similar to a classical radial basis function (RBF) network, but the RBF is a multi-scale wavelet and scaling function.
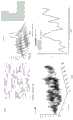
图5示出了示例性时间序列的示例性ACF、似然L以及AIC和BIC。在本示例中,ACF用于生成似然,似然用于生成AIC和/或BIC。Figure 5 shows an exemplary ACF, likelihood L, and AIC and BIC for an exemplary time series. In this example, the ACF is used to generate the likelihood, and the likelihood is used to generate the AIC and/or the BIC.
在一些情况下,模型搜索逻辑312可以用于根据时间序列关联度量选择与时间序列最匹配的W个预测模型,其中,W是大于或等于2的整数。在某些情况下,模型搜索逻辑312可以用于选择具有最低BIC的三个预测模型。然而,对于本领域技术人员来说,这只是一个示例,并且可以选择其它数量的预测模型。In some cases, the
聚类逻辑clustering logic
聚类逻辑314也可以称为聚类模块,用于根据由统计逻辑308生成的统计度量,对由模型搜索逻辑312选择的预测模型的子集进行聚类。如本领域技术人员所知,聚类或聚类分析是以使同一组中的对象彼此比其它组中的对象更相似的方式对一组对象进行分组的过程。聚类逻辑314用于根据统计度量对所选择的预测模型子集进行聚类或分组,使得描述统计度量的某个值范围的所有模型都将在同一聚类中。因此,每个聚类根据预测模型代表统计度量的程度对预测模型进行分组。通过执行聚类,聚类逻辑308有效地学习统计度量和预测模型的选定子集之间的映射。聚类逻辑308可以输出描述预测模型的选定子集如何被聚类的一个或多个聚类配置参数或度量。
在某些情况下,模糊聚类用于聚类预测模型的子集。在非模糊聚类中,也可以称为硬聚类,数据被划分为不同的聚类,其中每个数据点只能属于一个聚类。相反,在模糊聚类(可称为软聚类)中,数据点可能属于多个聚类。由于在模型选择中,技术方案可能不是唯一的(例如,多个模型的模型参数和结构可能相同),因此可以实现模糊聚类,以便数据点可以属于多个聚类。In some cases, fuzzy clustering is used to cluster subsets of predictive models. In non-fuzzy clustering, also known as hard clustering, the data is divided into different clusters, where each data point can only belong to one cluster. In contrast, in fuzzy clustering (which can be called soft clustering), data points may belong to multiple clusters. Since in model selection, technical solutions may not be unique (for example, model parameters and structures of multiple models may be the same), fuzzy clustering can be implemented so that data points can belong to multiple clusters.
在某些情况下,聚类逻辑308可以用于使用模糊-C均值(Fuzzy-C Mean,FCM)聚类算法对预测模型的子集进行聚类。如本领域技术人员所知,FCM算法是一种迭代算法,其通过将隶属度分配给数据点来工作,该隶属度表示数据点属于每个聚类的程度。在FCM中,隶属度以数据点与聚类中心或质心之间的距离为基础。在FCM中,聚类的中心或质心是所有点的均值,由其属于聚类的隶属度加权。该算法首先生成隶属度的初始集(例如,矩阵),并从中计算初始模糊聚类中心。在每次迭代中,聚类中心和隶属度都会更新。目标函数是为聚类找到最佳位置。当达到最大迭代次数或两次连续迭代之间的目标函数改进小于指定的最小改进量时,迭代过程停止。在这些情况下,由聚类逻辑308输出的聚类配置参数或度量可以包括每个数据点(即,每个统计度量)和聚类中心的隶属度。In some cases,
例如,聚类逻辑308可以用于输出U和C。U是包括n_clusters个行和data_len个列的模糊分割矩阵,其中,n_clusters是模型的数量,data_len是统计度量的数量。元素U(i,j)表示第j个统计度量在第i个聚类中(即在第i个模型中)的隶属度。对于给定的统计度量,所有聚类的隶属值之和为1。C是聚类中心矩阵,包括被聚类数据的每个维度的n_clusters个行和一个列。每个元素都包含对应统计度量的聚类中心的坐标。对于本领域的技术人员而言显而易见的是,这只是一个示例,并且可以使用其它聚类算法对预测模型的选定子集进行聚类。For example,
图6中示出了当聚类逻辑314实现FCM聚类并接收偏度、峰度、标准偏差(std)和平均值作为统计度量时,聚类逻辑314如何聚类三个预测模型的示例性集的示例。图6显示随着统计度量的改变,聚类分配也会改变。具体来说,从图6可以看出,在时间t时,样品(偏度、峰度、std和平均值)在聚类1和聚类3(即,模型1或模型3)中,在时间t+1时,样品(偏度、峰度、标准偏差和平均值)在聚类1和聚类2中(即,模型1或模型2)中。An example of how the
控制逻辑control logic
控制逻辑316也可以称为控制模块或自动模型选择器,用于根据预测模型的聚类和统计度量(实时)选择子集中的预测模型之一。换句话说,控制逻辑316用于根据聚类逻辑314的输出(例如,描述所选择的模型子集如何根据统计度量进行聚类的信息)选择用于数据流的时间序列预测的所选择的预测模型子集中的一个和统计逻辑308的输出(例如,一个或多个统计度量)。图7示出了控制逻辑316的高级表示。The
在某些情况下,控制逻辑316可以用于将聚类逻辑314的输出(例如,隶属度/模糊分割矩阵)转换为一组规则(例如,if-then规则),所述规则描述如何从统计度量中选择最佳预测模型,以及如何根据所述规则集从统计度量中选择所述子集中的预测模型之一。规则集可以使用在聚类中提取的隶属函数,并可以根据聚类中心和分割矩阵参数化。In some cases,
在某些情况下,控制逻辑316用于使用模糊推理系统/控制器(Fuzzy InferenceSystem/Controller,FIS/FIC)来选择最适合由一个或多个统计度量所描述的时间序列的预测模型。如本领域技术人员所知,模糊推理是使用模糊逻辑制定从给定输入到输出的映射的过程。然后,映射提供了一个基础,从中可以做出决策,或识别模式。图8中示出了用于实现控制逻辑316的示例性FIS/FIC架构。在这个示例中,控制逻辑316包括模糊化逻辑802、推理引擎804和去模糊化逻辑806。模糊化逻辑802接收由统计逻辑308生成的一个或多个统计度量(例如,偏斜、峰度、标准偏差(std)和均值),并对它们进行模糊化。如本领域技术人员所知,模糊化是将实际标量值(即清晰值)改变为模糊值的过程。这可以通过不同的模糊器(也可以称为隶属函数)来实现。隶属函数的一个示例是高斯曲线。推理引擎804接收由模糊化逻辑802生成的模糊统计度量,并使用一组规则808来生成模糊输出,该模糊输出表示所选择的预测模型子集中的哪个最匹配统计度量。In some cases, the
规则集808从聚类逻辑814的输出(例如,隶属值表示值和聚类中心之间的距离)生成。在某些情况下,规则集808的形式可以是制定IF-THEN规则的一阶逻辑(First-Order-Logic,FOL)语句。图8中示出了示例性规则集810。去模糊逻辑806用于将推理引擎804生成的模糊输出转换为表示与统计度量最匹配的预测模型的清晰输出。The rule set 808 is generated from the output of the clustering logic 814 (eg, membership values represent distances between values and cluster centers). In some cases, the rule set 808 may be in the form of a First-Order-Logic (FOL) statement that formulates IF-THEN rules. An example rule set 810 is shown in FIG. 8 .
控制逻辑316用于连续操作。由于描述性度量(例如,统计度量和时间序列关联度量)的计算实时更新,因此根据其调整模型之间的分离边界也连续发生,有助于适应性地和动态地选择与时间序列最匹配的模型。
总体概述General overview
现在参考图9,提供了上述系统300的逻辑308、310、312、316、318如何在系统运行时协同工作,以提供用于数据流902的时间序列预测的预测模型的自动实时选择。具体来说,如图9所示,统计逻辑308和关联逻辑310生成(在904中)一个或多个统计度量(例如,斜度、峰度、std和均值)以及数据流上递增的一个或多个时间序列关联度量(例如,STACF和STPACF);模型搜索逻辑312根据时间序列关联度量参数化预测模型,并根据BIC或AIC等信息准则选择与时间序列最匹配的参数化的预测模型的子集。在906中,聚类逻辑314根据例如FCM聚类计算统计度量和参数化的预测模型的子集的聚类隶属度,并在数据流前进时输出聚类度量,例如,模糊分割矩阵和聚类中心。在908中,控制逻辑316使用模糊推理系统或控制器,根据聚类度量和统计度量选择参数化的预测模型之一。然后,所选的参数化预测模型用于根据窗口中的事件生成数据流的预测。Referring now to FIG. 9 , there is provided how the
方法method
现在参考图10,示出了用于动态选择预测模型以对包括可由图3的系统300实现的一系列事件的数据流执行时间序列预测的示例性方法1000。时间序列数据流可以是非平稳的、确定性的和/或多维的。方法1000可以由基于计算的设备实现,例如但不限于以下结合图13描述的基于计算的设备1300。例如,可以具有非瞬时性计算机可读存储介质,所述非瞬时性计算机可读存储介质上存储有计算机可读指令,当在基于计算的设备上执行所述计算机可读指令时,使得基于计算的设备实现图10的系统1000。Referring now to FIG. 10 , an
方法1000开始于步骤1002和1004,分别为窗口中的事件集生成一个或多个统计度量,以及为窗口中的事件集生成一个或多个时间序列关联度量。统计度量描述窗口中事件的数学统计信息或属性。示例性统计度量包括但不限于窗口中事件的偏度、峰度、标准偏差和均值。时间序列关联度量将窗口中事件之间的关系描述为时间和/或空间的函数。时间序列关联度量的示例包括但不限于协方差、自相关函数、部分自相关函数、时空协方差函数、时空自相关函数和时空部分自相关函数。在某些情况下,一个或多个统计度量和/或一个或多个时间序列关联度量是增量生成的(即,根据度量的先前值)。The
在步骤1006中,根据每个预测模型根据所述一个或多个时间序列关联度量与所述时间序列之间的匹配程度,从多个预测模型中选择预测模型的子集。在某些情况下,每个预测模型根据一个或多个时间序列关联度量与所述时间序列之间的匹配程度是基于包括基于所述预测模型中参数数量的处罚的准则。在某些情况下,预测模型根据所述一个或多个时间序列关联度量与所述时间序列之间的匹配程度包括:将所述一个或多个时间序列关联度量的统计属性相组合,并确定所述预测模型与由此产生的时间序列匹配的统计似然。包括基于参数数量的处罚的似然准则的示例包括但不限于赤池信息准则(AkaikeInformation Criterion,AIC)和贝叶斯信息准则(Bayesian Information Criterion,BIC)。In
在步骤1008中,根据一个或多个统计度量对子集中的预测模型进行聚类。在某些情况下,根据所述统计度量对所述子集中的所述预测模型进行聚类包括生成所述一个或多个统计度量与所述子集中的每个预测模型的值之间的映射关系。在某些情况下,聚类是模糊(或软)聚类。In
在步骤1010中,根据所述预测模型的子集的聚类和所述统计度量,选择所述子集中的一个预测模型。在某些情况下,选择所述子集中的一个预测模型可以是基于模糊干扰系统的。上面描述了模糊干扰系统的一个示例。在这些情况下,所述模糊干扰系统可以使用实现从所述聚类生成的if-then规则的一阶逻辑语句。In
在步骤1012中,使用所选择的预测模型从所述窗口中的所述多个事件实时生成预测输出。In
在某些情况下,步骤1002至1012可以迭代地重复用于窗口的后续实例,以便根据数据流的当前特征适应性地选择预测模型。例如,在一些情况下,步骤1002至1012可以在时间序列事件的滑动窗口上连续执行。In some cases,
测试数据Test Data
上述用于动态选择用于对数据流执行时间序列预测的预测模型的系统300已经在几个现实世界场景中测试,其中生成数据流的过程是未知的(即,没有关于如何生成数据的信息)并且存在高非线性时间序列演变中的影响(指示非平稳和确定性时间序列)。The above-described
现在参考图11,示出了上述系统300用于交通数据预测时的输出(即预测值)。交通拥堵对城市基础设施构成了严重挑战,也因交通浪费时间而影响城市人民的社会经济生活。许多已知的预测系统未能准确预测交通流量,因为它们未能充分利用车辆的拓扑结构和内在时间流量及其相关性。Referring now to FIG. 11, the output (ie, predicted value) of the above-described
测试的目的是在过去20天内记录的十字路口A、C、D、E、F和H的交通概图的情况下,提前一整天生成通过十字路口或交叉口A的交通预测,如图11所示。对于测试,系统300用于从一组时空自动回归移动平均(Spatio-Temporal Auto Regressive Moving Average,STARMA)系列模型中选择,包括:STAR、STMA和STARMA。系统300能够通过利用城市中多个连接的十字路口之间的时空相关性自动选择最佳预测模型结构及其参数。The purpose of the test is to generate a traffic forecast through an intersection or intersection A one day in advance, given the traffic profiles of intersections A, C, D, E, F, and H recorded in the past 20 days, as shown in Figure 11. shown. For testing, the
从图11可以看出,系统300能够根据MAPE找到和参数化最佳拟合模型,并将其用于在56个数据的数据集中显示从第30天开始的20天交通概图之后预测第51个数据,每天288次读数(即每5分钟一次读数)。As can be seen from Figure 11, the
现在参考图12,示出了上述系统300用于污染数据预测时的输出(即预测值)。据世界卫生组织(World Health Organization,WHO)估计,空气污染占总死亡率的很大一部分。Referring now to FIG. 12, the output (ie, predicted value) of the
测试的目的是根据8个站点过去590天记录的污染传感器读数,提前30天预测一个站点的污染传感器。对于测试,系统300用于从一组时空自动回归移动平均(Spatio-Temporal Auto Regressive Moving Average,STARMA)系列模型中选择,包括:STAR、STMA和STARMA。系统300能够通过利用测量气体(例如,SO2、NO2、O3)、气象(例如,温度、压力)和污染(例如,PME10、PM25)的多个站点的时空相关性自动选择最佳预测模型结构和其参数。The purpose of the test is to predict pollution sensors at a
从图12可以看出,系统300能够根据MAPE找到和参数化最佳拟合模型,并将该模型用于预测特定站点处的污染。As can be seen in Figure 12, the
示例性基于计算的设备Exemplary computing-based device
图13示出了示例性基于计算的设备1300的各种组件,所述基于计算的设备1300可以实现为计算和/或电子设备的任何形式,并且可以在其中实现本文描述的方法和系统的实施例。13 illustrates various components of an exemplary computing-based
基于计算的设备1300包括一个或多个处理器1302,可以是微处理器、控制器或任何其它合适类型的处理器,用于处理计算机可执行指令以控制设备的操作,以便动态地选择用于数据流的时间序列预测的预测模型。在一些示例中,例如,在使用片上系统架构的情况下,处理器1302可以包括一个或多个固定功能块(也称为加速器),所述固定功能块在硬件(而不是软件或固件)中实现用于验证数据转换流水线的硬件设计的方法的一部分。包括操作系统1304或任何其它合适的平台软件可以设置在基于计算的设备处,以使得应用软件能够在设备上执行。Computing-based
可以使用基于计算的设备1300可访问的任何计算机可读介质提供计算机可执行指令。计算机可读介质可以包括例如计算机存储介质,例如存储器1306和通信介质。计算机存储介质(即,非瞬时性机器可读介质),例如存储器1306,包括以任何方法或技术实现的易失性和非易失性、可移动和不可移动介质,用于存储信息,例如计算机可读指令,数据结构、程序模块或其它数据。计算机存储介质包括但不限于RAM、ROM、EPROM、EEPROM、闪存或其它存储技术、CD-ROM、数字通用磁盘(digital versatile disk,DVD)或其它光学存储器、磁带盒、磁带、磁盘存储器或其它磁性存储设备、或可以用来存储由计算设备访问的任何其它非传输介质。相反,通信介质可以在调制数据信号中包含计算机可读指令、数据结构、程序模块或其它数据,例如,载波或其它传输机制。如本文所定义,计算机存储介质不包括通信介质。虽然示出计算机存储介质(即,非瞬时性机器可读介质,例如存储器1306)在基于计算的设备1300中,但将理解,存储器可以被远程分布或定位并经由网络或其它通信链路访问(例如,使用通信接口1308)。Computer-executable instructions may be provided using any computer-readable medium accessible by computing-based
基于计算的设备1300还包括输入/输出控制器610,输入/输出控制器610用于将显示信息输出到显示设备1312,显示设备1312可以与基于计算的设备1300分开或集成到基于计算的设备1300。显示信息可以提供图形用户界面。输入/输出控制器1310还用于接收和处理来自一个或多个用户输入设备1314(例如鼠标或键盘)等设备的输入。此用户输入可用于启动方法或系统。在一个实施例中,如果显示设备1312是触敏显示设备,则显示设备1312还可以充当用户输入设备1314。输入/输出控制器1310还可以将数据输出到除了显示设备之外的设备,例如本地连接的打印设备(图13中未示出)。Computing-based
申请人在此单独公开本文所述的每一个体特征及两个或两个以上此类特征的任意组合。以本领域技术人员的普通知识,能够根据本说明书将此类特征或组合作为整体实现,而不考虑此类特征或特征的组合是否能解决本文所公开的任何问题。鉴于上文描述,可在本发明的范围内进行各种修改对本领域技术人员来说是显而易见的。Applicants hereby disclose each individual feature described herein individually and any combination of two or more such features. With the ordinary knowledge of those skilled in the art, such features or combinations can be implemented from this specification as a whole, regardless of whether such features or combinations of features solve any of the problems disclosed herein. Various modifications that can be made within the scope of the invention will be apparent to those skilled in the art in view of the foregoing description.
Claims (18)
Applications Claiming Priority (1)
| Application Number | Priority Date | Filing Date | Title |
|---|---|---|---|
| PCT/EP2019/053862WO2020164740A1 (en) | 2019-02-15 | 2019-02-15 | Methods and systems for automatically selecting a model for time series prediction of a data stream |
Publications (2)
| Publication Number | Publication Date |
|---|---|
| CN113366473Atrue CN113366473A (en) | 2021-09-07 |
| CN113366473B CN113366473B (en) | 2025-04-18 |
Family
ID=65516548
Family Applications (1)
| Application Number | Title | Priority Date | Filing Date |
|---|---|---|---|
| CN201980090455.8AActiveCN113366473B (en) | 2019-02-15 | 2019-02-15 | Method and system for automatically selecting a model for data stream time series forecasting |
Country Status (3)
| Country | Link |
|---|---|
| EP (1) | EP3899758A1 (en) |
| CN (1) | CN113366473B (en) |
| WO (1) | WO2020164740A1 (en) |
Families Citing this family (12)
| Publication number | Priority date | Publication date | Assignee | Title |
|---|---|---|---|---|
| CN112180899B (en)* | 2020-09-30 | 2021-08-24 | 山东科技大学 | A System State Estimation Method under Intermittent Abnormal Measurement Detection |
| CN112487361B (en)* | 2020-11-26 | 2024-04-02 | 南京航空航天大学 | Sector short-time traffic flow prediction method based on ARIMA and wavelet transformation |
| CN112906941B (en)* | 2021-01-21 | 2022-12-06 | 哈尔滨工程大学 | Forecasting method and system for dynamic related air quality time series |
| CN113065690B (en)* | 2021-03-19 | 2023-06-30 | 浙江财经大学 | Traffic prediction method and device |
| CN113518365B (en)* | 2021-04-29 | 2023-11-17 | 北京红山信息科技研究院有限公司 | Data association method, device, server and storage medium |
| CN113660237B (en)* | 2021-08-10 | 2023-04-07 | 和中通信科技有限公司 | Industrial Internet data flow abnormity detection method based on dynamic sliding window, memory and processor |
| CN115509186B (en)* | 2022-09-19 | 2025-07-25 | 深圳市英维克信息技术有限公司 | Event configuration method, device and system of embedded equipment, upper computer and medium |
| US20240202287A1 (en)* | 2022-12-15 | 2024-06-20 | Sap Se | Cyclic pattern detection and prediction execution |
| GB2631714A (en)* | 2023-07-10 | 2025-01-15 | Bae Systems Plc | Controlling a system using an artificial neural network |
| CN116663753B (en)* | 2023-08-01 | 2023-10-20 | 江西省供销江南物联网有限公司 | Cold chain food distribution prediction method and system |
| CN116757337B (en)* | 2023-08-18 | 2023-11-21 | 克拉玛依市鼎泰建设(集团)有限公司 | House construction progress prediction system based on artificial intelligence |
| CN117612379B (en)* | 2024-01-24 | 2024-03-29 | 山东华夏高科信息股份有限公司 | Intelligent traffic flow prediction method and system |
Citations (5)
| Publication number | Priority date | Publication date | Assignee | Title |
|---|---|---|---|---|
| US20070094061A1 (en)* | 2005-10-12 | 2007-04-26 | Jianying Hu | Method and system for predicting resource requirements for service engagements |
| US20070299798A1 (en)* | 2006-06-23 | 2007-12-27 | Akihiro Suyama | Time series data prediction/diagnosis apparatus and program thereof |
| CN103440368A (en)* | 2013-08-12 | 2013-12-11 | 上海交通大学 | A multi-model dynamic soft sensor modeling method |
| US20160062950A1 (en)* | 2014-09-03 | 2016-03-03 | Google Inc. | Systems and methods for anomaly detection and guided analysis using structural time-series models |
| US20160217384A1 (en)* | 2015-01-26 | 2016-07-28 | Sas Institute Inc. | Systems and methods for time series analysis techniques utilizing count data sets |
- 2019
- 2019-02-15WOPCT/EP2019/053862patent/WO2020164740A1/ennot_activeCeased
- 2019-02-15EPEP19706501.4Apatent/EP3899758A1/enactivePending
- 2019-02-15CNCN201980090455.8Apatent/CN113366473B/enactiveActive
Patent Citations (5)
| Publication number | Priority date | Publication date | Assignee | Title |
|---|---|---|---|---|
| US20070094061A1 (en)* | 2005-10-12 | 2007-04-26 | Jianying Hu | Method and system for predicting resource requirements for service engagements |
| US20070299798A1 (en)* | 2006-06-23 | 2007-12-27 | Akihiro Suyama | Time series data prediction/diagnosis apparatus and program thereof |
| CN103440368A (en)* | 2013-08-12 | 2013-12-11 | 上海交通大学 | A multi-model dynamic soft sensor modeling method |
| US20160062950A1 (en)* | 2014-09-03 | 2016-03-03 | Google Inc. | Systems and methods for anomaly detection and guided analysis using structural time-series models |
| US20160217384A1 (en)* | 2015-01-26 | 2016-07-28 | Sas Institute Inc. | Systems and methods for time series analysis techniques utilizing count data sets |
Non-Patent Citations (3)
| Title |
|---|
| 余辉;袁晶;于旭耀;张力新;陈文亮;: "基于ARMAX的PM_(2.5)小时浓度跟踪预测模型", 天津大学学报(自然科学与工程技术版), no. 01* |
| 徐文远;邓春瑶;刘宝义;曲堂超;: "公交客运量的时间序列预测模型", 辽宁工程技术大学学报(自然科学版), no. 12, 15 December 2014 (2014-12-15)* |
| 朱文俊;任丽佳;盛戈;江秀臣;胡玉峰;: "基于ARIMA的输电线路容量分析及预测", 电力系统及其自动化学报, no. 03, 15 June 2010 (2010-06-15)* |
Also Published As
| Publication number | Publication date |
|---|---|
| CN113366473B (en) | 2025-04-18 |
| WO2020164740A1 (en) | 2020-08-20 |
| EP3899758A1 (en) | 2021-10-27 |
Similar Documents
| Publication | Publication Date | Title |
|---|---|---|
| CN113366473B (en) | Method and system for automatically selecting a model for data stream time series forecasting | |
| Jiang et al. | Holt–Winters smoothing enhanced by fruit fly optimization algorithm to forecast monthly electricity consumption | |
| Luo et al. | An algorithm for traffic flow prediction based on improved SARIMA and GA | |
| Liu et al. | A rolling grey model optimized by particle swarm optimization in economic prediction | |
| CN116596044B (en) | Power generation load prediction model training method and device based on multi-source data | |
| CN112640380A (en) | Apparatus and method for anomaly detection of an input stream of events | |
| CN118982255A (en) | An environmental data analysis system based on cloud computing | |
| US11599746B2 (en) | Label shift detection and adjustment in predictive modeling | |
| WO2015166637A1 (en) | Maintenance period determination device, deterioration estimation system, deterioration estimation method, and recording medium | |
| JP2021184139A (en) | Management computer, management program, and management method | |
| US12306166B2 (en) | Self-adaptive optimization framework for water quality prediction | |
| CN113408659A (en) | Building energy consumption integrated analysis method based on data mining | |
| Zhang et al. | Spatio-temporal contrastive learning-based adaptive graph augmentation for traffic flow prediction | |
| CN116975665A (en) | Building load prediction model training method, building load prediction method and device | |
| CN117786963A (en) | High-dimensional kernel density estimation remaining life prediction method based on multi-source information fusion | |
| Ponmalar et al. | Machine learning based network traffic predictive analysis | |
| CN111815075A (en) | A forecasting method of traffic travel demand under major public health events | |
| Orouskhani et al. | Fuzzy adaptive cat swarm algorithm and Borda method for solving dynamic multi‐objective problems | |
| Rahman et al. | Uncertainty-aware traffic prediction using attention-based deep hybrid network with bayesian inference | |
| CN119251014A (en) | Water pollution tracing method based on graph attention neural network | |
| CN118709448A (en) | Dynamic simulation optimization model construction method based on digital twin | |
| Aakash et al. | Forecasting of Novel Corona Virus Disease (Covid‐19) Using LSTM and XG Boosting Algorithms | |
| US20230342664A1 (en) | Method and system for detection and mitigation of concept drift | |
| Werth et al. | Surrogate-assisted microscopic traffic simulation-based optimisation of routing parameters | |
| JP6233432B2 (en) | Method and apparatus for selecting mixed model |
Legal Events
| Date | Code | Title | Description |
|---|---|---|---|
| PB01 | Publication | ||
| PB01 | Publication | ||
| SE01 | Entry into force of request for substantive examination | ||
| SE01 | Entry into force of request for substantive examination | ||
| TA01 | Transfer of patent application right | ||
| TA01 | Transfer of patent application right | Effective date of registration:20220301 Address after:550025 Huawei cloud data center, jiaoxinggong Road, Qianzhong Avenue, Gui'an New District, Guiyang City, Guizhou Province Applicant after:Huawei Cloud Computing Technologies Co.,Ltd. Address before:518129 Bantian HUAWEI headquarters office building, Longgang District, Guangdong, Shenzhen Applicant before:HUAWEI TECHNOLOGIES Co.,Ltd. | |
| GR01 | Patent grant | ||
| GR01 | Patent grant |