CN113094884A - Power distribution network user electricity stealing behavior diagnosis method based on three-layer progressive analysis model - Google Patents
Power distribution network user electricity stealing behavior diagnosis method based on three-layer progressive analysis modelDownload PDFInfo
- Publication number
- CN113094884A CN113094884ACN202110348972.XACN202110348972ACN113094884ACN 113094884 ACN113094884 ACN 113094884ACN 202110348972 ACN202110348972 ACN 202110348972ACN 113094884 ACN113094884 ACN 113094884A
- Authority
- CN
- China
- Prior art keywords
- user
- power
- electricity
- daily
- stealing
- Prior art date
- Legal status (The legal status is an assumption and is not a legal conclusion. Google has not performed a legal analysis and makes no representation as to the accuracy of the status listed.)
- Pending
Links
Images


Classifications
- G—PHYSICS
- G06—COMPUTING OR CALCULATING; COUNTING
- G06F—ELECTRIC DIGITAL DATA PROCESSING
- G06F30/00—Computer-aided design [CAD]
- G06F30/20—Design optimisation, verification or simulation
- G—PHYSICS
- G06—COMPUTING OR CALCULATING; COUNTING
- G06Q—INFORMATION AND COMMUNICATION TECHNOLOGY [ICT] SPECIALLY ADAPTED FOR ADMINISTRATIVE, COMMERCIAL, FINANCIAL, MANAGERIAL OR SUPERVISORY PURPOSES; SYSTEMS OR METHODS SPECIALLY ADAPTED FOR ADMINISTRATIVE, COMMERCIAL, FINANCIAL, MANAGERIAL OR SUPERVISORY PURPOSES, NOT OTHERWISE PROVIDED FOR
- G06Q10/00—Administration; Management
- G06Q10/06—Resources, workflows, human or project management; Enterprise or organisation planning; Enterprise or organisation modelling
- G06Q10/063—Operations research, analysis or management
- G06Q10/0639—Performance analysis of employees; Performance analysis of enterprise or organisation operations
- G06Q10/06393—Score-carding, benchmarking or key performance indicator [KPI] analysis
- G—PHYSICS
- G06—COMPUTING OR CALCULATING; COUNTING
- G06Q—INFORMATION AND COMMUNICATION TECHNOLOGY [ICT] SPECIALLY ADAPTED FOR ADMINISTRATIVE, COMMERCIAL, FINANCIAL, MANAGERIAL OR SUPERVISORY PURPOSES; SYSTEMS OR METHODS SPECIALLY ADAPTED FOR ADMINISTRATIVE, COMMERCIAL, FINANCIAL, MANAGERIAL OR SUPERVISORY PURPOSES, NOT OTHERWISE PROVIDED FOR
- G06Q50/00—Information and communication technology [ICT] specially adapted for implementation of business processes of specific business sectors, e.g. utilities or tourism
- G06Q50/06—Energy or water supply
- G—PHYSICS
- G06—COMPUTING OR CALCULATING; COUNTING
- G06F—ELECTRIC DIGITAL DATA PROCESSING
- G06F2111/00—Details relating to CAD techniques
- G06F2111/10—Numerical modelling
Landscapes
- Business, Economics & Management (AREA)
- Engineering & Computer Science (AREA)
- Human Resources & Organizations (AREA)
- Theoretical Computer Science (AREA)
- Economics (AREA)
- Physics & Mathematics (AREA)
- Strategic Management (AREA)
- General Physics & Mathematics (AREA)
- Tourism & Hospitality (AREA)
- Health & Medical Sciences (AREA)
- Marketing (AREA)
- Development Economics (AREA)
- Educational Administration (AREA)
- Entrepreneurship & Innovation (AREA)
- General Business, Economics & Management (AREA)
- Game Theory and Decision Science (AREA)
- Quality & Reliability (AREA)
- Operations Research (AREA)
- Public Health (AREA)
- Water Supply & Treatment (AREA)
- General Health & Medical Sciences (AREA)
- Primary Health Care (AREA)
- Computer Hardware Design (AREA)
- Evolutionary Computation (AREA)
- Geometry (AREA)
- General Engineering & Computer Science (AREA)
- Management, Administration, Business Operations System, And Electronic Commerce (AREA)
Abstract
Description
Translated fromChinese技术领域technical field
本发明涉及电力系统配电网线损管控领域,尤其涉及一种基于三层递进式分析模型的配电网用户窃电行为诊断方法。The invention relates to the field of power system distribution network line loss management and control, in particular to a method for diagnosing electricity stealing behavior of distribution network users based on a three-layer progressive analysis model.
背景技术Background technique
近年来,电力为中国经济社会发展提供了越来越多的支撑作用,同时窃电行为也愈加严重,不仅影响了用户用电质量,还可能危及电网安全运行。此外,窃电行为在我国每年造成的损失在百亿以上,供电单位改革创新,提质增效的发展方向要求其要进一步加强线损管理和窃电行为稽查。线损电量为供电量与用电量之差,窃电分子通过导线绕接,干扰等方式,使电能表电量少计、错计,从而达到降低电费的目的,未计量的那部分电量即被算入线损电量中,导致台区线损率过高,加之给计量装置造成的破坏,均会给供电公司造成损失。窃电过程中的违规接电威胁人身安全,在电网感知以外的违规用电会对电网的安全稳定调控及运行带来不利影响。In recent years, electricity has provided more and more support for China's economic and social development, and the behavior of electricity theft has become more and more serious, which not only affects the quality of electricity consumption of users, but also may endanger the safe operation of the power grid. In addition, the annual loss of electricity stealing in my country is more than 10 billion. The reform and innovation of power supply units, the development direction of improving quality and efficiency requires them to further strengthen line loss management and electricity stealing behavior inspection. The power loss is the difference between the power supply and the power consumption. The electricity stealing molecules make the electricity meter less or wrongly counted by means of wire winding and interference, so as to achieve the purpose of reducing the electricity bill, and the unmeasured part of the electricity will be Counting into the power loss of the line, the line loss rate in the station area is too high, and the damage to the metering device will cause losses to the power supply company. Illegal access to electricity in the process of stealing electricity threatens personal safety, and illegal use of electricity outside the perception of the power grid will adversely affect the security, stability, regulation and operation of the power grid.
随着科技的进步,当前窃电手法从简单向高技术转变,窃电方式由简单的分压、分流等手段发展到采用遥控装置间歇性窃电、高频干扰器非侵人式窃电等高科技窃电方式,窃电的地点和过程更加隐蔽。而传统的窃电稽查手段一般为依靠反窃电物理装置,高损台区现场人工排查,用户举报等方式,随着窃电手段的升级,该方法存在效率低下,证据收集困难的问题。With the advancement of science and technology, the current method of electricity stealing has changed from simple to high-tech, and the method of electricity stealing has developed from simple voltage division, shunt and other means to intermittent electricity stealing by remote control devices, non-intrusive electricity stealing by high-frequency jammers, etc. With high-tech electricity stealing methods, the location and process of electricity stealing are more concealed. The traditional methods of electricity stealing inspection generally rely on anti-stealing physical devices, manual on-site inspections in high-loss stations, and user reporting. With the upgrading of electricity stealing methods, this method has problems of low efficiency and difficulty in collecting evidence.
学术界提出基于人工智能的一些智能算法,实际现场采集设备的计算处理能力难以实现。且很多算法针对采集数据缺失,频度低而建立的智能分析模型,未见针对国网新推广应用的HPLC深化应用功能所配置的窃电分析方案。Academia has proposed some intelligent algorithms based on artificial intelligence, but it is difficult to achieve the computing processing capability of actual field acquisition equipment. In addition, many algorithms have established intelligent analysis models for the lack of collected data and low frequency. There is no electricity stealing analysis scheme configured for the HPLC deepening application function newly promoted and applied by the State Grid.
发明内容SUMMARY OF THE INVENTION
针对配电网线损管控中的用户窃电问题,结合当前新推广应用的HPLC通信技术和计量设备,建立了一种基于三层递进式分析模型的配电网用户窃电行为诊断方法,该方法以台区理论线损分析,四维指标的窃电嫌疑度评价体系,高频采集与事件上报的取证确认三部分为主体建立三层递进式分析模型,详见下文描述:Aiming at the problem of user electricity stealing in distribution network line loss management and control, combined with the current newly popularized HPLC communication technology and metering equipment, a three-layer progressive analysis model based on the distribution network user electricity stealing behavior diagnosis method is established. Methods A three-layer progressive analysis model is established based on the theoretical line loss analysis of the Taiwan area, the four-dimensional index evaluation system for the suspicion of electricity theft, and the high-frequency collection and the forensic confirmation of incident reporting. The details are described below:
一种基于三层递进式分析模型的配电网用户窃电行为诊断方法,所述方法包括:A method for diagnosing electricity stealing behavior of distribution network users based on a three-layer progressive analysis model, the method comprising:
若台区的日线损率高于台区线损率考核指标,且线损率高于理论线损率参考值,则判定台区内存在疑似窃电行为,进行基于四维指标的窃电行为分析;If the daily line loss rate of the station area is higher than the line loss rate assessment index of the station area, and the line loss rate is higher than the theoretical line loss rate reference value, it is determined that there is suspected electricity stealing behavior in the station area, and the electricity stealing behavior based on the four-dimensional index is carried out. analyze;
若台区高损时段内单用户日冻结电量平均值超出用户日冻结电量数据集Sq的取值范围,高于Sq最大值或低于Sq最小值的偏差值为该用户的用电量水平偏差指标取值dq;If the average value of the daily frozen power of a single user during the high-loss period in the station area exceeds the value range of the user's daily frozen power data set Sq , the deviation higher than the maximum value of Sq or lower than the minimum value of Sq is the power consumption of the user The value of the quantity level deviation index is dq ;
若台区高损时段内单用户用电量占台区总用电量占比平均值超出用户用电量占比数据集Sr的取值范围,高于Sr最大值或低于Sr最小值的偏差值为该用户的用电量占比偏差指标取值dr;If the average value of the electricity consumption of a single user in the total electricity consumption of the station area during the high-loss period of the station area exceeds the value range of the user electricity consumption percentage data set Sr , it is higher than the maximum value of Sr or lower than Sr The deviation value of the minimum value is the valuedr of the deviation index of the electricity consumption proportion of the user;
台区高损时段内求单用户所有相邻两日的用电量变化率,并计算该用户用电量变化率平均值raver,取台区高损起始日及前后两日的日用电量变化率最大值rmax,则该用户用电量变化率偏差指标为dk=rmax-raver;During the high-loss period in the station area, find the rate of change of electricity consumption for all the adjacent two days of a single user, and calculate the average rate of change in electricity consumption of the user, raver , and take the daily consumption of the station area on the starting day of high-loss and the two days before and after it. The maximum value of the electricity change rate rmax , then the deviation index of the electricity consumption change rate of the user is dk =rmax -raver ;
台区高损时段内计算用户日用电量时序序列Quser(t)和对应每日的台区线损电量时序序列Qarea(t)的皮尔逊相关系数,即关联性指标dc;Calculate the Pearson correlation coefficient of the user's daily electricity consumption time series Quser (t) and the corresponding daily station area line loss power time series Qarea (t) during the high-loss period of the station area, that is, the correlation index dc ;
计算归一化后的四项指标的加权平均值作为用户嫌疑度,按嫌疑度阈值将用户划分为“正常”、“预警”和“异常”用户。The weighted average of the normalized four indicators is calculated as the user's suspicion degree, and the users are divided into "normal", "warning" and "abnormal" users according to the threshold of suspicion degree.
本发明提供的技术方案的有益效果是:The beneficial effects of the technical scheme provided by the present invention are:
1、本发明以主站层台区窃电疑似判定,采集终端层四维指标的窃电用户嫌疑度评价体系,电能表层高频采集与事件上报的取证确认三部分为主体,建立三层递进式分析模型;本发明在窃电事件的处理上可以更加及时准确,充分掌握窃电证据,有效支撑反窃电工作的开展;1. The present invention takes three parts as the main body to determine the suspicion of electricity theft in the main station floor area, collect the four-dimensional index of the terminal layer to evaluate the user's suspicion degree of electricity theft, high-frequency collection of the electric energy surface layer and forensic confirmation of the event report, and establish a three-layer progressive system. formula analysis model; the present invention can be more timely and accurate in the processing of electricity stealing events, fully grasp the electricity stealing evidence, and effectively support the development of anti-power stealing work;
2、通过本发明可以顺应国家电网公司HPLC技术推广应用的趋势,充分挖掘HPLC深化应用功能优势,基于当前用电信息采集系统边缘计算资源与处理能力,以主站-采集终端-电能表的用电信息采集系统主体为依托,实现窃电行为辨识,用户嫌疑度评价,窃电取证和分钟级派工响应,满足现场实际窃电稽查要求。2. The present invention can conform to the trend of the promotion and application of HPLC technology of State Grid Corporation of China, fully exploit the advantages of HPLC to deepen the application function, and based on the edge computing resources and processing capabilities of the current electricity information collection system, the main station-collection terminal-electric energy meter is used. Relying on the main body of the electricity information collection system, it realizes the identification of electricity theft behavior, the evaluation of user suspicion, the forensics of electricity theft, and the minute-level dispatch response to meet the actual on-site electricity theft inspection requirements.
附图说明Description of drawings
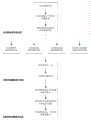
图1为一种基于三层递进式分析模型的配电网用户窃电行为诊断方法的流程图;1 is a flowchart of a method for diagnosing electricity stealing behavior of distribution network users based on a three-layer progressive analysis model;
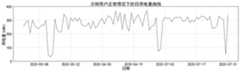
图2为案例台区日线损率曲线;Figure 2 is the daily line loss rate curve of the case station area;
图3为案例台区理论线损率与实际线损率对比曲线;Figure 3 is the comparison curve between the theoretical line loss rate and the actual line loss rate in the case station area;
图4为示例用户线损率正常情况下的日用电量曲线;Fig. 4 is the daily electricity consumption curve under the normal situation of the example user line loss rate;
图5为示例用户线损率正常情况下的日用电量箱线图;Figure 5 is a boxplot of daily electricity consumption under the normal case of an example user line loss rate;
图6为示例用户线损异常时的日用电量曲线;Fig. 6 is the daily electricity consumption curve when the example user line loss is abnormal;
图7为示例用户的高频采集瞬时功率曲线;Figure 7 is an example user's high-frequency acquisition instantaneous power curve;
图8为多案例分析结果混淆矩阵。Figure 8 shows the confusion matrix of the results of the multi-case analysis.
具体实施方式Detailed ways
为使本发明的目的、技术方案和优点更加清楚,下面对本发明实施方式作进一步地详细描述。In order to make the objectives, technical solutions and advantages of the present invention clearer, the embodiments of the present invention are further described in detail below.
当前国家电网公司推广HPLC(High-speed Power Line Communication)通信技术,即高速电力线载波通信技术,并开展深化应用升级工作,其中的高频数据采集、事件主动上报、台区自动识别、相位拓扑识别等功能将对窃电检查工作提供更好的支撑作用,因此需要充分挖掘HPLC的优势,建立基于HPLC技术的窃电行为智能诊断方法,且符合当前用电信息采集系统对边缘计算的支撑能力,为窃电稽查工作提供有效的解决方案。At present, the State Grid Corporation of China promotes HPLC (High-speed Power Line Communication) communication technology, that is, high-speed power line carrier communication technology, and carries out in-depth application and upgrading work, among which high-frequency data collection, active event reporting, automatic identification of station areas, and phase topology identification. Such functions will provide better support for electricity stealing inspection work. Therefore, it is necessary to fully exploit the advantages of HPLC and establish an intelligent diagnosis method for electricity stealing behavior based on HPLC technology, which is in line with the current electricity consumption information collection system's ability to support edge computing. Provide effective solutions for electricity theft inspections.
本发明实施例提供了一种基于三层递进式分析模型的配电网用户窃电行为诊断方法,参见图1,该方法整体架构包括以下三个层级:An embodiment of the present invention provides a method for diagnosing electricity stealing behavior of distribution network users based on a three-layer progressive analysis model. Referring to FIG. 1 , the overall architecture of the method includes the following three levels:
1)主站层1) Main station layer
用电信息采集系统的主站接收采集终端上传的台区信息、用户档案、线损电量等数据,本方法利用这些数据在主站侧进行台区线损情况总体分析。包括:判断日线损率是否超过考核上限;通过台区户变关系识别功能来检查、修正或排除用户档案中户变关系错乱的高损原因;以及理论线损计算对比。以此来判断哪些台区具有可能因窃电导致的高损问题,作为窃电嫌疑台区进行下一层的具体分析。The main station of the electricity consumption information acquisition system receives the station area information, user files, line loss power and other data uploaded by the acquisition terminal. Including: judging whether the daily line loss rate exceeds the upper limit of the assessment; checking, correcting or eliminating the high-loss reasons for the disordered household change relationship in the user file through the identification function of household change relationship in Taiwan district; and theoretical line loss calculation and comparison. Based on this, we can judge which stations have high-loss problems that may be caused by electricity stealing, and conduct the next-level specific analysis as the suspected electricity stealing stations.
2)采集终端层2) Acquisition terminal layer
采集终端包括:集中器和专变采集终端,一个台区一般装设一台,按照任务设定按时采集所在台区内的所有电能表的日冻结电量、负荷电压电流等数据并上传到主站。本方法利用采集到的各用户日冻结电量数据和台区总电量数据进行四维指标分析,对主站层分析得到的窃电嫌疑台区内的所有用户进行嫌疑度评价,为下一层分析缩小范围。The collection terminals include: concentrators and special-purpose transformer collection terminals. One station is generally installed in each station area. According to the task setting, the daily frozen power, load voltage and current data of all electric energy meters in the station area are collected on time and uploaded to the main station. . This method uses the collected daily frozen power data of each user and the total power data of the station area to perform four-dimensional index analysis, and evaluates the suspicion degree of all users in the station area suspected of electricity stealing obtained by the analysis of the main station layer, and narrows down the analysis for the next layer. scope.
3)电能表层3) Electric energy surface layer
其中,电能表根据采集终端指令进行用户日冻结电量和负荷电压电流等数据的采集并上传采集终端,每个用户装设一台。本方法在电能表层根据事件上报功能进一步确定“异常”用户,考虑当前HPLC技术中的高频采集功能只对于少量电能表进行采集时才能避免过度占用载波通道影响其他业务,因此只对“异常”用户启用周期为15min的高频采集功能,针对功率发生异常变化的用户生成排查工单,及时进行窃电现场稽查。Among them, the electric energy meter collects data such as the user's daily frozen electricity and load voltage and current according to the instructions of the collection terminal, and uploads the collection terminal, each user installs one. This method further determines "abnormal" users at the power meter layer according to the event reporting function. Considering that the high-frequency acquisition function in the current HPLC technology can only collect a small number of electric energy meters, it can avoid excessive occupation of the carrier channel and affect other services. Therefore, only "abnormal" users can be The user enables the high-frequency collection function with a cycle of 15 minutes, generates an investigation work order for users whose power changes abnormally, and conducts on-site inspections of electricity theft in a timely manner.
下面结合图1,计算公式详细描述上述的诊断方法,详见下文介绍:Below in conjunction with Fig. 1, the above-mentioned diagnostic method is described in detail by the calculation formula, which is described in the following for details:
步骤1):高损台区判定Step 1): High-loss platform determination
在用电信息采集系统中监控各台区的日线损率,若日线损率高于线损率考核值,则该台区视为高损台区,进入下面的高损台区分析流程;若日线损率低于线损率考核值,则该台区线损率合格,无需进行线损治理。Monitor the daily line loss rate of each station in the power consumption information collection system. If the daily line loss rate is higher than the line loss rate assessment value, the station area is regarded as a high-loss station area, and the following high-loss station area analysis process is entered. ; If the daily line loss rate is lower than the line loss rate assessment value, the line loss rate of the station area is qualified and no line loss treatment is required.
步骤2):计量采集与户变关系问题排查Step 2): Troubleshooting the relationship between measurement collection and household change
结合现场排查和用电信息采集系统分析,判断计量装置是否存在故障,通信环境是否良好,主站数据处理是否异常等计量采集问题。同时开启户变关系识别功能,利用HPLC的台区自动识别功能进行户变关系(本领域公知的技术术语)识别。问题排除或及时解决后仍存在高损问题,继续以下分析流程。Combined with the on-site investigation and the analysis of the electricity information collection system, it can be judged whether there is a fault in the metering device, whether the communication environment is good, whether the data processing of the main station is abnormal, and other metering and collection problems. At the same time, the household-change relationship identification function is enabled, and the household-change relationship (technical term known in the art) is identified by using the automatic identification function of the HPLC station area. If there is still a high loss problem after the problem is eliminated or solved in time, continue with the following analysis process.
其中,用电信息采集系统为电力行业公知的系统,用于用电数据远程抄表采集、电费充值等功能,包括简单的线损统计分析等,本发明实施例对此不做赘述。The electricity consumption information collection system is a well-known system in the electric power industry, and is used for functions such as remote meter reading collection of electricity consumption data, electricity bill recharging, etc., including simple statistical analysis of line losses, etc., which are not described in this embodiment of the present invention.
步骤3):理论线损对比Step 3): Theoretical line loss comparison
进行理论线损率计算,得到当前条件下的理论线损率参考值,若台区的日线损率高于理论线损率,则判定台区内存在疑似窃电行为,进行下面的基于四维指标的窃电行为分析;若台区的日线损率等于或低于理论线损率,则该台区的高线损率可能由负荷特性等其他因素导致,在此不做窃电因素的分析。至此,第一层边缘计算结束。Calculate the theoretical line loss rate to obtain the reference value of the theoretical line loss rate under the current conditions. If the daily line loss rate in the station area is higher than the theoretical line loss rate, it is determined that there is suspected electricity stealing in the station area, and the following four-dimensional Analysis of the power stealing behavior of indicators; if the daily line loss rate of the station area is equal to or lower than the theoretical line loss rate, the high line loss rate of the station area may be caused by other factors such as load characteristics, and the power stealing factor is not considered here. analyze. At this point, the first layer of edge computing is over.
步骤4):用电量水平偏差指标分析Step 4): Analysis of power consumption level deviation index
从此步骤到步骤9)是台区内每个用户都需要独立执行的分析流程,在此仅基于一个用户进行阐述。取台区线损率正常情况下该用户近3个月至6个月的日冻结电量历史数据,选取的用户历史数据用电量水平应保证与当前未有明显的稳定的差异性。除去该用户停工期、临时外出、节假日等用电量水平极低的数据,余下的历史数据采用箱线图的方式去除异常值:设Q1和Q3分别为日冻结电量数据集的1/4分位点和3/4分位点,IQR为1/4分位点和3/4分位点的距离,则上限为Q3+1.5×IQR,下限为Q1-1.5×IQR,超过上限和低于下限的数据进行剔除,最终得到该用户日冻结电量数据集Sq,表征该用户正常情况下日用电量水平。取台区高损时段内该用户日冻结电量平均值,若平均值超出Sq的取值范围,则其高于Sq最大值或低于Sq最小值的偏差值为该用户的用电量水平偏差指标取值dq;若未超出Sq的取值范围,则dq=0。From step 9) to step 9), each user in the station area needs to perform the analysis process independently, which is only explained here based on one user. Take the historical data of the user's daily frozen electricity in the past 3 months to 6 months under normal circumstances of the line loss rate in the station area. Excluding the data with extremely low power consumption levels such as the user's downtime, temporary going out, holidays, etc., the remaining historical data is removed by boxplots: Let Q1 andQ3 be1/1 of the daily frozen power data set, respectively. The 4th quantile and the 3/4th quantile, the IQR is the distance between the 1/4th quantile and the 3/4th quantile, then the upper limit is Q3 +1.5×IQR, and the lower limit is Q1 -1.5×IQR, more than The data with the upper limit and the lower limit is eliminated, and finally the user's daily frozen power data set Sq is obtained, which represents the daily power consumption level of the user under normal conditions. Take the average value of the user's daily frozen power during the high-loss period in the station area. If the average value exceeds the value range of Sq , the deviation above the maximum value of Sq or below the minimum value of Sq is the power consumption of the user The quantity level deviation index takes the value dq ; if the value range of Sq is not exceeded, then dq =0.
步骤5):用电量占比偏差指标分析Step 5): Analysis of the deviation index of the proportion of electricity consumption
将该用户的日用电量数据集Sq中的每日用电量除以当日台区用户总用电量,得到该用户用电量占比数据集Sr。取台区高损时段内该用户用电量占比平均值,若平均值超出Sr的取值范围,则其高于Sr最大值或低于Sr最小值的偏差值为该用户的用电量占比偏差指标取值dr;若未超出Sr的取值范围,则dr=0。The daily electricity consumption in the user's daily electricity consumption data set Sq is divided by the total electricity consumption of the users in the station area on that day to obtain the user's electricity consumption proportion data set Sr . Take the average value of the user's electricity consumption during the high-loss period in the station area. If the average value exceeds the value range of Sr , the deviation above the maximum value of Sr or below the minimum value of Sr is the user's The power consumption ratio deviation index takes the valuedr ; if the value range of Sr is not exceeded, then dr =0.
步骤6):用电量变化率偏差指标分析Step 6): Analysis of deviation index of electricity consumption rate of change
定义日用电量变化率为相邻两日的用电量之差与时间差(min)的比值,取数据集Sq,求所有相邻两日的用电量变化率,并计算变化率平均值raver。取台区高损起始日及前后两日 (共5日)的日用电量变化率最大值rmax,则该用户用电量变化率偏差指标为dk=rmax-raver。The daily electricity consumption change rate is defined as the ratio of the difference between the electricity consumption of two adjacent days and the time difference (min), take the data set Sq , find the electricity consumption change rate of all adjacent two days, and calculate the average change rate The valueraver . Taking the maximum value rmax of the daily electricity consumption rate of change on the starting day of the high loss in the station area and two days before and after (5 days in total), the deviation index of the user's electricity consumption rate of change is dk =rmax -raver .
步骤7):用电量-台区线损电量关联性指标分析Step 7): Analysis of the correlation index between power consumption and line loss power in the station area
取台区高损时段区间,往前取到整月的时段,如7月10日开始出现台区高损,则时段区间从7月1日开始。根据式(1),计算用户日用电量时序序列Quser(t)和对应每日的台区线损电量时序序列Qarea(t)的皮尔逊相关系数,即关联性指标dc。Take the high-loss period in the Taiwan area and go forward to the whole month. If the high-loss in the Taiwan area begins to appear on July 10, the time interval will start on July 1. According to formula (1), calculate the Pearson correlation coefficient of the user's daily power consumption time series Quser (t) and the corresponding daily station area line loss power time series Qarea (t ), that is, the correlation index dc .

其中,

步骤8):指标归一化Step 8): Indicator normalization
为解决上述四项指标量纲的差异性带来的误差,分别针对每项指标,将该指标的台区所有用户计算结果进行归一化处理,即所有用户最大值取1,其他用户取其结果与最大值的比值,由此得到用户归一化处理后的四项指标dq′、dr′、dk′、dc′。In order to solve the error caused by the difference of the dimensions of the above four indicators, for each indicator, the calculation results of all users in the station area of the indicator are normalized, that is, the maximum value of all users is taken as 1, and other users take the value of 1. The ratio of the result to the maximum value, thereby obtaining the four indexes dq ', dr ', dk ', and dc ' normalized by the user.
步骤9):计算嫌疑度Step 9): Calculate Suspicion
计算四项指标的加权平均值作为用户嫌疑度Psuspition,如式(2)所示,其中权重一般取1,或可根据现场准确率反馈作适当调整。进行用户嫌疑度排序,默认选取嫌疑度大于0.5的用户为“异常”,大于0.4小于0.5的用户等级划分为“预警”,记录用户异常时间,至此,第二层边缘计算结束。Calculate the weighted average of the four indicators as the user's suspicion degree Psuspition , as shown in formula (2), where the weight generally takes 1, or can be appropriately adjusted according to the on-site accuracy feedback. Sorting the user's suspicion degree. By default, users with a degree of suspicion greater than 0.5 are selected as "abnormal", and users with a degree of suspicion greater than 0.4 and less than 0.5 are classified as "warning", and the abnormal time of the user is recorded. At this point, the second-layer edge computing is over.

其中,w1,w2,w3,w4为四项指标各自的权重。Among them, w1 , w2 , w3 , and w4 are the respective weights of the four indicators.
步骤10):基于HPLC事件上报功能的事件取证Step 10): Event forensics based on the HPLC event reporting function
针对“异常”和“预警”用户,利用HPLC的事件上报和相位拓扑识别功能,考察智能电表经HPLC模块上报的事件数据,若在台区高损期间存在电表开盖事件和三相不平衡事件记录,则“预警”用户变为“异常”用户,并作为窃电嫌疑证据。For "abnormal" and "early warning" users, the event reporting and phase topology identification functions of HPLC are used to examine the event data reported by the smart meter through the HPLC module. Records, the "warning" user becomes an "abnormal" user, and it is used as evidence of suspected electricity theft.
步骤11):基于HPLC高频采集的用户窃电行为确认及快速响应Step 11): Confirmation and quick response of user electricity stealing behavior based on HPLC high-frequency acquisition
HPLC通信单元的高频数据采集功能为智能电表每15min采集一次功率数据上传给集中器,考虑目前规模较大台区进行高频数据采集时存在通信通道占用过量导致远程充值等其他采集功能无法正常运行的情况,因此本发明实施例只针对上述步骤筛选的“异常”用户实施高频采集数据上传。分析用户功率曲线,若在台区高损起始日该用户功率存在显著的异常下降时刻(功率正常范围及异常偏差判别方法参考步骤4),则以此作为证据,生成预警排查任务,进行排查任务的拆分、派工、处理、审核,实现窃电稽查快速响应。The high-frequency data acquisition function of the HPLC communication unit is that the smart meter collects power data every 15 minutes and uploads it to the concentrator. Considering that the current large-scale station area is used for high-frequency data acquisition, the communication channel is too occupied, so other acquisition functions such as remote recharge cannot be normal. Therefore, in the embodiment of the present invention, only the "abnormal" users screened in the above steps are subjected to high-frequency collection data upload. Analyze the power curve of the user. If there is a significant abnormal drop in the power of the user on the starting day of the high loss in the station area (refer to step 4 for the normal power range and abnormal deviation judgment method), use this as evidence to generate an early warning inspection task and conduct inspection Splitting, dispatching, processing, and reviewing tasks to achieve rapid response to electricity theft inspections.
案例分析case analysis
选取浙江某地区低压配电网中某台区作为窃电分析案例,该台区共有163个用户,其中有居民用户107个,一般工商业用户56个。A certain area in a low-voltage distribution network in a certain area of Zhejiang is selected as an analysis case for electricity theft. There are 163 users in this area, including 107 residential users and 56 general industrial and commercial users.
(1)主站层(1) Main station layer
步骤1):step 1):
电力公司线损管理人员通过用电信息采集系统的主站发现该台区自8月21日起线损率始终高于考核要求的8%,因此将其列为窃电嫌疑台区,该台区8月份的日线损率曲线如图2所示。The power company's line loss management personnel found through the main station of the electricity information collection system that the line loss rate in this station area has always been higher than 8% of the assessment requirements since August 21, so it was listed as a suspected electricity stealing station area. The daily loss rate curve of the district in August is shown in Figure 2.
步骤2):Step 2):
分析用电信息采集系统的主站采集到的数据及计量表计状态情况可见,计量表计未发生采集缺失等故障,远程充值等其他业务正常运行,通信环境良好。开启户变关系识别功能使集中器与电能表组网,并将组网后实际在网电能表户号与档案记录的户号对比,未发现缺失和多余电能表户号,因此户变关系错乱因素排除。Analysis of the data collected by the main station of the electricity consumption information collection system and the status of the meters shows that the meters have no faults such as missing collection, other services such as remote recharge are running normally, and the communication environment is good. Turn on the household change relationship identification function to make the concentrator and the electric energy meter network, and compare the actual electricity meter household number on the network with the household number recorded in the file. No missing or redundant electric energy meter household number is found, so the household change relationship is chaotic factor excluded.
步骤3):Step 3):
通过主站进行理论线损计算,得到的理论线损率和实际线损率曲线如图3所示。可见 8月21日前理论线损率略低于实际线损率,该差异是由于理论线损计算误差或各类装备损耗在计算时考虑不全面导致的,8月21日以后实际线损率与理论线损率差异明显增大,窃电一般为该情形的主要原因,因此判定台区内存在疑似窃电行为。Through the theoretical line loss calculation of the master station, the obtained theoretical line loss rate and actual line loss rate curve are shown in Figure 3. It can be seen that the theoretical line loss rate was slightly lower than the actual line loss rate before August 21. The difference was caused by the theoretical line loss calculation error or the incomplete consideration of various equipment losses in the calculation. After August 21, the actual line loss rate and The difference in theoretical line loss rate increases significantly, and electricity stealing is generally the main reason for this situation. Therefore, it is determined that there is suspected electricity stealing in the station area.
(2)采集终端层(2) Acquisition terminal layer
该层分析针对台区内所有用户,这里仅以用户A为例进行结果展示。This layer of analysis is aimed at all users in the station area. Here, only user A is used as an example to display the results.
步骤4):Step 4):
对用户选取前三个月台区线损正常时的日用电量数据作为该用户正常数据集,用户A 的日冻结电量曲线如图4所示。For the user, the daily power consumption data of the previous three months when the line loss was normal in the station area were selected as the normal data set of the user. The daily frozen power curve of user A is shown in Figure 4.
对正常数据集进行异常值剔除。用户A正常情况下日用电量箱线图如图5所示。去除图中左侧箱线以外用电量较低的异常值,得到台区线损率正常情况下用户A的日用电量数据集Sq,范围为204.3kWh~368.8kWh。Outliers are removed from normal datasets. The boxplot of the daily electricity consumption of user A under normal conditions is shown in Figure 5. By removing the outliers with low electricity consumption outside the box line on the left in the figure, the daily electricity consumption data set Sq of user A under normal line loss rate in the station area is obtained, ranging from 204.3kWh to 368.8kWh.
用户A在台区线损异常时的日用电量曲线如图6所示,在8月21日至8月31日台区线损异常期间的平均日用电量为137.5,因此用电量水平偏差指标dq=204.3-137.5=66.8kWh。The daily electricity consumption curve of user A when the line loss is abnormal in the station area is shown in Figure 6. The average daily electricity consumption during the period of abnormal line loss in the station area from August 21 to August 31 is 137.5, so the electricity consumption Horizontal deviation index dq =204.3-137.5=66.8kWh.
步骤5):Step 5):
将步骤4中采用的日用电量数据全部替换为日用电量除以当日台区总电量,分析过程不变,得到线损率正常情况下用户A的用电量占比数据集Sr,范围为2.43%~2.95%,用电量占比偏差指标dr=2.43%-2.12%=0.31%kWh。The daily electricity consumption data used in step 4 is all replaced by the daily electricity consumption divided by the total electricity of the station area on the day, the analysis process remains unchanged, and the data set Sr of the electricity consumption proportion of user A under normal line loss rate is obtained. , the range is 2.43% to 2.95%, and the deviation index of the proportion of electricity consumption isdr = 2.43% - 2.12% = 0.31% kWh.
步骤6):Step 6):
由数据集Sq得到用户A正常情况下的日用电量绝对值的平均变化率为14.29%,则用电量偏差指标dk=rmax-raver=44.96%-14.29%=30.67%。From the data set Sq , the average change rate of the absolute value of daily electricity consumption of user A under normal conditions is 14.29%, then the electricity consumption deviation index dk =rmax -raver =44.96%-14.29%=30.67%.
步骤7):Step 7):
根据公式(1),计算8月份台区总的日用电量和用户A的日用电量的皮尔逊相关系数,得到关联性指标dc=-0.869。According to formula (1), the Pearson correlation coefficient between the total daily electricity consumption of the station area and the daily electricity consumption of user A in August is calculated, and the correlation index dc =-0.869 is obtained.
步骤8):Step 8):
将四项指标归一化处理得到dq′=0.92,dr′=0.76,dk′=1,dc′=1。The four indicators are normalized to obtain dq '=0.92, dr '=0.76, dk '=1, and dc '=1.
步骤9):Step 9):
根据公式(2)计算用户嫌疑度,得到用户A的嫌疑度为0.92,大于0.5,因此判定该用户为异常用户。According to formula (2), the user's suspicion degree is calculated, and the user A's suspicion degree is obtained as 0.92, which is greater than 0.5, so the user is determined to be an abnormal user.
(3)电能表层(3) Electric energy surface layer
步骤10):Step 10):
考察时间上报数据,未发现电能表开盖事件、三相不平衡等事件记录。The data was reported during the inspection time, and no records of events such as the opening of the electric energy meter and the three-phase unbalance were found.
步骤11):Step 11):
针对“异常”用户利用高频数据采集,由电能表每15min采集一次瞬时功率数据,如图7所示。由图中可见,8月21日11时45分,该用户瞬时功率明显降低,且功率曲线波动性减小。由此生成现场稽查工单,供电公司人员到现场排查,根据上述提供的功率突降时刻查看现场监控发现该时间之前存在非电力公司人员打开计量箱进行未知操作的行为,用户处查看发现存在私拉电线到大功率负荷用电的情况,属窃电行为。至此窃电用户诊断及稽查完毕,该窃电智能诊断方法判断正确。For "abnormal" users, high-frequency data collection is used, and the instantaneous power data is collected by the electric energy meter every 15 minutes, as shown in Figure 7. It can be seen from the figure that at 11:45 on August 21, the instantaneous power of the user was significantly reduced, and the fluctuation of the power curve was reduced. From this, an on-site inspection work order is generated, and the personnel of the power supply company go to the site for inspection. According to the power sudden drop time provided above, the on-site monitoring is found to have non-power company personnel open the metering box to perform unknown operations before this time. Pulling a wire to a high-power load for electricity is an act of stealing electricity. So far, the diagnosis and inspection of electricity stealing users are completed, and the judgment of the intelligent diagnosis method for electricity stealing is correct.
针对该地区近一年不同台区发生的23个用户窃电案例,采用本方法进行窃电智能诊断,其结果如图8所示。由混淆矩阵第一列可见,实际为窃电用户的23个用户中,诊断为窃电用户的为21个,判定窃电用户的准确率达到91.3%;由混淆矩阵第一行可见,所有诊断为窃电用户的26个用户中,有21个确实为窃电用户,5个为窃电误判用户,通过现场稽查可排除,判定窃电用户的精准率达到80.8%。Aiming at 23 cases of electricity stealing by users in different stations in the region in the past year, this method is used for intelligent diagnosis of electricity stealing, and the results are shown in Figure 8. It can be seen from the first column of the confusion matrix that among the 23 users who are actually electricity stealing users, 21 are diagnosed as electricity stealing users, and the accuracy rate of judging electricity stealing users reaches 91.3%; it can be seen from the first row of the confusion matrix that all diagnosis Among the 26 users who are electricity stealing users, 21 are indeed electricity stealing users, and 5 are users who misjudged electricity stealing, which can be excluded through on-site inspection, and the accuracy rate of judging electricity stealing users reaches 80.8%.
综上所述,本方法能够准确地判定窃电用户,有效帮助窃电稽查管控,满足实际应用需求。To sum up, the method can accurately determine the users of electricity stealing, effectively help the inspection and control of electricity stealing, and meet the needs of practical applications.
本发明实施例对各器件的型号除做特殊说明的以外,其他器件的型号不做限制,只要能完成上述功能的器件均可。In the embodiment of the present invention, the models of each device are not limited unless otherwise specified, as long as the device can perform the above functions.
本领域技术人员可以理解附图只是一个优选实施例的示意图,上述本发明实施例序号仅仅为了描述,不代表实施例的优劣。Those skilled in the art can understand that the accompanying drawing is only a schematic diagram of a preferred embodiment, and the above-mentioned serial numbers of the embodiments of the present invention are only for description, and do not represent the advantages or disadvantages of the embodiments.
以上所述仅为本发明的较佳实施例,并不用以限制本发明,凡在本发明的精神和原则之内,所作的任何修改、等同替换、改进等,均应包含在本发明的保护范围之内。The above are only preferred embodiments of the present invention and are not intended to limit the present invention. Any modifications, equivalent replacements, improvements, etc. made within the spirit and principles of the present invention shall be included in the protection of the present invention. within the range.
Claims (6)


Priority Applications (1)
| Application Number | Priority Date | Filing Date | Title |
|---|---|---|---|
| CN202110348972.XACN113094884A (en) | 2021-03-31 | 2021-03-31 | Power distribution network user electricity stealing behavior diagnosis method based on three-layer progressive analysis model |
Applications Claiming Priority (1)
| Application Number | Priority Date | Filing Date | Title |
|---|---|---|---|
| CN202110348972.XACN113094884A (en) | 2021-03-31 | 2021-03-31 | Power distribution network user electricity stealing behavior diagnosis method based on three-layer progressive analysis model |
Publications (1)
| Publication Number | Publication Date |
|---|---|
| CN113094884Atrue CN113094884A (en) | 2021-07-09 |
Family
ID=76671956
Family Applications (1)
| Application Number | Title | Priority Date | Filing Date |
|---|---|---|---|
| CN202110348972.XAPendingCN113094884A (en) | 2021-03-31 | 2021-03-31 | Power distribution network user electricity stealing behavior diagnosis method based on three-layer progressive analysis model |
Country Status (1)
| Country | Link |
|---|---|
| CN (1) | CN113094884A (en) |
Cited By (16)
| Publication number | Priority date | Publication date | Assignee | Title |
|---|---|---|---|---|
| CN113642641A (en)* | 2021-08-13 | 2021-11-12 | 北京中电普华信息技术有限公司 | Data processing method and device applied to electric charge follow-up payment work order |
| CN114076841A (en)* | 2021-11-12 | 2022-02-22 | 国网安徽省电力有限公司旌德县供电公司 | Electricity stealing behavior identification method and system based on electricity utilization information data |
| CN114218522A (en)* | 2021-12-02 | 2022-03-22 | 清华大学 | Calculation method of user contribution degree in station area based on information transfer entropy and investigation method of electricity theft |
| CN114236283A (en)* | 2021-12-15 | 2022-03-25 | 广东电网有限责任公司 | Method and device for determining line loss reason of power supply network |
| CN114399317A (en)* | 2022-01-17 | 2022-04-26 | 国网电子商务有限公司 | On-chain anti-electricity-stealing management method and device |
| CN115015828A (en)* | 2022-05-27 | 2022-09-06 | 云南电网有限责任公司 | Error out-of-tolerance ammeter determining method, device, equipment and computer storage medium |
| CN115347679A (en)* | 2022-10-17 | 2022-11-15 | 浙江万胜智能科技股份有限公司 | Intelligent management method and system for electricity consumption of user |
| CN115718217A (en)* | 2022-11-25 | 2023-02-28 | 中国电力科学研究院有限公司 | Line loss hierarchical analysis method and system |
| CN115826909A (en)* | 2023-02-24 | 2023-03-21 | 国网山东省电力公司枣庄供电公司 | Electricity stealing detection system based on big data analysis |
| CN116341788A (en)* | 2022-11-09 | 2023-06-27 | 国网甘肃省电力公司兰州供电公司 | A Power Fingerprint Precise Governance Method for Distribution Network Line Loss Analysis |
| CN116359832A (en)* | 2023-03-30 | 2023-06-30 | 天目数据(福建)科技有限公司 | Method and device for identifying metering misalignment of low-pressure gauge and storage medium |
| CN116486590A (en)* | 2023-05-10 | 2023-07-25 | 漆燕 | Ammeter data analysis system based on remote meter reading mode |
| CN117559407A (en)* | 2023-11-15 | 2024-02-13 | 国网四川省电力公司营销服务中心 | Abnormal electricity utilization behavior positioning method suitable for new energy distribution network |
| CN117633680A (en)* | 2023-11-24 | 2024-03-01 | 浙江超荣电力科技有限公司 | Metering standard analysis method, device and equipment for direct-current electric energy meter and storage medium |
| CN117640345A (en)* | 2024-01-25 | 2024-03-01 | 南京有嘉科技有限公司 | Method to evaluate equipment network performance using distribution terminal test signal time points |
| CN118364416A (en)* | 2024-06-20 | 2024-07-19 | 国网江苏省电力有限公司电力科学研究院 | A method, device and system for detecting electricity theft based on the information and physical sides of a distribution network |
Citations (5)
| Publication number | Priority date | Publication date | Assignee | Title |
|---|---|---|---|---|
| CN106291253A (en)* | 2016-09-23 | 2017-01-04 | 国网天津市电力公司 | A kind of anti-electricity-theft early warning analysis method |
| CN110824270A (en)* | 2019-10-09 | 2020-02-21 | 中国电力科学研究院有限公司 | Electricity stealing user identification method and device combining transformer area line loss and abnormal events |
| CN110988422A (en)* | 2019-12-19 | 2020-04-10 | 北京中电普华信息技术有限公司 | Electricity stealing identification method and device and electronic equipment |
| CN111521868A (en)* | 2020-04-28 | 2020-08-11 | 广东电网有限责任公司梅州供电局 | Method and device for screening electricity stealing users based on big metering data |
| CN112329895A (en)* | 2021-01-05 | 2021-02-05 | 国网江西综合能源服务有限公司 | Method and device for identifying user with suspicion of electricity stealing |
- 2021
- 2021-03-31CNCN202110348972.XApatent/CN113094884A/enactivePending
Patent Citations (5)
| Publication number | Priority date | Publication date | Assignee | Title |
|---|---|---|---|---|
| CN106291253A (en)* | 2016-09-23 | 2017-01-04 | 国网天津市电力公司 | A kind of anti-electricity-theft early warning analysis method |
| CN110824270A (en)* | 2019-10-09 | 2020-02-21 | 中国电力科学研究院有限公司 | Electricity stealing user identification method and device combining transformer area line loss and abnormal events |
| CN110988422A (en)* | 2019-12-19 | 2020-04-10 | 北京中电普华信息技术有限公司 | Electricity stealing identification method and device and electronic equipment |
| CN111521868A (en)* | 2020-04-28 | 2020-08-11 | 广东电网有限责任公司梅州供电局 | Method and device for screening electricity stealing users based on big metering data |
| CN112329895A (en)* | 2021-01-05 | 2021-02-05 | 国网江西综合能源服务有限公司 | Method and device for identifying user with suspicion of electricity stealing |
Non-Patent Citations (6)
| Title |
|---|
| 孔祥玉等: "智能电网中电力设备及其技术发展分析", 《电力系统及其自动化学报》* |
| 张耀等: "防窃电预警分析应用实施", 《电子测试》* |
| 熊霞等: "基于台区识别和关联监测加权算法的窃电检测方法", 《计算机应用》* |
| 许小卉等: "基于配电物联网的反窃电预警系统研究及应用", 《计算技术与自动化》* |
| 钟晓剑: "一种基于大数据分析的窃电嫌疑用户精准定位方法", 《农村电气化》* |
| 陈仕军等: "基于曲线相似度和关联分析的窃电智能识别与预警", 《浙江电力》* |
Cited By (23)
| Publication number | Priority date | Publication date | Assignee | Title |
|---|---|---|---|---|
| CN113642641B (en)* | 2021-08-13 | 2024-03-05 | 北京中电普华信息技术有限公司 | Data processing method and device applied to electric charge additional work order |
| CN113642641A (en)* | 2021-08-13 | 2021-11-12 | 北京中电普华信息技术有限公司 | Data processing method and device applied to electric charge follow-up payment work order |
| CN114076841B (en)* | 2021-11-12 | 2024-05-07 | 国网安徽省电力有限公司旌德县供电公司 | Electricity theft behavior identification method and system based on electricity consumption information data |
| CN114076841A (en)* | 2021-11-12 | 2022-02-22 | 国网安徽省电力有限公司旌德县供电公司 | Electricity stealing behavior identification method and system based on electricity utilization information data |
| CN114218522A (en)* | 2021-12-02 | 2022-03-22 | 清华大学 | Calculation method of user contribution degree in station area based on information transfer entropy and investigation method of electricity theft |
| CN114218522B (en)* | 2021-12-02 | 2024-04-09 | 清华大学 | Method for measuring and calculating contribution degree of users in area based on information transfer entropy and method for checking fraudulent use of electricity |
| CN114236283A (en)* | 2021-12-15 | 2022-03-25 | 广东电网有限责任公司 | Method and device for determining line loss reason of power supply network |
| CN114236283B (en)* | 2021-12-15 | 2024-02-13 | 广东电网有限责任公司 | Method and device for determining line loss reason of power supply network |
| CN114399317A (en)* | 2022-01-17 | 2022-04-26 | 国网电子商务有限公司 | On-chain anti-electricity-stealing management method and device |
| CN115015828A (en)* | 2022-05-27 | 2022-09-06 | 云南电网有限责任公司 | Error out-of-tolerance ammeter determining method, device, equipment and computer storage medium |
| CN115347679B (en)* | 2022-10-17 | 2023-03-03 | 浙江万胜智能科技股份有限公司 | Intelligent management method and system for electricity consumption of user |
| CN115347679A (en)* | 2022-10-17 | 2022-11-15 | 浙江万胜智能科技股份有限公司 | Intelligent management method and system for electricity consumption of user |
| CN116341788A (en)* | 2022-11-09 | 2023-06-27 | 国网甘肃省电力公司兰州供电公司 | A Power Fingerprint Precise Governance Method for Distribution Network Line Loss Analysis |
| CN115718217A (en)* | 2022-11-25 | 2023-02-28 | 中国电力科学研究院有限公司 | Line loss hierarchical analysis method and system |
| CN115826909B (en)* | 2023-02-24 | 2023-05-12 | 国网山东省电力公司枣庄供电公司 | Electricity theft detection system based on big data analysis |
| CN115826909A (en)* | 2023-02-24 | 2023-03-21 | 国网山东省电力公司枣庄供电公司 | Electricity stealing detection system based on big data analysis |
| CN116359832A (en)* | 2023-03-30 | 2023-06-30 | 天目数据(福建)科技有限公司 | Method and device for identifying metering misalignment of low-pressure gauge and storage medium |
| CN116486590A (en)* | 2023-05-10 | 2023-07-25 | 漆燕 | Ammeter data analysis system based on remote meter reading mode |
| CN116486590B (en)* | 2023-05-10 | 2024-03-22 | 江阴众和电力仪表有限公司 | Ammeter data analysis system based on remote meter reading mode |
| CN117559407A (en)* | 2023-11-15 | 2024-02-13 | 国网四川省电力公司营销服务中心 | Abnormal electricity utilization behavior positioning method suitable for new energy distribution network |
| CN117633680A (en)* | 2023-11-24 | 2024-03-01 | 浙江超荣电力科技有限公司 | Metering standard analysis method, device and equipment for direct-current electric energy meter and storage medium |
| CN117640345A (en)* | 2024-01-25 | 2024-03-01 | 南京有嘉科技有限公司 | Method to evaluate equipment network performance using distribution terminal test signal time points |
| CN118364416A (en)* | 2024-06-20 | 2024-07-19 | 国网江苏省电力有限公司电力科学研究院 | A method, device and system for detecting electricity theft based on the information and physical sides of a distribution network |
Similar Documents
| Publication | Publication Date | Title |
|---|---|---|
| CN113094884A (en) | Power distribution network user electricity stealing behavior diagnosis method based on three-layer progressive analysis model | |
| CN115018139B (en) | Method and system for online identifying error state of current transformer based on interphase characteristics | |
| CN106443556A (en) | Method for intelligently diagnosing electric energy meter | |
| CN106405475A (en) | Electric energy meter abnormity diagnosis method | |
| CN111781463A (en) | An auxiliary diagnosis method for abnormal line damage in Taiwan area | |
| CN110046145A (en) | Expert intelligent analysis service platform based on electric energy big data research | |
| CN111817299B (en) | Fuzzy reasoning-based intelligent identification method for line loss rate abnormal cause of power distribution station | |
| CN213750303U (en) | Electric energy metering abnormity diagnosis system based on electricity consumption information acquisition system | |
| CN115099646B (en) | Transmission Line Maintenance Method Based on Fuzzy Probabilistic Hybrid Reliability Assessment and Risk Analysis | |
| CN110750760A (en) | Abnormal theoretical line loss detection method based on situation awareness and control chart | |
| CN107144764A (en) | A kind of user's voltage dip accident detection method based on ammeter data | |
| CN110675018A (en) | Line loss anomaly analysis and closed-loop management method based on expert rules | |
| CN108805429A (en) | " one continuous line " hardware and software platform fine-grained management method for taiwan area line loss | |
| CN118336836A (en) | A peak-shaving demand analysis method for multiple types of renewable energy based on risk elimination | |
| CN119561125B (en) | Energy storage power station management system based on big data analysis | |
| CN115833387A (en) | Automatic state inspection method for energy storage power station | |
| CN106803125A (en) | A kind of acquisition abnormity urgency level computational methods based on the conversion of standard electricity consumer | |
| CN106814268A (en) | A kind of big data analysis method based on intermittent defect | |
| CN119519142A (en) | Power supply and distribution supervision system based on data processing | |
| CN117565724B (en) | Method for identifying abnormal state of charging pile | |
| CN114295880A (en) | An analysis model for accurate location of electricity stealing and detection of abnormal electricity consumption behavior | |
| CN119397437A (en) | A statistical method for power grid load | |
| CN118412971A (en) | A battery remote monitoring and performance evaluation system | |
| CN106682817A (en) | Acquisition abnormity emergency degree judgment method | |
| CN109470289B (en) | A method and system for identifying reverse events of energy consumption flow value of metering equipment |
Legal Events
| Date | Code | Title | Description |
|---|---|---|---|
| PB01 | Publication | ||
| PB01 | Publication | ||
| SE01 | Entry into force of request for substantive examination | ||
| SE01 | Entry into force of request for substantive examination | ||
| WD01 | Invention patent application deemed withdrawn after publication | ||
| WD01 | Invention patent application deemed withdrawn after publication | Application publication date:20210709 |