CN112835482B - A Method for Making Interactive Weather Radar Samples - Google Patents
A Method for Making Interactive Weather Radar SamplesDownload PDFInfo
- Publication number
- CN112835482B CN112835482BCN202110008987.1ACN202110008987ACN112835482BCN 112835482 BCN112835482 BCN 112835482BCN 202110008987 ACN202110008987 ACN 202110008987ACN 112835482 BCN112835482 BCN 112835482B
- Authority
- CN
- China
- Prior art keywords
- data
- point
- marked
- marking
- image
- Prior art date
- Legal status (The legal status is an assumption and is not a legal conclusion. Google has not performed a legal analysis and makes no representation as to the accuracy of the status listed.)
- Active
Links
Images


Classifications
- G—PHYSICS
- G06—COMPUTING OR CALCULATING; COUNTING
- G06F—ELECTRIC DIGITAL DATA PROCESSING
- G06F3/00—Input arrangements for transferring data to be processed into a form capable of being handled by the computer; Output arrangements for transferring data from processing unit to output unit, e.g. interface arrangements
- G06F3/01—Input arrangements or combined input and output arrangements for interaction between user and computer
- G06F3/048—Interaction techniques based on graphical user interfaces [GUI]
- G06F3/0481—Interaction techniques based on graphical user interfaces [GUI] based on specific properties of the displayed interaction object or a metaphor-based environment, e.g. interaction with desktop elements like windows or icons, or assisted by a cursor's changing behaviour or appearance
- G—PHYSICS
- G06—COMPUTING OR CALCULATING; COUNTING
- G06F—ELECTRIC DIGITAL DATA PROCESSING
- G06F16/00—Information retrieval; Database structures therefor; File system structures therefor
- G06F16/50—Information retrieval; Database structures therefor; File system structures therefor of still image data
- G06F16/54—Browsing; Visualisation therefor
- G—PHYSICS
- G06—COMPUTING OR CALCULATING; COUNTING
- G06F—ELECTRIC DIGITAL DATA PROCESSING
- G06F16/00—Information retrieval; Database structures therefor; File system structures therefor
- G06F16/50—Information retrieval; Database structures therefor; File system structures therefor of still image data
- G06F16/58—Retrieval characterised by using metadata, e.g. metadata not derived from the content or metadata generated manually
- G06F16/5866—Retrieval characterised by using metadata, e.g. metadata not derived from the content or metadata generated manually using information manually generated, e.g. tags, keywords, comments, manually generated location and time information
- G—PHYSICS
- G06—COMPUTING OR CALCULATING; COUNTING
- G06F—ELECTRIC DIGITAL DATA PROCESSING
- G06F16/00—Information retrieval; Database structures therefor; File system structures therefor
- G06F16/50—Information retrieval; Database structures therefor; File system structures therefor of still image data
- G06F16/58—Retrieval characterised by using metadata, e.g. metadata not derived from the content or metadata generated manually
- G06F16/587—Retrieval characterised by using metadata, e.g. metadata not derived from the content or metadata generated manually using geographical or spatial information, e.g. location
- G—PHYSICS
- G06—COMPUTING OR CALCULATING; COUNTING
- G06F—ELECTRIC DIGITAL DATA PROCESSING
- G06F3/00—Input arrangements for transferring data to be processed into a form capable of being handled by the computer; Output arrangements for transferring data from processing unit to output unit, e.g. interface arrangements
- G06F3/01—Input arrangements or combined input and output arrangements for interaction between user and computer
- G06F3/048—Interaction techniques based on graphical user interfaces [GUI]
- G06F3/0481—Interaction techniques based on graphical user interfaces [GUI] based on specific properties of the displayed interaction object or a metaphor-based environment, e.g. interaction with desktop elements like windows or icons, or assisted by a cursor's changing behaviour or appearance
- G06F3/0482—Interaction with lists of selectable items, e.g. menus
- G—PHYSICS
- G06—COMPUTING OR CALCULATING; COUNTING
- G06F—ELECTRIC DIGITAL DATA PROCESSING
- G06F3/00—Input arrangements for transferring data to be processed into a form capable of being handled by the computer; Output arrangements for transferring data from processing unit to output unit, e.g. interface arrangements
- G06F3/01—Input arrangements or combined input and output arrangements for interaction between user and computer
- G06F3/048—Interaction techniques based on graphical user interfaces [GUI]
- G06F3/0484—Interaction techniques based on graphical user interfaces [GUI] for the control of specific functions or operations, e.g. selecting or manipulating an object, an image or a displayed text element, setting a parameter value or selecting a range
- G06F3/04845—Interaction techniques based on graphical user interfaces [GUI] for the control of specific functions or operations, e.g. selecting or manipulating an object, an image or a displayed text element, setting a parameter value or selecting a range for image manipulation, e.g. dragging, rotation, expansion or change of colour
- G—PHYSICS
- G06—COMPUTING OR CALCULATING; COUNTING
- G06F—ELECTRIC DIGITAL DATA PROCESSING
- G06F3/00—Input arrangements for transferring data to be processed into a form capable of being handled by the computer; Output arrangements for transferring data from processing unit to output unit, e.g. interface arrangements
- G06F3/01—Input arrangements or combined input and output arrangements for interaction between user and computer
- G06F3/048—Interaction techniques based on graphical user interfaces [GUI]
- G06F3/0487—Interaction techniques based on graphical user interfaces [GUI] using specific features provided by the input device, e.g. functions controlled by the rotation of a mouse with dual sensing arrangements, or of the nature of the input device, e.g. tap gestures based on pressure sensed by a digitiser
Landscapes
- Engineering & Computer Science (AREA)
- Theoretical Computer Science (AREA)
- General Engineering & Computer Science (AREA)
- Physics & Mathematics (AREA)
- General Physics & Mathematics (AREA)
- Human Computer Interaction (AREA)
- Data Mining & Analysis (AREA)
- Databases & Information Systems (AREA)
- Library & Information Science (AREA)
- Radar Systems Or Details Thereof (AREA)
Abstract
Description
Translated fromChinese技术领域technical field
本发明涉及一种交互式天气雷达样本制作的方法。The invention relates to a method for making interactive weather radar samples.
背景技术Background technique
多普勒天气雷达(下称天气雷达)是一种重要的大气观测工具,它可以实时记录大气粒子的空间分布和物理状态,是气象灾害预报的主要数据来源之一[1-2]。经过多年的业务运行,气象部门积累了大量的天气雷达历史数据。研究如何从海量的历史数据中获取信息对改善现有的气象预报系统具有重要的意义。Doppler weather radar (hereinafter referred to as weather radar) is an important atmospheric observation tool, which can record the spatial distribution and physical state of atmospheric particles in real time, and is one of the main data sources for meteorological disaster forecasting[1-2] . After years of business operation, the meteorological department has accumulated a large amount of historical weather radar data. It is of great significance to study how to obtain information from massive historical data to improve the existing weather forecasting system.
近年来,大数据和人工智能技术得到了蓬勃的发展。其中机器学习技术在气象灾害预报领域逐渐得到了广泛的应用。机器学习技术通过对大量历史数据进行分析,可以发现前人研究中未发现的气象规律,促进气象科学的研究[3];也可以得到更加精准的气象灾害预报模型,提高气象部门的预警能力。In recent years, big data and artificial intelligence technologies have developed vigorously. Among them, machine learning technology has gradually been widely used in the field of meteorological disaster forecasting. By analyzing a large amount of historical data, machine learning technology can find meteorological laws that have not been found in previous studies, and promote the research of meteorological science[3] ; it can also obtain more accurate meteorological disaster forecast models and improve the early warning capabilities of meteorological departments.
虽然机器学习技术可以从大量的气象数据中挖掘出有效的信息,但机器学习技术却无法直接应用于原始的气象数据[4]。其原因在于:气象数据通常具有不同形式的时空分辨率,无法做到完全统一[5];原始的气象数据中包含有大量的与机器学习建模任务无关的信息,需要进行甄别剔除。所以,在将机器学习技术应用于气象数据之前,需要将原始气象数据整理形成可以被机器学习技术(或其它大数据技术)使用的数据样本。Although machine learning technology can mine effective information from a large amount of meteorological data, machine learning technology cannot be directly applied to the original meteorological data[4] . The reason is that meteorological data usually have different forms of temporal and spatial resolution, which cannot be completely unified[5] ; the original meteorological data contains a large amount of information irrelevant to the machine learning modeling task, which needs to be screened out. Therefore, before applying machine learning techniques to meteorological data, it is necessary to organize the raw meteorological data into data samples that can be used by machine learning techniques (or other big data techniques).
发明人在制作样本的过程中,发现了样本制作技术上的需求和不足:In the process of making samples, the inventor discovered the technical needs and deficiencies of sample making:
1.对于大量的天气雷达历史数据进行样本制作,需要有一个统一且便捷的制作流程。1. For sample production of a large amount of weather radar historical data, a unified and convenient production process is required.
2.数据样本的制作本质上是将天气雷达中的某一有效区域和与其对应的天气灾害信息进行匹配并形成统一的记录,但这其中需要人工进行数据的检验和判断。因此样本制作过程中需要对气象数据进行可视化以满足这一需求。2. The production of data samples is essentially to match an effective area in the weather radar with its corresponding weather disaster information and form a unified record, but this requires manual data inspection and judgment. Therefore, it is necessary to visualize meteorological data in the process of sample preparation to meet this demand.
3.对于不同的气象灾害,样本所需要的天气雷达的数据形式是不同的。大致可以分为两类:需要对天气雷达数据进行逐点记录以形成样本;需要对天气雷达某一特定区域记录形成样本。需要对这两类不同形式的样本设计不同的样本制作和记录方法。3. For different meteorological disasters, the data form of the weather radar required by the sample is different. It can be roughly divided into two categories: the weather radar data needs to be recorded point by point to form a sample; the weather radar needs to be recorded in a specific area to form a sample. Different sample preparation and recording methods need to be devised for these two different forms of samples.
参考文献references
[1]傅超,郑钟尧,崔倩,张唯.多普勒天气雷达在人工防雹中的应用研究[J].农业与技术,2019,39(13):150-151.[1] Fu Chao, Zheng Zhongyao, Cui Qian, Zhang Wei. Application of Doppler Weather Radar in Artificial Hail Control [J]. Agriculture and Technology, 2019, 39(13): 150-151.
[2]杨立冰.新一代多普勒天气雷达在人工影响天气中的应用[J].内蒙古科技与经济,2019(09):59.[2] Yang Libing. Application of a new generation of Doppler weather radar in weather modification [J]. Inner Mongolia Science and Technology and Economy, 2019(09):59.
[3]张杰,张思豆,代华.多普勒天气雷达PUP产品强天气监测预警系统设计[J].暴雨灾害,2018,37(05):486-492.[3] Zhang Jie, Zhang Sidou, Dai Hua. Design of Doppler Weather Radar PUP Product Severe Weather Monitoring and Early Warning System [J]. Rainstorm Disaster, 2018, 37(05): 486-492.
[4]彭洁.多普勒天气雷达回波数据可视化技术研究[D].浙江工业大学,2019.[4] Peng Jie. Research on the visualization technology of Doppler weather radar echo data [D]. Zhejiang University of Technology, 2019.
[5]张骞,新一代多普勒天气雷达集成监控平台开发.山东省,山东省气象台,2018-09-12.[5] Zhang Qian, Development of a new generation of Doppler weather radar integrated monitoring platform. Shandong Province, Shandong Meteorological Observatory, 2018-09-12.
发明内容SUMMARY OF THE INVENTION
为了解决现有技术中的问题,本发明提供一种交互式天气雷达样本制作的方法,解决现有技术中数据样本制作流程不统一、无法记录天气雷达数据和灾害实况观测数据的对应关系等问题。In order to solve the problems in the prior art, the present invention provides a method for making an interactive weather radar sample, which solves the problems in the prior art that the data sample making process is not uniform, and the correspondence between weather radar data and disaster observation data cannot be recorded. .
本发明技术方案为:The technical scheme of the present invention is:
一种交互式天气雷达样本制作的方法,包括:A method for interactive weather radar sample production, comprising:
数据准备:数据内容主要由天气雷达数据和灾害实况数据两部分组成,天气雷达数据应按天气过程进行组织,同一个过程中的天气雷达各类型数据应以图像的形式保存,实况数据以文本格式存储,其内容为灾害发生点的经度、纬度坐标以及灾害量级;如果存在候选框,候选框以文本格式存储,其内容包括候选框的序号,左上角点的横、纵坐标及框的宽度、高度;Data preparation: The data content is mainly composed of two parts: weather radar data and disaster live data. Weather radar data should be organized according to the weather process. Various types of weather radar data in the same process should be saved in the form of images, and live data in text format. Stored, the content is the longitude, latitude coordinates and disaster magnitude of the disaster occurrence point; if there is a candidate frame, the candidate frame is stored in text format, and its content includes the sequence number of the candidate frame, the horizontal and vertical coordinates of the upper left corner and the width of the frame ,high;
根据样本标注的不同需求分为逐点标记和区域标记;所述逐点标记为:选择天气雷达数据的过程,页面加载此过程的雷达数据及实况数据,对于需要标记的图像像素点进行标记并保存标记点的横、纵坐标于本地;所述区域标记为:选择天气雷达数据的过程,页面加载此过程的雷达数据、实况数据,将数据可视化为带有候选框的图像,切换该过程的不同时刻的图像并对实况发生处的候选框进行标记;According to the different requirements of sample labeling, it is divided into point-by-point marking and area marking; the point-by-point marking is: the process of selecting weather radar data, loading the radar data and live data of this process on the page, marking the image pixels that need to be marked and Save the horizontal and vertical coordinates of the marked point locally; the area marked as: the process of selecting weather radar data, the page loads the radar data and live data of this process, visualizes the data as an image with a candidate frame, and switches the process of Images at different times and mark the candidate frame where the real situation occurs;
人工校验和修正:完成每一时刻数据的逐点标记和区域标记后,标记的数据会实时保存在数组中,切换时刻后可点击操作栏中的“回看”按钮查看该图像上已标记的数据;当标记错误或想修改时,点击操作栏中的“清屏”按钮即可删去已标记的数据,重新操作;Manual verification and correction: After completing the point-by-point marking and area marking of the data at each moment, the marked data will be saved in the array in real time. After switching the moment, you can click the "Review" button in the operation bar to view the marked on the image. When the mark is wrong or you want to modify it, click the "Clear Screen" button in the operation bar to delete the marked data and operate again;
结果形式:标记的结果以JSON(JavaScript对象简谱)的格式保存在本地,逐点标记生成的JSON文件名为雷达过程名加path,文件内JSON对象的键为此过程内的图像名,JSON对象的值为此图像上标记像素点的横坐标和纵坐标;区域标记生成的JSON文件名为雷达过程名加rect,文件内JSON对象的键为此过程内的图像名,JSON对象的值为此图像上标记的候选框信息,包括候选框的序号、候选框左上角点的横坐标和纵坐标,候选框的高度和宽度。Result form: The marked result is saved locally in JSON (JavaScript Object Notation) format. The JSON file generated by point-by-point marking is named the radar process name plus path, and the key of the JSON object in the file is the image name in the process, and the JSON object The value of this is the abscissa and ordinate of the marked pixel on the image; the JSON file name generated by the area mark is the radar process name plus rect, the key of the JSON object in the file is the image name in the process, and the value of the JSON object is this The candidate frame information marked on the image, including the sequence number of the candidate frame, the abscissa and ordinate of the upper left corner of the candidate frame, and the height and width of the candidate frame.
所述天气雷达数据包含反射率数据,径向速度数据和谱宽数据,被可视化为图像形式,包含:组合反射率图像、天气雷达各仰角反射率图像、天气雷达各仰角径向速度图像;对于需要以区域记录形成的样本,另外包含候选区域坐标文本数据;灾害实况数据是指记录有天气灾害发生时间和地点的文本数据。The weather radar data includes reflectivity data, radial velocity data and spectral width data, which are visualized in the form of images, including: combined reflectivity images, weather radar reflectivity images at various elevation angles, and weather radar radial velocity images at various elevation angles; The samples need to be formed by regional records, and also contain the text data of the coordinates of the candidate regions; the live disaster data refers to the text data that records the time and location of the weather disaster.
实现逐点标记和区域标记各功能的页面通过网页平台最上方的水平导航栏完成切换,水平导航栏中的“图像涂抹”代表逐点标记页面,“单体选择”代表区域标记页面;逐点标记页面和区域标记页面的结构类似,页面的左边是操作栏,实现切换不同类型、时刻、仰角的天气雷达图像和保存、清除标记功能;操作栏的功能按键与键盘按键关联,既可以通过点击网页按键实现操作还可以借助键盘快速操作;页面的中间是图像显示区,页面的右边分为雷达数据选择栏和图像数据信息显示栏,其中数据信息显示栏中的显示数据包括图像的雷达站号、时间、分辨率、以及当前天气雷达图像色标信息。The pages that realize the functions of point-by-point marking and area marking are switched through the horizontal navigation bar at the top of the web platform. The structure of the mark page and the area mark page is similar. The left side of the page is the operation bar, which realizes the functions of switching weather radar images of different types, times, and elevation angles, and saving and clearing the mark; the function keys of the operation bar are associated with the keyboard keys. The web page buttons can also be operated quickly with the help of the keyboard; the middle of the page is the image display area, and the right side of the page is divided into the radar data selection column and the image data information display column, where the display data in the data information display column includes the radar station number of the image. , time, resolution, and color scale information of the current weather radar image.
所述逐点标记具体包括以下步骤:The point-by-point marking specifically includes the following steps:
(1)使用PHP(超文本预处理器)读取预设位置文件夹下的天气雷达数据过程名称,并存放于网页的雷达数据选择栏中等待选择;选取要标记的雷达数据过程后,该过程的天气雷达图像和灾害实况点同时被展示在图像显示区;(1) Use PHP (hypertext preprocessor) to read the weather radar data process name under the preset location folder, and store it in the radar data selection column of the web page for selection; after selecting the radar data process to be marked, the The weather radar image of the process and the hazard live point are simultaneously displayed in the image display area;
(2)从第一个数据起依次浏览,根据实况点当找到需要标记的图像位置时,点击鼠标左键,即可标记该像素点;(2) Browse sequentially from the first data, when finding the image position that needs to be marked according to the live point, click the left button of the mouse to mark the pixel point;
(3)点击操作栏中的“下一时刻”按键切换下一时刻,点击操作栏的“上一时刻”按键切换上一时刻;对一个过程的基数据图像重复步骤(2),当一个过程内需要标记的图像标记完后,点击操作栏中的“保存”按钮即可把此过程内标记的图像名和对应的标记点以JSON格式保存在本地文件夹内;JSON文件以天气雷达数据过程的名字命名,每个JSON对象的键名是过程内各个被标记的图像名,键对应的值即为该图像上标记的像素点;(3) Click the "next moment" button in the operation bar to switch to the next moment, and click the "previous moment" button in the operation bar to switch to the previous moment; repeat step (2) for the basic data image of a process, when a process After marking the images that need to be marked, click the "Save" button in the operation bar to save the image names and corresponding marked points marked in this process in the local folder in JSON format; Named, the key name of each JSON object is the name of each marked image in the process, and the value corresponding to the key is the marked pixel on the image;
(4)在雷达数据选择栏中继续选择要标记的过程,点击“提交”后,重复标记的步骤,直到所有过程被逐点标记完成。(4) Continue to select the process to be marked in the radar data selection column, click "Submit", and repeat the marking steps until all processes are marked point by point.
为了实现快速标记功能,键盘按键代替操作栏按钮,实现下述操作:键盘的“→”按键可切换下一时刻,键盘的“←”按键可切换上一时刻,按键盘的“S”可实现“保存”功能。In order to realize the quick marking function, the keys on the keyboard replace the buttons on the operation bar to realize the following operations: the "→" button on the keyboard can switch to the next moment, the "←" button on the keyboard can switch the previous moment, and the "S" button on the keyboard can realize the following operations: "Save" function.
所述区域标记具体包括以下步骤:The area marking specifically includes the following steps:
(1)使用PHP读取指定位置文件夹下的天气雷达数据过程名称,并存放于网页的雷达数据选择栏中等待选择;(1) Use PHP to read the weather radar data process name under the specified location folder, and store it in the radar data selection column of the webpage for selection;
(2)在样本标记时,不同时刻的图像上会引入该时刻对应的实况点,找到实况点首次出现的图像,标记距离实况点最近的候选框。当鼠标点击的点位于候选框内时,该候选框显示蓝色并被标记;(2) When the sample is marked, the live point corresponding to the time will be introduced into the image at different times, find the image where the live point first appears, and mark the candidate frame closest to the live point. When the mouse clicked point is in the candidate box, the candidate box is displayed in blue and marked;
(3)点击操作栏中的“下一时刻”按键切换下一时刻,点击操作栏的“上一时刻”按键切换上一时刻;切换时刻跟踪标记距离实况点最近的候选框,标记完该过程后,点击操作栏中的“写入”按钮把这一过程中标记的图像名和每个标记的候选框信息以JSON的格式保存在本地;(3) Click the "Next Moment" button in the operation bar to switch to the next moment, and click the "Last Moment" button in the operation bar to switch to the previous moment; the switching moment tracks and marks the candidate box closest to the live point, and marks the process. After that, click the "Write" button in the operation bar to save the marked image name and each marked candidate box information locally in JSON format;
(4)在右侧雷达数据选择栏中继续选择要标记的过程,点击“提交”后,重复上述区域标记的步骤,直到所有过程被标记完成。(4) Continue to select the process to be marked in the radar data selection column on the right, click "Submit", and repeat the above steps of area marking until all processes are marked.
所述操作栏中的按钮被键盘快捷键代替,按键盘的“→”切换下一时刻,按键盘的“←”切换上一时刻,按键盘的“S”实现“写入”功能。The buttons in the operation bar are replaced by keyboard shortcuts. Press "→" on the keyboard to switch to the next moment, press "←" on the keyboard to switch to the previous moment, and press "S" on the keyboard to realize the "write" function.
键盘的“R”和“Backspace”按键分别为操作栏中的“回看”和“清屏”按钮的快捷键。The "R" and "Backspace" keys of the keyboard are the shortcut keys for the "Review" and "Clear Screen" buttons in the operation bar, respectively.
与现有技术相比,本发明的有益效果是:Compared with the prior art, the beneficial effects of the present invention are:
本发明使用统一的操作流程对大规模雷达数据进行标记,标记过程中借助键盘快捷键操作以达到便捷的目的。在样本制作的过程中,天气雷达数据和灾害信息相匹配并以图像的形式呈现于网页之上,实现了气象数据可视化的需求。在此基础上,本发明针对不同形式的样本需求设计了两种标记功能,分别为逐点标记和区域标记,以此满足和弥补样本制作技术上的上述需求和不足。The invention uses a unified operation flow to mark large-scale radar data, and uses keyboard shortcut keys to achieve the purpose of convenience in the marking process. In the process of sample making, the weather radar data and disaster information are matched and presented on the web page in the form of images, which fulfills the demand for visualization of meteorological data. On this basis, the present invention designs two marking functions for different forms of sample requirements, namely point-by-point marking and area marking, so as to meet and make up for the above requirements and deficiencies in sample making technology.
本发明方法采用交互式的形式,可以记录天气雷达数据和灾害实况观测数据的对应关系,为后续基于大数据的气象灾害预报研究提供基础。The method of the invention adopts an interactive form, can record the corresponding relationship between the weather radar data and the real disaster observation data, and provides a basis for subsequent research on meteorological disaster prediction based on big data.
附图说明Description of drawings
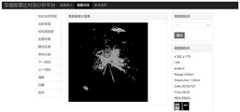
图1为本发明在天气雷达数据图像上的逐点标记,显示蓝色的为标记的点;Fig. 1 is the point-by-point marking of the present invention on the weather radar data image, and the blue points are marked;
图2为本发明回看天气雷达数据图像上已逐点标记的像素点,显示为白色的点为已标记的点;Fig. 2 is the pixel point that has been marked point by point on the weather radar data image of the present invention, and the point displayed as white is the marked point;
图3为本发明逐点标记生成的JSON文件,记录了图片名字和标记点的横坐标、纵坐标;Fig. 3 is the JSON file that the present invention is marked point by point and generates, has recorded the abscissa and ordinate of picture name and mark point;
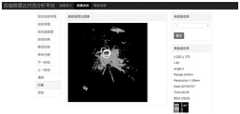
图4为本发明在带有候选框的图像上的区域标记,白色的圈为实况发生地点,蓝色的框为已标记的候选框;Fig. 4 is the area mark on the image with candidate frame of the present invention, the white circle is the live place, and the blue frame is the marked candidate frame;
图5为本发明回看已经区域标记的图像,白色的圈为实况发生地点,绿色的框为已经标记过的候选框;Fig. 5 is the present invention to look back at the image marked with the area, the white circle is the live place, and the green frame is the candidate frame that has been marked;
图6为本发明区域标记生成的JSON文件,记录了图片名字和标记框的序号、位置信息;Fig. 6 is the JSON file that the area mark of the present invention is generated, has recorded the serial number and position information of picture name and mark frame;
图7为本发明逐点标记的流程图;Fig. 7 is the flow chart of point-by-point marking of the present invention;
图8为本发明区域标记的流程图。FIG. 8 is a flow chart of area marking according to the present invention.
具体实施方式Detailed ways
下面结合附图和具体实施例对本发明技术方案作进一步详细描述,所描述的具体实施例仅对本发明进行解释说明,并不用以限制本发明。The technical solutions of the present invention will be described in further detail below with reference to the accompanying drawings and specific embodiments. The described specific embodiments are only used to explain the present invention, and are not intended to limit the present invention.
逐点标记:如图7所示;Point-by-point marking: as shown in Figure 7;
1-1选择标记过程1-1 Selection Marking Process
雷达数据以图片的形式,按照灾害实况时间组织成过程,放在“USBWebserver\root\radar”文件夹下(以下简称文件夹)。PHP读取文件夹下的全部雷达数据过程的文件名,形成列表在网页右侧的雷达数据选择栏中显示。用户选择要标定的数据过程,点击提交,页面刷新后列表仍显示刚才选择的过程,直到下一次重新选择并点击提交后才会更改。The radar data is organized into processes in the form of pictures and according to the real time of the disaster, and placed in the "USBWebserver\root\radar" folder (hereinafter referred to as the folder). PHP reads the file names of all radar data processes under the folder, and forms a list and displays it in the radar data selection bar on the right side of the web page. The user selects the data process to be calibrated and clicks submit. After the page is refreshed, the list will still display the process just selected, and it will not be changed until the next re-select and click submit.
1-2读取数据及实况1-2 Read data and live
选择的雷达过程名以表单的形式传递给PHP,PHP调用后端读取雷达数据的exe程序,被选中过程中的雷达数据和实况数据可视化处理为组合反射率图、径向速度图。可视化后的图像及实况数据的文本文件被储存在本地,供前端显示时调用。The selected radar process name is passed to PHP in the form of a form, and PHP calls the back-end exe program to read radar data. The radar data and live data in the selected process are visualized as a combined reflectance map and radial velocity map. The visualized images and text files of live data are stored locally and are called when displayed by the front-end.
1-3鼠标标记像素点1-3 mouse mark pixel point
根据实况点找到需要逐点标记的雷达图片,对目标位置按下鼠标左键即可标记像素点,被标记的像素点以蓝色显示。Canvas配合JavaScript自动记录被标记图像的名字和标记的像素点坐标形成JSON对象,方便后续回看和写入操作。Find the radar image that needs to be marked point by point according to the live point, press the left mouse button on the target position to mark the pixel point, and the marked pixel point is displayed in blue. Canvas cooperates with JavaScript to automatically record the name of the marked image and the coordinates of the marked pixel to form a JSON object, which is convenient for subsequent review and writing operations.
1-4是否需要更改标记1-4 Does the marker need to be changed?
如果标记错误,只需要点击页面左侧操作栏中的“清屏”按钮或是键盘按下“Backspace”,即可清空已标记的像素点,以待重新标记。If the marking is wrong, just click the "Clear Screen" button in the operation bar on the left side of the page or press "Backspace" on the keyboard to clear the marked pixels for re-marking.
1-5切换不同时刻的雷达图像1-5 Switch radar images at different times
点击操作栏中的“下一时刻”按钮可切换到下一时刻的该类型图像,点击操作栏中的“上一时刻”按钮可切换到上一时刻。键盘上“→”和“←”按键可代替操作栏中的“下一时刻”和“上一时刻”按钮,实现快速切换。Click the "Next Moment" button in the operation bar to switch to this type of image at the next moment, and click the "Previous Moment" button in the operation bar to switch to the previous moment. The "→" and "←" buttons on the keyboard can replace the "next moment" and "previous moment" buttons in the operation bar to achieve quick switching.
1-6回看已标记像素点1-6 Look back at the marked pixels
如果切换到已经标记的图像时,点击操作栏中的“回看”按钮或是按下键盘的“R”键,JavaScript会调用JSON对象中该图像名对应的值,用白色将标记过的像素点重新显示在网页图像中。If you switch to a marked image, click the "Review" button in the operation bar or press the "R" key of the keyboard, JavaScript will call the value corresponding to the image name in the JSON object, and use white to mark the pixels. The point reappears in the web page image.
1-7是否全部标完Whether 1-7 are all marked
当此刻图像是最后一张图或是第一张图时,切换下一时刻或上一时刻,网页会弹窗提示“这是最后一个时刻”或是“这是第一个时刻”,借此判断是否已标记完该过程内所有时刻的样本。When the image at this moment is the last image or the first image, switch to the next or previous moment, the webpage will pop up a window prompting "This is the last moment" or "This is the first moment". Determine whether the samples at all times in the process have been marked.
1-8生成标记文件1-8 Generate markup file
当标记完此过程的样本后点击操作栏中的“保存”按钮或是键盘按下“S”键,可将之前标记时生成的JSON对象通过AJAX(异步JavaScript和可扩展标记语言)传递给PHP,PHP接收后写入到本地save文件夹下。文件名为雷达过程名加“path”字符,文件类型为JSON。至此,逐点标记一个过程的样本数据已经完成,可继续选择不同过程的样本,重复上述操作,完成所有样本的逐点标记工作。After marking the sample of this process, click the "Save" button in the operation bar or press the "S" key on the keyboard, and the JSON object generated during the previous marking can be passed to PHP through AJAX (Asynchronous JavaScript and Extensible Markup Language) , PHP will write it to the local save folder after receiving it. The file name is the radar process name plus "path" characters, and the file type is JSON. So far, the point-by-point marking of the sample data of one process has been completed, and you can continue to select samples of different processes, and repeat the above operations to complete the point-by-point marking of all samples.
区域标记:如图8所示;Area marking: as shown in Figure 8;
2-1选择标记过程2-1 Selection Marking Process
雷达数据以图片的形式,按照灾害实况时间组织成过程,放在“USBWebserver\root\radar”文件夹下(以下简称文件夹)。PHP读取文件夹下的全部雷达数据过程的文件名,形成列表在网页右侧的雷达数据选择栏中显示。用户选择要标定的数据过程,点击提交,页面刷新后列表仍显示刚才选择的过程,直到下一次重新选择并点击提交后才会更改。The radar data is organized into processes in the form of pictures and according to the real time of the disaster, and placed in the "USBWebserver\root\radar" folder (hereinafter referred to as the folder). PHP reads the file names of all radar data processes under the folder, and forms a list and displays it in the radar data selection bar on the right side of the web page. The user selects the data process to be calibrated and clicks submit. After the page is refreshed, the list will still display the process just selected, and it will not be changed until the next re-select and click submit.
2-2生成图像和候选框信息的txt2-2 Generate txt for image and candidate box information
选择的雷达过程名以表单的形式传递给PHP,PHP调用后端读取雷达数据的Python程序,生成图像和候选框的文本文件。图像及候选框的文本文件被储存在本地,供前端显示时调用。带有候选框的图像将雷达数据和实况数据以图像形式可视化在网页,方便标记时使用。The selected radar process name is passed to PHP in the form of a form, and PHP calls the back-end Python program that reads radar data to generate text files of images and candidate boxes. The text files of images and candidate boxes are stored locally and are called when displayed by the front end. The image with candidate box visualizes radar data and live data on the web page in the form of images, which is convenient for marking.
2-3找到实况发生的时刻2-3 Find the moment when the reality is happening
实况发生点以一个白圈的形式在图像上显示,切换时刻找到该过程中实况首次出现的图像。点击操作栏中的“下一时刻”按钮可切换到下一时刻,点击操作栏中的“上一时刻”按钮可切换到上一时刻。键盘上“→”和“←”按键可代替操作栏中的“下一时刻”和“上一时刻”按钮,实现快速切换。The live occurrence point is shown on the image as a white circle, and the switching moment finds the image where the live first appeared in the process. Click the "next moment" button in the operation bar to switch to the next moment, and click the "previous moment" button in the operation bar to switch to the previous moment. The "→" and "←" buttons on the keyboard can replace the "next moment" and "previous moment" buttons in the operation bar to achieve quick switching.
2-4标记离实况最近的候选框2-4 Mark the candidate boxes closest to the real world
当鼠标在图像上左键点击时,会根据txt中候选框的位置信息与鼠标点击的点作对比,若点击处位于候选框内时会在图像上用蓝色将该框画出,若点击处不在该图任意一个候选框内则无响应。选择离实况最近的候选框,点击该候选框内的任意一点标记该区域,这个区域就是与实况关联最紧密的区域。When the mouse left-clicks on the image, the position information of the candidate frame in the txt will be compared with the point clicked by the mouse. If the clicked place is within the candidate frame, the frame will be drawn in blue on the image. There is no response if it is not in any candidate box in the graph. Select the candidate box closest to the reality, click any point in the candidate box to mark the area, and this area is the area most closely related to the reality.
2-5切换时刻,跟踪候选框并标记2-5 switch moments, track candidate boxes and mark
切换上一时刻和下一时刻,跟踪这一候选框从生成到消失的全过程,并将它们全部选中。当选中该框时,Canvas配合JavaScript自动记录被标记图像的名字和标记的候选框的信息,形成JSON对象,方便后续回看和写入操作。Switch between the previous moment and the next moment, track the whole process of this candidate box from generation to disappearance, and select them all. When this box is selected, Canvas cooperates with JavaScript to automatically record the name of the marked image and the information of the marked candidate box to form a JSON object, which is convenient for subsequent review and writing operations.
2-6点回看查看已标记Check back at 2-6 o'clock View marked
如果切换到已经标记的图像时,点击“回看”按钮或是按下键盘的“R”键,JavaScript会调用JSON对象中该图像名对应的标记,用绿色将标记过的候选框重新显示在网页图像中。If you switch to a marked image, click the "Review" button or press the "R" key of the keyboard, JavaScript will call the mark corresponding to the image name in the JSON object, and redisplay the marked candidate box in green. in web images.
2-7是否全部标记完Whether 2-7 are all marked
当此刻图像是最后一张图或是第一张图时,切换下一时刻或上一时刻,网页会弹窗提示“这是最后一个时刻”或是“这是第一个时刻”,借此检查是否已将该过程内所有时刻的样本都浏览过,避免发生遗漏。When the image at this moment is the last image or the first image, switch to the next or previous moment, and the webpage will pop up a window prompting "This is the last moment" or "This is the first moment". Check that samples at all times in the process have been browsed to avoid omissions.
2-8生成标记文件2-8 Generate markup file
当标记完此过程的样本后点击“写入”按钮或是键盘按下“S”键,可将之前标记时生成的JSON对象通过AJAX传递给PHP,PHP接收后写入到本地save文件夹下,文件名为雷达过程名加“rect”字符,文件类型为JSON。至此,区域标记一个过程的样本数据已经完成,可继续选择不同过程的样本,重复上述操作,完成所有区域标记工作。After marking the sample of this process, click the "Write" button or press the "S" key on the keyboard, the JSON object generated during the previous marking can be passed to PHP through AJAX, and PHP will write it to the local save folder after receiving it. , the file name is the radar process name plus "rect" characters, and the file type is JSON. So far, the sample data of one process of region marking has been completed, and you can continue to select samples of different processes, repeat the above operation, and complete all the region marking work.
尽管上面结合附图对本发明进行了描述,但是本发明并不局限于上述的具体实施方式,上述的具体实施方式仅仅是示意性的,而不是限制性的,本领域的普通技术人员在本发明的启示下,在不脱离本发明宗旨的情况下,还可以做出很多变形,这些均属于本发明的保护之内。Although the present invention has been described above in conjunction with the accompanying drawings, the present invention is not limited to the above-mentioned specific embodiments, which are merely illustrative rather than restrictive. Under the inspiration of the present invention, many modifications can be made without departing from the spirit of the present invention, which all belong to the protection of the present invention.
Claims (7)
Translated fromChinesePriority Applications (1)
| Application Number | Priority Date | Filing Date | Title |
|---|---|---|---|
| CN202110008987.1ACN112835482B (en) | 2021-01-05 | 2021-01-05 | A Method for Making Interactive Weather Radar Samples |
Applications Claiming Priority (1)
| Application Number | Priority Date | Filing Date | Title |
|---|---|---|---|
| CN202110008987.1ACN112835482B (en) | 2021-01-05 | 2021-01-05 | A Method for Making Interactive Weather Radar Samples |
Publications (2)
| Publication Number | Publication Date |
|---|---|
| CN112835482A CN112835482A (en) | 2021-05-25 |
| CN112835482Btrue CN112835482B (en) | 2022-06-14 |
Family
ID=75925923
Family Applications (1)
| Application Number | Title | Priority Date | Filing Date |
|---|---|---|---|
| CN202110008987.1AActiveCN112835482B (en) | 2021-01-05 | 2021-01-05 | A Method for Making Interactive Weather Radar Samples |
Country Status (1)
| Country | Link |
|---|---|
| CN (1) | CN112835482B (en) |
Citations (11)
| Publication number | Priority date | Publication date | Assignee | Title |
|---|---|---|---|---|
| US5363107A (en)* | 1993-07-16 | 1994-11-08 | Massachusetts Institute Of Technology | Storage and transmission of compressed weather maps and the like |
| CN102855658A (en)* | 2012-07-17 | 2013-01-02 | 天津大学 | Three-dimensional reconstruction method based on meteorological radar base data |
| CN105466440A (en)* | 2015-11-18 | 2016-04-06 | 爱国者电子科技有限公司 | Navigation device for optimizing routes by utilization of weather forecast information, navigation system and method |
| CN107273492A (en)* | 2017-06-15 | 2017-10-20 | 复旦大学 | A kind of exchange method based on mass-rent platform processes image labeling task |
| CN108665486A (en)* | 2018-03-31 | 2018-10-16 | 天津大学 | A kind of labeling method of strong convection monomer sample |
| CN109446369A (en)* | 2018-09-28 | 2019-03-08 | 武汉中海庭数据技术有限公司 | The exchange method and system of the semi-automatic mark of image |
| CN109471128A (en)* | 2018-08-30 | 2019-03-15 | 福瑞泰克智能系统有限公司 | A kind of positive sample production method and device |
| CN109613540A (en)* | 2018-12-25 | 2019-04-12 | 江苏省气象信息中心(江苏省气象档案馆) | A kind of Doppler radar three-dimensional visualization method based on WebGL |
| CN109683170A (en)* | 2018-12-27 | 2019-04-26 | 驭势科技(北京)有限公司 | A kind of image traveling area marking method, apparatus, mobile unit and storage medium |
| CN109949907A (en)* | 2019-03-29 | 2019-06-28 | 西安交通大学 | Cloud-based collaborative annotation method and system for large-scale pathology images |
| CN111161303A (en)* | 2019-12-30 | 2020-05-15 | 上海眼控科技股份有限公司 | Marking method, marking device, computer equipment and storage medium |
- 2021
- 2021-01-05CNCN202110008987.1Apatent/CN112835482B/enactiveActive
Patent Citations (11)
| Publication number | Priority date | Publication date | Assignee | Title |
|---|---|---|---|---|
| US5363107A (en)* | 1993-07-16 | 1994-11-08 | Massachusetts Institute Of Technology | Storage and transmission of compressed weather maps and the like |
| CN102855658A (en)* | 2012-07-17 | 2013-01-02 | 天津大学 | Three-dimensional reconstruction method based on meteorological radar base data |
| CN105466440A (en)* | 2015-11-18 | 2016-04-06 | 爱国者电子科技有限公司 | Navigation device for optimizing routes by utilization of weather forecast information, navigation system and method |
| CN107273492A (en)* | 2017-06-15 | 2017-10-20 | 复旦大学 | A kind of exchange method based on mass-rent platform processes image labeling task |
| CN108665486A (en)* | 2018-03-31 | 2018-10-16 | 天津大学 | A kind of labeling method of strong convection monomer sample |
| CN109471128A (en)* | 2018-08-30 | 2019-03-15 | 福瑞泰克智能系统有限公司 | A kind of positive sample production method and device |
| CN109446369A (en)* | 2018-09-28 | 2019-03-08 | 武汉中海庭数据技术有限公司 | The exchange method and system of the semi-automatic mark of image |
| CN109613540A (en)* | 2018-12-25 | 2019-04-12 | 江苏省气象信息中心(江苏省气象档案馆) | A kind of Doppler radar three-dimensional visualization method based on WebGL |
| CN109683170A (en)* | 2018-12-27 | 2019-04-26 | 驭势科技(北京)有限公司 | A kind of image traveling area marking method, apparatus, mobile unit and storage medium |
| CN109949907A (en)* | 2019-03-29 | 2019-06-28 | 西安交通大学 | Cloud-based collaborative annotation method and system for large-scale pathology images |
| CN111161303A (en)* | 2019-12-30 | 2020-05-15 | 上海眼控科技股份有限公司 | Marking method, marking device, computer equipment and storage medium |
Non-Patent Citations (3)
| Title |
|---|
| A Velocity Dealiasing Scheme Based on Minimization of Velocity Differences between Regions;Yuan Yue;《Advances in Meteorology》;20201231;全文* |
| Radar-Based Automatic Identifi-;Shi Junzhi;《Atmosphere》;20191231;全文* |
| 适于地域特点的强对流天气分类识别建模方法研究;吕伟;《中国优秀硕士学位论文全文数据库信息科技辑》;20200615;第1-50页* |
Also Published As
| Publication number | Publication date |
|---|---|
| CN112835482A (en) | 2021-05-25 |
Similar Documents
| Publication | Publication Date | Title |
|---|---|---|
| Wulder et al. | Comparison of airborne and satellite high spatial resolution data for the identification of individual trees with local maxima filtering | |
| CN107967702B (en) | The thermodynamic chart method for visualizing of reverse color applying drawing | |
| US8872846B2 (en) | Interactive virtual weather map | |
| CN111738111A (en) | A Road Extraction Method Based on Multi-branch Cascaded Hole Spatial Pyramid for High Resolution Remote Sensing Images | |
| CN109858414A (en) | An Invoice Block Detection Method | |
| JP5276927B2 (en) | Inundation prediction device | |
| CN112016247A (en) | High-precision future hydrological process coupling model based on land use change and construction method | |
| CN107506499A (en) | The method, apparatus and server of logical relation are established between point of interest and building | |
| CN108830413A (en) | A kind of the visualization prediction technique and system of building energy consumption | |
| Tripp Corbin | Learning ArcGIS Pro | |
| CN117746239A (en) | Environment element extraction and pre-evaluation method, system, equipment and storage medium | |
| CN115830073A (en) | Map element reconstruction method, map element reconstruction device, computer equipment and storage medium | |
| CN112835482B (en) | A Method for Making Interactive Weather Radar Samples | |
| CN102708167B (en) | Web-based semantic annotation system and Web-based semantic annotation method for high resolution SAR (synthetic aperture radar) image interpretation | |
| Wellmann et al. | From google earth to 3D geology problem 2: seeing below the surface of the digital earth | |
| CN115527027A (en) | Remote sensing image ground object segmentation method based on multi-feature fusion mechanism | |
| CN116152503B (en) | Street view-oriented online extraction method and system of urban sky visual domain | |
| CN116703822A (en) | Transmission line insulation damage detection method, model training method, device and equipment | |
| CN114863274A (en) | Surface green net thatch cover extraction method based on deep learning | |
| CN107944767A (en) | Selecting address on building method and its system based on BIM and electronic map | |
| CN116258295A (en) | An Urban Sign Diagnosis Method for Urban Renewal | |
| CN108614657A (en) | Image combining method, device, equipment and its image-carrier | |
| Pirnazar et al. | Land use change detection and prediction using Markov-CA and publishing on the web with platform map server, case study: Qom Metropolis, Iran | |
| KR101028767B1 (en) | How to Update Geographic Image Information | |
| JP2006259940A (en) | Statistical information presentation device |
Legal Events
| Date | Code | Title | Description |
|---|---|---|---|
| PB01 | Publication | ||
| PB01 | Publication | ||
| SE01 | Entry into force of request for substantive examination | ||
| SE01 | Entry into force of request for substantive examination | ||
| GR01 | Patent grant | ||
| GR01 | Patent grant | ||
| TR01 | Transfer of patent right | ||
| TR01 | Transfer of patent right | Effective date of registration:20240321 Address after:4-1-101, Ligangyuan, Shuanggang Industrial Zone, Shuanggang Town, Jinnan District, Tianjin City Patentee after:CONTROL (TIANJIN) INDUSTRIAL AUTOMATION TECHNOLOGY CO.,LTD. Country or region after:China Address before:300072 Tianjin City, Nankai District Wei Jin Road No. 92 Patentee before:Tianjin University Country or region before:China | |
| CP03 | Change of name, title or address | ||
| CP03 | Change of name, title or address | Address after:4-1-101, Ligangyuan, Shuanggang Industrial Zone, Shuanggang Town, Jinnan District, Tianjin City Patentee after:Kento Intelligent Equipment (Tianjin) Group Co.,Ltd. Country or region after:China Address before:4-1-101, Ligangyuan, Shuanggang Industrial Zone, Shuanggang Town, Jinnan District, Tianjin City Patentee before:CONTROL (TIANJIN) INDUSTRIAL AUTOMATION TECHNOLOGY CO.,LTD. Country or region before:China |