CN112819340B - A dynamic assessment method of urban flood disaster based on multi-source data - Google Patents
A dynamic assessment method of urban flood disaster based on multi-source dataDownload PDFInfo
- Publication number
- CN112819340B CN112819340BCN202110152855.6ACN202110152855ACN112819340BCN 112819340 BCN112819340 BCN 112819340BCN 202110152855 ACN202110152855 ACN 202110152855ACN 112819340 BCN112819340 BCN 112819340B
- Authority
- CN
- China
- Prior art keywords
- data
- flood
- population
- disaster
- map
- Prior art date
- Legal status (The legal status is an assumption and is not a legal conclusion. Google has not performed a legal analysis and makes no representation as to the accuracy of the status listed.)
- Active
Links
Images
Classifications
- G—PHYSICS
- G06—COMPUTING OR CALCULATING; COUNTING
- G06Q—INFORMATION AND COMMUNICATION TECHNOLOGY [ICT] SPECIALLY ADAPTED FOR ADMINISTRATIVE, COMMERCIAL, FINANCIAL, MANAGERIAL OR SUPERVISORY PURPOSES; SYSTEMS OR METHODS SPECIALLY ADAPTED FOR ADMINISTRATIVE, COMMERCIAL, FINANCIAL, MANAGERIAL OR SUPERVISORY PURPOSES, NOT OTHERWISE PROVIDED FOR
- G06Q10/00—Administration; Management
- G06Q10/06—Resources, workflows, human or project management; Enterprise or organisation planning; Enterprise or organisation modelling
- G06Q10/063—Operations research, analysis or management
- G06Q10/0639—Performance analysis of employees; Performance analysis of enterprise or organisation operations
- G—PHYSICS
- G06—COMPUTING OR CALCULATING; COUNTING
- G06Q—INFORMATION AND COMMUNICATION TECHNOLOGY [ICT] SPECIALLY ADAPTED FOR ADMINISTRATIVE, COMMERCIAL, FINANCIAL, MANAGERIAL OR SUPERVISORY PURPOSES; SYSTEMS OR METHODS SPECIALLY ADAPTED FOR ADMINISTRATIVE, COMMERCIAL, FINANCIAL, MANAGERIAL OR SUPERVISORY PURPOSES, NOT OTHERWISE PROVIDED FOR
- G06Q50/00—Information and communication technology [ICT] specially adapted for implementation of business processes of specific business sectors, e.g. utilities or tourism
- G06Q50/10—Services
- G06Q50/26—Government or public services
- Y—GENERAL TAGGING OF NEW TECHNOLOGICAL DEVELOPMENTS; GENERAL TAGGING OF CROSS-SECTIONAL TECHNOLOGIES SPANNING OVER SEVERAL SECTIONS OF THE IPC; TECHNICAL SUBJECTS COVERED BY FORMER USPC CROSS-REFERENCE ART COLLECTIONS [XRACs] AND DIGESTS
- Y02—TECHNOLOGIES OR APPLICATIONS FOR MITIGATION OR ADAPTATION AGAINST CLIMATE CHANGE
- Y02A—TECHNOLOGIES FOR ADAPTATION TO CLIMATE CHANGE
- Y02A10/00—TECHNOLOGIES FOR ADAPTATION TO CLIMATE CHANGE at coastal zones; at river basins
- Y02A10/40—Controlling or monitoring, e.g. of flood or hurricane; Forecasting, e.g. risk assessment or mapping
Landscapes
- Business, Economics & Management (AREA)
- Human Resources & Organizations (AREA)
- Engineering & Computer Science (AREA)
- Strategic Management (AREA)
- Educational Administration (AREA)
- Economics (AREA)
- Development Economics (AREA)
- Tourism & Hospitality (AREA)
- General Business, Economics & Management (AREA)
- Theoretical Computer Science (AREA)
- Marketing (AREA)
- Physics & Mathematics (AREA)
- Entrepreneurship & Innovation (AREA)
- General Physics & Mathematics (AREA)
- Health & Medical Sciences (AREA)
- General Health & Medical Sciences (AREA)
- Primary Health Care (AREA)
- Game Theory and Decision Science (AREA)
- Operations Research (AREA)
- Quality & Reliability (AREA)
- Management, Administration, Business Operations System, And Electronic Commerce (AREA)
- Alarm Systems (AREA)
Abstract
Description
Translated fromChinese技术领域technical field
本发明涉及一种基于多源数据的城市洪涝灾害动态评估方法,是一种数字计算应用于水文计算的方法,是一种洪涝灾害损失的评估方法,是一种洪涝灾害对人口、交通影响的动态评估方法。The invention relates to a dynamic evaluation method for urban flood disasters based on multi-source data, which is a method for applying digital calculation to hydrological calculation, an evaluation method for flood disaster losses, and a method for evaluating the impact of flood disasters on population and traffic. Dynamic evaluation method.
背景技术Background technique
受全球气候异常变化和人类社会经济活动的影响,极端降水事件频发,洪涝灾害己成为世界上最频繁的自然灾害。而高度城镇化带来的人口大量汇集和社会经济活动的高度集中,也加大了洪涝灾害的损失。合理、有效的评估洪涝灾害损失,对于城市洪涝灾害预警预报、灾情管理等方面具有重要意义。现有洪涝灾害损失的评估方法多为静态评估,即通过特定年份的经济、人口等承灾体的空间展布数据,将之与淹没区相叠加,对相应的损失进行评估。这类方法存在一定的局限性,在某种给定的暴雨情景下,无论洪涝灾害发生在什么时刻,所得损失均为定值。实际上,洪涝灾害发生的时间点(日间/夜间、工作日/非工作日、高峰期/平峰期)不同,所造成的损失也必然有所差异,如何全面的动态的评估洪涝灾害是一个需要解决的问题。Affected by abnormal changes in global climate and human social and economic activities, extreme precipitation events occur frequently, and flood disasters have become the most frequent natural disasters in the world. The high concentration of population and high concentration of social and economic activities brought about by high urbanization has also increased the loss of flood disasters. Reasonable and effective assessment of flood disaster losses is of great significance for urban flood disaster early warning and forecasting, disaster management and other aspects. The existing assessment methods for flood disaster losses are mostly static assessments, that is, through the spatial distribution data of disaster-bearing bodies such as the economy and population in a specific year, superimpose it with the submerged area to assess the corresponding losses. This kind of method has certain limitations. Under a given rainstorm scenario, no matter when the flood disaster occurs, the loss is a fixed value. In fact, the time points of flood disasters (day/night, working days/non-working days, peak period/peak period) are different, and the losses caused will also be different. How to comprehensively and dynamically evaluate flood disasters is a issues that need resolving.
发明内容SUMMARY OF THE INVENTION
为了克服现有技术的问题,本发明提出了一种基于多源数据的城市洪涝灾害动态评估方法。所述的动态评估方法可以减少因洪涝灾害发生时间不同所带来了评估误差,有效提高评估精度,有助于防灾减灾的决策部署,提高城市韧性。In order to overcome the problems of the prior art, the present invention proposes a method for dynamic assessment of urban flood disasters based on multi-source data. The dynamic evaluation method can reduce the evaluation errors caused by the different occurrence times of flood disasters, effectively improve the evaluation accuracy, help the decision-making and deployment of disaster prevention and mitigation, and improve urban resilience.
本发明的目的是这样实现的:一种基于多源数据的城市洪涝灾害动态评估方法,包括以下步骤:The purpose of the present invention is to realize in this way: a kind of urban flood disaster dynamic assessment method based on multi-source data, comprises the following steps:
步骤1,实时数据采集:对多种承灾体采用网络爬虫从至少两个数字地图供应商处进行实时数据采集;Step 1, real-time data collection: use web crawlers to collect real-time data from at least two digital map suppliers for various disaster-affected bodies;
步骤2,空间化处理:对数据进行空间化处理,包括:人口热力图分区与空间展布、道路分级处理与通行速度空间展布;Step 2, spatial processing: spatial processing of data, including: population heat map partition and spatial distribution, road classification processing and traffic speed spatial distribution;
步骤3,建立洪涝灾害承灾体数据集:建立不同时刻人口热力图数据集和通行速度的空间分布数据集;Step 3, establish a flood disaster-affected body data set: establish a population heat map data set and a spatial distribution data set of traffic speeds at different times;
步骤4,模拟淹没过程:利用城市雨洪模型模拟洪涝淹没过程;Step 4, simulate the inundation process: use the urban rainwater model to simulate the flood inundation process;
步骤5,人口受灾模拟:根据淹没水深分布计算不同时刻热力值分区的人口受灾面积;Step 5. Population disaster simulation: Calculate the population disaster area of the thermal value partition at different times according to the submerged water depth distribution;
步骤6,计算暴雨洪涝时的通行速度:根据淹没水深分布计算暴雨洪涝影响下不同时刻的通行速度;Step 6: Calculate the traffic speed during the rainstorm and flood: Calculate the traffic speed at different times under the influence of the storm and flood according to the submerged water depth distribution;
步骤7,分析差异:分析不同时刻洪涝灾害对于人口、交通影响的差异;Step 7, analyze differences: analyze the differences in the impact of flood disasters on population and traffic at different times;
步骤8,生成动态评估结果:将分析数据汇总,生成洪涝灾害损失的动态评估结果。Step 8, generate dynamic assessment results: summarize the analysis data to generate dynamic assessment results of flood disaster losses.
进一步的,步骤3中所述的人口热力图数据集采集流程包括以下子步骤:Further, the population heat map dataset collection process described in step 3 includes the following sub-steps:
①手机操作系统模拟器使用http协议调试代理工具进行数字地图数据抓取的操作;①The mobile phone operating system simulator uses the http protocol debugging proxy tool to capture the digital map data;
②分析http协议调试代理工具回传的数据;②Analyze the data returned by the http protocol debugging proxy tool;
③设置采集范围的坐标、地图放大级别以及定时采集时间;③ Set the coordinates of the collection range, the map zoom level and the timing collection time;
④取得数字地图供应商服务器缓存中的瓦片文件,回传保存到本地;④ Obtain the tile file in the cache of the digital map provider server, and send it back and save it locally;
⑤自动拼接瓦片形成完整热力图。⑤ Automatically splicing tiles to form a complete heat map.
进一步的,步骤3中所述的通行速度的空间分布数据集,包括以下子步骤:Further, the spatial distribution data set of traffic speed described in step 3 includes the following sub-steps:
路网获取:采用开源地图OSM数据作为道路数据的来源,根据遥感影像资料并利用地理信息系统,修复道路通行方向和连通性;Road network acquisition: using open source map OSM data as the source of road data, and using geographic information systems based on remote sensing image data to restore road traffic directions and connectivity;
OD点(起点-终点)获取:根据开源地图数据的相关属性将研究区的道路划分为5类:快速路、一级路、二级路、三级路和支路,并获取OD点经纬坐标;OD point (start-point) acquisition: According to the relevant attributes of the open source map data, the roads in the study area are divided into 5 categories: expressways, first-class roads, second-class roads, third-class roads and branch roads, and the latitude and longitude coordinates of the OD point are obtained. ;
通行速度定时获取:通过编制定时器和设置参数,利用至少两家数字地图供应商所提供的API开放平台获得途经路段长度及相应的通行时间,并进一步的计算各个时段的通行速度,所述的参数包括:OD点经纬度、坐标类型、返回类型、AK密钥。Timing acquisition of traffic speed: By programming timers and setting parameters, using the API open platform provided by at least two digital map suppliers to obtain the length of the passing road section and the corresponding traffic time, and further calculate the traffic speed of each period, the said Parameters include: OD point latitude and longitude, coordinate type, return type, AK key.
进一步的,步骤5中所述的人口受灾模拟包括如下子步骤:Further, the population disaster simulation described in step 5 includes the following sub-steps:
重采样:利用重采样工具,将矢量化的人口热力图与淹没水深图重采样成像元大小一致的栅格数据;Resampling: Use resampling tools to resample vectorized population heatmaps and inundation bathymetry images into raster data with the same cell size;
淹没区划分:根据淹没水深的大小划定不同的洪涝风险等级;Inundation area division: according to the size of the submerged water depth, different flood risk levels are delineated;
计算受灾人口:利用栅格计算器工具,将淹没风险分区图和人口热力图叠加,统计不同淹没风险分区下,不同热力值分区的受灾面积。Calculate the affected population: Use the grid calculator tool to superimpose the inundation risk zoning map and the population heat map to count the affected areas of different inundation risk zones and zones with different thermal values.
进一步的,步骤6所述的计算暴雨洪涝时的通行速度包括如下子步骤:Further, the calculation of the traffic speed during the rainstorm and flood described in step 6 includes the following sub-steps:
栅格化处理:利用折线转栅格工具,根据淹没图层对道路图层进行栅格化处理,获得栅格化的通行速度图层;Rasterization: Use the polyline to raster tool to rasterize the road layer according to the submerged layer to obtain a rasterized traffic speed layer;
计算通行速度:根据速度衰减模型,获得洪涝影响下的通行速度:Calculate the traffic speed: According to the speed decay model, obtain the traffic speed under the influence of floods:

式中,v是行车速度;v0是该地点的设计车速;x是积水深度;a是使车辆停滞的临界积水深度的中值;b是衰减弹性系数。In the formula, v is the driving speed; v0 is the design speed of the location; x is the water depth; a is the median value of the critical water depth that makes the vehicle stagnant; b is the attenuation elastic coefficient.
本发明的优点和有益效果是:本发明提出的城市洪涝灾害动态评估方法,充分利用了大数据技术的优越性,基于网络爬虫技术实时获取城市人口和交通状况,通过构建的承灾体数据集,结合城市雨洪模型模拟结果,实现了洪涝灾害损失的动态评估,本发明克服了传统数据难获取、时空分辨率较差的缺点,实现了大数据技术与城市水文领域的交叉研究,能够捕捉洪涝发生不同时间点承灾体的损失差别,较真实的反应洪涝灾害对社会的影响。本发明具有普适性,能够与任意的城市雨洪模型结合,指导防灾减灾工作的正确部署,提高城市抗击洪涝灾害的韧性。The advantages and beneficial effects of the present invention are as follows: the method for dynamic assessment of urban flood disasters proposed by the present invention makes full use of the advantages of big data technology, obtains urban population and traffic conditions in real time based on web crawler technology, and uses the constructed disaster-bearing body data set. , Combined with the simulation results of the urban rain and flood model, the dynamic assessment of flood disaster losses is realized. The present invention overcomes the shortcomings of difficult acquisition of traditional data and poor spatial and temporal resolution, and realizes the cross-research between big data technology and urban hydrology. The difference in the loss of disaster-bearing bodies at different times of flood occurrence reflects the impact of flood disasters on society more realistically. The invention has universality, can be combined with any urban rainwater model, guides the correct deployment of disaster prevention and mitigation work, and improves the resilience of cities against flood disasters.
附图说明Description of drawings
下面结合附图和实施例对本发明作进一步说明。The present invention will be further described below with reference to the accompanying drawings and embodiments.
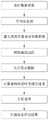
图1是本发明实施例所述装置方法的流程图。FIG. 1 is a flowchart of an apparatus method according to an embodiment of the present invention.
具体实施方式Detailed ways
实施例一:Example 1:
本实施例是一种基于多源数据的城市洪涝灾害动态评估方法。本实施例为实现动态评估,首要解决的问题是承灾体的数据获取问题,传统数据时空分辨率差、获取难度大等缺点都在制约着动态评估技术的发展。而随着大数据技术的广泛应用以及数据的快速增长,则有效解决了上述问题,为洪涝灾害的动态评估提供了可能,也推进了大数据技术在城市水文领域的应用,实现了学科间的交叉融合。本实施例采用网络爬虫技术,从多个数字地图供应商的数字地图数据中实时的获取人口和车辆的时间和空间变化状态,形成数据集,再通过对洪水的模拟,与数据集结合实现的对洪涝灾害的实时评估。This embodiment is a method for dynamic assessment of urban flood disasters based on multi-source data. In order to realize the dynamic assessment in this embodiment, the first problem to be solved is the problem of data acquisition of the disaster-affected body. The disadvantages of traditional data, such as poor spatial and temporal resolution and difficulty in acquisition, restrict the development of dynamic assessment technology. With the wide application of big data technology and the rapid growth of data, the above problems have been effectively solved, the dynamic assessment of flood disasters has become possible, and the application of big data technology in the field of urban hydrology has also been promoted. cross fusion. In this embodiment, the web crawler technology is used to obtain the temporal and spatial change states of the population and vehicles in real time from the digital map data of multiple digital map suppliers to form a data set, which is then combined with the data set by simulating floods. Real-time assessment of flood hazards.
本实施例包括以下具体步骤,流程如图1所示:This embodiment includes the following specific steps, and the process is shown in Figure 1:
步骤1,实时数据采集:对多种承灾体采用网络爬虫从至少两个数字地图供应商处进行实时数据采集。Step 1, real-time data collection: use web crawlers to collect real-time data from at least two digital map suppliers for various disaster-affected bodies.
本步骤采用大数据技术对多种承灾体的实时数据进行采集,采集获取方可以是各个数字地图供应商所提供的开放数字地图平台,例如百度地图APP、百度地图API、高德地图API等,利用网络爬虫技术按照一定规则,对这些数字地图平台所提供的数据进行自动抓取实时采集。In this step, big data technology is used to collect real-time data of various disaster-affected bodies. The acquisition and acquisition party can be the open digital map platform provided by various digital map suppliers, such as Baidu Map APP, Baidu Map API, AutoNavi Map API, etc. , using the web crawler technology to automatically capture and collect the data provided by these digital map platforms in real time according to certain rules.
抓取数据:dedicate data:
HTTP是一个基于“请求与响应”模式的/无状态的应用层协议,URL是通过HTTP协议存取资源的Internet路径,利用网络爬虫技术按照一定规则实时获取开放数字地图平台供应商存储在URL中的数据资源,对于百度地图APP来说,抓取数据为人口热力图的瓦片数据,对于百度地图API/高德地图API来说,抓取数据为车辆途经道路的长度与耗时。HTTP is a stateless application layer protocol based on the "request and response" mode, and URL is the Internet path for accessing resources through HTTP protocol. Web crawler technology is used to obtain open digital map platform providers in real time according to certain rules and store them in the URL. For the Baidu Map APP, the captured data is the tile data of the population heat map. For the Baidu Map API/AutoNavi Map API, the captured data is the length and time-consuming of the road the vehicle passes through.
抓取规则:Crawl rules:
本专利使用Request库实现对http拼接而成的URL接口的反复调用,调用过程需要使用get方法,即构造一个向服务器请求资源的Requests对象,并返回一个包含服务器资源的Response对象,抓取规则为:This patent uses the Request library to implement the repeated invocation of the URL interface spliced by http. The invocation process needs to use the get method, that is, construct a Requests object that requests resources from the server, and return a Response object containing the server resources. The grabbing rules are: :
1)构造一个控制器,控制器是网络爬虫的中央控制器,它主要是负责根据系统传过来的URL链接,分配一线程,然后启动线程调用爬虫爬取网页的过程;1) Construct a controller. The controller is the central controller of the web crawler. It is mainly responsible for allocating a thread according to the URL link passed by the system, and then starting the thread to call the crawler to crawl the web page;
2)人为给定一个URL作为入口,从这里开始爬取;2) Artificially give a URL as the entry, and start crawling from here;
3)用运行队列和完成队列来保存不同状态的链接;3) Use run queues and completion queues to save links in different states;
4)线程从运行队列读取队首URL,如果存在,则继续执行,反之则停止爬取;4) The thread reads the queue head URL from the running queue, and if it exists, it continues to execute, otherwise it stops crawling;
5)构造一个解析器,解析器是负责网络爬虫的主要部分,其负责的工作主要有:下载网页的功能,对网页的文本进行处理,如过滤功能,抽取特殊HTML标签的功能,分析数据功能,本专利用到的解析器是Request库;5) Construct a parser. The parser is the main part of the web crawler. Its main tasks are: the function of downloading web pages, processing the text of web pages, such as filtering, extracting special HTML tags, and analyzing data. , the parser used in this patent is the Request library;
6)每处理完一个URL,将其放入完成队列,防止重复访问;6) After each URL is processed, it is put into the completion queue to prevent repeated access;
7)将网页中下载下来的数据存储在资源库中;7) Store the data downloaded from the webpage in the resource library;
8)重复步骤3)、4)、5)、6)、7)。8) Repeat steps 3), 4), 5), 6), and 7).
步骤2,空间化处理:对数据进行空间化处理,包括:人口热力图分区与空间展布、道路分级处理与通行速度空间展布。Step 2, spatial processing: spatial processing of the data, including: population heat map partition and spatial distribution, road classification processing and traffic speed spatial distribution.
热力图分区是指当前在某一区域内人口的密集程度,其空间展布则是将人口密集程度在地图中进行用颜色变化进行展示,类似于以颜色变化表达的海拔高度图。而道路分级则是根据某一区域的道路中车辆运行的速度变化进行分级,并使用颜色在地图中予以表达,实现通行速度的空间展布。The heat map partition refers to the current density of population in a certain area, and its spatial distribution is to display the density of the population in the map with color changes, similar to the altitude map expressed by color changes. The road classification is to classify according to the speed changes of vehicles on the road in a certain area, and use color to express it in the map to realize the spatial distribution of the traffic speed.
空间化处理可以采用各种地理信息系统工具软件进行,例如可以利用ArcGIS中的各种工具对数据进行空间化处理。Spatial processing can be performed using various geographic information system tool software, for example, various tools in ArcGIS can be used to spatially process data.
步骤3,建立洪涝灾害承灾体数据集:建立不同时刻人口热力图数据集和通行速度的空间分布数据集。Step 3, establish a flood disaster-affected body data set: establish a population heat map data set at different times and a spatial distribution data set of traffic speed.
人口热力图数据集:数据可以来源于一些数字地图供应商会提供基于位置的服务(LBS),例如百度地图,这一服务通过多种定位手段,将位置呈现在百度构建的坐标系中,供人们使用。数据本身是实时回传的,也就是定位数据在不断的积累和更新,热力图可以来源于一些数字地图供应商APP中的人口热力图层,例如百度地图APP中人口热力图图层,通过放大缩小可以看到不同层级的热力图,较小的缩放级别下,热力相对集中,在较大的缩放级别下,热力会相对分散且精准到具体建筑或地块。Population heat map dataset: The data can come from some digital map providers that provide location-based services (LBS), such as Baidu Maps, which presents the location in the coordinate system built by Baidu through various positioning methods for people to use. use. The data itself is sent back in real time, that is, the positioning data is continuously accumulated and updated. The heat map can be derived from the population heat map layer in some digital map supplier APPs, such as the population heat map layer in Baidu Maps APP. By zooming in on the population heat map layer Zoom out to see the heat map at different levels. At a smaller zoom level, the heat is relatively concentrated. At a larger zoom level, the heat will be relatively scattered and accurate to specific buildings or plots.
采集流程:由于热力图层目前只少数地图供应商的APP中有开放,多数网页版地图没有开放,也没有提供开放API供开发者使用,所以需要通过对APP数据的抓取。Collection process: Because the thermal layer is only open in the APP of a few map suppliers, most of the web version maps are not open, and there is no open API for developers to use, so it needs to capture the APP data.
通行速度的空间分布数据集:数据来源,可以采用从开源地图中获取数据的方法。Dataset of spatial distribution of traffic speed: Data source, which can be obtained from open source maps.
步骤4,模拟淹没过程:利用城市雨洪模型模拟洪涝淹没过程。Step 4, simulate the inundation process: use the urban rainwater model to simulate the flood inundation process.
可以利用TELEMAC模型、MIKE URBAN模型、Inforworks模型等城市雨洪模型模拟淹没水深的空间分布。The spatial distribution of submerged water depth can be simulated by urban stormwater models such as the TELEMAC model, the MIKE URBAN model, and the Inforworks model.
步骤5,人口受灾模拟:根据淹没水深分布计算不同时刻热力值分区的人口受灾面积;Step 5. Population disaster simulation: Calculate the population disaster area of the thermal value partition at different times according to the submerged water depth distribution;
本步骤通过模拟洪水的淹没情况,淹没过程中的各个时刻人口密集程度进行淹没对人群分布的影响,这种分析可以有多种方式,可以采用:重采样、淹没区划分、计算受灾人口的步骤解决这个问题。In this step, by simulating the inundation situation of the flood, the population density at each moment in the inundation process is used to analyze the impact of the inundation on the population distribution. There are various methods for this analysis, which can be used: resampling, submerged area division, and calculation of the affected population. solve this problem.
步骤6,计算暴雨洪涝时的通行速度:根据淹没水深分布计算暴雨洪涝影响下不同时刻的通行速度。Step 6: Calculate the traffic speed during the rainstorm and flood: Calculate the traffic speed at different times under the influence of the storm and flood according to the submerged water depth distribution.
本步骤评估的是洪水淹没对行车的影响,评估的方式有多种,可以采用路网获取、OD点(起点-终点)获取、通行速度定时获取等几个步骤解决这个问题。This step evaluates the impact of flooding on driving. There are various evaluation methods. Several steps such as road network acquisition, OD point (start-end point) acquisition, and traffic speed timing acquisition can be used to solve this problem.
步骤7,分析差异:分析不同时刻洪涝灾害对于人口、交通影响的差异。Step 7: Analyze differences: analyze the differences in the impact of floods on population and traffic at different times.
分析不同时刻洪涝灾害对于人口、交通影响的差异,根据上述计算的洪涝发生不同时刻的受灾人口面积与通行速度,对比洪涝灾害造成损失时空分布差异,具体为不同热力值区间受灾人口面积差异、通行速度差异、道路中断长度差异。Analyze the differences in the impact of flood disasters on population and traffic at different times, and compare the temporal and spatial distribution of losses caused by flood disasters based on the area and traffic speed of the affected population at different times of the flood. Speed differences, road interruption length differences.
步骤8,生成动态评估结果:将分析数据汇总,生成洪涝灾害损失的动态评估结果。Step 8, generate dynamic assessment results: summarize the analysis data to generate dynamic assessment results of flood disaster losses.
根据步骤8损失差异,系统评估洪涝发生不同时刻的对于承灾体的影响程度。According to the difference in the loss in step 8, the system evaluates the degree of impact on the disaster-affected body at different times when the flood occurs.
实施例二:Embodiment 2:
本实施例是实施例一的改进,是实施例一关于步骤3的细化。本实施例关于步骤3中所述的人口热力图数据集采集流程包括以下子步骤:This embodiment is an improvement of Embodiment 1, and is a refinement of Step 3 in Embodiment 1. The population heat map data collection process described in step 3 in this embodiment includes the following sub-steps:
①手机操作系统模拟器使用http协议调试代理工具进行数字地图数据抓取的操作。例如,安卓模拟器使用代理连接fiddler并进行操作。本采集流程主要针对的是手机中的操作,因此以手机操作系统为解释对象。①The mobile phone operating system simulator uses the http protocol debugging proxy tool to capture the digital map data. For example, the Android emulator uses a proxy to connect to and operate fiddler. This collection process is mainly aimed at the operation in the mobile phone, so the mobile phone operating system is used as the explanation object.
②分析http协议调试代理工具回传的数据。分析的内容包括:获取APP内的数据缓存文件和索引文件,筛选需要使用到的数据。②Analyze the data returned by the http protocol debugging proxy tool. The content of the analysis includes: obtaining the data cache files and index files in the APP, and filtering the data to be used.
③设置采集范围的坐标、地图放大级别以及定时采集时间。③Set the coordinates of the collection range, map zoom level and timing collection time.
采集范围的坐标:采集范围为矩形范围,设置矩形范围的四点坐标,即矩形左下角的经纬度,右上角的经纬度;The coordinates of the collection range: the collection range is a rectangular range, and the four-point coordinates of the rectangular range are set, that is, the latitude and longitude of the lower left corner of the rectangle, and the latitude and longitude of the upper right corner of the rectangle;
放大级别:设置地图数据放大级别,通常为17级,也就是最大放大级别,17个放大级别的空间分辨率范围为20m——2000km;Magnification level: Set the map data magnification level, usually 17, which is the maximum magnification level, and the spatial resolution range of the 17 magnification levels is 20m-2000km;
采集时间:根据需求制定,可以为实时,可以通过定时器给定未来某时刻的时间,也可以通过定时器设置采集的间隔时间如1分钟、10分钟、30分钟等(注意:无法设定历史时刻,只能为现在及未来)Collection time: according to requirements, it can be real-time, the time at a certain moment in the future can be given by the timer, or the interval time of collection can be set by the timer, such as 1 minute, 10 minutes, 30 minutes, etc. (Note: History cannot be set moment, only for the present and the future)
④取得数字地图供应商服务器缓存中的瓦片文件,回传保存到本地,即传到手机的缓存中。④ Obtain the tile file in the cache of the digital map provider server, and send it back and save it locally, that is, send it to the cache of the mobile phone.
⑤自动拼接瓦片形成完整热力图。通常情况下,一般网络版数字地图都具有瓦片自动拼接功能,因此在手机中能够自动完成拼接。⑤ Automatically splicing tiles to form a complete heat map. Under normal circumstances, the general online version of the digital map has the function of automatic tile splicing, so the splicing can be automatically completed in the mobile phone.
人口热力图数据的使用方法:已知采集范围及数字地图供应商所对应的坐标,程序拼接后可以转换为WGS_84坐标,方便更广泛的使用。How to use population heat map data: The collection range and the coordinates corresponding to the digital map supplier are known. After the program is spliced, it can be converted into WGS_84 coordinates, which is convenient for wider use.
在图片处理工件中展示:一般情况下,一些图片处理工件具有多层显示的功能,如果想要直观的观察区域热力图,只需要将获取到的热力图与地图同时放到具有多层显示功能的图片处理软件中,如Photoshop,热力图适当调低透明度,即可完美叠合并观察。Display in image processing workpieces: In general, some image processing workpieces have the function of multi-layer display. If you want to observe the regional heat map intuitively, you only need to put the obtained heat map and the map at the same time and have the function of multi-layer display. In the latest image processing software, such as Photoshop, the heat map can be perfectly superimposed and observed by appropriately reducing the transparency.
如果需要更加专业的分析,则需要将热力图置入地理信息系统,如ArcGIS中,首先进行栅格计算器操作,之后根据需要可以进行重分类以及栅格转面的矢量化等操作,方便使用者更好的利用热力图层进行相关分析和多源使用。If you need more professional analysis, you need to put the heat map into the geographic information system, such as ArcGIS, first perform the grid calculator operation, and then perform the reclassification and the vectorization of the grid to the surface as needed, which is convenient to use. The user can better utilize the thermal layer for correlation analysis and multi-source usage.
实施例三:Embodiment three:
本实施例是上述实施例的改进,是上述实施例关于步骤3的细化。本实施例所述步骤3中所述的通行速度的空间分布数据集,包括以下子步骤:This embodiment is an improvement of the above-mentioned embodiment, and is a refinement of step 3 of the above-mentioned embodiment. The spatial distribution dataset of traffic speeds described in step 3 in this embodiment includes the following sub-steps:
1.路网获取:采用开源地图OSM数据作为道路数据的来源,根据遥感影像资料并利用地理信息系统,例如ArcGIS工具,进行拓扑检查,修复道路通行方向和连通性,以满足研究精度的要求。1. Road network acquisition: Using open source map OSM data as the source of road data, based on remote sensing image data and using geographic information systems, such as ArcGIS tools, to perform topology inspection, repair road traffic directions and connectivity, to meet the requirements of research accuracy.
2.OD点(起点-终点)获取:根据开源地图数据的相关属性将研究区的道路划分为5类:快速路、一级路、二级路、三级路和支路,并利用地理信息系统,例如ArcGIS工具,获取每条道路的OD点的经纬坐标。2. OD point (start-point) acquisition: According to the relevant attributes of open source map data, the roads in the study area are divided into 5 categories: expressways, first-class roads, second-class roads, third-class roads and branch roads, and use geographic information Systems, such as ArcGIS tools, obtain the latitude and longitude coordinates of the OD points for each road.
3.通行速度定时获取:通过编制定时器和设置参数,利用至少两家数字地图供应商所提供的API开放平台获得途经路段长度和相应的通行时间,并进一步的计算各个时段的通行速度,所述的参数包括:OD点经纬度、坐标类型、返回类型、AK密钥。3. Timing acquisition of traffic speed: By programming timers and setting parameters, using the API open platform provided by at least two digital map suppliers to obtain the length of the passing road section and the corresponding traffic time, and further calculate the traffic speed of each period, so The parameters described include: OD point latitude and longitude, coordinate type, return type, and AK key.
针对百度和高德地图,通行速度定时获取可以采用以下方式:For Baidu and AutoNavi maps, the following methods can be used to obtain traffic speed timing:
1)在百度地图API/高德地图API开放平台申请“Web服务API”密钥。1) Apply for the "Web Service API" key on the Baidu Map API/AutoNavi Map API open platform.
2)在Python程序中设置密钥、OD点的经纬度、坐标类型、返回类型等参数。2) In the Python program, set parameters such as the key, the latitude and longitude of the OD point, the coordinate type, and the return type.
3)拼接HTTP请求URL。3) Concatenate the HTTP request URL.
4)利用Python编写定时器,每30分钟抓取一次数据,并为每次抓取的数据设置一个批次号,记录抓取时间。4) Use Python to write a timer to capture data every 30 minutes, and set a batch number for each captured data to record the capture time.
5)接收HTTP请求返回的json/xml格式数路并解析,获得途经路段长度和通行时间,进一步的计算通行速度,存入数据库归档。5) Receive and parse the json/xml format returned by the HTTP request to obtain the length and travel time of the passing road section, further calculate the travel speed, and store it in the database for archiving.
实施例四:Embodiment 4:
本实施例是上述实施例的改进,是上述实施例关于步骤5的细化。本实施例所述步骤5中所述的受灾模拟包括如下子步骤:This embodiment is an improvement of the foregoing embodiment, and is a refinement of step 5 of the foregoing embodiment. The disaster simulation described in step 5 of this embodiment includes the following sub-steps:
重采样:利用重采样工具,将矢量化的人口热力图与淹没水深图重采样成像元大小一致的栅格数据。Resampling: Use the resampling tool to resample vectorized population heatmaps and inundation bathymetry maps into raster data of consistent cell size.
所述的重采样工具是指一些地理信息系统供应商,例如ArcGIS,在软件中所提供的重采样工具。The resampling tool refers to the resampling tool provided in the software by some geographic information system suppliers, such as ArcGIS.
淹没区划分:根据淹没水深的大小划定不同的洪涝风险等级。Inundation area division: According to the size of the submerged water depth, different flood risk levels are delineated.
本实施例拟定了5个风险等级,分别为无风险(0m)、低风险(0,0.1m]、中风险(0.1m,0.5m]、高风险(0.5m,1m]、重风险(>1m),利用ArcGIS软件中的重分类工具将淹没水深进行重新划分,分别对应淹没风险等级1-5,其中等级1为无风险,等级5为重风险。In this example, 5 risk levels are drawn up, namely no risk (0m), low risk (0,0.1m], medium risk (0.1m, 0.5m], high risk (0.5m, 1m], heavy risk (> 1m), use the reclassification tool in ArcGIS software to re-classify the submerged water depth, corresponding to submerged risk levels 1-5, where level 1 is no risk, and level 5 is heavy risk.
计算受灾人口:利用栅格计算器工具,将淹没风险分区图和人口热力图叠加,统计不同淹没风险分区下,不同热力值分区的受灾面积。Calculate the affected population: Use the grid calculator tool to superimpose the inundation risk zoning map and the population heat map to count the affected areas of different inundation risk zones and zones with different thermal values.
实施例五:Embodiment 5:
本实施例是上述实施例的改进,是上述实施例关于步骤6的细化。本实施例所述步骤6所述的计算暴雨洪涝时的通行速度包括如下子步骤:This embodiment is an improvement of the foregoing embodiment, and is a refinement of step 6 of the foregoing embodiment. The calculation of the traffic speed during rainstorm and flood described in step 6 of this embodiment includes the following sub-steps:
1)栅格化处理:利用折线转栅格工具,根据淹没图层对道路图层进行栅格化处理,获得栅格化的通行速度图层;1) Rasterization processing: Use the polyline to raster tool to rasterize the road layer according to the submerged layer to obtain a rasterized traffic speed layer;
所述的折线转栅格工具是指一些地理信息系统供应商,例如ArcGIS,在GIS应用软件中所提供的折线转栅格工具。The polyline-to-raster tool refers to the polyline-to-raster tool provided by some geographic information system suppliers, such as ArcGIS, in GIS application software.
2)计算通行速度:根据速度衰减模型,利用ArcGIS软件中的栅格计算器工具计算每个栅格对应的通行速度衰减率,获得速度衰减率的栅格数据,利用ArcGIS软件中的栅格计算器工具,将速度衰减率图层与无雨条件下栅格化的通行速度图层相乘,获得洪涝影响下的通行速度:2) Calculate the traffic speed: According to the speed decay model, use the grid calculator tool in ArcGIS software to calculate the traffic speed decay rate corresponding to each grid, obtain the grid data of the speed decay rate, and use the grid calculation in ArcGIS software. tool, and multiply the velocity decay rate layer with the rasterized traffic speed layer under no-rain conditions to obtain the traffic speed under the influence of flooding:

式中,v是行车速度,km/h;v0是该地点的设计车速,km/h;x是积水深度,cm;a是使车辆停滞的临界积水深度的中值,cm;b是衰减弹性系数,表示车速随水深衰减的速率,一般取3~5,b的取值越小则速度衰减越快。In the formula, v is the driving speed, km/h;v0 is the design speed of the location, km/h; x is the water depth, cm; a is the median value of the critical water depth that makes the vehicle stagnant, cm; b is the coefficient of attenuation elasticity, which indicates the rate at which the vehicle speed decays with the water depth. Generally, it takes 3 to 5. The smaller the value of b, the faster the speed decay.
应用实例:Applications:
前山河流域横跨中山市和珠海市,属于城镇建设密集区,流域总集水面积约为328km2,多年平均降雨量为2065mm,据资料统计,2015年流域常驻人口总数为93.74万人,地区总产值为1611.5亿元,其中第一产业产值为12.05亿元,第二产业产值为677.78亿元,第三产业产值为921.68亿元。流域属于中珠联围汇水区,由于特殊的地理位置和地形条件,常遭受台风暴潮、外江洪水和当地降雨洪水带来的洪涝灾害。为了对该区域的洪涝灾害损失进行动态评估,利用大数据技术对百度地图API中的热力图服务和路线规划服务进行了调用,建立了洪涝灾害的承灾体数据集,结合TELEMAC模型,对该区域的不同时刻洪涝损失差异进行了分析,具体操作如下:The Qianshan River Basin spans Zhongshan City and Zhuhai City and belongs to a dense urban construction area. The total catchment area of the basin is about 328km2 , and the annual average rainfall is 2065mm. According to statistics, the total resident population of the basin in 2015 was 937,400. The total regional output value is 161.15 billion yuan, of which the output value of the primary industry is 1.205 billion yuan, the output value of the secondary industry is 67.778 billion yuan, and the output value of the tertiary industry is 92.168 billion yuan. The basin belongs to the China-Zhuhai-Lianwei catchment area. Due to its special geographical location and topographical conditions, it often suffers from floods caused by typhoon surges, floods from the outer rivers and local rainfall and floods. In order to dynamically assess the loss of flood disasters in this area, the heat map service and route planning service in Baidu Maps API were called by using big data technology, and a data set of disaster-bearing bodies of flood disasters was established. Combined with the TELEMAC model, the The differences in flood losses at different times in the region are analyzed, and the specific operations are as follows:
1)受灾人口的动态评估:根据研究区域的四角坐标(左下:113.3579,22.1768;右上:113.5659,22.4343),设置定时采集时间为1小时,采集了不同时刻的百度人口热力图(工作日/非工作日、日间/夜间),利用ArcGIS软件中的栅格计算器及重分类工具对热力图进行了矢量化处理,结合TELEMAC模拟的50年一遇暴雨情景下的洪涝淹没水深,对不同时刻人口的受灾情况进了统计,见表1、表2。1) Dynamic assessment of the affected population: According to the four-corner coordinates of the study area (lower left: 113.3579, 22.1768; upper right: 113.5659, 22.4343), set the timing collection time to 1 hour, and collected Baidu population heatmaps at different times (working days/non-days) Working days, daytime/nighttime), the heat map was vectorized using the raster calculator and reclassification tool in ArcGIS software, combined with the flood submerged water depth under the 50-year heavy rain scenario simulated by TELEMAC, The disaster situation of the population has been counted, see Table 1 and Table 2.
表1 50年一遇设计暴雨下非工作日日间与夜间受灾人口统计(km2)Table 1 Daytime and nighttime disaster-affected population statistics of non-working days under a 50-year design torrential rain (km2 )

注:带口字体代表日间与夜间相比数值更大,带横向字体则代表更小。Note: The font with mouth means that the value is larger during the day than at night, and the font with horizontal means smaller.
表2 50年一遇设计暴雨下工作日日间与夜间受灾人口统计(km2)Table 2 Daytime and nighttime disaster-affected population statistics under the 50-year design torrential rain (km2 )


注:带口字体代表日间与夜间相比数值更大,带横向字体则代表更小。Note: The font with mouth means that the value is larger during the day than at night, and the font with horizontal means smaller.
2)交通影响的动态评估:采用OSM路网数据,经修正后,利用ArcGIS工具获取每条道路的OD点经纬坐标,基于百度地图API中的路线规划服务接口,利用Python编写调用程序,设置定时采集时间为30分钟,获得不同时刻的通行距离与通行时间,计算通行速度,建立通行速度数据集,包括通行速度时间变化图和通行速度空间分布图,包括;基于TELEMAC模拟的50年一遇暴雨条件下的淹没水深,根据速度衰减模型,计算每个淹没水深栅格对应的速度衰减率,将其与无雨日通行速度的栅格数据进行相乘,获得暴雨洪涝影响下的通行速度:2) Dynamic assessment of traffic impact: using OSM road network data, after correction, use ArcGIS tools to obtain the latitude and longitude coordinates of the OD point of each road, based on the route planning service interface in Baidu map API, use Python to write calling programs and set timings The acquisition time is 30 minutes, the travel distance and travel time at different times are obtained, the travel speed is calculated, and the travel speed data set is established, including the time change map of the travel speed and the spatial distribution map of the travel speed, including; 50-year heavy rain based on TELEMAC simulation For the submerged water depth under the conditions, according to the velocity decay model, calculate the velocity decay rate corresponding to each submerged water depth grid, and multiply it with the grid data of the traffic speed on a rainless day to obtain the traffic speed under the influence of rainstorm and flood:

式中,v是行车速度,km/h;v0是该地点的设计车速,km/h;x是积水深度,cm;a是使车辆停滞的临界积水深度的中值,cm;b是衰减弹性系数,表示车速随水深衰减的速率,一般取3~5,b的取值越小则速度衰减越快。In the formula, v is the driving speed, km/h;v0 is the design speed of the location, km/h; x is the water depth, cm; a is the median value of the critical water depth that makes the vehicle stagnant, cm; b is the coefficient of attenuation elasticity, which indicates the rate at which the vehicle speed decays with the water depth. Generally, it takes 3 to 5. The smaller the value of b, the faster the speed decay.
许多城市规定当道路积水深度超过30cm时,就需要进行相应的警戒,甚至进行必要的交通管制。参考有关文献,本研究根据积水深度的不同,将积水深度大于30cm视为禁止通行,即道路中断。在50年一遇极端降雨的情景下,将城市洪涝淹没模拟结果与城市路网进行空间整合,获得道路中断情况(表3)和各级道路通行速度衰减情况(表4)。Many cities stipulate that when the depth of water accumulation on the road exceeds 30cm, corresponding warnings and even necessary traffic control are required. Referring to the relevant literature, this study considers that the depth of ponding water greater than 30cm is prohibited from passing, that is, the road is interrupted. Under the scenario of extreme rainfall once in 50 years, the urban flood inundation simulation results were spatially integrated with the urban road network to obtain road interruptions (Table 3) and road speed attenuation at all levels (Table 4).
表3 50年一遇暴雨情景下的各个等级道路的中断长度Table 3 Interruption lengths of roads of each grade under the 50-year torrential rain scenario

表4 50年一遇暴雨情景下的各个等级道路速度减少值Table 4 Reduction value of road speed for each grade under the 50-year torrential rain scenario

最后应说明的是,以上仅用以说明本发明的技术方案而非限制,尽管参照较佳布置方案对本发明进行了详细说明,本领域的普通技术人员应当理解,可以对本发明的技术方案(比如网络采集数据集的方式、各种公式的运用、步骤的先后顺序等)进行修改或者等同替换,而不脱离本发明技术方案的精神和范围。Finally, it should be noted that the above is only used to illustrate the technical solution of the present invention and not to limit it. Although the present invention has been described in detail with reference to the preferred arrangement solution, those of ordinary skill in the art should understand that the technical solution of the present invention (such as The method of collecting the data set from the network, the application of various formulas, the sequence of steps, etc.) can be modified or equivalently replaced without departing from the spirit and scope of the technical solution of the present invention.
Claims (1)
Translated fromChinese
Priority Applications (1)
| Application Number | Priority Date | Filing Date | Title |
|---|---|---|---|
| CN202110152855.6ACN112819340B (en) | 2021-02-04 | 2021-02-04 | A dynamic assessment method of urban flood disaster based on multi-source data |
Applications Claiming Priority (1)
| Application Number | Priority Date | Filing Date | Title |
|---|---|---|---|
| CN202110152855.6ACN112819340B (en) | 2021-02-04 | 2021-02-04 | A dynamic assessment method of urban flood disaster based on multi-source data |
Publications (2)
| Publication Number | Publication Date |
|---|---|
| CN112819340A CN112819340A (en) | 2021-05-18 |
| CN112819340Btrue CN112819340B (en) | 2022-09-16 |
Family
ID=75861189
Family Applications (1)
| Application Number | Title | Priority Date | Filing Date |
|---|---|---|---|
| CN202110152855.6AActiveCN112819340B (en) | 2021-02-04 | 2021-02-04 | A dynamic assessment method of urban flood disaster based on multi-source data |
Country Status (1)
| Country | Link |
|---|---|
| CN (1) | CN112819340B (en) |
Families Citing this family (12)
| Publication number | Priority date | Publication date | Assignee | Title |
|---|---|---|---|---|
| CN113240688A (en)* | 2021-06-01 | 2021-08-10 | 安徽建筑大学 | Integrated flood disaster accurate monitoring and early warning method |
| CN113704994B (en)* | 2021-08-25 | 2023-09-01 | 福州市规划设计研究院集团有限公司 | Urban traffic lifeline construction method and system in extreme stormy weather |
| CN113869804B (en)* | 2021-12-02 | 2022-06-14 | 国网江西省电力有限公司电力科学研究院 | Power grid equipment risk early warning method and system under flood disaster |
| CN114359713B (en)* | 2021-12-14 | 2025-06-20 | 武汉大学 | A road passability analysis method based on remote sensing geological conditions |
| CN115408955B (en)* | 2022-08-25 | 2024-04-30 | 西安理工大学 | Urban rainfall flood tracing numerical simulation method based on rainfall tracing |
| CN115953281A (en)* | 2022-12-19 | 2023-04-11 | 贵州大学 | Dynamic assessment method and system for inland inundation disasters of urban underground space |
| CN115907574B (en) | 2023-01-10 | 2023-08-15 | 中国水利水电科学研究院 | Remote sensing simulation method for heavy construction cost of flood peak flood disaster bearing machine |
| CN116934073B (en)* | 2023-06-07 | 2024-06-04 | 深圳大学 | A refined calculation method for urban disaster resilience based on spatiotemporal activity analysis |
| CN117152561B (en)* | 2023-09-08 | 2024-03-19 | 中国水利水电科学研究院 | A method for constructing and updating remote sensing sample sets of flood disaster replacement costs |
| CN117689196A (en)* | 2023-11-07 | 2024-03-12 | 深圳大学 | Urban waterlogging disaster risk exposure dynamic measurement method, terminal and storage medium |
| CN118644082B (en)* | 2024-08-09 | 2024-12-03 | 湖南科技大学 | Geological disaster vulnerability assessment method for multi-time scale population spatialization |
| CN119964389A (en)* | 2025-01-26 | 2025-05-09 | 郑州大学 | Urban road network traffic flood vulnerability assessment method based on multi-source and multi-modal data |
Family Cites Families (3)
| Publication number | Priority date | Publication date | Assignee | Title |
|---|---|---|---|---|
| CN106940840A (en)* | 2017-03-14 | 2017-07-11 | 东南大学 | A kind of urban waterlogging calamity source appraisal procedure |
| CN107463901B (en)* | 2017-08-07 | 2021-05-14 | 中国科学院遥感与数字地球研究所 | Remote sensing assessment method and system for multi-scale regional flood disaster risk |
| CN112069378B (en)* | 2020-09-14 | 2022-09-30 | 郑州大学 | Urban disaster-causing rainfall classification determination method based on IDF curve |
- 2021
- 2021-02-04CNCN202110152855.6Apatent/CN112819340B/enactiveActive
Also Published As
| Publication number | Publication date |
|---|---|
| CN112819340A (en) | 2021-05-18 |
Similar Documents
| Publication | Publication Date | Title |
|---|---|---|
| CN112819340B (en) | A dynamic assessment method of urban flood disaster based on multi-source data | |
| Badach et al. | A framework for Air Quality Management Zones-Useful GIS-based tool for urban planning: Case studies in Antwerp and Gdańsk | |
| Huang et al. | Effect of urban morphology on air pollution distribution in high-density urban blocks based on mobile monitoring and machine learning | |
| CN102595323B (en) | Method for obtaining resident travel characteristic parameter based on mobile phone positioning data | |
| Brown et al. | A GIS-based environmental modelling system for transportation planners | |
| Gong et al. | Deciphering urban bike-sharing patterns: An in-depth analysis of natural environment and visual quality in New York's Citi bike system | |
| Chen et al. | Developing an integrated 2D and 3D WebGIS-based platform for effective landslide hazard management | |
| Ding et al. | RTVEMVS: Real-time modeling and visualization system for vehicle emissions on an urban road network | |
| CN110059860A (en) | A multi-objective optimization method for the location layout of public charging stations in cities | |
| CN103489036A (en) | Emergent pre-warning grid dividing system and method based on hybrid space correlation analysis | |
| CN113408918B (en) | Multi-temporal remote sensing analysis-based rural garbage downscaling space-time distribution inversion method | |
| Li et al. | A physically based spatiotemporal method of analyzing flood impacts on urban road networks | |
| CN116402918B (en) | Construction method and system of beach ocean garbage sampling section | |
| CN110135103B (en) | Method and system for simulating urban natural ventilation potential by adopting water flow | |
| CN104766469B (en) | Urban traffic flow tide simulation analysis method based on big data analysis | |
| Bianchi et al. | An innovational digital tool in GIS procedure: Mapping adriatic coast in abruzzo region to support design of slow mobility routes | |
| CN116297062A (en) | A refined spatio-temporal simulation and quantitative analysis method for PM2.5 concentration oriented to multi-dimensional spatio-temporal factors | |
| CN115239027A (en) | Method and device for air quality lattice ensemble prediction | |
| Liu et al. | Assessment of the dynamic exposure to pm2. 5 based on hourly cell phone location and land use regression model in Beijing | |
| Mohd Shafie | Application of AERMOD dispersion model for assessment PM10 concentrations from mobile sources in Kuala Lumpur Metropolitan City, Malaysia | |
| CN114666738A (en) | Territorial space planning method and system based on mobile phone signaling | |
| Chen et al. | A case study of land use planning environmental assessment based on the air pollution analysis | |
| CN113343053A (en) | Method for rapidly determining and analyzing river pollution range and visualizing webpage in real time | |
| CN113627663B (en) | Dynamic causal analysis method based on geographic time sequence in city | |
| Zhang et al. | An Information Aggregation and Cellular Automata Based Flood Simulation Method and its Application on Weifang City Urban Area |
Legal Events
| Date | Code | Title | Description |
|---|---|---|---|
| PB01 | Publication | ||
| PB01 | Publication | ||
| SE01 | Entry into force of request for substantive examination | ||
| SE01 | Entry into force of request for substantive examination | ||
| GR01 | Patent grant | ||
| GR01 | Patent grant |