CN112272066B - Frequency spectrum data cleaning method used in airport terminal area very high frequency communication - Google Patents
Frequency spectrum data cleaning method used in airport terminal area very high frequency communicationDownload PDFInfo
- Publication number
- CN112272066B CN112272066BCN202010969910.6ACN202010969910ACN112272066BCN 112272066 BCN112272066 BCN 112272066BCN 202010969910 ACN202010969910 ACN 202010969910ACN 112272066 BCN112272066 BCN 112272066B
- Authority
- CN
- China
- Prior art keywords
- data
- frequency point
- signal
- value
- measured
- Prior art date
- Legal status (The legal status is an assumption and is not a legal conclusion. Google has not performed a legal analysis and makes no representation as to the accuracy of the status listed.)
- Active
Links
Images


Classifications
- H—ELECTRICITY
- H04—ELECTRIC COMMUNICATION TECHNIQUE
- H04B—TRANSMISSION
- H04B17/00—Monitoring; Testing
- H04B17/30—Monitoring; Testing of propagation channels
- H04B17/373—Predicting channel quality or other radio frequency [RF] parameters
- G—PHYSICS
- G06—COMPUTING OR CALCULATING; COUNTING
- G06N—COMPUTING ARRANGEMENTS BASED ON SPECIFIC COMPUTATIONAL MODELS
- G06N3/00—Computing arrangements based on biological models
- G06N3/02—Neural networks
- G06N3/08—Learning methods
- H—ELECTRICITY
- H04—ELECTRIC COMMUNICATION TECHNIQUE
- H04B—TRANSMISSION
- H04B17/00—Monitoring; Testing
- H04B17/30—Monitoring; Testing of propagation channels
- H04B17/382—Monitoring; Testing of propagation channels for resource allocation, admission control or handover
- Y—GENERAL TAGGING OF NEW TECHNOLOGICAL DEVELOPMENTS; GENERAL TAGGING OF CROSS-SECTIONAL TECHNOLOGIES SPANNING OVER SEVERAL SECTIONS OF THE IPC; TECHNICAL SUBJECTS COVERED BY FORMER USPC CROSS-REFERENCE ART COLLECTIONS [XRACs] AND DIGESTS
- Y02—TECHNOLOGIES OR APPLICATIONS FOR MITIGATION OR ADAPTATION AGAINST CLIMATE CHANGE
- Y02D—CLIMATE CHANGE MITIGATION TECHNOLOGIES IN INFORMATION AND COMMUNICATION TECHNOLOGIES [ICT], I.E. INFORMATION AND COMMUNICATION TECHNOLOGIES AIMING AT THE REDUCTION OF THEIR OWN ENERGY USE
- Y02D30/00—Reducing energy consumption in communication networks
- Y02D30/70—Reducing energy consumption in communication networks in wireless communication networks
Landscapes
- Engineering & Computer Science (AREA)
- Physics & Mathematics (AREA)
- Theoretical Computer Science (AREA)
- Electromagnetism (AREA)
- Computer Networks & Wireless Communication (AREA)
- Signal Processing (AREA)
- Data Mining & Analysis (AREA)
- Molecular Biology (AREA)
- Artificial Intelligence (AREA)
- Biomedical Technology (AREA)
- Biophysics (AREA)
- Computational Linguistics (AREA)
- Health & Medical Sciences (AREA)
- Evolutionary Computation (AREA)
- General Health & Medical Sciences (AREA)
- Life Sciences & Earth Sciences (AREA)
- Computing Systems (AREA)
- General Engineering & Computer Science (AREA)
- General Physics & Mathematics (AREA)
- Mathematical Physics (AREA)
- Software Systems (AREA)
- Quality & Reliability (AREA)
- Monitoring And Testing Of Transmission In General (AREA)
- Optical Communication System (AREA)
Abstract
Description
Translated fromChinese技术领域technical field
本发明属于民航无线电话音通信频谱预测技术领域,具体地说是涉及一种用于机场终端区甚高频通信中的频谱数据清洗方法。The invention belongs to the technical field of civil aviation radio telephone tone communication spectrum prediction, and in particular relates to a spectrum data cleaning method used in VHF communication in an airport terminal area.
背景技术Background technique
为了确保无线电频率资源具备安全的用频环境,国际民航组织(ICAO)为航空移动通信业务划分了专用的民航甚高频通信工作频段,即频率范围为118MHz~136.975MHz,信道带宽为25KHz。各机场所使用的甚高频通信频点均预先固定分配,未经允许,不得变更。然而,随着机场终端区航班起降流量的日益增加,机场塔台和飞机之间的甚高频用频业务量也在不断加大,这将导致飞机与飞机之间、飞机与地面之间的用频冲突日益凸显,直接制约着民航机场的航班吞吐量。为了进一步提高频谱资源利用率,ICAO已推荐将甚高频话音通信信道带宽由25KHz压缩成8.33KHz。目前我国仍采用25KHz作为民航甚高频话音通信的信道带宽。因此,如何利用已分配的有限频率资源扩大民航甚高频话音通信容量,以适应机场终端区甚高频通信业务越来越大的用频需求,成为了频谱预测技术关注的焦点。In order to ensure a safe frequency environment for radio frequency resources, the International Civil Aviation Organization (ICAO) has allocated a dedicated civil aviation VHF communication working frequency band for the aviation mobile communication service, that is, the frequency range is 118MHz ~ 136.975MHz, and the channel bandwidth is 25KHz. The VHF communication frequency points used by each airport are fixed in advance and cannot be changed without permission. However, with the increasing flow of flights taking off and landing in the terminal area of the airport, the volume of VHF usage between the airport tower and aircraft is also increasing, which will lead to increased traffic between aircraft and aircraft and between aircraft and the ground. The frequency conflict is becoming more and more prominent, which directly restricts the flight throughput of civil aviation airports. In order to further improve the utilization rate of spectrum resources, ICAO has recommended to compress the bandwidth of the VHF voice communication channel from 25KHz to 8.33KHz. At present, my country still adopts 25KHz as the channel bandwidth of VHF voice communication in civil aviation. Therefore, how to use the allocated limited frequency resources to expand the VHF voice communication capacity of civil aviation to meet the increasing frequency demand of VHF communication services in the airport terminal area has become the focus of spectrum prediction technology.
近年来,基于深度学习和人工智能技术的进步,智能频谱预测技术较之传统的基于模型的频谱预测技术可为上述问题提供更有效、更可靠的解决方案。需要强调的是,在所有的智能频谱预测中,均涉及一项共性关键支撑技术,即频谱数据清洗技术。不同的频谱数据清洗策略会直接影响频谱数据质量,而频谱数据质量又在很大程度上决定着智能频谱预测的可靠性和预测有效时长,并最终影响到智能频谱预测性能。因此,采取合理、有效的频谱数据清洗方法对于研究数据驱动的智能频谱预测技术至关重要。截至目前,数据清洗方法在物联网技术领域的研究较多,也较为成熟。例如,福州大学的林晓佳等人利用协同相关的异构传感器节点,对多源异构传感网络的数据清洗进行了研究。该数据清洗框架将数据时空相关性的算法设计思想应用于时空粒度转换传感器所收集的数据值和数据频率,实现了对数据精确度,能效和压缩率的较大提升。江苏大学的周金生等人以农业温室大棚的传感器数据为对象进行了数据清洗研究,针对相同和不同类型的传感器数据特点来设计模型,实现了对采集环境的空间相似性的预测。此外,人工智能技术的引入使得数据清洗技术达到了一定的研究高度。河海大学的蒋晨阳等人首先对感知数据的时间相关性、空间相关性和时空相关性进行了分析,其次根据感知数据的特点利用神经网络建立了数据清洗框架,在对感知缺失数据的实际清洗中取得了较好的结果。基于众多研究,清华大学的郝爽等人发表了一篇高质量的文献综述来介绍目前主流数据清洗方法及现状。从国内外对数据清洗的研究中发现,当前针对已有数据清洗技术的应用研究较多,而单纯针对数据清洗方法的研究较少。同时,由于处理的数据对象不同,导致数据清洗的解决方案和技术思路互不适用。因此,针对民航无线电话音通信业务的频谱数据清洗技术目前仍然没有一个规范化的处理方法。In recent years, based on the advancement of deep learning and artificial intelligence technology, intelligent spectrum prediction technology can provide more effective and reliable solutions to the above problems than traditional model-based spectrum prediction technology. It should be emphasized that in all intelligent spectrum predictions, a common key supporting technology is involved, that is, spectrum data cleaning technology. Different spectrum data cleaning strategies will directly affect the quality of spectrum data, and the quality of spectrum data determines the reliability and effective duration of intelligent spectrum prediction to a large extent, and ultimately affects the performance of intelligent spectrum prediction. Therefore, taking a reasonable and effective spectrum data cleaning method is crucial for the study of data-driven intelligent spectrum prediction technology. Up to now, data cleaning methods have been researched more and more mature in the field of IoT technology. For example, Lin Xiaojia et al. of Fuzhou University conducted research on data cleaning of multi-source heterogeneous sensor networks by using synergistically related heterogeneous sensor nodes. The data cleaning framework applies the algorithm design idea of data spatiotemporal correlation to the data value and data frequency collected by the spatiotemporal granularity conversion sensor, and achieves a great improvement in data accuracy, energy efficiency and compression rate. Zhou Jinsheng of Jiangsu University and others conducted data cleaning research on the sensor data of agricultural greenhouses. They designed models according to the characteristics of the same and different types of sensor data, and realized the prediction of the spatial similarity of the collection environment. In addition, the introduction of artificial intelligence technology has made data cleaning technology reach a certain level of research. Jiang Chenyang and others from Hohai University first analyzed the temporal, spatial and temporal correlations of perceptual data, and then established a data cleaning framework using neural networks according to the characteristics of perceptual data. obtained better results. Based on numerous studies, Hao Shuang et al. from Tsinghua University published a high-quality literature review to introduce the current mainstream data cleaning methods and status. From the research on data cleaning at home and abroad, it is found that there are many researches on the application of existing data cleaning technologies, but few studies on data cleaning methods alone. At the same time, due to the different data objects processed, the solutions and technical ideas for data cleaning are not applicable to each other. Therefore, there is still no standardized processing method for spectrum data cleaning technology for civil aviation wireless telephone voice communication services.
发明内容SUMMARY OF THE INVENTION
本发明的针对当前频谱数据清洗技术在民航无线电话音通信业务中的规范化研究空白,提出一种用于机场终端区甚高频通信中的频谱数据清洗方法。Aiming at the standardization research gap of the current spectrum data cleaning technology in the civil aviation wireless telephone voice communication business, the present invention proposes a spectrum data cleaning method for VHF communication in the airport terminal area.
为了实现上述目的,本发明采用的技术方案如下所述:In order to achieve the above object, the technical scheme adopted in the present invention is as follows:
一种用于机场终端区甚高频通信中的频谱数据清洗方法,包括以下步骤:A spectrum data cleaning method for VHF communication in airport terminal area, comprising the following steps:
A.选取信号检测特征并设置滑窗宽度。A. Select the signal detection feature and set the sliding window width.
A1:选取单频点数据。从甚高频通信频段118MHz~136.975MHz中确定实测频点集{f1,f2,...,fn},然后从中获取频点为f1的IQ数据。A1 : Select single frequency point data. Determine the measured frequency point set {f1 , f2 ,..., fn } from the VHF communication frequency band 118MHz~136.975MHz, and then obtain the IQ data with the frequency point f1 .
A11:判别信号类型。利用频点f1的IQ数据绘制二维时域图(横坐标为时间采样点,纵坐标为幅值)。通过二维时域图中的幅值差异来判别IQ数据为含噪信号或纯噪声(含噪信号幅值参考范围为[12,600],纯噪声幅值参考范围为[0,200])。A11 : Determine the signal type. Use the IQ data of the frequency point f1 to draw a two-dimensional time domain map (the abscissa is the time sampling point, and the ordinate is the amplitude). Determine whether the IQ data is a noisy signal or pure noise by the amplitude difference in the two-dimensional time domain map (the reference range of the amplitude of the noisy signal is [12,600], and the reference range of the pure noise amplitude is [0,200]).
A12.:滑窗处理数据。设置滑窗宽度值w=2n,其中n为正整数,推荐取值范围为[8,128]。依据所设置滑窗宽度值对步骤A11中的含噪信号数据和纯噪声数据进行滑窗处理,对滑窗提取数据段求平均值,得到滑窗处理后的含噪信号数据与纯噪声数据。smin为处理后含噪信号数据的最小值,nmax为处理后纯噪声数据的最大值。若smin/nmax>1,则滑窗宽度设置合理,若smin/nmax≤1,则增大滑窗宽度值直至满足要求。将满足要求的最小滑窗宽度作为频点f1的数据处理滑窗宽度值,记为w。A12 .: Sliding window processing data. Set the sliding window width value w=2n , where n is a positive integer, and the recommended value range is [8, 128]. Perform sliding window processingon the noise-containing signal data and the pure noise data in step A11 according to the set sliding window width value, and average the data segments extracted from the sliding window to obtain the noise-containing signal data and pure noise data after the sliding window processing. . smin is the minimum value of the processed noisy signal data, and nmax is the maximum value of the processed pure noise data. If smin /nmax >1, the width of the sliding window is set reasonably; if smin /nmax ≤ 1, the width of the sliding window is increased until the requirements are met. The minimum sliding window width that meets the requirements is taken as the data processing sliding window width value of frequency point f1 , which is denoted as w.
A2:重复步骤A1,统计所有频点{f1,f2,...,fn}的滑窗宽度值并记为{w1,w2,...,wn},从中选取最大值作为处理所有数据的滑窗宽度,对所有数据进行滑窗处理。A2 : Repeat step A1 , count the sliding window width values of all frequency points {f1 ,f2 ,...,fn } and record them as {w1 ,w2 ,...,wn }, from which Select the maximum value as the sliding window width for processing all data, and perform sliding window processing on all data.
A3:确定信号检测特征。利用所有频点{f1,f2,...,fn}滑窗处理后的数据绘制二维时域图。依据二维时域图,若含噪信号幅值与纯噪声幅值的比值处于推荐范围[2,10]内,则可将幅值特征作为信号检测特征。A3 : Determine the signal detection feature. Use all frequency points {f1 , f2 ,...,fn } to draw a two-dimensional time-domain graph with the sliding window data. According to the two-dimensional time domain graph, if the ratio of the amplitude of the noisy signal to the amplitude of pure noise is within the recommended range [2, 10], the amplitude feature can be used as the signal detection feature.
B.设置数据归一化参数与统计门限值。B. Set data normalization parameters and statistical thresholds.
B1:统计频点f1一分钟数据的归一化参数vm、门限值以Trdm及信噪比snrm。对频点f1的实测数据进行滑窗处理后,信号幅值参考范围应为[400,600],噪声幅值参考范围应为[0,50]。依据该判定条件,统计一分钟内的信号数据{s1,s2,...,sp}与噪声数据{n1,n2,...,nq}。其中,p+q=60。从s1到sp中找出每秒的幅值最大值[s1-max,s2-max,...,sp-max]、最小值[s1-min,s2-min,...,sp-min]及平均值[s1-mea,s2-mea,...,sp-mea];从n1到nq中找出每秒的幅值最大值[n1-max,n2-max,...,nq-max]及平均值[n1-mea,n2-mea,...,nq-mea]。选取[s1-max,s2-max,...,sq-max]中的最小值作为一分钟单频点实测数据的归一化参数vm。对[s1-min,s2-min,...,sn-min]中的最小值以及[n1-max,n2-max,...,nm-max]中的最大值进行归一化,其所得值记为sN-min与nN-max,则一分钟的门限值设为Trdm=nN-max+(sN-min-nN-max)/2,信号功率为Ps=mean(s1-mea,s2-mea,...,sp-mea),噪声功率为Pn=mean(n1-mea,n2-mea,...,nq-mea),信噪比为snrm=10log10((Ps-Pn)2/nP2)。B1 : the normalization parameter vm of the one-minute data of the statistical frequency pointf1 , the threshold value Trdm and the signal-to-noise ratiosnrm . After performing sliding window processing on the measured data of frequency point f1 , the reference range of signal amplitude should be [400, 600], and the reference range of noise amplitude should be [0, 50]. According to the judgment condition, the signal data {s1 ,s2 ,...,sp } and the noise data {n1 ,n2 ,...,nq } in one minute are counted. Among them, p+q=60. From s1 to sp , find the maximum value of the amplitude per second [s1-max ,s2-max ,...,sp-max ], the minimum value [s1-min ,s2-min , ...,sp-min ] and the mean value [s1-mea ,s2-mea ,...,sp-mea ]; find the maximum amplitude per second from n1 to nq [ n1-max ,n2-max ,...,nq-max ] and the mean value [n1-mea ,n2-mea ,...,nq-mea ]. Select the minimum value in [s1-max , s2-max ,...,sq-max ] as the normalization parametervm of the measured data of a single frequency point in one minute. For the minimum value in [s1-min ,s2-min ,...,sn-min ] and the maximum value in [n1-max ,n2-max ,...,nm-max ] Normalization is performed, and the obtained values are recorded as sN-min and nN-max , then the threshold value of one minute is set as Trdm =nN-max +(sN-min -nN-max )/2 , the signal power is Ps =mean(s1-mea ,s2-mea ,...,sp-mea ), and the noise power is Pn =mean(n1-mea ,n2-mea ,... , nq-mea ), the signal-to-noise ratio is snrm =10log10 ((Ps -Pn )2 /n P2 ).
B2:统计频点f1一小时数据的归一化参数vh、门限值Trdh、信噪比snrh。以5分钟的时间间隔,分别提取频点f1的一小时数据,重复步骤B1,统计频点f1一小时数据的归一化参数、检测门限值以及信噪比。B2 : the normalization parameter vh , the threshold value Trdh , and the signal-to-noise ratio snrh of the one-hour data of the statistical frequency point f1 . At 5-minute intervals, extract the one-hour data of the frequency point f1 respectively, repeat step B1 , and count the normalization parameters, detection threshold value and signal-to-noise ratio of the one-hour data of the frequency point f1 .

将一小时的归一化参数集中的最小值记为Vh;计算一小时的检测门限集均值,记为Trdh;计算一小时的信噪比参数集均值,记为snrh。则该小时内的归一化参数、检测门限值以及信噪比分别记为[Vh,Trdh,snrh]。The minimum value of the normalized parameter set for one hour is recorded as Vh ; the mean value of the detection threshold set for one hour is calculated as Trdh ; the mean value of the signal-to-noise ratio parameter set for one hour is calculated as snrh . Then the normalization parameter, detection threshold value and signal-to-noise ratio within the hour are recorded as [Vh , Trdh , snrh ] respectively.
B3:统计频点f1一天数据的归一化参数vd、门限值Trdd、信噪比snrd。选取f1频点一天的实测数据,重复步骤B1~B2,统计频点f1一天数据的归一化参数、检测门限值与信噪比。B3 : the normalization parameter vd , the threshold value Trdd , and the signal-to-noise ratio snrd of the one-day data of the statistical frequency point f1 . Select the measured data of the frequency point f1 for one day, repeat steps B1 to B2 , and count the normalization parameters, detection threshold and signal-to-noise ratio of the one-day data of the frequency point f1 .

将一天的归一化参数集中的最小值记为Vd;对一天的检测门限集求均值,记为Trdd;对一天的信噪比参数集求均值,记为snrd。则该天内的归一化参数、检测门限值以及信噪比分别记为[Vd,Trdd,snrd]。The minimum value of the normalized parameter set for one day is recorded as Vd ; the average value of the detection threshold set for one day is recorded as Trdd ; the average value of the signal-to-noise ratio parameter set for one day is recorded as snrd . Then the normalization parameter, detection threshold value and signal-to-noise ratio of the day are recorded as [Vd , Trdd , snrd ], respectively.
B4:统计频点f1全部实测数据的归一化参数、门限值与信噪比。根据频点f1实测数据的采集天数,重复步骤B1~B3,统计频点f1全部数据的归一化参数、门限值与信噪比的。B4 : Normalization parameter, threshold value and signal-to-noise ratio of all measured data of frequency point f1 . Steps B1 to B3 are repeated according to the collection days of the measured data of the frequency point f1 , and the normalization parameters, the threshold value and the signal-to-noise ratio of all the data of the frequency point f1 are counted.

将所得归一化参数集中的最小值记为V;对所得检测门限集求均值,记为Trd;对所得信噪比参数集求均值,记为snr。则全部数据的归一化参数、检测门限值以及信噪比分别记为[V,Trd,snr]。The minimum value in the obtained normalized parameter set is denoted as V; the average value of the obtained detection threshold set is denoted as Trd; the average value of the obtained signal-to-noise ratio parameter set is denoted as snr. Then the normalization parameters, detection threshold and signal-to-noise ratio of all data are recorded as [V, Trd, snr] respectively.
步骤B5:统计所有已测频点集{f1,f2,...,fn}的数据归一化参数、门限值与信噪比。重复步骤A~B,统计全部频点数据的归一化参数,记为{V1,V2,...,Vn},检测门限值,记为[Trd1,Trd2,...,Trdn],信噪比,记为[snr1,snr2,...,snrn]。Step B5: Statistical data normalization parameters, threshold value and signal-to-noise ratio of all measured frequency point sets {f1 , f2 ,..., fn }. Repeat steps A to B, and count the normalization parameters of all frequency point data, denoted as {V1 , V2 ,...,Vn }, and the detection threshold value, denoted as [Trd1 , Trd2 ,... .,Trdn ], the signal-to-noise ratio, denoted as [snr1 ,snr2 ,...,snrn ].

C.检测信号并形成标签。C. Detect signals and form labels.
D1:利用步骤B5中所得到频点f1对应的归一化参数V,对频点f1的每秒实测数据进行归一化,并提取归一化后数据的最大值,与频点f1的检测门限值Trd进行比较。当该最大值大于等于检测门限值时,则判定为信号(标签为1),否则判定为噪声(标签为0)。D1 : Use the normalization parameter V corresponding to the frequency point f1 obtained in step B5 to normalize the measured data per second of the frequency point f1 , and extract the maximum value of the normalized data, which is the same as the
D2:统计频点f1在1天内的数据标签。重复步骤D1对频点f1在1天内的实测数据进行标签统计。D2 : the data label of the statistical frequency point f1 within 1 day. Repeat step D1 to perform label statistics on the measured dataof frequency point f1 withinone day.

D.通信时长边界判定。D. Communication duration boundary determination.
E1:统计最大通信时长。依据步骤D中获得的标签,统计标签连续为1的时间长度,作为连续通信时间并记为[T1,T2,...,Tn],其中Tn为单个连续通信的时长。Tmax为所有连续通信的时长中的最大值,并将Tmax作为频点f1数据预处理中的单位时间尺度。E1 : Statistics of the maximum communication duration. According to the label obtained in step D, count the time length of the label being 1 continuously, which is regarded as the continuous communication time and recorded as [T1 , T2 , . . . , Tn ], where Tn is the duration of a single continuous communication. Tmax is the maximum value among the durations of all continuous communications, and Tmax is taken as the unit time scale in the preprocessing of frequency point f1 data.

E2:统计频点f1的1秒实测数据中连续的信号数据点。依据步骤C所获得的频点f1的归一化参数V对1秒数据进行归一化,将归一化后的数据与步骤C所得的频点f1的门限值Trd进行对比。若大于门限值则判定为信号数据点,若小于门限值则判定为噪声数据点,统计1秒钟内所有连续的信号数据点长度。E2 : continuous signal data points in the 1-second measured data of the statistical frequency point f1 . The 1-second data is normalized according to the normalization parameter V of the frequency point f1 obtained in step C, and the normalized data is compared with the threshold value Trd of the frequency point f1 obtained in step C. If it is greater than the threshold value, it is judged as a signal data point, and if it is less than the threshold value, it is judged as a noise data point, and the length of all continuous signal data points within 1 second is counted.
E3:重复步骤E2统计频点f1的1天实测数据中连续的信号数据点长度,并对得到的数据点长度进行累积分布函数(CDF)计算。E3: Repeat stepE2 to count the lengthsof continuous signal data points in theone -day measured data of frequency point f1, and perform cumulative distribution function (CDF) calculation on the lengths of the obtained data points.


选取累积分布概率为95%的连续信号数据点长度作为频点f1的1天实测数据中最小通信时长。The length of continuous signal data points with a cumulative distribution probability of 95% is selected as the minimum communication duration in theone -day measured data of frequency point f1.
E4:重复步骤E1~E3,根据频点f1的采集天数,统计频点f1实测数据中的最小通信时长。E4 : Repeat steps E1 to E3 , and count the minimum communication duration in the measured data of the frequency point f1 according to the collection days of the frequency point f1 .

最终,统计频点f1实测数据的最小通信时长中的最小值Tmin,并作为该频点数据的切片长度。Finally, the minimum value Tmin among the minimum communication durations of the measured data at the frequency point f1 is counted, and used as the slice length of the frequency point data.
E.计算已测频点集{f1,f2,...,fn}的最大通信时长、最小通信时长。重复步骤A~EE. Calculate the maximum communication duration and the minimum communication duration of the measured frequency point set {f1 , f2 ,...,fn }. Repeat steps A to E
完成全部全部已测频点的最大、最小通信时长统计。Complete the statistics of the maximum and minimum communication duration of all the measured frequency points.

最终将已测频点集{f1,f2,...,fn}中各频点最大通信时长中的最大值作为所有频点数据预处理中的单位时间尺度,记为TL,将最小通信时长中的最大值作为所有频点数据预处理中的切片长度,记为Lc-s(此最大值切片将所有频点的通信长度最小值统计出来后,再在这些最小值中选取他的最大值,作为所有频点的切片长度)。Finally, the maximum value of the maximum communication duration of each frequency point in the measured frequency point set {f1 , f2 ,...,fn } is taken as the unit time scale in the data preprocessing of all frequency points, which is denoted as TL , The maximum value of the minimum communication duration is used as the slice length in all frequency point data preprocessing, and is recorded as Lcs (this maximum value slice counts the minimum value of the communication length of all frequency points, and then selects other values from these minimum values. The maximum value of , as the slice length of all frequency points).
F.对频点f1实测数据进行切片、压缩并形成张量。F. Slice, compress and form a tensor from the measured data of frequency point f1 .
G1:对频点f1单位时间尺度的实测数据进行切片。依据步骤F中所获得的最大单位时间尺度,计算其中所包含的数据点个数N=[(TL×N1)×1]。N1为频点f1的1秒钟实测数据的数据点个数,切片长度为Lc-s,对N进行切片处理,重构成大小为[(N/Lc-s)×Lc-s]的矩阵,完成频点f1在单位时间尺度的实测数据切片,并将切片后的数据进行重组,重构成“I+j*Q”的形式,形成
G2:对频点f1单个切片数据进行压缩。对切片数据的实部和虚部分别进行求模、平均值处理,形成“Ic+j*Qc”的数据点。G2 : Compress the single slice data of the frequency point f1 . The real part and the imaginary part of the slice data are modulo-calculated and averaged respectively to form a data point of "Ic +j*Qc ".
G3:重复步骤G2,对频点f1单位时间尺度的所有切片数据进行压缩,形成大小为[(N/Lc-s)×1]的矩阵。G3 : Repeat step G2 to compress all slice data of the frequency point f1 unit time scale to form a matrix of size [(N/Lcs )×1].
G4:对频点f1的一天的实测数据进行切片、压缩。重复步骤G1~G3,对频点f1实测数据进行切片、压缩,重构成大小为[((N/Lc-s)×(T/TL))×1]的矩阵,以此形成样本张量。G4 : Slice and compress the measured data of one day at the frequency point f1 . Repeating steps G1 to G3 , slicing and compressing the measured data of frequency point f1 , and reconstructing it into a matrix with a size of [((N/Lcs )×(T/TL ))×1] to form a sample Tensor.
G5:对频点f1所有的实测数据进行切片、压缩。重复步骤G1~G4,依据频点f1数据的采集天数,完成频点f1所有实测数据的切片、压缩,形成大小为[((N/Lc-s)×(T/TL))×1×D]的张量(D为采集天数)。G5 : Slice and compress all the measured data of frequency point f1 . Repeat steps G1 to G4 , and complete the slicing and compression of all measured data at frequency point f1 according to the number of days of data collection at frequency point f1 , forming a size of [((N/Lcs )×(T/TL )) ×1×D] tensor (D is the number of acquisition days).
G.对所有已测频点集{f1,f2,...,fn}的实测数据进行数据预处理。重复步骤G完成已测频点集{f1,f2,...,fn}实测数据的切片、压缩以及张量形成,最终重构成大小为[((N/Lc-s)×(T/TL))×n×D]的三维张量数据样本。G. Perform data preprocessing on the measured data of all measured frequency point sets {f1 , f2 ,...,fn }. Repeat step G to complete the slicing, compression and tensor formation of the measured frequency point set {f1 ,f2 ,...,fn }, and the final reconstruction size is [((N/Lcs )×(T /TL ))×n×D] 3D tensor data samples.
本发明与现有技术相比的有益效果在于:The beneficial effects of the present invention compared with the prior art are:
本发明提供了一种用于机场终端区甚高频通信中的频谱数据清洗方法,为后续训练智能频谱预测神经网络模型参数提供了高质量的频谱数据样本,提高了训练样本构造的灵活性和可实现性,保证了智能频谱预测的可靠性和预测有效时长需求。本发明为提升机场终端区甚高频话音通信频率的利用率以及保障机场终端区的航空运行安全提供了重要技术支撑。The invention provides a spectrum data cleaning method used in VHF communication in airport terminal area, provides high-quality spectrum data samples for subsequent training of intelligent spectrum prediction neural network model parameters, and improves the flexibility of training sample construction and performance. The achievability ensures the reliability of intelligent spectrum prediction and the demand for effective duration of prediction. The invention provides important technical support for improving the utilization rate of the VHF voice communication frequency in the airport terminal area and guaranteeing the aviation operation safety of the airport terminal area.
附图说明Description of drawings
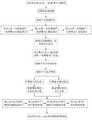
图1是本发明频谱数据三维张量训练样本生成流程图;Fig. 1 is a flow chart of generating a three-dimensional tensor training sample of spectral data of the present invention;
图2是实施例中原始实测数据的二维时域图;Fig. 2 is the two-dimensional time domain diagram of original measured data in the embodiment;
图3是实施例中滑窗处理后数据的二维时域图;Fig. 3 is the two-dimensional time domain diagram of data after sliding window processing in the embodiment;
图4是实施例中129.45MHz的最小通信时长累积分布图。FIG. 4 is a cumulative distribution diagram of the minimum communication duration of 129.45 MHz in the embodiment.
具体实施方式Detailed ways
下面将结合附图对本发明的技术方案进行清楚、完整地描述,显然,所描述的实施例是本发明一部分实施例,而不是全部的实施例。基于本发明中的实施例,本领域普通技术人员在没有做出创造性劳动前提下所获得的所有其他实施例,都属于本发明保护的范围。The technical solutions of the present invention will be clearly and completely described below with reference to the accompanying drawings. Obviously, the described embodiments are a part of the embodiments of the present invention, but not all of the embodiments. Based on the embodiments of the present invention, all other embodiments obtained by those of ordinary skill in the art without creative efforts shall fall within the protection scope of the present invention.
实施例Example
本实施例利用广汉机场终端区甚高频通信频段的实测频谱数据,对本发明所提出的方法进行了验证,其结果证实了本发明内容的可行性和有效性。In this embodiment, the measured spectrum data of the VHF communication frequency band in the terminal area of Guanghan Airport is used to verify the method proposed by the present invention, and the result confirms the feasibility and effectiveness of the content of the present invention.
A.设置信号检测特征及滑窗宽度。A. Set the signal detection feature and sliding window width.
A1:选取单频点数据。根据广汉机场终端区甚高频通信频率所确定的实测频点集为{120.3MHz,129.2MHz,129.45MHz}。从该频点集中选取129.45MHz的IQ数据。A1 : Select single frequency point data. The measured frequency point set determined according to the VHF communication frequency in the terminal area of Guanghan Airport is {120.3MHz, 129.2MHz, 129.45MHz}. IQ data of 129.45MHz is selected from this frequency point set.
A11:判别信号类型。利用频点129.45MHz的IQ数据绘制二维时域图(横坐标为时间采样点,纵坐标为幅值)。通过二维时域图中的幅值差异来判别IQ数据为含噪信号或纯噪声(含噪信号幅值参考范围为[12,600],纯噪声幅值参考范围为[0,200])。A11 : Determine the signal type. Use the IQ data at the frequency of 129.45MHz to draw a two-dimensional time domain diagram (the abscissa is the time sampling point, and the ordinate is the amplitude). Determine whether the IQ data is a noisy signal or pure noise by the amplitude difference in the two-dimensional time domain map (the reference range of the amplitude of the noisy signal is [12,600], and the reference range of the pure noise amplitude is [0,200]).
A12.:滑窗处理数据。选定w=16,其中n为正整数。依据所设置滑窗宽度值对步骤A11中的含噪信号数据和纯噪声数据进行滑窗处理,对滑窗提取数据段求平均值,得到滑窗处理后的含噪信号数据与纯噪声数据为A12 .: Sliding window processing data. Choose w=16, where n is a positive integer. Perform sliding window processingon the noise-containing signal data and the pure noise data in step A11 according to the set sliding window width value, and average the data segments extracted from the sliding window to obtain the noise-containing signal data and pure noise data after the sliding window processing. for

滑窗处理后含噪信号数据的最小值为与纯噪声数据的最大值为[124,42]。则124/42>1,所设置的滑窗宽度值满足要求。The minimum value of the noisy signal data after sliding window processing and the maximum value of the pure noise data are [124,42]. Then 124/42>1, the set sliding window width value meets the requirements.
A2:重复步骤A1,统计所有频点的滑窗宽度值为[16,16,8],选取所有频点滑窗宽度值中的最大值作为处理所有频点数据的滑窗宽度值,则w=16。A2 : Repeat step A1 , count the sliding window width values of all frequency points [16, 16, 8], and select the maximum value of the sliding window width values of all frequency points as the sliding window width value for processing all frequency point data, Then w=16.
A3:确定信号检测特征。用步骤A2中得到的滑窗宽度对步骤A1中频点集{120.3MHz;129.2MHz;129.45MHz}的重组数据进行滑窗处理,并对处理后的重组数据进行二维时域图绘制。依据二维时域图,含噪信号幅值特征与纯噪信号幅值特征的比值等于[3,5,3],满足幅值特征作为信号的检测特征。A3 : Determine the signal detection feature. Use the sliding window width obtained in step A2 to perform sliding window processingon the recombined dataof the intermediate frequency point set {120.3MHz; 129.2MHz; 129.45MHz} in step A1, and draw a two-dimensional time domain graph for the processed recombined data. According to the two-dimensional time domain map, the ratio of the amplitude feature of the noisy signal to the amplitude feature of the pure noise signal is equal to [3, 5, 3], which satisfies the amplitude feature as the detection feature of the signal.
B.设置数据归一化参数与统计门限值。B. Set data normalization parameters and statistical thresholds.
B1:统计频点129.45MHz一分钟数据的归一化参数vm、门限值Trdm以及信噪比snrm。对频点129.45MHz的实测数据进行滑窗处理后,信号幅值参考范围应为(150,270),噪声幅值参考范围应为(0,50)。依据该判定条件,统计一分钟内的信号数据与噪声数据。B1 : the normalization parametervm , the threshold value Trd mand the signal-to-noise ratio snrm of the statistical frequency point129.45 MHz for one minute of data. After performing sliding window processing on the measured data at the frequency of 129.45MHz, the reference range of signal amplitude should be (150,270), and the reference range of noise amplitude should be (0,50). According to the judgment condition, the signal data and noise data within one minute are counted.

其中,p+q=60。从s1到sp中找出每秒的幅值最大值为[228,260,...,221]、最小值[170,181,...,168]及平均值[202,223,...,194];从n1到nq中找出每秒的幅值最大值[35,33,...,34]及平均值[23,21,...,21]。选取[228,260,...,221]中的最小值作为一分钟单频点实测数据的归一化参数vN-m=220。对[170,181,...,168]中的最小值以及[35,33,...,34]中的最大值进行归一化,其中sN-min=0.76,nN-max=0.17,则一分钟的门限值为0.465,信号功率为212,噪声功率为21,信噪比为18。Among them, p+q=60. From s1 to sp , find the maximum amplitude per second as [228, 260, ..., 221], the minimum value [170, 181, ..., 168] and the average value [202, 223, ..., 194] ; Find the maximum value [35,33,...,34] and the average value [23,21,...,21] of the amplitude per second from n1 to nq . Select the minimum value in [228 , 260, . Normalize the minimum value in [170,181,...,168] and the maximum value in [35,33,...,34], where sN-min = 0.76, nN-max = 0.17, Then the threshold for one minute is 0.465, the signal power is 212, the noise power is 21, and the signal-to-noise ratio is 18.
B2:统计频点129.45MHz一小时数据的归一化参数vh、门限值Trdh、信噪比snrh。以5分钟的时间间隔,分别提取频点129.45MHz的一小时数据,重复步骤B1,统计频点129.45MHz一小时数据的归一化参数、检测门限值以及信噪比。B2 : the normalization parameter vh , the threshold value Trdh , and the signal-to-noise ratio snrh of the statistical frequency point 129.45 MHz for one hour of data. At 5-minute intervals, extract the one-hour data of the frequency point 129.45MHz, repeat step B1 , and count the normalization parameters, detection threshold value and signal-to-noise ratio of the one-hour data of the frequency point 129.45MHz.

将一小时的归一化参数集中的最小值为220;计算一小时的检测门限集均值,为0.46;计算一小时的信噪比参数集均值为18。则该小时内的归一化参数、检测门限值以及信噪比分别记为[0.46,220,18]。The minimum value of the one-hour normalized parameter set is 220; the one-hour average detection threshold set is 0.46; the one-hour signal-to-noise ratio parameter set average is 18. Then the normalization parameter, detection threshold value and signal-to-noise ratio within the hour are recorded as [0.46, 220, 18], respectively.
B3:统计频点129.45MHz一天数据的归一化参数vd、门限值Trdd、信噪比snrd。选取129.45MHz频点一天的实测数据,重复步骤B1~B2,统计频点129.45MHz一天数据的归一化参数、检测门限值与信噪比。B3 : the normalization parameter vd , the threshold value Trdd , and the signal-to-noise ratio snrd of the one-day data at the statistical frequency point 129.45 MHz. Select one day's measured data at 129.45MHz frequency, repeat steps B1 to B2 , and count the normalization parameters, detection threshold and signal-to-noise ratio of one day's data at 129.45MHz frequency.


一天的归一化参数集中的最小值为224;对一天的检测门限集求均值,其值为0.46;对一天的信噪比参数集求均值,其值为18。则该天内的归一化参数、检测门限值以及信噪比分别记为[0.46,224,18]。The minimum value of the normalized parameter set for one day is 224; the mean value of the detection threshold set for one day is 0.46; the mean value of the signal-to-noise ratio parameter set for one day is 18. Then the normalization parameter, detection threshold value and signal-to-noise ratio of the day are recorded as [0.46, 224, 18], respectively.
B4:统计频点129.45MHz全部实测数据的归一化参数、门限值与信噪比。根据频点129.45MHz实测数据的采集天数,重复步骤B1~B3,统计频点129.45MHz全部数据的归一化参数、门限值与信噪比。B4 : Normalization parameters, threshold value and signal-to-noise ratio of all measured data at the frequency point of 129.45MHz. Steps B1 to B3 are repeated according to the collection days of the measured data at the frequency point 129.45MHz, and the normalization parameters, threshold value and signal-to-noise ratio of all the data at the frequency point 129.45MHz are counted.

B5:将所得归一化参数集中的最小值为221;对所得检测门限集求均值,其值为0.46;对所得信噪比参数集求均值,其值为18。则全部数据的归一化参数、检测门限值以及信噪比分别记为[0.46,221,18]。B5 : the minimum value in the obtained normalization parameter set is 221; the average value of the obtained detection threshold set is 0.46; the average value of the obtained signal-to-noise ratio parameter set is 18. Then the normalization parameters, detection threshold and signal-to-noise ratio of all data are recorded as [0.46, 221, 18] respectively.
C.统计所有已测频点集{120.3MHz、129.2MHz、129.45MHz}的数据归一化参数、门限值与信噪比。重复步骤A~B,统计全部频点数据的归一化参数、检测门限值、信噪比。C. Statistical data normalization parameters, threshold value and signal-to-noise ratio of all measured frequency point sets {120.3MHz, 129.2MHz, 129.45MHz}. Repeat steps A to B to count normalization parameters, detection thresholds, and signal-to-noise ratios of all frequency point data.


D.检测信号并形成标签。D. Detect the signal and form a label.
D1:利用步骤B5中所得到频点129.45MHz对应的归一化参数为221,对频点129.45MHz的每秒实测数据进行归一化,并提取归一化后数据的最大值,与频点129.45MHz的检测门限值进行比较。当该最大值大于等于检测门限值时,则判定为信号(标签为1),否则判定为噪声(标签为0)。D1: Using the normalization parameter corresponding to the frequency point129.45MHz obtained in step B5 to be 221, normalize the measured data per second at the frequency point 129.45MHz, and extract the maximum value of the normalized data, and The detection threshold value of the frequency point 129.45MHz is compared. When the maximum value is greater than or equal to the detection threshold value, it is judged as a signal (the label is 1), otherwise it is judged as noise (the label is 0).
D2:统计频点129.45MHz在1天内的数据标签。重复步骤D1对频点129.45MHz在1天内的实测数据进行标签统计。D2 : The data label of the statistical frequency point 129.45MHz within 1 day. Repeat step D1 to perform label statistics on the measured data of the frequency point 129.45MHz withinone day.

E.通信时长边界判定。E. Communication duration boundary determination.
E1:统计最大通信时长。依据步骤D中获得的标签,统计标签连续为1的时间长度,作为连续通信时间,并将最大通信时长作为129.45MHz频点数据预处理中的单位时间尺度。E1 : Statistics of the maximum communication duration. According to the label obtained in step D, count the time length of the label being 1 continuously as the continuous communication time, and take the maximum communication time as the unit time scale in the preprocessing of the 129.45MHz frequency point data.


E2:统计频点129.45MHz的1秒实测数据中连续的信号数据点。依据步骤C所获得的129.45MHz频点的归一化参数对1秒数据进行归一化,将归一化后的数据与步骤C所得的129.45MHz频点的门限值进行对比。若大于门限值则判定为信号数据点,若小于门限值则判定为噪声数据点,统计1秒钟内所有连续的信号数据点长度。E2 : continuous signal data points in the 1-second measured data of the statistical frequency point 129.45 MHz. The 1-second data is normalized according to the normalization parameter of the 129.45MHz frequency point obtained in step C, and the normalized data is compared with the threshold value of the 129.45MHz frequency point obtained in step C. If it is greater than the threshold value, it is judged as a signal data point, and if it is less than the threshold value, it is judged as a noise data point, and the length of all continuous signal data points within 1 second is counted.
E3:重复步骤E2统计129.45MHz频点的1天实测数据中连续的信号数据点长度,并对得到的数据点长度进行累积分布函数(CDF)计算。E3 : Repeat step E2 to count the lengths of continuous signal data points in the 1-day measured data of the 129.45 MHz frequency point, and perform cumulative distribution function (CDF) calculation on the lengths of the obtained data points.

选取累积分布概率为95%的连续信号数据点长度作为129.45MHz频点的1天实测数据中最小通信时长。The length of continuous signal data points with a cumulative distribution probability of 95% is selected as the minimum communication duration in the 1-day measured data of the 129.45MHz frequency point.
E4:重复步骤E1~E3,根据129.45MHz频点的采集天数,统计频点129.45MHz实测数据中的最小通信时长。E4 : Repeat steps E1 to E3 , and count the minimum communication duration in the measured data of the frequency point 129.45 MHz according to the number of days of collection of the frequency point of 129.45 MHz.


最终,统计129.45MHz频点实测数据的最小通信时长中的最小值为128,并作为该频点数据的切片长度。Finally, the minimum value of the minimum communication duration of the measured data at the 129.45MHz frequency point is 128, and it is used as the slice length of the frequency point data.
F.计算已测频点集{120.3MHz;129.2MHz;129.45MHz}的最大通信时长、最小通信时长。重复步骤A~E完成全部全部已测频点的最大、最小通信时长统计。F. Calculate the maximum communication duration and the minimum communication duration of the measured frequency point set {120.3MHz; 129.2MHz; 129.45MHz}. Repeat steps A to E to complete the statistics of the maximum and minimum communication durations of all measured frequency points.

最终将已测频点集{120.3MHz;129.2MHz;129.45MHz}中各频点最大通信时长中的最大值作为所有频点数据预处理中的单位时间尺度,其值为11s,将最小通信时长中的最大值作为所有频点数据预处理中的切片长度,其值为276。Finally, the maximum value of the maximum communication duration of each frequency point in the measured frequency point set {120.3MHz; 129.2MHz; 129.45MHz} is taken as the unit time scale in the data preprocessing of all frequency points, and its value is 11s. The maximum value in is used as the slice length in all frequency point data preprocessing, and its value is 276.
G.对129.45MHz频点实测数据进行切片、压缩并形成张量。G. Slice, compress and form tensors for the measured data at the 129.45MHz frequency point.
G1:对频点129.45MHz单位时间尺度的实测数据进行切片。依据步骤F中所获得的最大单位时间尺度,计算其数据点个数N=[(131072×11)×1]。切片长度为276,对N进行切片处理,重构成大小为[5223×276]的矩阵,完成129.45MHz频点在单位时间尺度的实测数据切片,并将切片后的数据进行重组,重构成“I+j*Q”的形式,形成[5223×138]矩阵。G1 : Slice the measured data with a unit time scale of 129.45 MHz at the frequency point. According to the maximum unit time scale obtained in step F, the number of data points N=[(131072×11)×1] is calculated. The slice length is 276, and N is sliced, reconstructed into a matrix with a size of [5223×276], and the measured data slice of the 129.45MHz frequency point in the unit time scale is completed, and the sliced data is reorganized and reconstructed into "I"+j*Q", forming a [5223×138] matrix.
G2:对129.45MHz频点单个切片数据进行压缩。对切片数据的实部和虚部分别进行求模、平均值处理,形成“-0.734+0.254i”的数据点。G2 : Compress the single slice data of the 129.45MHz frequency point. The real and imaginary parts of the slice data are modulo-calculated and averaged respectively to form a data point of "-0.734+0.254i".
G3:重复步骤G2,对129.45MHz频点的单位时间尺度的所有切片数据进行压缩,形成大小为[5223×1]的矩阵。G3 : Repeat step G2 to compress all slice data of the unit time scale of the 129.45MHz frequency point to form a matrix with a size of [5223×1].
G4:对129.45MHz频点的一天的实测数据进行切片、压缩。重复步骤G1~G3,对129.45MHz频点的实测数据进行切片、压缩,重构成大小为[20512145×1]的矩阵(采集小时数为12),以此形成样本张量。G4 : Slice and compress the measured data of one day at the frequency of 129.45MHz. Repeat steps G1 to G3 , slice and compress the measured data of the 129.45MHz frequency point, and reconstruct it into a matrix with a size of [20512145×1] (the number of acquisition hours is 12) to form a sample tensor.
G5:对129.45MHz频点的所有的实测数据进行切片、压缩。重复步骤G1~G4,依据129.45MHz频点的数据的采集天数,完成129.45MHz频点的所有实测数据的切片、压缩,形成大小为[20512145×1×30]的张量(采集天数为30)。G5 : Slice and compress all the measured data at the 129.45MHz frequency point. Repeat steps G1 to G4 , and complete the slicing and compression of all measured data at the 129.45MHz frequency point according to the number of days of data collection at the 129.45MHz frequency point to form a tensor with a size of [20512145×1×30] (the collection days are 30).
H.对所有已测频点集{120.3MHz;129.2MHz;129.45MHz}的实测数据进行数据预处理。重复步骤G完成已测频点集{120.3MHz;129.2MHz;129.45MHz}实测数据的切片、压缩以及张量形成,最终重构成大小为[20512145×3×30]的三维张量数据样本。H. Perform data preprocessing on the measured data of all measured frequency point sets {120.3MHz; 129.2MHz; 129.45MHz}. Step G is repeated to complete the slicing, compression and tensor formation of the measured data of the measured frequency point set {120.3MHz; 129.2MHz; 129.45MHz}, and finally reconstructed into a three-dimensional tensor data sample with a size of [20512145×3×30].
原始数据的二维时域图与进行滑窗处理后数据的二维时域图如图3、图4所示。图3显示了原始噪声数据与含噪信号数据的二维时域图,表明了噪声与含噪信号在幅值上具有可分性,但可分性效果不明显。图4显示了经过滑窗处理后数据的二维时域图,表明数据在进行滑窗处理后,在幅值上的可分性明显。说明可利用滑窗处理后数据的幅值可分性可以实现噪声与含噪信号的分类。The two-dimensional time-domain graph of the original data and the two-dimensional time-domain graph of the data after sliding window processing are shown in Figures 3 and 4. Figure 3 shows the two-dimensional time-domain diagram of the original noise data and the noise-containing signal data, which shows that the noise and the noise-containing signal are separable in amplitude, but the separability effect is not obvious. Figure 4 shows the two-dimensional time-domain graph of the data after sliding window processing, indicating that the data has obvious separability in amplitude after sliding window processing. It shows that the classification of noise and noise-containing signals can be achieved by using the amplitude separability of the data processed by the sliding window.
通信频率129.45MHz的最小通信时长累积分布图如图4所示,表明最小通信时长的分布情况,选取CDF值为0.95所对应的时间采样点长度作为数据预处理的切片长度,更好地保证预测效果。The cumulative distribution diagram of the minimum communication duration of the communication frequency of 129.45MHz is shown in Figure 4, which shows the distribution of the minimum communication duration. The length of the time sampling point corresponding to the CDF value of 0.95 is selected as the slice length of data preprocessing to better ensure prediction. Effect.
综上所述,本发明通过智能频谱传感器对机场终端区甚高频通信实测数据进行采集,设置信号检测阈值来统计数据的最大、最小通信时长,并依据最小通信时长对数据样本进行压缩,依据最大通信时长对数据样本进行切片,最终生成适合智能频谱预测神经网络输入的三维张量训练样本。该方法可以获得更高质量的频谱预测数据,为后续训练智能频谱预测神经网络模型参数构建了高质量的频谱数据样本,提升了复杂电磁环境下智能频谱预测神经网络的预测能力,最终达到提升频谱预测准确度和可靠性的目的,为提升机场终端区的甚高频话音通信频率利用率以及保障机场终端区的航空运行安全提供了重要技术支撑。To sum up, the present invention collects the measured VHF communication data in the airport terminal area through the intelligent spectrum sensor, sets the signal detection threshold to count the maximum and minimum communication duration of the data, and compresses the data samples according to the minimum communication duration. The maximum communication duration slices the data samples, and finally generates a three-dimensional tensor training sample suitable for the input of the intelligent spectrum prediction neural network. This method can obtain higher-quality spectrum prediction data, build high-quality spectrum data samples for the subsequent training of intelligent spectrum prediction neural network model parameters, improve the prediction ability of intelligent spectrum prediction neural network in complex electromagnetic environment, and finally achieve improved spectrum The purpose of prediction accuracy and reliability provides important technical support for improving the frequency utilization rate of VHF voice communication in the airport terminal area and ensuring the aviation operation safety of the airport terminal area.
最后应说明的是:以上所述仅为本发明的优选实施例而已,并不用于限制本发明,尽管参照前述实施例对本发明进行了详细的说明,对于本领域的技术人员来说,其依然可以对前述各实施例所记载的技术方案进行修改,或者对其中部分技术特征进行等同替换。凡在本发明的精神和原则之内,所作的任何修改、等同替换、改进等,均应包含在本发明的保护范围之内。Finally, it should be noted that the above descriptions are only preferred embodiments of the present invention, and are not intended to limit the present invention. Although the present invention has been described in detail with reference to the foregoing embodiments, for those skilled in the art, the The technical solutions described in the foregoing embodiments may be modified, or some technical features thereof may be equivalently replaced. Any modification, equivalent replacement, improvement, etc. made within the spirit and principle of the present invention shall be included within the protection scope of the present invention.
Claims (7)
Translated fromChinese


Priority Applications (1)
| Application Number | Priority Date | Filing Date | Title |
|---|---|---|---|
| CN202010969910.6ACN112272066B (en) | 2020-09-15 | 2020-09-15 | Frequency spectrum data cleaning method used in airport terminal area very high frequency communication |
Applications Claiming Priority (1)
| Application Number | Priority Date | Filing Date | Title |
|---|---|---|---|
| CN202010969910.6ACN112272066B (en) | 2020-09-15 | 2020-09-15 | Frequency spectrum data cleaning method used in airport terminal area very high frequency communication |
Publications (2)
| Publication Number | Publication Date |
|---|---|
| CN112272066A CN112272066A (en) | 2021-01-26 |
| CN112272066Btrue CN112272066B (en) | 2022-08-26 |
Family
ID=74349004
Family Applications (1)
| Application Number | Title | Priority Date | Filing Date |
|---|---|---|---|
| CN202010969910.6AActiveCN112272066B (en) | 2020-09-15 | 2020-09-15 | Frequency spectrum data cleaning method used in airport terminal area very high frequency communication |
Country Status (1)
| Country | Link |
|---|---|
| CN (1) | CN112272066B (en) |
Families Citing this family (2)
| Publication number | Priority date | Publication date | Assignee | Title |
|---|---|---|---|---|
| CN113312996B (en)* | 2021-05-19 | 2023-04-18 | 哈尔滨工程大学 | Detection and identification method for aliasing short-wave communication signals |
| CN114614922B (en)* | 2022-03-16 | 2024-06-14 | 三亚航空旅游职业学院 | Spectrum data cleaning method in civil aviation very high frequency communication based on frequency domain |
Citations (5)
| Publication number | Priority date | Publication date | Assignee | Title |
|---|---|---|---|---|
| EP0575110A2 (en)* | 1992-06-16 | 1993-12-22 | Sony Corporation | Compressing and expanding digital signals |
| CN105654963A (en)* | 2016-03-23 | 2016-06-08 | 天津大学 | Voice underdetermined blind identification method and device based on frequency spectrum correction and data density clustering |
| CN107273860A (en)* | 2017-06-20 | 2017-10-20 | 电子科技大学 | Frequency Hopping Signal dynamic clustering extracting method based on connected component labeling |
| CN109831265A (en)* | 2019-01-24 | 2019-05-31 | 西安电子科技大学 | A kind of wideband signal spectrum cognitive method and system based on airspace filter |
| CN109951243A (en)* | 2017-12-20 | 2019-06-28 | 中国科学院深圳先进技术研究院 | A kind of spectrum prediction method, system and electronic device |
Family Cites Families (14)
| Publication number | Priority date | Publication date | Assignee | Title |
|---|---|---|---|---|
| WO2006073893A2 (en)* | 2005-01-05 | 2006-07-13 | Atc Technologies, Llc | Adaptive beam forming with multi-user detection and interference reduction in satellite communiation systems and methods |
| US8825131B2 (en)* | 2009-10-14 | 2014-09-02 | Nocimed, Llc | MR spectroscopy system and method for diagnosing painful and non-painful intervertebral discs |
| CN103986539B (en)* | 2014-06-10 | 2016-02-03 | 哈尔滨工业大学 | A kind of cognitive radio frequency spectrum sensing method based on sparse denoising |
| DE102015010602A1 (en)* | 2015-08-18 | 2017-02-23 | Hochschule Aschaffenburg | Method for analyzing a data set of a time-of-flight mass spectrometry measurement and a device |
| JP6731497B2 (en)* | 2016-05-13 | 2020-07-29 | 華為技術有限公司Huawei Technologies Co.,Ltd. | Channel state information reporting method, channel state information reading method, and related apparatus |
| CN106569188B (en)* | 2016-11-01 | 2019-03-05 | 中国航天科工集团八五一一研究所 | Based on the ionosphere phase perturbation correction algorithm for improving PGA |
| US10637544B1 (en)* | 2018-04-24 | 2020-04-28 | Genghiscomm Holdings, LLC | Distributed radio system |
| CN109344207B (en)* | 2018-08-07 | 2021-08-06 | 南京航空航天大学 | Space-earth integrated spectrum big data platform based on Beidou scanning |
| CN109995448A (en)* | 2019-02-28 | 2019-07-09 | 南京航空航天大学 | Long-term spectral prediction method with missing values and sparse outliers |
| CN110471104B (en)* | 2019-08-26 | 2021-03-16 | 电子科技大学 | Post-stack seismic reflection pattern recognition method based on intelligent feature learning |
| CN110610717B (en)* | 2019-08-30 | 2021-10-15 | 西南电子技术研究所(中国电子科技集团公司第十研究所) | Separation method of mixed signals in complex frequency spectrum environment |
| CN110855384B (en)* | 2019-10-23 | 2021-08-27 | 中国科学院新疆天文台 | Wideband frequency spectrum signal-noise separation method based on window division |
| CN111193618B (en)* | 2019-12-20 | 2021-05-25 | 山东大学 | A 6G mobile communication system based on tensor computing and its data processing method |
| CN111130630A (en)* | 2019-12-31 | 2020-05-08 | 南京御通信息技术有限公司 | Communication satellite frequency spectrum monitoring equipment and frequency spectrum acquisition and feature identification method thereof |
- 2020
- 2020-09-15CNCN202010969910.6Apatent/CN112272066B/enactiveActive
Patent Citations (5)
| Publication number | Priority date | Publication date | Assignee | Title |
|---|---|---|---|---|
| EP0575110A2 (en)* | 1992-06-16 | 1993-12-22 | Sony Corporation | Compressing and expanding digital signals |
| CN105654963A (en)* | 2016-03-23 | 2016-06-08 | 天津大学 | Voice underdetermined blind identification method and device based on frequency spectrum correction and data density clustering |
| CN107273860A (en)* | 2017-06-20 | 2017-10-20 | 电子科技大学 | Frequency Hopping Signal dynamic clustering extracting method based on connected component labeling |
| CN109951243A (en)* | 2017-12-20 | 2019-06-28 | 中国科学院深圳先进技术研究院 | A kind of spectrum prediction method, system and electronic device |
| CN109831265A (en)* | 2019-01-24 | 2019-05-31 | 西安电子科技大学 | A kind of wideband signal spectrum cognitive method and system based on airspace filter |
Also Published As
| Publication number | Publication date |
|---|---|
| CN112272066A (en) | 2021-01-26 |
Similar Documents
| Publication | Publication Date | Title |
|---|---|---|
| CN112272066B (en) | Frequency spectrum data cleaning method used in airport terminal area very high frequency communication | |
| CN118607390B (en) | Intelligent diagnosis and isolation device and method for distribution network line fault | |
| CN115935296B (en) | Electric energy data metering method and system | |
| CN112213688B (en) | A feature extraction method for individual recognition of low, small and slow aircraft targets in low-altitude airspace | |
| CN103760543A (en) | MM-CFAR target detection method | |
| CN102624468A (en) | Automatic broadband detection method based on dual fast Fourier transformation (FFT) | |
| CN108042130A (en) | One kind is based on empirical mode decomposition(EMD)EEG signals preprocess method | |
| CN111175729A (en) | A real-time online monitoring and early warning system based on toothed whale high-frequency sonar signals | |
| CN104780008A (en) | Broadband spectrum sensing method based on self-adaptive compressed sensing | |
| CN114614922B (en) | Spectrum data cleaning method in civil aviation very high frequency communication based on frequency domain | |
| CN114707558A (en) | Method and medium for extracting, classifying and identifying ice collapse infrasound characteristic | |
| CN108880621B (en) | Adaptive filtering method for power line communication signals | |
| CN112986922A (en) | Passive radar signal detection method based on sequential statistical filtering and binary detection | |
| CN109474355A (en) | Adaptive noise THRESHOLD ESTIMATION and method for extracting signal based on spectrum monitoring data | |
| CN120034280B (en) | A power equipment status monitoring system based on the Internet of Things | |
| CN103634829B (en) | A kind of section screening technique based on drive test information and equipment | |
| CN109257068B (en) | Adaptive filtering method for power line communication signals | |
| CN118885872B (en) | Auditory directional attention decoding method and device | |
| Montanyà et al. | Study of the total lightning activity in a hailstorm | |
| CN103415035A (en) | TD-S disturbance matrix building system based on MR (measurement reports) and achieving method thereof | |
| CN118972011A (en) | Real-time radio spectrum situation monitoring method based on density increment clustering algorithm | |
| Aziz et al. | Spectrum sensing for cognitive radio using multicoset sampling | |
| Tang et al. | Research on Electromagnetic Interference Signal Characteristics and Suppression Methods for High Frequency Partial Discharge Monitoring in Renewable Energy Stations | |
| CN116879974A (en) | Online judging method for abnormal operation of detector in microseismic monitoring system | |
| CN116035595A (en) | An automatic diagnosis method for neonatal convulsions based on complex network features of amplitude-integrated EEG |
Legal Events
| Date | Code | Title | Description |
|---|---|---|---|
| PB01 | Publication | ||
| PB01 | Publication | ||
| SE01 | Entry into force of request for substantive examination | ||
| SE01 | Entry into force of request for substantive examination | ||
| GR01 | Patent grant | ||
| GR01 | Patent grant |