CN112085926A - River water pollution early warning method and system - Google Patents
River water pollution early warning method and systemDownload PDFInfo
- Publication number
- CN112085926A CN112085926ACN202010765837.0ACN202010765837ACN112085926ACN 112085926 ACN112085926 ACN 112085926ACN 202010765837 ACN202010765837 ACN 202010765837ACN 112085926 ACN112085926 ACN 112085926A
- Authority
- CN
- China
- Prior art keywords
- pollution
- physical quantity
- sensor node
- model
- quantity data
- Prior art date
- Legal status (The legal status is an assumption and is not a legal conclusion. Google has not performed a legal analysis and makes no representation as to the accuracy of the status listed.)
- Granted
Links
Images

Classifications
- G—PHYSICS
- G08—SIGNALLING
- G08B—SIGNALLING OR CALLING SYSTEMS; ORDER TELEGRAPHS; ALARM SYSTEMS
- G08B21/00—Alarms responsive to a single specified undesired or abnormal condition and not otherwise provided for
- G08B21/02—Alarms for ensuring the safety of persons
- G08B21/12—Alarms for ensuring the safety of persons responsive to undesired emission of substances, e.g. pollution alarms
- G—PHYSICS
- G01—MEASURING; TESTING
- G01N—INVESTIGATING OR ANALYSING MATERIALS BY DETERMINING THEIR CHEMICAL OR PHYSICAL PROPERTIES
- G01N33/00—Investigating or analysing materials by specific methods not covered by groups G01N1/00 - G01N31/00
- G01N33/18—Water
- G—PHYSICS
- G06—COMPUTING OR CALCULATING; COUNTING
- G06F—ELECTRIC DIGITAL DATA PROCESSING
- G06F17/00—Digital computing or data processing equipment or methods, specially adapted for specific functions
- G06F17/10—Complex mathematical operations
- G06F17/18—Complex mathematical operations for evaluating statistical data, e.g. average values, frequency distributions, probability functions, regression analysis
- G—PHYSICS
- G06—COMPUTING OR CALCULATING; COUNTING
- G06F—ELECTRIC DIGITAL DATA PROCESSING
- G06F18/00—Pattern recognition
- G06F18/20—Analysing
- G06F18/21—Design or setup of recognition systems or techniques; Extraction of features in feature space; Blind source separation
- G06F18/213—Feature extraction, e.g. by transforming the feature space; Summarisation; Mappings, e.g. subspace methods
- G06F18/2135—Feature extraction, e.g. by transforming the feature space; Summarisation; Mappings, e.g. subspace methods based on approximation criteria, e.g. principal component analysis
- G—PHYSICS
- G06—COMPUTING OR CALCULATING; COUNTING
- G06F—ELECTRIC DIGITAL DATA PROCESSING
- G06F18/00—Pattern recognition
- G06F18/20—Analysing
- G06F18/21—Design or setup of recognition systems or techniques; Extraction of features in feature space; Blind source separation
- G06F18/214—Generating training patterns; Bootstrap methods, e.g. bagging or boosting
- G—PHYSICS
- G06—COMPUTING OR CALCULATING; COUNTING
- G06F—ELECTRIC DIGITAL DATA PROCESSING
- G06F18/00—Pattern recognition
- G06F18/20—Analysing
- G06F18/24—Classification techniques
- G06F18/241—Classification techniques relating to the classification model, e.g. parametric or non-parametric approaches
- G06F18/2411—Classification techniques relating to the classification model, e.g. parametric or non-parametric approaches based on the proximity to a decision surface, e.g. support vector machines
- G—PHYSICS
- G08—SIGNALLING
- G08B—SIGNALLING OR CALLING SYSTEMS; ORDER TELEGRAPHS; ALARM SYSTEMS
- G08B25/00—Alarm systems in which the location of the alarm condition is signalled to a central station, e.g. fire or police telegraphic systems
- G08B25/01—Alarm systems in which the location of the alarm condition is signalled to a central station, e.g. fire or police telegraphic systems characterised by the transmission medium
- G08B25/10—Alarm systems in which the location of the alarm condition is signalled to a central station, e.g. fire or police telegraphic systems characterised by the transmission medium using wireless transmission systems
Landscapes
- Engineering & Computer Science (AREA)
- Physics & Mathematics (AREA)
- Data Mining & Analysis (AREA)
- General Physics & Mathematics (AREA)
- Theoretical Computer Science (AREA)
- Life Sciences & Earth Sciences (AREA)
- Bioinformatics & Computational Biology (AREA)
- Evolutionary Biology (AREA)
- Bioinformatics & Cheminformatics (AREA)
- General Engineering & Computer Science (AREA)
- Computer Vision & Pattern Recognition (AREA)
- Evolutionary Computation (AREA)
- Artificial Intelligence (AREA)
- Health & Medical Sciences (AREA)
- Mathematical Optimization (AREA)
- Pure & Applied Mathematics (AREA)
- Mathematical Physics (AREA)
- Chemical & Material Sciences (AREA)
- Mathematical Analysis (AREA)
- General Health & Medical Sciences (AREA)
- Computational Mathematics (AREA)
- Emergency Management (AREA)
- Business, Economics & Management (AREA)
- Probability & Statistics with Applications (AREA)
- Databases & Information Systems (AREA)
- Immunology (AREA)
- Biochemistry (AREA)
- Analytical Chemistry (AREA)
- Operations Research (AREA)
- Pathology (AREA)
- Algebra (AREA)
- Computer Networks & Wireless Communication (AREA)
- Medicinal Chemistry (AREA)
- Food Science & Technology (AREA)
- Software Systems (AREA)
- Environmental & Geological Engineering (AREA)
- Toxicology (AREA)
- Management, Administration, Business Operations System, And Electronic Commerce (AREA)
Abstract
Description
Translated fromChinese技术领域technical field
本公开涉及水环境污染预警领域,具体涉及一种河道水污染预警方法及系统。The present disclosure relates to the field of early warning of water environment pollution, in particular to a method and system for early warning of river water pollution.
背景技术Background technique
在河道整治的工作中,大部分的污染监测站仅设置在重要的流域进出界线处,各污染监测站之间的距离一般有上百公里,在这一段上百公里的区间内,存在着大量的排污口,难以对河道中的水质污染情况进行分析与预警,使得监测工作难以达到实时性,当发生严重污染时,可能需要好几个小时,甚至好几天才能被河道监测部门设置的污染监测站所监测到,无法迅速的定位与监测河道污染情况,难以实现精准定位监测,不能够实现污染企业的准确、从而快速的分析出污染成因。In the work of river remediation, most of the pollution monitoring stations are only set up at the entry and exit boundaries of important river basins. The distance between pollution monitoring stations is generally hundreds of kilometers. In this section of hundreds of kilometers, there are many It is difficult to analyze and warn the water pollution in the river, making it difficult to achieve real-time monitoring. When serious pollution occurs, it may take hours or even days to be monitored by the river monitoring department. According to the monitoring of the station, it is impossible to quickly locate and monitor the pollution of the river, it is difficult to achieve accurate positioning and monitoring, and it is impossible to accurately and quickly analyze the causes of pollution by polluting enterprises.
发明内容SUMMARY OF THE INVENTION
本发明的目的在于提出一种河道水污染预警方法及系统,以解决现有技术中所存在的一个或多个技术问题,至少提供一种有益的选择或创造条件。The purpose of the present invention is to propose a method and system for early warning of river water pollution, so as to solve one or more technical problems existing in the prior art, and at least provide a beneficial choice or create conditions.
为了实现上述目的,根据本公开的一方面,提供一种河道水污染预警方法,所述方法包括以下步骤:In order to achieve the above object, according to an aspect of the present disclosure, a method for early warning of river water pollution is provided, the method comprising the following steps:
步骤1,在河道中等距设置传感器节点;Step 1, set sensor nodes at the same distance in the river;
步骤2,通过传感器节点采集物理量数据;Step 2, collecting physical quantity data through sensor nodes;
步骤3,对物理量数据进行预处理提取关键因子;Step 3, preprocessing the physical quantity data to extract key factors;
步骤4,构建灰色预测模型计算关键因子的预测值;Step 4, constructing a gray prediction model to calculate the predicted value of the key factor;
步骤5,构建SVR模型并通过SVR模型和预测值进行预测传感器节点所在的水域的污染度;Step 5, build an SVR model and predict the pollution degree of the water area where the sensor node is located by using the SVR model and the predicted value;
步骤6,当传感器节点所在的水域的污染度大于污染阈值时推送污染预警信息到管理人员的移动设备。Step 6, when the pollution degree of the water area where the sensor node is located is greater than the pollution threshold, push the pollution warning information to the mobile device of the manager.
进一步地,在步骤1中,所述传感器节点为有源的温度传感器、电导率传感器、COD传感器、pH传感器和余氯传感器构成,传感器节点通过通信线路供电与传输物理量数据到基站;所述基站用于接收传感器节点的传感器编号、传感器节点采集的物理量数据;在河道中等距设置传感器节点为在河道的水中每隔500米等距设置一个传感器节点。Further, in step 1, the sensor node is composed of an active temperature sensor, a conductivity sensor, a COD sensor, a pH sensor and a residual chlorine sensor, and the sensor node supplies power and transmits physical quantity data to the base station through a communication line; the base station It is used to receive the sensor number of the sensor node and the physical quantity data collected by the sensor node; setting the sensor node at the same distance in the river channel means setting a sensor node at the same distance every 500 meters in the water of the river channel.
进一步地,温度传感器的参数为:精度:±0.1℃,量程:-5-50℃(23–122°F),分辨率:0.01℃;电导率传感器的参数为:精度:0-10000μS/cm为读数的±0.5%+1μS/cm;精度:100000-200000μS/cm为读数的±1%,量程:0-350,000μS/cm,分辨率:0.1μS/cm;COD传感器的参数为:精度:±0.1mg/L,量程:0-20mg/L;分辨率:0.01mg/L;pH传感器的参数为:精度:±0.1pH或更好,量程:0-14pH,分辨率:0.01pH;余氯传感器的参数为:测量范围0.00~4.00mg/L,余氯值0-30mg/L,温度-10.0~+60.0℃、输出4-20mA/0-20mA。Further, the parameters of the temperature sensor are: accuracy: ±0.1°C, range: -5-50°C (23-122°F), resolution: 0.01°C; the parameters of the conductivity sensor are: accuracy: 0-10000μS/cm is ±0.5% of reading + 1μS/cm; accuracy: 100000-200000μS/cm is ±1% of reading, range: 0-350,000μS/cm, resolution: 0.1μS/cm; COD sensor parameters are: accuracy: ±0.1mg/L, range: 0-20mg/L; resolution: 0.01mg/L; pH sensor parameters are: accuracy: ±0.1pH or better, range: 0-14pH, resolution: 0.01pH; The parameters of the chlorine sensor are: measuring range 0.00~4.00mg/L, residual chlorine value 0-30mg/L, temperature -10.0~+60.0℃, output 4-20mA/0-20mA.
进一步地,在步骤2中,所述物理量数据包括温度、电导率、化学需氧量、pH值、余氯量。Further, in step 2, the physical quantity data includes temperature, electrical conductivity, chemical oxygen demand, pH value, and residual chlorine.
进一步地,在步骤3中,对物理量数据进行预处理提取关键因子的方法为:Further, in step 3, the method for preprocessing the physical quantity data to extract key factors is:
步骤3.1,分别记物理量数据:温度、电导率、化学需氧量、pH值、余氯量为x1,x2,x3,x4,x5,把传感器节点所在的水域的污染度记为y,污染度y的计算方法为:y为x1,x2,x3,x4,x5中任意一个物理量数据大于预设值的物理量数据的数量;Step 3.1, record the physical quantity data: temperature, conductivity, chemical oxygen demand, pH value, residual chlorine as x1 , x2 , x3 , x4 , x5 , record the pollution degree of the water area where the sensor node is located is y, and the calculation method of pollution degree y is: y is the number of physical quantity data whose physical quantity data is greater than the preset value in x1 , x2 , x3 , x4 , and x5 ;
其中,x1的预设值为35℃,x2的预设值为1500-2000uS/cm,x3的预设值为300~350mg/L,x4的预设值为4.0~9.5,x5的预设值为9.17kgCL/h,预设值均可以人工调整;Among them, the default value of x1 is 35℃, the default value of x2 is 1500-2000uS/cm, the default value of x3 is 300-350mg/L, the default value of x4 is 4.0-9.5, and the default value of x5 The preset value of 9.17kgCL/h, the preset value can be adjusted manually;
步骤3.2,使用信息增益法和Lasso特征选取算法对数据进行预处理;信息增益基于信息论中熵的概念,熵是对事件的属性的不确定性的度量;一个属性的熵越大,它蕴含的不确定信息越大;因此,采用贪心算法ID3,总是选择具有最高信息增益的属性作为当前结点的测试属性,从而判断出影响污染度的主要因子;该步骤的信息增益法法及Lasso特征选取算法主要是用于选取影响污染度的关键特征,具体处理过程如下:Step 3.2, use the information gain method and the Lasso feature selection algorithm to preprocess the data; the information gain is based on the concept of entropy in information theory, and entropy is a measure of the uncertainty of the attributes of an event; the greater the entropy of an attribute, the more information it contains. The greater the uncertainty information; therefore, using the greedy algorithm ID3, the attribute with the highest information gain is always selected as the test attribute of the current node, so as to determine the main factor affecting the pollution degree; the information gain method and Lasso feature of this step are The selection algorithm is mainly used to select the key features that affect the pollution degree. The specific processing process is as follows:
步骤3.2.1,将污染度y与污染度的影响因素x1,x2,x3,x4,x5的数据做标准化预处理:转化函数为
其中,步骤3.2.1相当于标准化,用于在后面计算Si,可参考论文《基于回归分析的房价模型及预测》(王赛),比如,记温度为α1(不同属性记为αj),对温度α1在5个节点的数据α11、α21、α31、α41、α51进行标准化(每个数据跟这5个数据的平均值做对比,大于取1,小于取0),以此类推,每个属性和污染度的数据都做同样处理,然后统计污染度中0,1两类的样本数,污染度为0记为s1,污染度为1记为s2。Among them, step 3.2.1 is equivalent to standardization, which is used to calculate Si later, you can refer to the paper "Regression Analysis-Based Housing Model and Prediction" (Wang Sai), for example, denote the temperature as α1 (different attributes are denoted as αj ), standardize the data α11 , α21 , α31 , α41 , and α51 of the temperature α1 at the 5 nodes (each data is compared with the average of these 5 data, greater than 1, less than 0 ), and so on, the data of each attribute and pollution degree are processed in the same way, and then count the number of samples of0 and1 in the pollution degree. .
步骤3.2.2,求出当前传感器节点物理量数据的样本分类所需要的期望信息;Step 3.2.2, obtain the expected information required for the sample classification of the physical quantity data of the current sensor node;
设S是S个当前传感器节点物理量数据的样本的集合,即一段给定时间中当前传感器节点采集的物理量数据,(例如最近30分钟),假定类标号属性具有m个不同的值,定义m个不同的类Ci(i=1,2,3…m),设si是类Ci中的样本数,对于给定的样本分类所需要的期望信息由下式给出:Let S be a collection of S samples of the physical quantity data of the current sensor node, that is, the physical quantity data collected by the current sensor node in a given period of time, (for example, the last 30 minutes), assuming that the class label attribute has m different values, define m For different classes Ci (i=1, 2, 3...m), let si be the number of samples in class Ci , the expected information required for a given sample classification is given by:

其中pi是任意样本属于Ci的概率,用si/s来估计;where pi is the probability that any sample belongs to Ci , estimated by si /s;
步骤3.2.3,求出属性(即污染度的影响因素)x1划分子集的熵;设Sij是子集Sj中类Ci的样本数;根据x1划分子集的熵为


步骤3.2.4,由期望信息和熵可以得到对应的信息增益:对于在x1上分支将获得的信息增益由下面的公式得到Gain(x1)=I(s1,s2…sm)-E(x1);Step 3.2.4, the corresponding information gain can be obtained from the expected information and entropy: for the information gain to be obtained by branching on x1 , the following formula is obtained Gain(x1 )=I(s1 , s2 ... sm ) -E(x1) ;
步骤3.2.5,同理通过步骤3.2.3到步骤3.2.4,得到各个属性(X2-X5)的信息增益,由大到小比较之后选择半数以上的属性作为预测属性,记为c1,c2,…,cn;Step 3.2.5, in the same way, through steps 3.2.3 to 3.2.4, the information gain of each attribute (X2 -X5 ) is obtained, and after comparing from large to small, more than half of the attributes are selected as the predicted attributes, denoted as c1 ,c2 ,…,cn ;
步骤3.2.6,对选取的属性(即影响污染度的主要因子)再结合Lasso特征选取算法选出影响污染度的关键因子;Lasso通过构造惩罚函数,实现将特征的系数进行压缩并使某些回归系数变为0来达到特征选择的目的;它是以缩小变量集为思想的压缩估计方法;模型选择本质上是寻求模型稀疏表达的过程,而这种过程可以通过优化一个“损失”+“惩罚”的函数问题来完成;Lasso方法对由信息增益法筛选出来的污染度影响因素再进一步筛选,提高因子质量;将Lasso参数估计定义为:


进一步地,在步骤4中,构建灰色预测模型计算关键因子的预测值的方法为:Further, in step 4, the method for constructing the grey prediction model to calculate the predicted value of the key factor is:
灰色预测是一种对含有不确定因素的系统进行预测的方法,是以灰色模型为基础的;选取常用的GM(1,1)模型;Grey forecasting is a method of forecasting a system with uncertain factors, based on grey model; the commonly used GM(1,1) model is selected;
步骤4.1,假定当前传感器节点xi的物理量数据的数据集定义为x(0)={x(0)(i)},xi对应的数据为x(0)(i),i=1,2,…,5,建立灰色预测模型如下:Step 4.1, assuming that the data set of the physical quantity data of the current sensor node xi is defined as x(0) = {x(0) (i)}, the data corresponding to xi is x(0) (i), i=1, 2,…,5, the grey prediction model is established as follows:
步骤4.2,对x(0)进行一次累加,得到一次累加序列x(1)={x(1)(k),k=0,1,2,…,m};Step 4.2: Accumulate x(0) once to obtain an accumulation sequence x(1) = {x(1) (k), k=0,1,2,...,m};
步骤4.3,对x(0)建立下述一阶线性微分方程,公式为
步骤4.4,求解微分方程,得到预测模型,公式为
步骤4.5,将GM(1,1)模型所得数据x*(1)(k+1)经过累减还原为x*(0)(k+1),即x(0)的灰色预测模型公式为
最终求得预测影响污染度的各关键因子的预测值记为
进一步地,在步骤5中,构建SVR模型并通过SVR模型和预测值进行预测传感器节点所在的水域的污染度的方法为:SVR在做拟合时采用了支持向量机的思想来对数据进行回归分析,把


进一步地,污染阈值为河道中所有传感器节点当前污染度的算术平均值。Further, the pollution threshold is the arithmetic mean of the current pollution degrees of all sensor nodes in the river.
进一步地,所述推送污染预警信息到管理人员的移动设备的方法为:基站将报警信息通过因特网推送到管理人员的移动设备。Further, the method for pushing the pollution warning information to the mobile device of the manager is: the base station pushes the alarm information to the mobile device of the manager through the Internet.
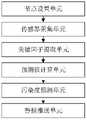
本发明还提供了一种河道水污染预警系统,所述装置包括:存储器、处理器以及存储在所述存储器中并可在所述处理器上运行的计算机程序,所述处理器执行所述计算机程序运行在以下装置的单元中:The present invention also provides a river water pollution early warning system, the device includes: a memory, a processor, and a computer program stored in the memory and executable on the processor, the processor executing the computer The program runs in units of the following devices:
节点设置单元,用于在河道中等距设置传感器节点;Node setting unit, used to set sensor nodes at equal distances in the river;
传感器采集单元,用于通过传感器节点采集物理量数据;The sensor acquisition unit is used to collect physical quantity data through sensor nodes;
关键因子提取单元,用于对物理量数据进行预处理提取关键因子;The key factor extraction unit is used to preprocess the physical quantity data to extract key factors;
预测值计算单元,用于构建灰色预测模型计算关键因子的预测值;The predicted value calculation unit is used to construct a gray prediction model to calculate the predicted value of key factors;
污染度预测单元,用于构建SVR模型并通过SVR模型和预测值进行预测传感器节点所在的水域的污染度;The pollution degree prediction unit is used to construct the SVR model and predict the pollution degree of the water area where the sensor node is located through the SVR model and the predicted value;
警报推送单元,用于在当传感器节点所在的水域的污染度大于污染阈值时推送污染预警信息到管理人员的移动设备。The alarm push unit is used to push the pollution early warning information to the manager's mobile device when the pollution degree of the water area where the sensor node is located is greater than the pollution threshold.
本公开的有益效果为:本发明提供一种河道水污染预警方法及系统,使用了信息增益法确定主要特征后结合了Lasso特征选取算法进一步降低了对因子质量的要求,确定了更加有效的关键因子,大幅度提高了预测精度的同时也减少了大量运算量,降低了传统的支持向量机预测方法对因子质量的要求,达到更好的效果,能够实时的智能判断水功能区的污染源位置、及时定位污染点并发出警报,出现异常时能够迅速给出预警排查节约大量的时间成本和提高环境预警效率,只需要采集较少时段的影响因素的污染数据集就可以通过预测模型求出精确度高的污染度预测值。The beneficial effects of the present disclosure are as follows: the present invention provides a method and system for early warning of river water pollution, which uses the information gain method to determine the main features and combines the Lasso feature selection algorithm to further reduce the requirements for the quality of the factors, and determines the more effective key factor, which greatly improves the prediction accuracy, but also reduces a large amount of computation, reduces the traditional support vector machine prediction method for the quality of the factor requirements, achieves better results, and can intelligently determine the location of pollution sources in the water functional area in real time, Timely locate the pollution point and issue an alarm. When an abnormality occurs, it can quickly give an early warning and check to save a lot of time and cost and improve the efficiency of environmental early warning. It only needs to collect pollution data sets of influencing factors in a small period of time, and the accuracy can be obtained through the prediction model. High contamination predictions.
附图说明Description of drawings
通过对结合附图所示出的实施方式进行详细说明,本公开的上述以及其他特征将更加明显,本公开附图中相同的参考标号表示相同或相似的元素,显而易见地,下面描述中的附图仅仅是本公开的一些实施例,对于本领域普通技术人员来讲,在不付出创造性劳动的前提下,还可以根据这些附图获得其他的附图,在附图中:The above-mentioned and other features of the present disclosure will become more apparent from the detailed description of the embodiments shown in conjunction with the accompanying drawings, in which the same reference numerals refer to the same or similar elements of the present disclosure. The drawings are only some embodiments of the present disclosure. For those of ordinary skill in the art, other drawings can also be obtained from these drawings without creative efforts. In the drawings:
图1所示为一种河道水污染预警方法的流程图;Figure 1 shows a flow chart of a method for early warning of river water pollution;
图2所示为一种河道水污染预警系统结构图。Figure 2 shows a structural diagram of a river water pollution early warning system.
具体实施方式Detailed ways
以下将结合实施例和附图对本公开的构思、具体结构及产生的技术效果进行清楚、完整的描述,以充分地理解本公开的目的、方案和效果。需要说明的是,在不冲突的情况下,本申请中的实施例及实施例中的特征可以相互组合。The concept, specific structure and technical effects of the present disclosure will be clearly and completely described below with reference to the embodiments and accompanying drawings, so as to fully understand the purpose, solutions and effects of the present disclosure. It should be noted that the embodiments in the present application and the features of the embodiments may be combined with each other in the case of no conflict.
如图1所示为根据本公开的一种河道水污染预警方法的流程图,下面结合图1来阐述根据本公开的实施方式的一种河道水污染预警方法。FIG. 1 is a flow chart of a method for early warning of river water pollution according to the present disclosure, and a method for early warning of river water pollution according to an embodiment of the present disclosure is described below with reference to FIG. 1 .
本公开提出一种河道水污染预警方法,具体包括以下步骤:The present disclosure proposes a method for early warning of river water pollution, which specifically includes the following steps:
步骤1,在河道中等距设置传感器节点;Step 1, set sensor nodes at the same distance in the river;
步骤2,通过传感器节点采集物理量数据;Step 2, collecting physical quantity data through sensor nodes;
步骤3,对物理量数据进行预处理提取关键因子;Step 3, preprocessing the physical quantity data to extract key factors;
步骤4,构建灰色预测模型计算关键因子的预测值;Step 4, constructing a gray prediction model to calculate the predicted value of the key factor;
步骤5,构建SVR模型并通过SVR模型和预测值进行预测传感器节点所在的水域的污染度;Step 5, build an SVR model and predict the pollution degree of the water area where the sensor node is located by using the SVR model and the predicted value;
步骤6,当传感器节点所在的水域的污染度大于污染阈值时推送污染预警信息到管理人员的移动设备。Step 6, when the pollution degree of the water area where the sensor node is located is greater than the pollution threshold, push the pollution warning information to the mobile device of the manager.
进一步地,在步骤1中,所述传感器节点为有源的温度传感器、电导率传感器、COD传感器、pH传感器和余氯传感器构成,传感器节点通过通信线路供电与传输物理量数据到基站;所述基站用于接收传感器节点的传感器编号、传感器节点采集的物理量数据;在河道中等距设置传感器节点为在河道的水中每隔500米等距设置一个传感器节点。Further, in step 1, the sensor node is composed of an active temperature sensor, a conductivity sensor, a COD sensor, a pH sensor and a residual chlorine sensor, and the sensor node supplies power and transmits physical quantity data to the base station through a communication line; the base station It is used to receive the sensor number of the sensor node and the physical quantity data collected by the sensor node; setting the sensor node at the same distance in the river channel means setting a sensor node at the same distance every 500 meters in the water of the river channel.
进一步地,温度传感器的参数为:精度:±0.1℃,量程:-5-50℃(23–122°F),分辨率:0.01℃;电导率传感器的参数为:精度:0-10000μS/cm为读数的±0.5%+1μS/cm;精度:100000-200000μS/cm为读数的±1%,量程:0-350,000μS/cm,分辨率:0.1μS/cm;COD传感器的参数为:精度:±0.1mg/L,量程:0-20mg/L;分辨率:0.01mg/L;pH传感器的参数为:精度:±0.1pH或更好,量程:0-14pH,分辨率:0.01pH;余氯传感器的参数为:测量范围0.00~4.00mg/L,余氯值0-30mg/L,温度-10.0~+60.0℃、输出4-20mA/0-20mA。Further, the parameters of the temperature sensor are: accuracy: ±0.1°C, range: -5-50°C (23-122°F), resolution: 0.01°C; the parameters of the conductivity sensor are: accuracy: 0-10000μS/cm is ±0.5% of reading + 1μS/cm; accuracy: 100000-200000μS/cm is ±1% of reading, range: 0-350,000μS/cm, resolution: 0.1μS/cm; COD sensor parameters are: accuracy: ±0.1mg/L, range: 0-20mg/L; resolution: 0.01mg/L; pH sensor parameters are: accuracy: ±0.1pH or better, range: 0-14pH, resolution: 0.01pH; The parameters of the chlorine sensor are: measuring range 0.00~4.00mg/L, residual chlorine value 0-30mg/L, temperature -10.0~+60.0℃, output 4-20mA/0-20mA.
进一步地,在步骤2中,所述物理量数据包括温度、电导率、化学需氧量、pH值、余氯量。Further, in step 2, the physical quantity data includes temperature, electrical conductivity, chemical oxygen demand, pH value, and residual chlorine.
进一步地,在步骤3中,对物理量数据进行预处理提取关键因子的方法为:Further, in step 3, the method for preprocessing the physical quantity data to extract key factors is:
步骤3.1,分别记物理量数据:温度、电导率、化学需氧量、pH值、余氯量为x1,x2,x3,x4,x5,把传感器节点所在的水域的污染度记为y,污染度y的计算方法为:y为x1,x2,x3,x4,x5中任意一个物理量数据大于预设值的物理量数据的数量;Step 3.1, record the physical quantity data: temperature, conductivity, chemical oxygen demand, pH value, residual chlorine as x1 , x2 , x3 , x4 , x5 , record the pollution degree of the water area where the sensor node is located is y, and the calculation method of pollution degree y is: y is the number of physical quantity data whose physical quantity data is greater than the preset value in x1 , x2 , x3 , x4 , and x5 ;
其中,x1的预设值为35℃,x2的预设值为1500-2000uS/cm,x3的预设值为300~350mg/L,x4的预设值为4.0~9.5,x5的预设值为9.17kgCL/h,预设值均可以人工调整;Among them, the default value of x1 is 35℃, the default value of x2 is 1500-2000uS/cm, the default value of x3 is 300-350mg/L, the default value of x4 is 4.0-9.5, and the default value of x5 The preset value of 9.17kgCL/h, the preset value can be adjusted manually;
步骤3.2,使用信息增益法和Lasso特征选取算法对数据进行预处理;信息增益基于信息论中熵的概念,熵是对事件的属性的不确定性的度量;一个属性的熵越大,它蕴含的不确定信息越大;因此,ID3总是选择具有最高信息增益的属性作为当前结点的测试属性,从而判断出影响污染度的主要因子;该步骤的信息增益法法及Lasso特征选取算法主要是用于选取影响污染度的关键特征,具体处理过程如下:Step 3.2, use the information gain method and the Lasso feature selection algorithm to preprocess the data; the information gain is based on the concept of entropy in information theory, and entropy is a measure of the uncertainty of the attributes of an event; the greater the entropy of an attribute, the more information it contains. The greater the uncertainty information; therefore, ID3 always selects the attribute with the highest information gain as the test attribute of the current node, so as to determine the main factor affecting the pollution degree; the information gain method and Lasso feature selection algorithm of this step are mainly It is used to select the key features that affect the pollution degree. The specific processing process is as follows:
步骤3.2.1,将污染度y与污染度的影响因素x1,x2,x3,x4,x5的数据做标准化预处理:转化函数为
步骤3.2.2,求出当前传感器节点物理量数据的样本分类所需要的期望信息;Step 3.2.2, obtain the expected information required for the sample classification of the physical quantity data of the current sensor node;
设S是S个当前传感器节点物理量数据的样本的集合,即一段给定时间中当前传感器节点采集的物理量数据,(例如最近30分钟),假定类标号属性具有m个不同的值,定义m个不同的类Ci(i=1,2,3…m),设si是类Ci中的样本数,对于给定的样本分类所需要的期望信息由下式给出:Let S be a collection of S samples of the physical quantity data of the current sensor node, that is, the physical quantity data collected by the current sensor node in a given period of time, (for example, the last 30 minutes), assuming that the class label attribute has m different values, define m For different classes Ci (i=1, 2, 3...m), let si be the number of samples in class Ci , the expected information required for a given sample classification is given by:

其中pi是任意样本属于Ci的概率,用si/s来估计;where pi is the probability that any sample belongs to Ci , estimated by si /s;
步骤3.2.3,求出属性(即污染度的影响因素)x1划分子集的熵;设Sij是子集Sj中类Ci的样本数;根据x1划分子集的熵为


步骤3.2.4,由期望信息和熵可以得到对应的信息增益:对于在x1上分支将获得的信息增益由下面的公式得到Gain(x1)=I(s1,s2…sm)-E(x1);Step 3.2.4, the corresponding information gain can be obtained from the expected information and entropy: for the information gain to be obtained by branching on x1 , the following formula is obtained Gain(x1 )=I(s1 , s2 ... sm ) -E(x1) ;
步骤3.2.5,同理通过步骤3.2.3到步骤3.2.4,得到各个属性(X2-X5)的信息增益,由大到小比较之后选择半数以上的属性作为预测属性,记为c1,c2,…,cn;Step 3.2.5, in the same way, through steps 3.2.3 to 3.2.4, the information gain of each attribute (X2 -X5 ) is obtained, and after comparing from large to small, more than half of the attributes are selected as the predicted attributes, denoted as c1 ,c2 ,…,cn ;
步骤3.2.6,对选取的属性(即影响污染度的主要因子)再结合Lasso特征选取算法选出影响污染度的关键因子;Lasso通过构造惩罚函数,实现将特征的系数进行压缩并使某些回归系数变为0来达到特征选择的目的;它是以缩小变量集为思想的压缩估计方法;模型选择本质上是寻求模型稀疏表达的过程,而这种过程可以通过优化一个“损失”+“惩罚”的函数问题来完成;Lasso方法对由信息增益法筛选出来的污染度影响因素再进一步筛选,提高因子质量;将Lasso参数估计定义为:


进一步地,在步骤4中,构建灰色预测模型计算关键因子的预测值的方法为:Further, in step 4, the method for constructing the grey prediction model to calculate the predicted value of the key factor is:
灰色预测是一种对含有不确定因素的系统进行预测的方法,是以灰色模型为基础的;选取常用的GM(1,1)模型;Grey forecasting is a method of forecasting a system with uncertain factors, based on grey model; the commonly used GM(1,1) model is selected;
步骤4.1,假定当前传感器节点xi的物理量数据的数据集定义为x(0)={x(0)(i)},xi对应的数据为x(0)(i),i=1,2,…,5,建立灰色预测模型如下:Step 4.1, assuming that the data set of the physical quantity data of the current sensor node xi is defined as x(0) = {x(0) (i)}, the data corresponding to xi is x(0) (i), i=1, 2,…,5, the grey prediction model is established as follows:
步骤4.2,对x(0)进行一次累加,得到一次累加序列x(1)={x(1)(k),k=0,1,2,…,m};m为传感器节点的传感器类型的数量,设置为5;n取值范围[1,5];Step 4.2, perform an accumulation on x(0) to obtain an accumulation sequence x(1) = {x(1) (k), k = 0, 1, 2, ..., m}; m is the sensor type of the sensor node The number of , set to 5; the value range of n is [1,5];
步骤4.3,对x(0)建立下述一阶线性微分方程,公式为
步骤4.4,求解微分方程,得到预测模型,公式为
步骤4.5,由于GM(1,1)模型得到的是一次累加量,将GM(1,1)模型所得数据x*(1)(k+1)经过累减还原为x*(0)(k+1),即x(0)的灰色预测模型公式为

最终求得预测影响污染度的各关键因子的预测值记为

进一步地,在步骤5中,构建SVR模型并通过SVR模型和预测值进行预测传感器节点所在的水域的污染度的方法为:SVR在做拟合时采用了支持向量机的思想来对数据进行回归分析,把


进一步地,在步骤5中,构建SVR模型并通过SVR模型和预测值进行预测传感器节点所在的水域的污染度的方法为:SVR在做拟合时采用了支持向量机的思想来对数据进行回归分析,把


进一步地,污染阈值为河道中所有传感器节点当前污染度的算术平均值。Further, the pollution threshold is the arithmetic mean of the current pollution degrees of all sensor nodes in the river.
进一步地,所述推送污染预警信息到管理人员的移动设备的方法为:基站将报警信息通过因特网推送到管理人员的移动设备。Further, the method for pushing the pollution warning information to the mobile device of the manager is: the base station pushes the alarm information to the mobile device of the manager through the Internet.
本公开的实施例提供的一种河道水污染预警系统,如图2所示为本公开的一种河道水污染预警系统结构图,该实施例的一种河道水污染预警系统包括:处理器、存储器以及存储在所述存储器中并可在所述处理器上运行的计算机程序,所述处理器执行所述计算机程序时实现上述一种河道水污染预警系统实施例中的步骤。An early warning system for river water pollution provided by an embodiment of the present disclosure, as shown in FIG. 2 , is a structural diagram of a river water pollution early warning system of the present disclosure. A river water pollution early warning system in this embodiment includes: a processor, a A memory and a computer program stored in the memory and executable on the processor, when the processor executes the computer program, the steps in the above-mentioned embodiment of the river water pollution early warning system are implemented.
所述装置包括:存储器、处理器以及存储在所述存储器中并可在所述处理器上运行的计算机程序,所述处理器执行所述计算机程序运行在以下装置的单元中:The apparatus includes a memory, a processor, and a computer program stored in the memory and executable on the processor, the processor executing the computer program and running in units of the following apparatus:
节点设置单元,用于在河道中等距设置传感器节点;Node setting unit, used to set sensor nodes at equal distances in the river;
传感器采集单元,用于通过传感器节点采集物理量数据;The sensor acquisition unit is used to collect physical quantity data through sensor nodes;
关键因子提取单元,用于对物理量数据进行预处理提取关键因子;The key factor extraction unit is used to preprocess the physical quantity data to extract key factors;
预测值计算单元,用于构建灰色预测模型计算关键因子的预测值;The predicted value calculation unit is used to construct a gray prediction model to calculate the predicted value of key factors;
污染度预测单元,用于构建SVR模型并通过SVR模型和预测值进行预测传感器节点所在的水域的污染度;The pollution degree prediction unit is used to construct the SVR model and predict the pollution degree of the water area where the sensor node is located through the SVR model and the predicted value;
警报推送单元,用于在当传感器节点所在的水域的污染度大于污染阈值时推送污染预警信息到管理人员的移动设备。The alarm push unit is used to push the pollution early warning information to the manager's mobile device when the pollution degree of the water area where the sensor node is located is greater than the pollution threshold.
所述一种河道水污染预警系统可以运行于桌上型计算机、笔记本、掌上电脑及云端服务器等计算设备中。所述一种河道水污染预警系统,可运行的装置可包括,但不仅限于,处理器、存储器。本领域技术人员可以理解,所述例子仅仅是一种河道水污染预警系统的示例,并不构成对一种河道水污染预警系统的限定,可以包括比例子更多或更少的部件,或者组合某些部件,或者不同的部件,例如所述一种河道水污染预警系统还可以包括输入输出设备、网络接入设备、总线等。The river water pollution early warning system can be run in computing devices such as desktop computers, notebooks, palmtop computers and cloud servers. For the river water pollution early warning system, the operable devices may include, but are not limited to, a processor and a memory. Those skilled in the art can understand that the example is only an example of a river water pollution early warning system, and does not constitute a limitation to a river water pollution early warning system, which may include more or less components, or a combination of Certain components, or different components, for example, the river water pollution early warning system may also include input and output devices, network access devices, buses, and the like.
所称处理器可以是中央处理单元(Central Processing Unit,CPU),还可以是其他通用处理器、数字信号处理器(Digital Signal Processor,DSP)、专用集成电路(Application Specific Integrated Circuit,ASIC)、现成可编程门阵列(Field-Programmable Gate Array,FPGA)或者其他可编程逻辑器件、分立门或者晶体管逻辑器件、分立硬件组件等。通用处理器可以是微处理器或者该处理器也可以是任何常规的处理器等,所述处理器是所述一种河道水污染预警系统运行装置的控制中心,利用各种接口和线路连接整个一种河道水污染预警系统可运行装置的各个部分。The processor may be a central processing unit (Central Processing Unit, CPU), or other general-purpose processors, digital signal processors (Digital Signal Processor, DSP), application specific integrated circuits (Application Specific Integrated Circuit, ASIC), off-the-shelf processors Programmable Gate Array (Field-Programmable Gate Array, FPGA) or other programmable logic devices, discrete gate or transistor logic devices, discrete hardware components, etc. The general-purpose processor can be a microprocessor or the processor can also be any conventional processor, etc. The processor is the control center of the operating device of the river water pollution early warning system, and uses various interfaces and lines to connect the entire system. A river water pollution early warning system can operate various parts of the device.
所述存储器可用于存储所述计算机程序和/或模块,所述处理器通过运行或执行存储在所述存储器内的计算机程序和/或模块,以及调用存储在存储器内的数据,实现所述一种河道水污染预警系统的各种功能。所述存储器可主要包括存储程序区和存储数据区,其中,存储程序区可存储操作系统、至少一个功能所需的应用程序(比如声音播放功能、图像播放功能等)等;存储数据区可存储根据手机的使用所创建的数据(比如音频数据、电话本等)等。此外,存储器可以包括高速随机存取存储器,还可以包括非易失性存储器,例如硬盘、内存、插接式硬盘,智能存储卡(Smart Media Card,SMC),安全数字(Secure Digital,SD)卡,闪存卡(Flash Card)、至少一个磁盘存储器件、闪存器件、或其他易失性固态存储器件。The memory can be used to store the computer program and/or module, and the processor implements the one by running or executing the computer program and/or module stored in the memory and calling the data stored in the memory. Various functions of the river water pollution early warning system. The memory may mainly include a stored program area and a stored data area, wherein the stored program area may store an operating system, an application program required for at least one function (such as a sound playback function, an image playback function, etc.), etc.; the storage data area may store Data (such as audio data, phonebook, etc.) created according to the usage of the mobile phone, etc. In addition, the memory may include high-speed random access memory, and may also include non-volatile memory such as hard disk, internal memory, plug-in hard disk, Smart Media Card (SMC), Secure Digital (SD) card , a flash memory card (Flash Card), at least one magnetic disk storage device, flash memory device, or other volatile solid-state storage device.
尽管本公开的描述已经相当详尽且特别对几个所述实施例进行了描述,但其并非旨在局限于任何这些细节或实施例或任何特殊实施例,而是应当将其视作是通过参考所附权利要求考虑到现有技术为这些权利要求提供广义的可能性解释,从而有效地涵盖本公开的预定范围。此外,上文以发明人可预见的实施例对本公开进行描述,其目的是为了提供有用的描述,而那些目前尚未预见的对本公开的非实质性改动仍可代表本公开的等效改动。Although the description of the present disclosure has been described in considerable detail and with particular reference to a few of the described embodiments, it is not intended to be limited to any of these details or embodiments or any particular embodiment, but should be considered by reference The appended claims are to provide the broadest possible interpretation of these claims in view of the prior art so as to effectively encompass the intended scope of the disclosure. Furthermore, the foregoing description of the present disclosure in terms of embodiments foreseen by the inventors is intended to provide a useful description, and those insubstantial modifications of the present disclosure that are not presently foreseen may nevertheless represent equivalent modifications of the present disclosure.
Claims (8)
Translated fromChinese


Priority Applications (1)
| Application Number | Priority Date | Filing Date | Title |
|---|---|---|---|
| CN202010765837.0ACN112085926B (en) | 2020-08-03 | 2020-08-03 | River water pollution early warning method and system |
Applications Claiming Priority (1)
| Application Number | Priority Date | Filing Date | Title |
|---|---|---|---|
| CN202010765837.0ACN112085926B (en) | 2020-08-03 | 2020-08-03 | River water pollution early warning method and system |
Publications (2)
| Publication Number | Publication Date |
|---|---|
| CN112085926Atrue CN112085926A (en) | 2020-12-15 |
| CN112085926B CN112085926B (en) | 2022-09-13 |
Family
ID=73736036
Family Applications (1)
| Application Number | Title | Priority Date | Filing Date |
|---|---|---|---|
| CN202010765837.0AActiveCN112085926B (en) | 2020-08-03 | 2020-08-03 | River water pollution early warning method and system |
Country Status (1)
| Country | Link |
|---|---|
| CN (1) | CN112085926B (en) |
Cited By (3)
| Publication number | Priority date | Publication date | Assignee | Title |
|---|---|---|---|---|
| CN114140290A (en)* | 2021-10-14 | 2022-03-04 | 云赛智联股份有限公司 | A smart park integrated management system |
| CN116819029A (en)* | 2023-08-09 | 2023-09-29 | 水利部珠江水利委员会水文局 | River water pollution monitoring method and system |
| CN118094453A (en)* | 2024-04-28 | 2024-05-28 | 山东维平信息安全测评技术有限公司 | Environment-friendly information datamation management monitoring system |
Citations (8)
| Publication number | Priority date | Publication date | Assignee | Title |
|---|---|---|---|---|
| US6021664A (en)* | 1998-01-29 | 2000-02-08 | The United States Of America As Represented By The Secretary Of The Interior | Automated groundwater monitoring system and method |
| CN101424679A (en)* | 2008-11-25 | 2009-05-06 | 烟台迪特商贸有限公司 | Synthesis monitoring system for water quality mutation and monitoring method thereof |
| US20090150088A1 (en)* | 2007-12-06 | 2009-06-11 | Seo Il-Won | Method of analyzing behavior of pollutants through prediction of transverse dispersion coefficient using basic hydraulic data in stream |
| CN105260585A (en)* | 2015-07-31 | 2016-01-20 | 河海大学 | Two-dimensional water quality influence prediction method for sewage draining space with large water yield |
| CN205879929U (en)* | 2015-12-09 | 2017-01-11 | 安徽海聚信息科技有限责任公司 | Water quality automatic checkout device |
| CN109270232A (en)* | 2018-08-08 | 2019-01-25 | 佛山科学技术学院 | A kind of monitoring of water pollution big data and method for early warning and device |
| CN110956310A (en)* | 2019-11-14 | 2020-04-03 | 佛山科学技术学院 | Prediction method and system of fish feed amount based on feature selection and support vector |
| CN111103414A (en)* | 2019-12-18 | 2020-05-05 | 上一环境科技(金华)有限公司 | Intelligent river channel supervision system |
- 2020
- 2020-08-03CNCN202010765837.0Apatent/CN112085926B/enactiveActive
Patent Citations (8)
| Publication number | Priority date | Publication date | Assignee | Title |
|---|---|---|---|---|
| US6021664A (en)* | 1998-01-29 | 2000-02-08 | The United States Of America As Represented By The Secretary Of The Interior | Automated groundwater monitoring system and method |
| US20090150088A1 (en)* | 2007-12-06 | 2009-06-11 | Seo Il-Won | Method of analyzing behavior of pollutants through prediction of transverse dispersion coefficient using basic hydraulic data in stream |
| CN101424679A (en)* | 2008-11-25 | 2009-05-06 | 烟台迪特商贸有限公司 | Synthesis monitoring system for water quality mutation and monitoring method thereof |
| CN105260585A (en)* | 2015-07-31 | 2016-01-20 | 河海大学 | Two-dimensional water quality influence prediction method for sewage draining space with large water yield |
| CN205879929U (en)* | 2015-12-09 | 2017-01-11 | 安徽海聚信息科技有限责任公司 | Water quality automatic checkout device |
| CN109270232A (en)* | 2018-08-08 | 2019-01-25 | 佛山科学技术学院 | A kind of monitoring of water pollution big data and method for early warning and device |
| CN110956310A (en)* | 2019-11-14 | 2020-04-03 | 佛山科学技术学院 | Prediction method and system of fish feed amount based on feature selection and support vector |
| CN111103414A (en)* | 2019-12-18 | 2020-05-05 | 上一环境科技(金华)有限公司 | Intelligent river channel supervision system |
Non-Patent Citations (3)
| Title |
|---|
| 包炳钦,陈杰明,陈俊雯,黎晓霞: "《前海湾"两河一涌"水质改善及环境修复对策研究》", 《广东化工》* |
| 熊和金: "《智能信息处理 第2版》", 31 August 2012, 国防工业出版社* |
| 赵宇明: "《模式识别》", 31 October 2013, 上海交通大学出版社* |
Cited By (5)
| Publication number | Priority date | Publication date | Assignee | Title |
|---|---|---|---|---|
| CN114140290A (en)* | 2021-10-14 | 2022-03-04 | 云赛智联股份有限公司 | A smart park integrated management system |
| CN116819029A (en)* | 2023-08-09 | 2023-09-29 | 水利部珠江水利委员会水文局 | River water pollution monitoring method and system |
| CN116819029B (en)* | 2023-08-09 | 2024-02-09 | 水利部珠江水利委员会水文局 | River water pollution monitoring method and system |
| CN118094453A (en)* | 2024-04-28 | 2024-05-28 | 山东维平信息安全测评技术有限公司 | Environment-friendly information datamation management monitoring system |
| CN118094453B (en)* | 2024-04-28 | 2024-07-16 | 山东维平信息安全测评技术有限公司 | Environment-friendly information datamation management monitoring system |
Also Published As
| Publication number | Publication date |
|---|---|
| CN112085926B (en) | 2022-09-13 |
Similar Documents
| Publication | Publication Date | Title |
|---|---|---|
| CN112085926B (en) | River water pollution early warning method and system | |
| Engelke et al. | Estimation of hüsler–reiss distributions and brown–resnick processes | |
| CN110830450A (en) | Abnormal flow monitoring method, device and equipment based on statistics and storage medium | |
| McAssey | An empirical goodness-of-fit test for multivariate distributions | |
| Park et al. | Missing-insensitive short-term load forecasting leveraging autoencoder and LSTM | |
| CN112907064B (en) | Adaptive window-based power prediction method, device, storage medium and terminal | |
| Wang et al. | SPENT: A successive POI recommendation method using similarity-based POI embedding and recurrent neural network with temporal influence | |
| CN114912720A (en) | Memory network-based power load prediction method, device, terminal and storage medium | |
| CN114418189A (en) | Water quality grade prediction method, system, terminal device and storage medium | |
| CN115964668A (en) | Heat supply monitoring analysis method, device, equipment and medium based on big data | |
| CN113516275A (en) | A method, device and terminal equipment for ultra-short-term load forecasting of distribution network | |
| Ren et al. | Large-scale datastreams surveillance via pattern-oriented-sampling | |
| Teimouri | EM algorithm for mixture of skew-normal distributions fitted to grouped data | |
| CN116821718A (en) | Non-invasive industrial load identification method and system based on Mean-shift clustering and twin network | |
| Chen et al. | Robust truth discovery scheme based on mean shift clustering algorithm | |
| Qeadan et al. | The joint distribution of the sum and the maximum of IID exponential random variables | |
| EP4027277A1 (en) | Method, system and computer program product for drift detection in a data stream | |
| Beigi et al. | Anomaly detection in information streams without prior domain knowledge | |
| CN114662608A (en) | Low-voltage distribution area user electricity consumption data clustering method based on mean shift clustering | |
| CN118797390A (en) | Method, device, computer equipment and storage medium for constructing harmonic source probability model | |
| CN118707433A (en) | A method and device for predicting the remaining life of an intelligent electric energy meter | |
| CN106816871B (en) | State similarity analysis method for power system | |
| CN116860562B (en) | Method and system for monitoring data quality of data center | |
| CN113537363B (en) | Abnormal object detection method and device, electronic equipment and storage medium | |
| CN114067093B (en) | Precise capturing method and system for scattered users based on time sequence and images |
Legal Events
| Date | Code | Title | Description |
|---|---|---|---|
| PB01 | Publication | ||
| PB01 | Publication | ||
| SE01 | Entry into force of request for substantive examination | ||
| SE01 | Entry into force of request for substantive examination | ||
| GR01 | Patent grant | ||
| GR01 | Patent grant | ||
| CP03 | Change of name, title or address | ||
| CP03 | Change of name, title or address | Address after:No.33 Guangyun Road, Shishan town, Nanhai District, Foshan City, Guangdong Province Patentee after:Foshan University Country or region after:China Address before:No.33 Guangyun Road, Shishan town, Nanhai District, Foshan City, Guangdong Province Patentee before:FOSHAN University Country or region before:China |