CN112068153B - Crown clearance rate estimation method based on foundation laser radar point cloud - Google Patents
Crown clearance rate estimation method based on foundation laser radar point cloudDownload PDFInfo
- Publication number
- CN112068153B CN112068153BCN202010853776.3ACN202010853776ACN112068153BCN 112068153 BCN112068153 BCN 112068153BCN 202010853776 ACN202010853776 ACN 202010853776ACN 112068153 BCN112068153 BCN 112068153B
- Authority
- CN
- China
- Prior art keywords
- point cloud
- canopy
- distance
- data
- laser beam
- Prior art date
- Legal status (The legal status is an assumption and is not a legal conclusion. Google has not performed a legal analysis and makes no representation as to the accuracy of the status listed.)
- Active
Links
- 238000000034methodMethods0.000titleclaimsabstractdescription31
- 238000000342Monte Carlo simulationMethods0.000claimsabstractdescription8
- 238000005070samplingMethods0.000claimsdescription10
- 238000001514detection methodMethods0.000claimsdescription9
- 238000004590computer programMethods0.000claimsdescription4
- 238000007781pre-processingMethods0.000claimsdescription2
- 230000011218segmentationEffects0.000claimsdescription2
- 230000009466transformationEffects0.000claimsdescription2
- 238000000638solvent extractionMethods0.000abstract1
- 230000018109developmental processEffects0.000description4
- 238000005516engineering processMethods0.000description4
- 238000010586diagramMethods0.000description3
- 230000003287optical effectEffects0.000description3
- 241000218378MagnoliaSpecies0.000description2
- 230000002776aggregationEffects0.000description2
- 238000004220aggregationMethods0.000description2
- 230000005540biological transmissionEffects0.000description1
- 230000000903blocking effectEffects0.000description1
- 238000004422calculation algorithmMethods0.000description1
- 238000012512characterization methodMethods0.000description1
- 238000006243chemical reactionMethods0.000description1
- 238000010835comparative analysisMethods0.000description1
- 239000011365complex materialSubstances0.000description1
- 238000005094computer simulationMethods0.000description1
- 230000003247decreasing effectEffects0.000description1
- 230000007812deficiencyEffects0.000description1
- 230000000694effectsEffects0.000description1
- 238000010304firingMethods0.000description1
- 230000006870functionEffects0.000description1
- 230000004313glareEffects0.000description1
- 238000010606normalizationMethods0.000description1
- 230000008569processEffects0.000description1
- 230000005855radiationEffects0.000description1
- 238000004088simulationMethods0.000description1
- 239000002689soilSubstances0.000description1
- 241000894007speciesSpecies0.000description1
- 230000001131transforming effectEffects0.000description1
- 230000000007visual effectEffects0.000description1
- 239000011800void materialSubstances0.000description1
Images


Classifications
- G—PHYSICS
- G01—MEASURING; TESTING
- G01S—RADIO DIRECTION-FINDING; RADIO NAVIGATION; DETERMINING DISTANCE OR VELOCITY BY USE OF RADIO WAVES; LOCATING OR PRESENCE-DETECTING BY USE OF THE REFLECTION OR RERADIATION OF RADIO WAVES; ANALOGOUS ARRANGEMENTS USING OTHER WAVES
- G01S17/00—Systems using the reflection or reradiation of electromagnetic waves other than radio waves, e.g. lidar systems
- G01S17/88—Lidar systems specially adapted for specific applications
- G01S17/89—Lidar systems specially adapted for specific applications for mapping or imaging
- G—PHYSICS
- G01—MEASURING; TESTING
- G01S—RADIO DIRECTION-FINDING; RADIO NAVIGATION; DETERMINING DISTANCE OR VELOCITY BY USE OF RADIO WAVES; LOCATING OR PRESENCE-DETECTING BY USE OF THE REFLECTION OR RERADIATION OF RADIO WAVES; ANALOGOUS ARRANGEMENTS USING OTHER WAVES
- G01S17/00—Systems using the reflection or reradiation of electromagnetic waves other than radio waves, e.g. lidar systems
- G01S17/02—Systems using the reflection of electromagnetic waves other than radio waves
- G01S17/06—Systems determining position data of a target
- G01S17/42—Simultaneous measurement of distance and other co-ordinates
- G—PHYSICS
- G01—MEASURING; TESTING
- G01S—RADIO DIRECTION-FINDING; RADIO NAVIGATION; DETERMINING DISTANCE OR VELOCITY BY USE OF RADIO WAVES; LOCATING OR PRESENCE-DETECTING BY USE OF THE REFLECTION OR RERADIATION OF RADIO WAVES; ANALOGOUS ARRANGEMENTS USING OTHER WAVES
- G01S7/00—Details of systems according to groups G01S13/00, G01S15/00, G01S17/00
- G01S7/48—Details of systems according to groups G01S13/00, G01S15/00, G01S17/00 of systems according to group G01S17/00
- G01S7/4802—Details of systems according to groups G01S13/00, G01S15/00, G01S17/00 of systems according to group G01S17/00 using analysis of echo signal for target characterisation; Target signature; Target cross-section
- G—PHYSICS
- G01—MEASURING; TESTING
- G01S—RADIO DIRECTION-FINDING; RADIO NAVIGATION; DETERMINING DISTANCE OR VELOCITY BY USE OF RADIO WAVES; LOCATING OR PRESENCE-DETECTING BY USE OF THE REFLECTION OR RERADIATION OF RADIO WAVES; ANALOGOUS ARRANGEMENTS USING OTHER WAVES
- G01S7/00—Details of systems according to groups G01S13/00, G01S15/00, G01S17/00
- G01S7/48—Details of systems according to groups G01S13/00, G01S15/00, G01S17/00 of systems according to group G01S17/00
- G01S7/483—Details of pulse systems
- G01S7/486—Receivers
- G01S7/487—Extracting wanted echo signals, e.g. pulse detection
Landscapes
- Engineering & Computer Science (AREA)
- Physics & Mathematics (AREA)
- Computer Networks & Wireless Communication (AREA)
- General Physics & Mathematics (AREA)
- Radar, Positioning & Navigation (AREA)
- Remote Sensing (AREA)
- Electromagnetism (AREA)
- Optical Radar Systems And Details Thereof (AREA)
Abstract
Description
Translated fromChinese技术领域technical field
本发明属于地基激光雷达遥感应用技术领域,涉及一种基于地基激光雷达数据运用蒙特卡洛模拟激光束估算冠层间隙率的方法,具体为一种基于地基激光雷达点云的冠层间隙率估算方法。The invention belongs to the technical field of ground-based laser radar remote sensing applications, and relates to a method for estimating canopy gap ratio by using Monte Carlo simulated laser beam based on ground-based laser radar data, in particular to a canopy gap ratio estimation based on ground-based laser radar point cloud method.
背景技术Background technique
森林冠层不仅与大气之间进行复杂的物质和能量的交换,也形成林下植被的光条件和土壤环境(李德志等,2004;邱建丽等,2008)。因此森林冠层的研究具有重要的生态学意义。在森林冠层的研究中,由于冠层辐射的传输和分布受冠层结构的影响,准确刻画冠层结构成为国内外学者研究的热点。间隙率(gap fraction,GF)是指光子在冠层中由一点沿着一定方向到达另一点而未被冠层拦截的概率(Ni等,1997),是一个重要的冠层结构参数。在计算光线从某个角度入射冠层与叶子发生碰撞时,要考虑叶片的分布情况,叶子在空间上并非随机分布,而是呈现一定程度的聚集状态,叶片在枝干上的聚集会使冠层内的间隙扩大。因此估算非随机分布的间隙率可以帮助修正低估的叶面积指数(leaf area index,LAI)。The forest canopy not only conducts complex material and energy exchanges with the atmosphere, but also forms the light conditions and soil environment of the understory vegetation (Li Dezhi et al., 2004; Qiu Jianli et al., 2008). Therefore, the study of forest canopy has important ecological significance. In the study of forest canopy, because the transmission and distribution of canopy radiation are affected by canopy structure, accurate characterization of canopy structure has become a hot research topic for scholars at home and abroad. Gap fraction (GF) refers to the probability that photons travel from one point to another point in a certain direction in the canopy without being intercepted by the canopy (Ni et al., 1997), and is an important canopy structure parameter. When calculating the collision of light entering the canopy and leaves from a certain angle, the distribution of leaves should be considered. The leaves are not randomly distributed in space, but show a certain degree of aggregation. The aggregation of leaves on the branches will make the crown The gaps within the layers widen. Therefore, estimating a non-randomly distributed clearance rate can help correct for an underestimated leaf area index (LAI).
无论是基于传统光学遥感的方法还是光学仪器的方法,都只能从二维的角度描述冠层结构参数,而随着定量遥感的发展,越来越多的模型和计算机模拟都需要考虑或者输入植被的三维结构信息。地基激光扫描(Terrestrial Laser Scanning,TLS)是近年来飞速发展的一项技术,激光扫描仪通过测量由目标反射并在扫描仪接收到的发射激光脉冲的行进时间,对扫描目标的完整几何结构进行采样。在森林中地基激光扫描仪可以快速获取高密度的树木三维点云数据,树木的三维坐标可以反映冠层内部的结构信息,特别是被动光学遥感所没有的垂直结构信息,所以越来越多的学者利用地基激光雷达的点云数据来反演冠层结构参数。Whether it is based on traditional optical remote sensing or optical instruments, canopy structure parameters can only be described from a two-dimensional perspective. With the development of quantitative remote sensing, more and more models and computer simulations need to be considered or input. 3D structural information of vegetation. Terrestrial Laser Scanning (TLS) is a technology that has developed rapidly in recent years. Laser scanners scan the complete geometry of the target by measuring the travel time of the emitted laser pulses reflected by the target and received at the scanner. sampling. In forests, ground-based laser scanners can quickly obtain high-density 3D point cloud data of trees. The 3D coordinates of trees can reflect the structural information inside the canopy, especially the vertical structural information that passive optical remote sensing does not have. Therefore, more and more Scholars use the point cloud data of ground-based lidar to invert canopy structure parameters.
在用地基激光雷达描述树木结构信息时,基于体元的3D建模方法被广泛的应用。Hosoi和Omasa(2006)利用地基激光雷达测量的冠层点云数据,建立基于体素的单木模型。体素被定义为三维数组中的体积元素。配准数据集中的所有点云数据的三维直角坐标通过以下等式转换为体素坐标:When using ground-based lidar to describe tree structure information, voxel-based 3D modeling methods are widely used. Hosoi and Omasa (2006) used the canopy point cloud data measured by ground-based lidar to establish a voxel-based single tree model. A voxel is defined as a volume element in a three-dimensional array. The 3D Cartesian coordinates of all point cloud data in the registration dataset are converted to voxel coordinates by the following equation:

其中(i,j,k)是体素阵列中的体素坐标,int是在一个小数位舍入到最接近的整数的函数,(X,Y,Z)表示经配准的激光雷达点云数据的三维直角坐标,(Xmin,Ymin,Zmin)是点云三维直角坐标的最小值,以及(ΔI,Δj,Δk)表示单位体元的大小。将激光束被截获的体素属性标记为1,其余体素标记为0,即为空隙。where (i,j,k) are the voxel coordinates in the voxel array, int is a function rounded to the nearest integer at one decimal place, and (X,Y,Z) represents the registered lidar point cloud The three-dimensional Cartesian coordinates of the data, (Xmin , Ymin , Zmin ) are the minimum values of the three-dimensional Cartesian coordinates of the point cloud, and (ΔI, Δj, Δk) represent the size of the unit voxel. Mark the voxel property of the intercepted laser beam as 1, and mark the rest of the voxels as 0, which is the void.
与3D体元建模的方法类似,Moorthy(2008)等人根据扫描人造树的点云范围,对树木的XYZ点云数据进行切片,提取激光脉冲回波密度分布,根据测量脉冲密度与理论脉冲密度估算冠层间隙率。Seidel(2012)利用体元化的方法对单木建模,为三维点云的数据点分配体积,虽然模型与点云相比分辨率降低,但也方便了与数字半球图像的对比。Zheng(2016)对于叶片元素的空间分布提出了“径向半球面点云切片(RHPCS)”的新方法,先将点云的直角坐标转换为球坐标,根据天顶角方位角将点云切分为梯形体元,再根据半径方向的分段来统计点云密度,发现大部分的叶元素都分布在半径5-15米的球型切面内。关于TLS数据与半球照片反演的角度间隙率方面的差异,作者认为是由于精确分割的TLS范围与没有明确范围的半球照片造成的。Similar to the 3D voxel modeling method, Moorthy et al. (2008) sliced the XYZ point cloud data of the tree according to the point cloud range of the scanned artificial tree, and extracted the laser pulse echo density distribution. Density estimates canopy clearance. Seidel (2012) used the voxelization method to model a single tree to assign volumes to the data points of the 3D point cloud. Although the model has a lower resolution compared to the point cloud, it also facilitates the comparison with the digital hemisphere image. Zheng (2016) proposed a new method of "Radial Hemispherical Point Cloud Slicing (RHPCS)" for the spatial distribution of blade elements. First, the Cartesian coordinates of the point cloud were converted into spherical coordinates, and the point cloud was sliced according to the zenith angle azimuth. It is divided into trapezoidal voxels, and then the point cloud density is counted according to the segment in the radial direction. It is found that most of the leaf elements are distributed in the spherical section with a radius of 5-15 meters. Regarding the discrepancy in the angular gap ratio between the TLS data and the inversion of the hemisphere photo, the authors believe that it is due to the precisely segmented TLS range versus the hemisphere photo without a clear range.
虽然是基于地基激光雷达的三维点云数据,许多方法在估算GF时将三维数据转化为二维图像,没有充分利用点云数据提供的三维结构信息。Danson等(2007)通过将TLS数据xy轴的切片投影转化为二维图像来计算GF,同时与数字半球照片计算得到的GF进行对比,结果表明利用高分辨率点云数据和数字半球图像得到的GF是相似的,其中的一些差异可能是由于照片中看到的太阳眩光或与数字图像的手动阈值相关的错误造成的。Cifuentes等(2014)分别在幼龄林、中龄林和成熟林中采集地面激光雷达点云数据,同时也采集数字半球图像进行对照。他们对点云数据运用不同体元大小进行体元化建模,利用开源的光线跟踪软件将体元化数据转换为半球图像来计算GF。最终发现在不同龄级的林分中,体元大小对间隙率的估计有不同程度的影响,也对应着不同的最优体元尺寸。Hancock等(2014)也使用光线跟踪技术,结合每个回波的激光光束间距,将激光雷达数据转换为半球图像。Li(2017)则将冠层的TLS数据进行体元化后投影到1米的半球面来估算GF。Although based on 3D point cloud data from ground-based lidar, many methods convert 3D data into 2D images when estimating GF, and do not fully utilize the 3D structural information provided by point cloud data. Danson et al. (2007) calculated the GF by transforming the slice projection of the xy axis of the TLS data into a two-dimensional image, and compared it with the GF calculated from the digital hemisphere photo. The GFs are similar, some of the differences may be due to sun glare seen in photos or errors related to manual thresholding of digital images. Cifuentes et al. (2014) collected ground-based lidar point cloud data in young, middle-aged and mature forests, and also collected digital hemisphere images for comparison. They voxelized the point cloud data with different voxel sizes, and used open-source ray tracing software to convert the voxelized data into hemispherical images to calculate GF. Finally, it was found that the voxel size had different effects on the estimation of the clearance rate in the stands of different ages, and also corresponded to different optimal voxel sizes. Hancock et al. (2014) also used ray tracing techniques to convert lidar data into hemispherical images by combining the laser beam spacing for each echo. Li (2017) voxelized the TLS data of the canopy and projected it onto a 1-meter hemisphere to estimate the GF.
综上,随着激光雷达技术的发展,利用激光雷达反演森林参数的研究越来越多。地基激光雷达可以提供准确的森林冠层内部的三维结构信息,利用TLS点云数据进行间隙率反演主要通过体元化建模,或者将3D数据转换为二维图像的方法。体元化方法通常要讨论最佳体元的大小,而研究范围的大小、扫描仪的分辨率以及树种类型等都会影响该模型的最佳体元大小。而将点云数据通过投影或者光线追踪技术换转为半球图像的方法,没有充分的利用激光雷达提供的三维结构信息,失去了使用激光雷达的优势。因此如何充分利用激光雷达的三维点云数据,并提出更加简易的间隙率算法还需要学者们的进一步努力。To sum up, with the development of lidar technology, there are more and more studies using lidar to invert forest parameters. Ground-based lidar can provide accurate 3D structural information inside the forest canopy. The gap ratio inversion using TLS point cloud data is mainly through voxel modeling, or the method of converting 3D data into 2D images. Voxelization methods usually discuss the optimal voxel size, and the size of the study area, the resolution of the scanner, and the type of tree species will all affect the optimal voxel size for the model. However, the method of converting point cloud data into hemispheric images through projection or ray tracing technology does not fully utilize the three-dimensional structural information provided by lidar, and loses the advantages of using lidar. Therefore, how to make full use of the three-dimensional point cloud data of lidar and propose a simpler algorithm for gap ratio still requires further efforts of scholars.
发明内容SUMMARY OF THE INVENTION
针对上述存在的问题或不足,本发明提供了一种基于地基激光雷达点云的冠层间隙率估算方法,充分利用了点云数据的三维坐标信息,通过蒙特卡洛方法将间隙率转化为概率模型,模拟激光束探测冠层点云以实现间隙率的估算。In view of the above existing problems or deficiencies, the present invention provides a canopy gap ratio estimation method based on ground-based lidar point cloud, which fully utilizes the three-dimensional coordinate information of point cloud data, and converts the gap ratio into probability through Monte Carlo method. Model that simulates the laser beam probing the canopy point cloud to estimate the gap ratio.
具体技术方案如下:The specific technical solutions are as follows:
步骤1、TLS点云数据获取和预处理;
在研究区域设置样方,根据样方的情况设置测站来架设三维激光扫描仪,需要扫描到完整的研究区域样方的森林冠层。在扫描仪的扫描范围内设置至少3个标靶作为后期多站配准的依据。将扫描的TLS点云数据利用软件进行配准和去噪,将其导出为文本格式后剔除低于扫描仪高度的点云数据。Set up the quadrat in the study area, and set up the station according to the situation of the quadrat to set up the 3D laser scanner. It is necessary to scan the forest canopy of the complete quadrat in the study area. Set at least 3 targets within the scanning range of the scanner as the basis for later multi-station registration. The scanned TLS point cloud data is registered and denoised by software, and the point cloud data below the height of the scanner is eliminated after exporting it to text format.
步骤2、点云数据的坐标转换和分块;Step 2. Coordinate transformation and segmentation of point cloud data;
地基激光雷达获取的点云数据的坐标系为空间直角坐标系,由于太阳入射冠层的路径通常用天顶角来描述,因此将步骤1所得的所有点云数据的三维直角坐标转换为球坐标,即将点云坐标由P(x,y,z)转化为


而地基激光雷达获取的点云数量较大,为了提高程序的运行速度,需要将转换后的点云数据按照天顶角2°~10°和方位角10°~60°的间隔进行数据分块。However, the number of point clouds obtained by ground-based lidar is relatively large. In order to improve the running speed of the program, the converted point cloud data needs to be divided into data blocks according to the interval of zenith angle 2°~10° and azimuth angle 10°~60° .
步骤3、模拟激光束;Step 3. Simulate the laser beam;
基于蒙特卡洛方法,将间隙率的估算转换为概率模型。通过计算机程序模拟三维激光扫描仪的工作原理,从扫描仪处(即点云坐标原点)随机发射射线作为模拟的激光束,模拟激光束的发射范围与转换后的点云数据的天顶角、方位角范围一致。通过发射模拟激光束对冠层中点云的探测来刻画冠层的结构信息,定量化间隙的分布。Based on the Monte Carlo method, the estimates of clearance rates were converted into probabilistic models. The working principle of a 3D laser scanner is simulated by a computer program, and rays are randomly emitted from the scanner (ie, the origin of the point cloud coordinates) as a simulated laser beam, and the emission range of the simulated laser beam and the zenith angle of the converted point cloud data, The azimuth range is the same. The structural information of the canopy is characterized by the detection of point clouds in the canopy by emitting a simulated laser beam, and the distribution of gaps is quantified.
步骤4、确定判别距离;Step 4. Determine the discrimination distance;
地基激光雷达扫描冠层获得的冠层点云之间具有一定的采样间隔(如图2a),所以模拟激光束探究相应方向的空间属性时需要确定合适的判别距离。由于林木的生长发育情况不同,在同一天顶环内不同方位角的冠层的分布情况也不相同(如图2b),因此判别距离的确定不只与扫描分辨率有关,也需要考虑冠层的空间分布。The canopy point clouds obtained by ground-based lidar scanning the canopy have a certain sampling interval (as shown in Figure 2a). Due to the different growth and development of forest trees, the distribution of canopies at different azimuth angles in the same zenith ring is also different (as shown in Figure 2b). Therefore, the determination of the discriminant distance is not only related to the scanning resolution, but also needs to consider the canopy. spatial distribution.
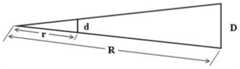
在步骤2划分的每个空间区域以0.1-1米为步长进行点云到原点距离分布的统计,该区域冠层的分布情况由所有点云到原点距离的期望代表。如图3所示,采样间距与点云到原点距离之间的关系如下:In each space area divided in step 2, the statistics of the distance distribution from the point cloud to the origin are carried out with a step size of 0.1-1 m. The distribution of the canopy in this area is represented by the expectation of the distance from all point clouds to the origin. As shown in Figure 3, the relationship between the sampling distance and the distance from the point cloud to the origin is as follows:

其中R和r是目标点云到原点的距离,D和d是R和r对应的采样间距。所以,根据点云在各个区域的分布和扫描仪的采样间距来计算判别距离:where R and r are the distances from the target point cloud to the origin, and D and d are the sampling distances corresponding to R and r. Therefore, the discriminant distance is calculated according to the distribution of the point cloud in each area and the sampling distance of the scanner:

其中s为判别距离,D和R由扫描仪的分辨率得到,r是从该区域所有点云到原点的距离的期望值。where s is the discriminant distance, D and R are obtained from the resolution of the scanner, and r is the expected value of the distance from all point clouds in the area to the origin.
步骤5、估算间隙率GF;Step 5. Estimate the gap rate GF;
在每个空间区域内利用计算机程序发射模拟激光束,判断模拟激光束与对应空间区域内所有点云之间的欧式距离。若欧式距离小于等于判别距离,则认为碰撞到冠层点云,计数并重新发射模拟射线进行下一次探测;若遍历整块数据都没有探测到判别距离之内的冠层点云,则进行下一条模拟激光束的探测,原理如图4所示。最后根据碰撞到点云的次数与发射模拟激光束总数之间的关系来估计间隙率,公式如下:A computer program is used to emit a simulated laser beam in each spatial area, and the Euclidean distance between the simulated laser beam and all point clouds in the corresponding spatial area is determined. If the Euclidean distance is less than or equal to the discriminant distance, it is considered to have collided with the canopy point cloud, and the simulated rays are counted and re-launched for the next detection; The detection of a simulated laser beam, the principle is shown in Figure 4. Finally, the gap ratio is estimated based on the relationship between the number of collisions with the point cloud and the total number of simulated laser beams emitted, with the following formula:

步骤(3)和(4)涉及的原理:The principles involved in steps (3) and (4):
蒙特卡洛是一种以概率统计理论为指导的统计模拟方法,首先要抓住事物运动的几何数量和几何特征,将待解决的问题转化为概率模型,通过随机抽样的方法,以随机事件出现的频率估计其概率。激光雷达以发射激光光束来探测目标,旋转式激光雷达通过多束激光竖列而排,绕轴进行360°旋转,每一束激光扫描一个平面,纵向叠加后呈现出三维立体图形。Monte Carlo is a statistical simulation method guided by the theory of probability and statistics. First of all, it is necessary to grasp the geometric quantity and geometric characteristics of the movement of things, and convert the problem to be solved into a probability model. Through random sampling, random events appear. frequency to estimate its probability. The laser radar detects the target by emitting laser beams. The rotating laser radar is arranged vertically by multiple laser beams, and rotates 360° around the axis. Each laser beam scans a plane, and the vertical superposition presents a three-dimensional three-dimensional figure.
因此,根据蒙特卡洛方法将间隙率转化概率模型,而所有的三维点云数据记录了冠层的结构信息,如果从扫描仪处观测某一方向,没有任何的点云阻挡,则该处为冠层间隙。可以在各个分块区域内通过模拟激光束的大量发射,来探测该区域的间隙分布。Therefore, the clearance rate is converted into a probability model according to the Monte Carlo method, and all the 3D point cloud data records the structural information of the canopy. If a certain direction is observed from the scanner and there is no point cloud blocking, then the position is Canopy gap. The distribution of gaps in each segmented region can be probed by simulating the mass firing of the laser beam.
在三维激光扫描仪工作过程中,扫描分辨率和叶倾角都会带来一定的点云间隔,并不是所有点云之间的空隙都对应真正的间隙。所以需要确定模拟激光束探测时的探测距离。又由于不同的分块区域内冠层的空间分布情况不同,所以需要对每个区域的冠层点云分布进行统计,再结合扫描分辨率计算判别距离。In the working process of the 3D laser scanner, the scanning resolution and leaf inclination will bring a certain point cloud interval, and not all the gaps between the point clouds correspond to the real gaps. Therefore, it is necessary to determine the detection distance of the simulated laser beam detection. In addition, because the spatial distribution of canopy in different sub-regions is different, it is necessary to count the distribution of canopy point clouds in each region, and then calculate the discriminant distance based on the scanning resolution.
综上所述,本发明充分利用了地基激光雷达提供的三维结构信息的优势,通过蒙特卡洛方法将间隙率转化为概率模型,模拟激光束探测冠层点云以实现间隙率的估算,简易有效。To sum up, the present invention makes full use of the advantages of the three-dimensional structural information provided by the ground-based lidar, converts the clearance rate into a probability model through the Monte Carlo method, and simulates the laser beam to detect the canopy point cloud to realize the estimation of the clearance rate. efficient.
附图说明Description of drawings
图1为本发明的流程图;Fig. 1 is the flow chart of the present invention;
图2为数据的示意图;其中(a)为激光雷达获取的冠层点云数据,(b)为天顶环50-55°的冠层点云分布俯视图;Figure 2 is a schematic diagram of the data; wherein (a) is the canopy point cloud data obtained by lidar, (b) is the top view of the canopy point cloud distribution at 50-55° of the zenith ring;
图3为采样间距和点云到原点距离的关系示意图;Figure 3 is a schematic diagram of the relationship between the sampling distance and the distance from the point cloud to the origin;
图4为射线探测冠层点云的原理示意图;Figure 4 is a schematic diagram of the principle of ray detection canopy point cloud;
图5为本发明和体元法估算的间隙率结果对比折线图;Fig. 5 is the comparison line chart of the gap ratio results estimated by the present invention and the voxel method;
图6为本发明和体元法估算的间隙率结果的对比分析。Figure 6 is a comparative analysis of the results of the gap ratio estimated by the present invention and the voxel method.
具体实施方式Detailed ways
以下通过实施例和附图对本发明作进一步的详细解释:The present invention is further explained in detail below by embodiment and accompanying drawing:
开发环境为Microsoft Visual Studio 2017,编程语言为C++。The development environment is Microsoft Visual Studio 2017, and the programming language is C++.
根据技术方案步骤1所述,在电子科技大学校内的玉兰林中设置40*30米的样方,地基激光雷达数据由Leica Scanstation C10在4个测站处获取,一个测站在玉兰林样方中央,其余3个测站在周围。在林中布设3个标靶作为多测站数据配准时的公共点。结合对样地情况以及点云总数量的考虑,在Leica C10上设置高分辨率扫描(距离100米,水平、垂直间距0.05米),其余参数由下表列出。利用Cyclone软件对TLS数据进行多站配准、去噪和归一化等,并将数据导出为只含3维坐标的文本格式,其中坐标原点(0,0,0)位于中心测站的扫描仪架设处。导出数据后剔除z轴小于0的点云。According to
表1三维激光扫描仪Leica Scanstation C10参数Table 1 Parameters of 3D laser scanner Leica Scanstation C10

根据技术方案步骤2所述,Leica Scanstation C10获取的三维点云数据的坐标为空间直角坐标系,将每个点的坐标记为P(x,y,z)。将点云坐标由空间直角坐标系转换为球坐标系。According to step 2 of the technical solution, the coordinates of the three-dimensional point cloud data obtained by the Leica Scanstation C10 are the space rectangular coordinate system, and the coordinates of each point are marked as P(x, y, z). Convert the point cloud coordinates from the space Cartesian coordinate system to the spherical coordinate system.
由于本研究区域扫描后得到的点云数量达到了2600万,为了提升程序处理数据的速度,将转换坐标后的数据按照天顶角5°和方位角45°的间隔进行数据分块。根据树高与样地半径的关系得到有效天顶角范围在0-70°,所以70°天顶角的范围内划分为14个圆环,方位角以0°、45°、90°、135°、180°、225°、270°、315°为中央刻度划分为8个区域,共将数据划分为112个区域。Since the number of point clouds obtained after scanning in this study area has reached 26 million, in order to improve the speed of the program processing data, the data after coordinate conversion is divided into data blocks according to the interval of zenith angle of 5° and azimuth angle of 45°. According to the relationship between tree height and plot radius, the effective zenith angle range is 0-70°, so the range of 70° zenith angle is divided into 14 rings, and the azimuth angles are 0°, 45°, 90°, 135° °, 180°, 225°, 270°, 315° are divided into 8 areas for the central scale, and the data is divided into 112 areas in total.
根据技术方案步骤3所述,在步骤2划分的每个空间区域内,利用计算机模拟三维激光扫描仪的工作原理,从扫描仪处(即坐标原点)根据分块数据的天顶角、方位角范围,发射十万条随机方向的模拟激光束,利用模拟激光束来探测该方向是否有冠层冠层点云。According to step 3 of the technical solution, in each space area divided in step 2, the working principle of a three-dimensional laser scanner is simulated by a computer, and the zenith angle and azimuth angle of the block data are obtained from the scanner (ie, the origin of coordinates). range, emit 100,000 simulated laser beams in random directions, and use the simulated laser beams to detect whether there is a canopy canopy point cloud in this direction.
根据技术方案步骤4所述,先以0.5米的步长对每个区域进行冠层点云分布的统计,然后由该区域所有点云到原点的距离的期望值来代表该区域的冠层分布情况,再由公式(4)确定判别距离。According to step 4 of the technical solution, first, the statistics of the canopy point cloud distribution are carried out for each area with a step size of 0.5 meters, and then the canopy distribution in the area is represented by the expected value of the distance from all point clouds in the area to the origin. , and then determine the discriminant distance by formula (4).
根据技术方案步骤5所述,在用模拟激光束探测点云时,根据该区域的判别距离来探测点云。每发射一条随机方向的模拟激光束,计算激光束周围点云到激光束的欧式距离,如果探测到与激光束之间的欧氏距离小于或等于判别距离的点,则定义为激光束击中冠层点云,然后重新发射模拟激光束进行下一次探测;若遍历了全部点云后,点云到激光束的欧式距离都大于判别距离,则认为该激光束没有探测到冠层,在这个方向上的树冠结构被定义为间隙。最后得到碰撞次数和模拟激光束发射总次数,由公式(5)估算间隙率。According to step 5 of the technical solution, when the simulated laser beam is used to detect the point cloud, the point cloud is detected according to the discriminant distance of the area. Each time a simulated laser beam in a random direction is emitted, the Euclidean distance from the point cloud around the laser beam to the laser beam is calculated. If a point whose Euclidean distance from the laser beam is less than or equal to the discriminant distance is detected, it is defined as a laser beam hit The canopy point cloud, and then re-launch the simulated laser beam for the next detection; if the Euclidean distance from the point cloud to the laser beam is greater than the discriminant distance after traversing all the point clouds, it is considered that the laser beam has not detected the canopy. The canopy structure in the direction is defined as the gap. Finally, the number of collisions and the total number of simulated laser beams are obtained, and the gap ratio is estimated by formula (5).
依据本发明提出的方法,按照技术方案的步骤,对分块后的112组数据进行冠层点云分布的统计,然后计算出每块数据中的点云到原点距离的期望,进而由点云到原点距离的期望值与扫描分辨率的关系得出每块数据对应的判别距离。结合判别距离,用程序模拟随机方向的激光束对点云进行探测,得到各个区域的间隙率,再将一个天顶环内8个不同方位角区域的间隙率求平均值,得到天顶环的间隙率。将本方法的间隙率结果与体元化后投影到球面得到的间隙率相比,得到图5和6;两种方法得到的间隙率随着天顶角的增加都呈现出下降趋势,并且由图6得两个方法结果的相关性较强,达到了0.82。According to the method proposed by the present invention, according to the steps of the technical solution, the statistics of the distribution of the canopy point cloud are performed on the 112 groups of data after being divided, and then the expectation of the distance between the point cloud and the origin in each piece of data is calculated, and then the point cloud is calculated. The relationship between the expected value of the distance to the origin and the scanning resolution yields the corresponding discriminant distance for each piece of data. Combined with the discriminant distance, the program simulates laser beams in random directions to detect the point cloud, and obtains the gap ratio of each area. Gap rate. Figures 5 and 6 are obtained by comparing the gap ratio results of this method with the gap ratios obtained by projecting to the sphere after voxelization; the gap ratios obtained by both methods show a decreasing trend with the increase of the zenith angle, and are given Figure 6 shows a strong correlation between the results of the two methods, reaching 0.82.
但与体元法的间隙率相比,蒙特卡洛模拟射线法计算的间隙率在天顶角30°之前较低,在天顶角30°之后则较高。这是由于对冠层点云进行体元化时,没有考虑点云距坐标原点的距离,用统一的体元大小对全体点云进行划分,这会造成在投影到单位半径的球面时,距原点不同远近的体元在球面上对应的实际大小并不一致,但进行间隙的统计时却用固定大小的切片,因此会造成一部分数据过度划分而另一部分则不充分划分,同时也说明了使用本发明的方法估算间隙率是有效和可行的。However, compared with the gap ratio of the voxel method, the gap ratio calculated by the Monte Carlo simulation ray method is lower before the zenith angle of 30° and higher after the zenith angle of 30°. This is because when the canopy point cloud is voxelized, the distance between the point cloud and the coordinate origin is not considered, and the entire point cloud is divided with a uniform voxel size, which will cause the projection to the spherical surface of unit radius. The actual sizes of voxels with different distances from the origin on the spherical surface are not consistent, but fixed-size slices are used for gap statistics, which will cause some data to be over-divided and another part to be insufficiently divided. The inventive method is effective and feasible for estimating the clearance rate.
Claims (3)
Translated fromChinese


Priority Applications (1)
| Application Number | Priority Date | Filing Date | Title |
|---|---|---|---|
| CN202010853776.3ACN112068153B (en) | 2020-08-24 | 2020-08-24 | Crown clearance rate estimation method based on foundation laser radar point cloud |
Applications Claiming Priority (1)
| Application Number | Priority Date | Filing Date | Title |
|---|---|---|---|
| CN202010853776.3ACN112068153B (en) | 2020-08-24 | 2020-08-24 | Crown clearance rate estimation method based on foundation laser radar point cloud |
Publications (2)
| Publication Number | Publication Date |
|---|---|
| CN112068153A CN112068153A (en) | 2020-12-11 |
| CN112068153Btrue CN112068153B (en) | 2022-07-29 |
Family
ID=73660321
Family Applications (1)
| Application Number | Title | Priority Date | Filing Date |
|---|---|---|---|
| CN202010853776.3AActiveCN112068153B (en) | 2020-08-24 | 2020-08-24 | Crown clearance rate estimation method based on foundation laser radar point cloud |
Country Status (1)
| Country | Link |
|---|---|
| CN (1) | CN112068153B (en) |
Families Citing this family (9)
| Publication number | Priority date | Publication date | Assignee | Title |
|---|---|---|---|---|
| CN112859108B (en)* | 2021-01-28 | 2024-03-22 | 中国科学院南京土壤研究所 | Method for extracting vegetation coverage under forests under complex terrain condition by using ground laser radar data |
| CN113468735B (en)* | 2021-06-24 | 2024-03-22 | 国汽(北京)智能网联汽车研究院有限公司 | Laser radar simulation method, device, system and storage medium |
| CN113945945B (en)* | 2021-08-26 | 2024-04-09 | 北京师范大学 | Estimation method for leaf area index of vegetation under forest |
| CN114265036B (en)* | 2021-12-21 | 2023-05-12 | 电子科技大学 | Vegetation aggregation index estimation method based on foundation laser radar point cloud |
| CN115356748B (en)* | 2022-09-29 | 2023-01-17 | 江西财经大学 | Method and system for extracting atmospheric pollution information based on laser radar observation result |
| CN115984359A (en)* | 2022-12-29 | 2023-04-18 | 中国电建集团昆明勘测设计研究院有限公司 | Extraction method of single tree canopy volume from ground-based laser point cloud based on spherical coordinate integration |
| CN117934564B (en)* | 2024-01-05 | 2024-07-30 | 南京农业大学 | An automatic estimation method for leaf inclination distribution in wheat canopy based on voxel segmentation normal vector algorithm |
| CN118823231B (en)* | 2024-06-07 | 2025-02-11 | 北京科杰科技有限公司 | A three-dimensional modeling method |
| CN120525904A (en)* | 2025-07-23 | 2025-08-22 | 成都量芯集成科技有限公司 | Indoor scene point cloud blocking method |
Citations (10)
| Publication number | Priority date | Publication date | Assignee | Title |
|---|---|---|---|---|
| JP2010226968A (en)* | 2009-03-25 | 2010-10-14 | Nagaoka Univ Of Technology | Crop growth diagnosis method and growth diagnosis system |
| CN103900501A (en)* | 2014-03-26 | 2014-07-02 | 福州大学 | Vegetation canopy gap size distribution algorithm |
| CN103983230A (en)* | 2014-05-29 | 2014-08-13 | 福州大学 | Verification method for indirect measurement of ground leaf area index |
| CN106248003A (en)* | 2016-08-24 | 2016-12-21 | 电子科技大学 | A kind of three-dimensional laser point cloud extracts the method for Vegetation canopy concentration class index |
| CN107831497A (en)* | 2017-09-26 | 2018-03-23 | 南京大学 | A kind of method that forest building-up effect is quantitatively portrayed using three dimensional point cloud |
| CN108195736A (en)* | 2017-12-19 | 2018-06-22 | 电子科技大学 | A kind of method of three-dimensional laser point cloud extraction Vegetation canopy clearance rate |
| CN109613552A (en)* | 2018-12-07 | 2019-04-12 | 厦门大学 | A detection and analysis method for TLS multi-echo point cloud vegetation occluded targets |
| CN110223314A (en)* | 2019-06-06 | 2019-09-10 | 电子科技大学 | A kind of single wooden dividing method based on the distribution of tree crown three-dimensional point cloud |
| CN110703277A (en)* | 2019-10-21 | 2020-01-17 | 北京师范大学 | Method for inverting forest canopy aggregation index based on full-waveform laser radar data |
| CN111289997A (en)* | 2020-01-19 | 2020-06-16 | 江苏大学 | Method for detecting field crop canopy thickness based on laser radar sensor |
Family Cites Families (5)
| Publication number | Priority date | Publication date | Assignee | Title |
|---|---|---|---|---|
| CA2802697C (en)* | 2010-06-16 | 2021-01-12 | Yale University | Forest inventory assessment using remote sensing data |
| CN102997871A (en)* | 2012-11-23 | 2013-03-27 | 南京大学 | Method for inverting effective leaf area index by utilizing geometric projection and laser radar |
| JP6265373B2 (en)* | 2013-11-14 | 2018-01-24 | 国立研究開発法人海洋研究開発機構 | Simulation device, simulation method, and simulation program |
| CN105389538B (en)* | 2015-10-09 | 2018-07-13 | 南京大学 | A method of based on a cloud hemisphere slice estimation Forest Leaf Area Index |
| US10776111B2 (en)* | 2017-07-12 | 2020-09-15 | Topcon Positioning Systems, Inc. | Point cloud data method and apparatus |
- 2020
- 2020-08-24CNCN202010853776.3Apatent/CN112068153B/enactiveActive
Patent Citations (10)
| Publication number | Priority date | Publication date | Assignee | Title |
|---|---|---|---|---|
| JP2010226968A (en)* | 2009-03-25 | 2010-10-14 | Nagaoka Univ Of Technology | Crop growth diagnosis method and growth diagnosis system |
| CN103900501A (en)* | 2014-03-26 | 2014-07-02 | 福州大学 | Vegetation canopy gap size distribution algorithm |
| CN103983230A (en)* | 2014-05-29 | 2014-08-13 | 福州大学 | Verification method for indirect measurement of ground leaf area index |
| CN106248003A (en)* | 2016-08-24 | 2016-12-21 | 电子科技大学 | A kind of three-dimensional laser point cloud extracts the method for Vegetation canopy concentration class index |
| CN107831497A (en)* | 2017-09-26 | 2018-03-23 | 南京大学 | A kind of method that forest building-up effect is quantitatively portrayed using three dimensional point cloud |
| CN108195736A (en)* | 2017-12-19 | 2018-06-22 | 电子科技大学 | A kind of method of three-dimensional laser point cloud extraction Vegetation canopy clearance rate |
| CN109613552A (en)* | 2018-12-07 | 2019-04-12 | 厦门大学 | A detection and analysis method for TLS multi-echo point cloud vegetation occluded targets |
| CN110223314A (en)* | 2019-06-06 | 2019-09-10 | 电子科技大学 | A kind of single wooden dividing method based on the distribution of tree crown three-dimensional point cloud |
| CN110703277A (en)* | 2019-10-21 | 2020-01-17 | 北京师范大学 | Method for inverting forest canopy aggregation index based on full-waveform laser radar data |
| CN111289997A (en)* | 2020-01-19 | 2020-06-16 | 江苏大学 | Method for detecting field crop canopy thickness based on laser radar sensor |
Non-Patent Citations (5)
| Title |
|---|
| Analyzing forest canopies with ground-based laser scanning: A comparison with hemisphericalphotography;Seidel, D等;《AGRICULTURAL AND FOREST METEOROLOGY》;20120315;第154卷;全文* |
| FOREST CANOPY LEAF AREA DENSITY ESTIMATION BASED ON AIRBORNE AND TERRESTRIAL LIDAR DATA;Dai, LY;《IGARSS 2018 - 2018 IEEE INTERNATIONAL GEOSCIENCE AND REMOTE SENSING SYMPOSIUM》;20181231;全文* |
| Testing the Application of Terrestrial Laser Scanning to Measure Forest Canopy Gap Fraction;Ramirez, FA等;《REMOTE SENSING》;20130131;全文* |
| 地基激光雷达提取单木冠层结构因子研究;王佳等;《农业机械学报》;20180425;第49卷(第2期);全文* |
| 顾及冠层叶面积指数分布特征的单株树木几何建模研究;庄崯国;《中国优秀博硕士学位论文全文数据库(硕士)农业科技辑》;20190515;全文* |
Also Published As
| Publication number | Publication date |
|---|---|
| CN112068153A (en) | 2020-12-11 |
Similar Documents
| Publication | Publication Date | Title |
|---|---|---|
| CN112068153B (en) | Crown clearance rate estimation method based on foundation laser radar point cloud | |
| CN106248003B (en) | A kind of method of three-dimensional laser point cloud extraction Vegetation canopy concentration class index | |
| CN106960468B (en) | A kind of 3 D laser scanning point cloud Accuracy Assessment | |
| Vincent et al. | Mapping plant area index of tropical evergreen forest by airborne laser scanning. A cross-validation study using LAI2200 optical sensor | |
| CN105389538B (en) | A method of based on a cloud hemisphere slice estimation Forest Leaf Area Index | |
| JP5507418B2 (en) | Tree position detection device, tree position detection method, and program | |
| CN109509256A (en) | Building structure automatic measurement and 3D model generating method based on laser radar | |
| CN110988909B (en) | Vegetation Coverage Measurement Method of Sandy Land Vegetation in Alpine Vulnerable Area Based on TLS | |
| CN107831497B (en) | A method to quantitatively characterize forest clustering effect using 3D point cloud data | |
| CN102914501A (en) | Method for calculating extinction coefficients of three-dimensional forest canopy by using laser-point cloud | |
| CN107479065B (en) | A method for measuring the three-dimensional structure of forest gaps based on lidar | |
| Chen et al. | Estimation of forest leaf area index using terrestrial laser scanning data and path length distribution model in open-canopy forests | |
| CN102997871A (en) | Method for inverting effective leaf area index by utilizing geometric projection and laser radar | |
| Li et al. | An iterative-mode scan design of terrestrial laser scanning in forests for minimizing occlusion effects | |
| CN114066966B (en) | A method for estimating tree crown porosity based on porous media theory and computer graphics | |
| CN116379915B (en) | Building mapping method, device, system and storage medium | |
| CN118865136A (en) | A forest information extraction method based on drone and lidar | |
| CN116503727B (en) | Vegetation aggregation index estimation method based on Poisson distribution and point cloud clustering | |
| Liu et al. | Analysis of cotton height spatial variability based on UAV-LiDAR | |
| CN116881609B (en) | Calculation method for gap rate of forest canopy in universality | |
| CN117152472B (en) | Building deformation measurement method for building design | |
| CN114663786A (en) | Forest stand radiation flux calculation method based on point cloud data and computer graphics | |
| CN112150479A (en) | Single tree segmentation and tree height and crown width extraction method based on Gaussian clustering | |
| Li et al. | A new approach for estimating living vegetation volume based on terrestrial point cloud data | |
| CN118229757A (en) | Estimation method for grassland leaf area index and grassland canopy height |
Legal Events
| Date | Code | Title | Description |
|---|---|---|---|
| PB01 | Publication | ||
| PB01 | Publication | ||
| SE01 | Entry into force of request for substantive examination | ||
| SE01 | Entry into force of request for substantive examination | ||
| GR01 | Patent grant | ||
| GR01 | Patent grant |