CN111985731A - Method and system for predicting number of people at urban public transport station - Google Patents
Method and system for predicting number of people at urban public transport stationDownload PDFInfo
- Publication number
- CN111985731A CN111985731ACN202010940563.4ACN202010940563ACN111985731ACN 111985731 ACN111985731 ACN 111985731ACN 202010940563 ACN202010940563 ACN 202010940563ACN 111985731 ACN111985731 ACN 111985731A
- Authority
- CN
- China
- Prior art keywords
- station
- stations
- people
- public transport
- vector
- Prior art date
- Legal status (The legal status is an assumption and is not a legal conclusion. Google has not performed a legal analysis and makes no representation as to the accuracy of the status listed.)
- Granted
Links
Images


Classifications
- G—PHYSICS
- G06—COMPUTING OR CALCULATING; COUNTING
- G06Q—INFORMATION AND COMMUNICATION TECHNOLOGY [ICT] SPECIALLY ADAPTED FOR ADMINISTRATIVE, COMMERCIAL, FINANCIAL, MANAGERIAL OR SUPERVISORY PURPOSES; SYSTEMS OR METHODS SPECIALLY ADAPTED FOR ADMINISTRATIVE, COMMERCIAL, FINANCIAL, MANAGERIAL OR SUPERVISORY PURPOSES, NOT OTHERWISE PROVIDED FOR
- G06Q10/00—Administration; Management
- G06Q10/04—Forecasting or optimisation specially adapted for administrative or management purposes, e.g. linear programming or "cutting stock problem"
- G—PHYSICS
- G06—COMPUTING OR CALCULATING; COUNTING
- G06F—ELECTRIC DIGITAL DATA PROCESSING
- G06F17/00—Digital computing or data processing equipment or methods, specially adapted for specific functions
- G06F17/10—Complex mathematical operations
- G06F17/16—Matrix or vector computation, e.g. matrix-matrix or matrix-vector multiplication, matrix factorization
- G—PHYSICS
- G06—COMPUTING OR CALCULATING; COUNTING
- G06Q—INFORMATION AND COMMUNICATION TECHNOLOGY [ICT] SPECIALLY ADAPTED FOR ADMINISTRATIVE, COMMERCIAL, FINANCIAL, MANAGERIAL OR SUPERVISORY PURPOSES; SYSTEMS OR METHODS SPECIALLY ADAPTED FOR ADMINISTRATIVE, COMMERCIAL, FINANCIAL, MANAGERIAL OR SUPERVISORY PURPOSES, NOT OTHERWISE PROVIDED FOR
- G06Q50/00—Information and communication technology [ICT] specially adapted for implementation of business processes of specific business sectors, e.g. utilities or tourism
- G06Q50/10—Services
- G06Q50/26—Government or public services
Landscapes
- Engineering & Computer Science (AREA)
- Business, Economics & Management (AREA)
- Physics & Mathematics (AREA)
- General Physics & Mathematics (AREA)
- Theoretical Computer Science (AREA)
- Tourism & Hospitality (AREA)
- Strategic Management (AREA)
- Human Resources & Organizations (AREA)
- Economics (AREA)
- Mathematical Physics (AREA)
- Development Economics (AREA)
- General Business, Economics & Management (AREA)
- Computational Mathematics (AREA)
- Marketing (AREA)
- Data Mining & Analysis (AREA)
- Mathematical Analysis (AREA)
- Pure & Applied Mathematics (AREA)
- Mathematical Optimization (AREA)
- Quality & Reliability (AREA)
- Primary Health Care (AREA)
- Computing Systems (AREA)
- Entrepreneurship & Innovation (AREA)
- General Engineering & Computer Science (AREA)
- Operations Research (AREA)
- Databases & Information Systems (AREA)
- Game Theory and Decision Science (AREA)
- Algebra (AREA)
- Educational Administration (AREA)
- Health & Medical Sciences (AREA)
- General Health & Medical Sciences (AREA)
- Software Systems (AREA)
- Management, Administration, Business Operations System, And Electronic Commerce (AREA)
Abstract
Translated fromChinese
Description
Translated fromChinese技术领域technical field
本发明涉及数据处理技术领域,特别涉及一种城市公共交通站点人数的预测方法及系统。The invention relates to the technical field of data processing, in particular to a method and system for predicting the number of people at urban public transport stations.
背景技术Background technique
交通预测问题是智能交通系统的重要组成部分,其任务是在统计过去一段时间内历史交通数据的基础上,预测未来若干个时刻的交通数据。通常需要预测的交通数据包含流量和速度。流量是指单位时间内通过某个监测站点或某条道路的人数或/和车辆数,速度则是指单位时间内通过某监测站点或某条道路的平均速度。如何准确地预测城市范围内未来若干个时刻的交通数据,对城市交通管理和市民高效出行均有十分重要的作用。Traffic prediction is an important part of the intelligent transportation system. Its task is to predict the traffic data of several moments in the future on the basis of statistics of historical traffic data in the past period of time. Often the traffic data that needs to be predicted consists of flow and speed. Flow refers to the number of people or/and vehicles passing through a monitoring site or a certain road in a unit time, and speed refers to the average speed of passing a certain monitoring site or a certain road in a unit time. How to accurately predict the traffic data of several moments in the future in the city is very important for urban traffic management and efficient travel of citizens.
当前关于交通预测所采取的方法主要分为两类。一类方法是将交通预测视为一个基于时间序列的回归问题。该类方法的一个基本步骤是首先将统计得到的历史数据按照时间顺序进行排列形成时间序列数据,然后采用统计学上的时间序列模型预测未来若干时刻的交通数据。在技术上,该类方法主要采用一组长度固定的滤波器模板,逐步滑过时间序列数据,并在滑动过程中优化滤波器模板的参数。主要采用的时间序列预测模型包括滑动窗口模型、自回归滑动平均模型、自回归积分滑动平均模型、卡尔曼滤波模型等。该类方法的主要特点是短时间预测结果有效,但长时间预测精度会显著下降。由于该类方法没有考虑城市交通道路网络中多条道路和多个站点的关联关系,因此只能用于预测单个公共交通站点。另外一类方法是将交通预测视为一个统计模式分类问题。首先设计一个预测器,然后将已收集的历史交通数据按一定方式进行整理,作为预测器的输入与输出,并训练预测器的参数,最后将当前的交通数据输入至预测器,并将预测器的输出作为未来若干时刻的交通数据。预测器的类别、结构以及历史交通数据的整理方式等均会影响预测器的预测性能。常用的预测器包含人工神经网络和支持向量机等模型。这些预测器的适用条件和预测精度各不相同,通常只能针对少数几条道路或者小规模的空间区域;同时,预测时间短,预测精度不高。The current approaches to traffic forecasting are mainly divided into two categories. One class of approaches is to treat traffic forecasting as a time series based regression problem. A basic step of this type of method is to first arrange the historical data obtained by statistics in time sequence to form time series data, and then use a statistical time series model to predict the traffic data at several moments in the future. Technically, this type of method mainly uses a set of fixed-length filter templates, gradually slides through the time series data, and optimizes the parameters of the filter templates during the sliding process. The main time series prediction models used include sliding window model, autoregressive moving average model, autoregressive integral moving average model, Kalman filter model, etc. The main feature of this type of method is that the short-term prediction results are effective, but the long-term prediction accuracy will drop significantly. Since this type of method does not consider the relationship between multiple roads and multiple stations in the urban traffic road network, it can only be used to predict a single public transportation station. Another class of approaches treat traffic prediction as a statistical pattern classification problem. First design a predictor, then organize the collected historical traffic data in a certain way as the input and output of the predictor, and train the parameters of the predictor, and finally input the current traffic data into the predictor, and use the predictor The output is used as traffic data for several moments in the future. The predictor's category, structure, and how historical traffic data is organized all affect the predictor's predictive performance. Commonly used predictors include models such as artificial neural networks and support vector machines. The applicable conditions and prediction accuracy of these predictors are different, usually only for a few roads or small-scale spatial areas; at the same time, the prediction time is short and the prediction accuracy is not high.
相比于传统模型,深层神经网络模型的预测精度更高、有效预测的时间更长,但是需要收集超大规模的时间跨度长的历史交通数据。采用深层神经网络模型预测交通数据的方法可进一步细分为两类。一类是基于空间特征的卷积神经网络模型。其具体做法是将一定的城市空间栅格化地分为若干个区域块,每一个区域块看成是图像中的一个像素,该像素的像素值由某一时间段内其近邻区域进出该区域块的交通流量来确定,接着将所有像素按照其空间位置合成为一张图像,并以这些图像作为训练样本来训练卷积神经网络,并由此预测未来时刻的图像(交通流量)。该类方法的准确率较高,可适用的城市空间规模较大。但是,该类仅能预测未来短时间内的交通流量,且空间分辨率低。同时,通过像素表示的数据不能明确地反应道路、公共交通站点处的流量。另一类是基于时序特征的循环神经网络模型。该类方法首先将历史交通数据表示为一个矩阵,矩阵的每一行表示研究范围内的所有道路或者公共交通站点,每一列表示一个时刻;然后将矩阵的每一列,即每一个时刻所有道路、站点的数据按照时间顺序依次输入预测器,预测未来若干个时刻的交通数据。除了用二维矩阵表示交通数据外,也可以加入其它特征如天气状况、当天是否工作日作为新的一维,将交通数据表示为三维或者更高维的张量。这类基于循环神经网络模型的方法可以预测未来较长时间的交通数据,预测精度也比较高。但是,该类方法仍然无法考虑道路、站点之间的空间关联性,可适用的道路、站点规模集合也比较小。Compared with traditional models, deep neural network models have higher prediction accuracy and longer effective prediction time, but need to collect large-scale historical traffic data with a long time span. Methods for predicting traffic data using deep neural network models can be further subdivided into two categories. One is the convolutional neural network model based on spatial features. The specific method is to rasterize a certain urban space into several area blocks, each area block is regarded as a pixel in the image, and the pixel value of the pixel enters and exits the area from its neighbors within a certain period of time. The traffic flow of the block is determined, and then all the pixels are synthesized into an image according to their spatial positions, and these images are used as training samples to train the convolutional neural network, and thus predict the image (traffic flow) of the future time. This type of method has a high accuracy and is applicable to a large scale of urban space. However, this class can only predict the traffic flow in a short time in the future, and the spatial resolution is low. At the same time, the data represented by pixels cannot unambiguously reflect the traffic at roads and public transport stations. The other type is the recurrent neural network model based on time series features. This type of method first expresses historical traffic data as a matrix, each row of the matrix represents all roads or public transportation stations within the research range, and each column represents a moment; then each column of the matrix, that is, all roads and stations at each moment The data are input into the predictor in chronological order to predict the traffic data at several moments in the future. In addition to representing the traffic data with a two-dimensional matrix, other features such as weather conditions and whether the day is a working day can also be added as a new one-dimensional matrix, and the traffic data can be represented as a three-dimensional or higher-dimensional tensor. This kind of method based on the recurrent neural network model can predict the traffic data for a long time in the future, and the prediction accuracy is relatively high. However, this type of method still cannot consider the spatial correlation between roads and stations, and the applicable road and station scale set is relatively small.
综上所述,当前城市交通预测方法存在一些普遍的问题。其一,现有方法可适用的城市空间范围有限;其二,现有方法可预测时间短,长时段预测的精度显著下降。To sum up, there are some common problems in current urban traffic forecasting methods. First, the applicable urban space range of the existing methods is limited; second, the existing methods can predict for a short time, and the accuracy of long-term prediction decreases significantly.
发明内容SUMMARY OF THE INVENTION
为了解决现有技术中的上述问题,即为了提高长时段预测的精度,本发明的目的在于提供一种城市公共交通站点人数的预测方法及系统。In order to solve the above problems in the prior art, that is, in order to improve the accuracy of long-term prediction, the purpose of the present invention is to provide a method and system for predicting the number of people at urban public transport stations.
为解决上述技术问题,本发明提供了如下方案:In order to solve the above-mentioned technical problems, the present invention provides the following scheme:
一种城市公共交通站点人数的预测方法,所述预测方法包括:A method for predicting the number of people at an urban public transport station, the predicting method comprising:
统计在训练时段内待测城市公共交通所有站点各时间区间内的站点人数,构建在训练时段内的公共交通站点人数矩阵;Count the number of people in each time interval of all public transport stations in the city to be tested during the training period, and build a matrix of the number of public transport stations within the training period;
根据所述公共交通站点人数矩阵,构建站点特征向量;According to the public transport station population matrix, construct a station feature vector;
根据所述站点特征向量对公共交通站点进行层次聚类,并根据聚类结果从各站点中确定监测站点;Perform hierarchical clustering on public transport stations according to the station feature vector, and determine monitoring stations from each station according to the clustering result;
统计在预测时段内各监测站点的站点人数,构建预测时段内的监测站点人数向量;Count the number of people at each monitoring site during the forecast period, and construct a vector of people at the monitoring sites within the forecast period;
根据所述公共交通站点人数矩阵及预测时段内的监测站点人数向量,建立基于非负约束的稀疏岭回归模型,以确定预测时段内的各监测站点的站点人数与训练时段各站点的站点人数之间的时间相似度系数;According to the public transport station population matrix and the monitoring site population vector within the forecast period, a sparse ridge regression model based on non-negative constraints is established to determine the difference between the site population of each monitoring site during the forecast period and the site population of each site during the training period time similarity coefficient between
基于所述公共交通站点人数矩阵,根据所述时间相似度系数,预测所有站点的站点预测人数。Based on the public transportation station population matrix, and according to the temporal similarity coefficient, the predicted station population of all stations is predicted.
可选地,所述统计在训练时段内待测城市公共交通所有站点各时间区间内的站点人数,构建在训练时段内的公共交通站点人数矩阵,具体包括:Optionally, the statistics of the number of people at each time interval of all the public transport stations in the city to be tested during the training period are used to construct a matrix of the number of people at the public transport stations within the training period, specifically including:
统计训练时段内的待测城市所有公交站点各时刻站点人数记录;Statistically record the number of people at all bus stops in the city to be tested at each time during the training period;
按照设定时间间隔对训练时段进行划分,获得连续的等长度的时间区间,分别统计各站点各时间区间的站点人数;Divide the training period according to the set time interval, obtain continuous time intervals of equal length, and count the number of people at each station in each time interval;
将各站点的站点人数按时间顺序进行排列,获得各站点人数时间序列数据;Arrange the number of people at each site in chronological order to obtain time-series data of the number of people at each site;
按照以下公式,对各站点人数时间序列数据进行重采样,得到对应的采样结果:According to the following formula, the time series data of the number of people at each site are resampled to obtain the corresponding sampling results:

其中,


将各站点人数时间序列数据重采样后的采样结果组合得到站点行向量x(n):The site row vector x(n) is obtained by combining the sampling results after resampling the time series data of the number of people at each site:

其中,S为连续时间区间的总个数;Among them, S is the total number of continuous time intervals;
按站点序号将对应于各站点的站点行向量组合,得到行数为N、列数为p(S-1)+1的公共交通站点人数矩阵X:Combine the station row vectors corresponding to each station according to the station serial number to obtain a public transportation station population matrix X with the number of rows N and the number of columns p(S-1)+1:

其中,上标T表示向量或矩阵转置。where the superscript T represents the vector or matrix transpose.
可选地,根据以下公式构建站点特征向量v(n):Optionally, the site feature vector v(n) is constructed according to the following formula:
v(n)=(x(n),sn,tn)T,n=1,2,…,N,v(n) =(x(n) ,sn,tn )T ,n=1,2,...,N,
其中,x(n)表示对第n个公共交通站点人数统计结果重采样结果,sn和tn分别为第n个公共交通站点所在地理位置的经度和纬度,n为公共交通站点的序号,N表示公共交通站点的总数,上标T表示向量转置。Among them, x(n) represents the resampling result of the population statistics of the nth public transportation station, sn and tn are the longitude and latitude of the geographical location of the nth public transportation station, respectively, n is the serial number of the public transportation station, N denotes the total number of public transport stops, and the superscript T denotes the vector transpose.
可选地,根据所述特征向量对公共交通站点进行层次聚类,并根据聚类结果从各站点中确定监测站点,具体包括:Optionally, perform hierarchical clustering on public transport stations according to the feature vector, and determine monitoring stations from each station according to the clustering result, specifically including:
根据站点特征向量对站点进行自底向上的分层聚类;Bottom-up hierarchical clustering of sites according to site feature vectors;
根据分层聚类的结果自顶向下地选择监测站点。Monitoring sites are selected top-down based on the results of hierarchical clustering.
可选地,所述根据站点特征向量对站点进行自底向上的分层聚类,具体包括:Optionally, performing bottom-up hierarchical clustering on the site according to the site feature vector specifically includes:
将每个站点作为单独的一个类别,共N个类别;Treat each site as a separate category, with a total of N categories;
根据以下公式,计算类与类之间的距离,将距离最近的两个类合并为一类,如此循环直至所有的站点归为一类:According to the following formula, the distance between classes is calculated, and the two classes with the closest distance are merged into one class, and so on until all sites are classified into one class:


其中,聚类步数索引值D(u(a),u(b))表示第a类和第b类之间的距离,向量u(a)表示第a类的聚类中心,向量u(b)表示第b类的聚类中心,

可选地,根据所述公共交通站点人数矩阵及预测时段内的监测站点人数向量,建立基于非负约束的稀疏岭回归模型,具体包括:Optionally, a non-negative constraint-based sparse ridge regression model is established according to the public transport station population matrix and the monitoring site population vector within the forecast period, specifically including:
构建训练时段公共交通站点人数矩阵X的站点序号m与预测时段监测站点序号n的映射函数g(n):Construct the mapping function g(n) between the station number m of the public transport station population matrix X in the training period and the monitoring station number n in the prediction period:
g(n)=m,n=1,2,…,M;g(n)=m, n=1,2,...,M;
其中,g(n)=m表示预测时段内的监测站点人数向量y的第n个元素yn所代表的监测站点是训练时段站点人数矩阵X的第m行所表示的站点;M为监测站点的个数;Among them, g(n)=m indicates that the monitoring site represented by the nth element yn of the monitoring site population vector y in the prediction period is the site represented by the mth row of the site population matrix X during the training period; M is the monitoring site the number of;
根据所述映射函数g(n)及公共交通站点人数矩阵X,获取训练时段在第s个时间区间上所有站点的统计向量xs:According to the mapping function g(n) and the population matrix X of public transportation stations, obtain the statistical vector xs of all stations in the s-th time interval during the training period:

其中,
基于监测站点人数向量y及统计向量xs构建基于非负约束的稀疏岭回归模型:A non-negative constraint-based sparse ridge regression model is constructed based on the monitoring station population vector y and the statistical vector xs :

其中,αs,s=1,2,…,p(S-1)+1,表示预测时段内的各监测站点的站点人数与训练时段各站点的站点人数之间的时间相似度系数;
可选地,基于所述公共交通站点人数矩阵,根据所述时间相似度系数,预测所有站点的站点预测人数,具体包括:Optionally, based on the public transport station population matrix, according to the time similarity coefficient, predict the site predicted population of all sites, specifically including:
将时间相似度系数按照时间顺序排列,得到时间相似度系数向量α:Arrange the time similarity coefficients in chronological order to obtain the time similarity coefficient vector α:
α=[α1,α2,…,αp(S-1)+1]T;α=[α1 ,α2 ,...,αp(S-1)+1 ]T ;
其中,α1,α2,…,αp(S-1)+1分别为预测时段内的各监测站点的站点人数与训练时段各站点的站点人数之间的时间相似度系数,自然数S为连续时间区间的总个数,p为重采样过程的时间采样率,上标T表示向量或矩阵转置;Among them, α1 , α2 ,...,αp(S-1)+1 are the time similarity coefficients between the number of people at each monitoring site in the prediction period and the number of people at each site in the training period, and the natural number S is The total number of continuous time intervals, p is the time sampling rate of the resampling process, and the superscript T represents the vector or matrix transposition;
根据公共交通站点人数矩阵X与时间相似度系数向量α,得到预测时段内所有站点的预测人数向量Y:According to the public transport station population matrix X and the time similarity coefficient vector α, the predicted population vector Y of all stations in the prediction period is obtained:
Y=Xα;Y=Xα;
根据预测时段内所有站点的预测人数向量Y,确定所有站点的站点预测人数。According to the predicted population vector Y of all sites during the forecast period, determine the site predicted population of all sites.
为解决上述技术问题,本发明还提供了如下方案:In order to solve the above-mentioned technical problems, the present invention also provides the following solutions:
一种城市公共交通站点人数的预测系统,所述预测系统包括:A prediction system for the number of people in urban public transport stations, the prediction system includes:
历史数据统计单元,用于统计在训练时段内待测城市公共交通所有站点各时间区间内的站点人数,构建在训练时段内的公共交通站点人数矩阵;The historical data statistics unit is used to count the number of people at each time interval of all public transport stations in the city to be tested during the training period, and to construct a matrix of the number of public transport stations within the training period;
特征向量构建单元,用于根据所述公共交通站点人数矩阵,构建站点特征向量;a feature vector construction unit, used for constructing a site feature vector according to the public transport site population matrix;
分层聚类单元,用于根据所述站点特征向量对公共交通站点进行层次聚类,并根据聚类结果从各站点中确定监测站点;Hierarchical clustering unit, used to perform hierarchical clustering on public transport stations according to the station feature vector, and determine monitoring stations from each station according to the clustering result;
人数向量构建单元,用于统计在预测时段内各监测站点的站点人数,构建预测时段内的监测站点人数向量;The number of people vector construction unit is used to count the number of people at each monitoring site within the forecast period, and to construct the number of people at the monitoring site within the forecast period;
模型建立单元,用于根据所述公共交通站点人数矩阵及预测时段内的监测站点人数向量,建立基于非负约束的稀疏岭回归模型,以确定预测时段内的各监测站点的站点人数与训练时段各站点的站点人数之间的时间相似度系数;A model building unit is used to establish a sparse ridge regression model based on non-negative constraints according to the population matrix of the public transport stations and the population vector of the monitoring sites within the prediction period, so as to determine the site population and training period of each monitoring site within the prediction period The time similarity coefficient between the site population of each site;
人数预测单元,用于基于所述公共交通站点人数矩阵,根据所述时间相似度系数,预测所有站点的站点预测人数。The number of people predicting unit is used for predicting the number of people at all stations according to the time similarity coefficient based on the number of people at the public transport station matrix.
为解决上述技术问题,本发明还提供了如下方案:In order to solve the above-mentioned technical problems, the present invention also provides the following solutions:
一种城市公共交通站点人数的预测系统,包括:A forecasting system for the number of people at urban public transport stops, including:
处理器;以及processor; and
被安排成存储计算机可执行指令的存储器,所述可执行指令在被执行时使所述处理器执行以下操作:memory arranged to store computer-executable instructions which, when executed, cause the processor to:
统计在训练时段内待测城市公共交通所有站点各时间区间内的站点人数,构建在训练时段内的公共交通站点人数矩阵;Count the number of people in each time interval of all public transport stations in the city to be tested during the training period, and build a matrix of the number of public transport stations within the training period;
根据所述公共交通站点人数矩阵,构建站点特征向量;According to the public transport station population matrix, construct a station feature vector;
根据所述站点特征向量对公共交通站点进行层次聚类,并根据聚类结果从各站点中确定监测站点;Perform hierarchical clustering on public transport stations according to the station feature vector, and determine monitoring stations from each station according to the clustering result;
统计在预测时段内各监测站点的站点人数,构建预测时段内的监测站点人数向量;Count the number of people at each monitoring site during the forecast period, and construct a vector of people at the monitoring sites within the forecast period;
根据所述公共交通站点人数矩阵及预测时段内的监测站点人数向量,建立基于非负约束的稀疏岭回归模型,以确定预测时段内的各监测站点的站点人数与训练时段各站点的站点人数之间的时间相似度系数;According to the public transport station population matrix and the monitoring site population vector within the forecast period, a sparse ridge regression model based on non-negative constraints is established to determine the difference between the site population of each monitoring site during the forecast period and the site population of each site during the training period time similarity coefficient between
基于所述公共交通站点人数矩阵,根据所述时间相似度系数,预测所有站点的站点预测人数。Based on the public transportation station population matrix, and according to the temporal similarity coefficient, the predicted station population of all stations is predicted.
为解决上述技术问题,本发明还提供了如下方案:In order to solve the above-mentioned technical problems, the present invention also provides the following solutions:
一种计算机可读存储介质,所述计算机可读存储介质存储一个或多个程序,所述一个或多个程序当被包括多个应用程序的电子设备执行时,使得所述电子设备执行以下操作:A computer-readable storage medium storing one or more programs that, when executed by an electronic device including a plurality of application programs, cause the electronic device to perform the following operations :
统计在训练时段内待测城市公共交通所有站点各时间区间内的站点人数,构建在训练时段内的公共交通站点人数矩阵;Count the number of people in each time interval of all public transport stations in the city to be tested during the training period, and build a matrix of the number of public transport stations within the training period;
根据所述公共交通站点人数矩阵,构建站点特征向量;According to the public transport station population matrix, construct a station feature vector;
根据所述站点特征向量对公共交通站点进行层次聚类,并根据聚类结果从各站点中确定监测站点;Perform hierarchical clustering on public transport stations according to the station feature vector, and determine monitoring stations from each station according to the clustering result;
统计在预测时段内各监测站点的站点人数,构建预测时段内的监测站点人数向量;Count the number of people at each monitoring site during the forecast period, and construct a vector of people at the monitoring sites within the forecast period;
根据所述公共交通站点人数矩阵及预测时段内的监测站点人数向量,建立基于非负约束的稀疏岭回归模型,以确定预测时段内的各监测站点的站点人数与训练时段各站点的站点人数之间的时间相似度系数;According to the public transport station population matrix and the monitoring site population vector within the forecast period, a sparse ridge regression model based on non-negative constraints is established to determine the difference between the site population of each monitoring site during the forecast period and the site population of each site during the training period time similarity coefficient between
基于所述公共交通站点人数矩阵,根据所述时间相似度系数,预测所有站点的站点预测人数。Based on the public transportation station population matrix, and according to the temporal similarity coefficient, the predicted station population of all stations is predicted.
根据本发明的实施例,本发明公开了以下技术效果:According to the embodiments of the present invention, the present invention discloses the following technical effects:
本发明通过统计在训练时段内待测城市公共交通所有站点各时间区间内的站点人数,构建在训练时段内的公共交通站点人数矩阵;以及统计在预测时段内各监测站点的站点人数,构建预测时段内的监测站点人数向量,将公共交通站点的时空特征进行融合,同时考虑站点之间的空间关联性和时间依赖性,可提高预测的准确率,适用于长时间的交通数据预测,具有广阔的应用前景。The present invention constructs a matrix of the number of people in the public transport stations within the training period by counting the number of people at each time interval of all the stations of the urban public transport to be tested in the training period; The population vector of monitoring stations within a period of time, which integrates the spatiotemporal characteristics of public transport stations, and considers the spatial correlation and temporal dependence between stations, which can improve the accuracy of forecasting, and is suitable for long-term traffic data forecasting. application prospects.
附图说明Description of drawings
图1是本发明城市公共交通站点人数的预测方法的流程图;Fig. 1 is the flow chart of the method for predicting the number of people in urban public transport stations of the present invention;
图2是实验中一个非监测站点在训练时段内的站点人数曲线图;Figure 2 is a graph of the number of people at a non-monitored site during the training period in the experiment;
图3是实验中在预测时段内的一个非监测站点的预测站点人数与真实站点人数的对比图;Fig. 3 is a comparison chart of the predicted number of people at a non-monitored site and the actual number of people at a non-monitored site during the prediction period in the experiment;
图4是本发明城市公共交通站点人数的预测系统的模块结构示意图。FIG. 4 is a schematic diagram of the module structure of the system for predicting the number of people in urban public transport stations according to the present invention.
符号说明:Symbol Description:
历史数据统计单元—1,特征向量构建单元—2,分层聚类单元—3,人数向量构建单元—4,模型建立单元—5,人数预测单元—6。Historical data statistics unit-1, feature vector construction unit-2, hierarchical clustering unit-3, headcount vector construction unit-4, model construction unit-5, headcount prediction unit-6.
具体实施方式Detailed ways
下面参照附图来描述本发明的优选实施方式。本领域技术人员应当理解的是,这些实施方式仅仅用于解释本发明的技术原理,并非旨在限制本发明的保护范围。Preferred embodiments of the present invention are described below with reference to the accompanying drawings. It should be understood by those skilled in the art that these embodiments are only used to explain the technical principle of the present invention, and are not intended to limit the protection scope of the present invention.
本发明的目的是提供一种城市公共交通站点人数的预测方法,通过统计在训练时段内待测城市公共交通所有站点各时间区间内的站点人数,构建在训练时段内的公共交通站点人数矩阵;以及统计在预测时段内各监测站点的站点人数,构建预测时段内的监测站点人数向量,将公共交通站点的时空特征进行融合,同时考虑站点之间的空间关联性和时间依赖性,可提高预测的准确率,适用于长时间的交通数据预测,具有广阔的应用前景。The purpose of the present invention is to provide a method for predicting the number of people at urban public transport stations, by counting the number of people at each time interval of all urban public transport stations to be tested in the training period, and constructing a public transport station population matrix within the training period; And count the number of people at each monitoring site during the forecast period, construct a vector of people at the monitoring site during the forecast period, and integrate the spatiotemporal characteristics of public transport stations, while considering the spatial correlation and time dependence between stations, which can improve forecasting. It is suitable for long-term traffic data prediction and has broad application prospects.
为使本发明的上述目的、特征和优点能够更加明显易懂,下面结合附图和具体实施方式对本发明作进一步详细的说明。In order to make the above objects, features and advantages of the present invention more clearly understood, the present invention will be described in further detail below with reference to the accompanying drawings and specific embodiments.
如图1所示,本发明城市公共交通站点人数的预测方法包括:As shown in Figure 1, the method for predicting the number of people at urban public transport stations of the present invention includes:
步骤100:统计在训练时段内待测城市公共交通所有站点各时间区间内的站点人数,构建在训练时段内的公共交通站点人数矩阵。Step 100: Count the number of people at each time interval of all public transport stations in the city to be tested during the training period, and construct a matrix of the number of people at the public transport stations within the training period.
步骤200:根据所述公共交通站点人数矩阵,构建站点特征向量。Step 200: Construct a station feature vector according to the public transportation station population matrix.
步骤300:根据所述站点特征向量对公共交通站点进行层次聚类,并根据聚类结果从各站点中确定监测站点。Step 300: Perform hierarchical clustering on public transport stations according to the station feature vector, and determine monitoring stations from each station according to the clustering result.
步骤400:统计在预测时段内各监测站点的站点人数,构建预测时段内的监测站点人数向量。Step 400: Count the number of people at each monitoring site within the forecast period, and construct a vector of people at the monitoring site within the forecast period.
步骤500:根据所述公共交通站点人数矩阵及预测时段内的监测站点人数向量,建立基于非负约束的稀疏岭回归模型,以确定预测时段内的各监测站点的站点人数与训练时段各站点的站点人数之间的时间相似度系数。Step 500: According to the public transport station headcount matrix and the monitoring station headcount vector in the forecast period, a sparse ridge regression model based on non-negative constraints is established to determine the station headcount of each monitoring station in the forecast period and the training period of each station. Temporal similarity coefficient between site populations.
步骤600:基于所述公共交通站点人数矩阵,根据所述时间相似度系数,预测所有站点的站点预测人数。Step 600: Based on the public transport station population matrix, and according to the time similarity coefficient, predict the station predicted population of all stations.
在步骤100中,所述统计在训练时段内待测城市公共交通所有站点各时间区间内的站点人数,构建在训练时段内的公共交通站点人数矩阵,具体包括:In
步骤110:统计训练时段内的待测城市所有公交站点各时刻站点人数记录。Step 110: Count the records of the number of people at all bus stops in the city to be tested at each time during the training period.
具体地,站点人数可以为该站点的进站人数、出站人数、或进出站总人数,用户在实施本专利时可根据应用需要来决定。站点人数可以采用多种现有方法来获得。例如,可通过该市市政交通一卡通来获取。比如,首先获取一次刷卡记录的进站线路编号、进站站点编号、出站线路编号、出站线路站点编号、进站时间、出站时间;然后对这些记录进行汇总统计即可获得所有公交站点各时刻站点人数。另外,站点人数也可以通过客流统计摄像机、公共交通客流统计器等现有技术手段来获取。根据实际应用需要,训练时段可以定义为一个月、数个月或多年,也可以定义为指定的某一个时段,如早高峰7:00至9:00,晚高峰17:00至19:00,等等。Specifically, the number of people at the site can be the number of people entering the site, the number of people leaving the site, or the total number of people entering and leaving the site, and the user can decide according to application needs when implementing this patent. Site headcount can be obtained using a number of existing methods. For example, it can be obtained through the city's municipal transportation card. For example, first obtain the inbound line number, inbound station number, outbound line number, outbound line station number, inbound time, and outbound time of a card swipe record; then, all bus stops can be obtained by summarizing these records. Number of people at each time station. In addition, the number of people at a station can also be obtained through existing technical means such as a passenger flow counting camera and a public transport passenger flow counter. According to actual application needs, the training period can be defined as one month, several months or years, or can be defined as a specified period, such as morning peak from 7:00 to 9:00, evening peak from 17:00 to 19:00, and many more.
步骤120:按照设定时间间隔对训练时段进行划分,获得连续的等长度的时间区间,分别统计各站点各时间区间的站点人数。Step 120: Divide the training period according to the set time interval, obtain continuous time intervals of equal length, and count the number of people at each station in each time interval.
根据应用需求,时间区间的长短由时间间隔来决定。比如,时间间隔可以定义为两分钟、五分钟、十分钟、二十分钟、半小时、一个小时、两个小时或更长时间等。如果时间间隔取得过短,则统计结果较为稀疏,即短时间内可能没有乘客进出站点;如果时间间隔取得过长,则统计结果无法细致地描述站点人数在时间上的分布特性。According to the application requirements, the length of the time interval is determined by the time interval. For example, the time interval can be defined as two minutes, five minutes, ten minutes, twenty minutes, half an hour, one hour, two hours or more, etc. If the time interval is too short, the statistical results are sparse, that is, there may be no passengers entering or leaving the station in a short time; if the time interval is too long, the statistical results cannot describe the time distribution characteristics of the station population in detail.
步骤130:将各站点的站点人数按时间顺序进行排列,获得各站点人数时间序列数据。Step 130: Arrange the number of people at each site in chronological order to obtain time-series data of the number of people at each site.
记自然数n表示某个站点的编号,自然数i代表站点人数时间序列数据中的第i个数据点的索引值。相应地,自然数i也用于指示第i个时间区间。对站点n,记第i个时间区间内的人数为

步骤140:按照以下公式(二次加权二阶差分公式),对各站点人数时间序列数据进行重采样,得到对应的采样结果:Step 140: Resampling the time-series data of the number of people at each site according to the following formula (quadratic weighted second-order difference formula) to obtain the corresponding sampling result:

其中,


通过对各站点人数时间序列数据进行重采样,从而增加时间维度上的分辨率。由于只有S个时间区间的人数统计数据,对于i=S-1情形,可将


在上述公式中,采用三个点


步骤150:将各站点人数时间序列数据重采样后的采样结果组合得到站点行向量x(n):Step 150: Combine the sampling results after resampling the time series data of the number of people at each site to obtain the site row vector x(n) :

其中,S为连续时间区间的总个数。Among them, S is the total number of continuous time intervals.
步骤160:按站点序号将对应于各站点的站点行向量组合,得到行数为N、列数为p(S-1)+1的公共交通站点人数矩阵X:Step 160: Combine the station row vectors corresponding to each station according to the station serial number to obtain a public transport station population matrix X with the number of rows N and the number of columns p(S-1)+1:

其中,上标T表示向量或矩阵转置。where the superscript T represents the vector or matrix transpose.
在步骤200中,根据以下公式构建站点特征向量v(n):In
v(n)=(x(n),sn,tn)T,n=1,2,…,N,v(n) =(x(n) ,sn,tn )T ,n=1,2,...,N,
其中,x(n)表示对第n个公共交通站点人数统计结果重采样结果,sn和tn分别为第n个公共交通站点所在地理位置的经度和纬度,n为公共交通站点的序号,N表示公共交通站点的总数,上标T表示向量转置。则第n个站点的特征向量v(n)是一个长度为p(S-1)+3列向量。Among them, x(n) represents the resampling result of the population statistics of the nth public transportation station, sn and tn are the longitude and latitude of the geographical location of the nth public transportation station, respectively, n is the serial number of the public transportation station, N denotes the total number of public transport stops, and the superscript T denotes the vector transpose. Then the feature vector v(n) of the nth station is a column vector of length p(S-1)+3.
在步骤300中,根据所述特征向量对公共交通站点进行层次聚类,并根据聚类结果从各站点中确定监测站点,具体包括:In
步骤310:根据站点特征向量对站点进行自底向上的分层聚类;Step 310: perform bottom-up hierarchical clustering on the site according to the site feature vector;
步骤320:根据分层聚类的结果自顶向下地选择监测站点。Step 320: Select monitoring sites from top to bottom according to the results of hierarchical clustering.
进一步地,在步骤310中,所述根据站点特征向量对站点进行自底向上的分层聚类,具体包括:Further, in step 310, the bottom-up hierarchical clustering of the sites according to the site feature vector specifically includes:
步骤311:将每个站点作为单独的一个类别,共N个类别。Step 311: Treat each site as a separate category, with a total of N categories.
步骤312:根据以下公式(加权欧式距离计算公式),计算类与类之间的距离,将距离最近的两个类合并为一类,如此循环直至所有的站点归为一类:Step 312: Calculate the distance between classes according to the following formula (weighted Euclidean distance calculation formula), merge the two classes with the closest distances into one class, and repeat this until all sites are classified into one class:


其中,聚类步数索引值D(u(a),u(b))表示第a类和第b类之间的距离,向量u(a)表示第a类的聚类中心,向量u(b)表示第b类的聚类中心,

具体地,将每个站点作为单独的一个类别,此时共有N个类别,然后根据特征向量计算类与类之间的距离,将距离最近的两个类合并为一类;如此循环下去。在第c步时,采用采用加权欧式距离计算方法计算当前N-c+1个类之间的距离D(u(a),u(b)),将距离最近的两个类别合为一类,直至所有的站点归为一类。这里,c为自然数,表示聚类步数索引值。Specifically, each site is regarded as a separate category, and there are a total of N categories at this time, and then the distance between the categories is calculated according to the feature vector, and the two categories with the closest distance are merged into one category; and so on. In step c, the weighted Euclidean distance calculation method is used to calculate the distance D(u(a) , u(b) ) between the current N-c+1 classes, and the two classes with the closest distance are combined into one class , until all sites are grouped together. Here, c is a natural number and represents the index value of the number of clustering steps.
步骤320中,根据分层聚类的结果自顶向下地选择监测站点,具体包括:In step 320, the monitoring sites are selected top-down according to the result of hierarchical clustering, which specifically includes:
首先在顶层聚类结果中选择一个与聚类中心距离最近的站点作为第一个监测站点;接着,在下一层聚类结果中分别在各个类别中选择一个与各自聚类中心最近的站点作为新的监测站点;如此循环下去,直至选择的监测站点个数占总站点数的比例达到阈值β。First, in the top-level clustering results, select a station closest to the cluster center as the first monitoring station; then, in the next-level clustering results, select a station closest to the respective cluster center in each category as the new monitoring station. The number of selected monitoring sites in the total number of sites reaches the threshold β.
在本实施例中,监测站点个数占总站点数的比例阈值β设定为0.1。各监测站点的特征向量是与该站点所属类别的聚类中心最近的样本点,因此这些监测站点具有代表性,数量可以相对较少。另外,选择一个如此小的比例阈值的另一个原因在于可以减少监测站点的个数,节省大量的观测成本。In this embodiment, the ratio threshold β of the number of monitoring stations to the total number of stations is set to 0.1. The feature vector of each monitoring site is the sample point closest to the cluster center of the category to which the site belongs, so these monitoring sites are representative and the number can be relatively small. In addition, another reason for choosing such a small ratio threshold is that it can reduce the number of monitoring sites and save a lot of observation costs.
在步骤400中,采用客流统计摄像机、公共交通客流统计器等计算机设备、或城市公交一卡通等方法统计在给定的预测时段内所有监测站点处的站点人数。相对于所有站点而言,监测站点个数较少且能在一定程度上代表全体站点,在监测站点处设置客流统计设备,既能获取监测站点处的统计数据,又能将观测成本控制在可接受的范围内,具备可行性与实用性。In
然后,在给定的预测时段内,根据统计得到的进出站数据构造站点人数向量。记给定的预测时段的站点人数向量为y,并按如下方式进行计算:Then, in a given forecast period, the station population vector is constructed according to the statistics of inbound and outbound data. Denote the station headcount vector for a given forecast period as y, and calculate it as follows:
y=(y1,y2,…,yM)T;y=(y1 , y2 ,...,yM )T ;
其中,y1,y2,yM分别为测试时间内第1个监测站点,第2个监测站点以及第M个监测站点处统计得到的进出站数。这里,自然数M为监测站点个数。Among them, y1 , y2 , and yM are the number of inbound and outbound stations obtained from the statistics of the first monitoring site, the second monitoring site and the Mth monitoring site during the test time, respectively. Here, the natural number M is the number of monitoring sites.
需要指出的是,在具体实施过程中,给定的预测时段可以与步骤100中训练时段内的各个时间区间不一致。It should be pointed out that, in the specific implementation process, the given prediction period may be inconsistent with each time interval in the training period in
在步骤500中,根据所述公共交通站点人数矩阵及预测时段内的监测站点人数向量,建立基于非负约束的稀疏岭回归模型,具体包括:In
步骤510:构建训练时段公共交通站点人数矩阵X的站点序号m与预测时段监测站点序号n的映射函数g(n):Step 510: Build a mapping function g(n) between the station serial number m of the public transport station population matrix X in the training period and the monitoring station serial number n in the prediction period:
g(n)=m,n=1,2,…,M;g(n)=m, n=1,2,...,M;
其中,g(n)=m表示预测时段内的监测站点人数向量y的第n个元素yn所代表的监测站点是训练时段站点人数矩阵X的第m行所表示的站点;M为监测站点的个数。Among them, g(n)=m indicates that the monitoring site represented by the nth element yn of the monitoring site population vector y in the prediction period is the site represented by the mth row of the site population matrix X during the training period; M is the monitoring site number of.
步骤520:根据所述映射函数g(n)及公共交通站点人数矩阵X,获取训练时段在第s个时间区间上所有站点的统计向量xs:Step 520: According to the mapping function g(n) and the population matrix X of public transportation stations, obtain the statistical vector xs of all stations in the s-th time interval during the training period:

其中,
步骤530:基于监测站点人数向量y及统计向量xs构建基于非负约束的稀疏岭回归模型:Step 530: Construct a non-negative constraint-based sparse ridge regression model based on the monitoring site population vector y and the statistical vector xs :

其中,αs,s=1,2,…,p(S-1)+1,表示预测时段内的各监测站点的站点人数与训练时段各站点的站点人数之间的时间相似度系数,为待求解变量;
在本实施例中,正则化参数γ和λ设定为1.0。在这里设定一个适中的正则化参数是为了综合考虑站点人数的时间相似度系数的拟合误差、泛化性与稀疏性。In this embodiment, the regularization parameters γ and λ are set to 1.0. A moderate regularization parameter is set here to comprehensively consider the fitting error, generalization and sparsity of the temporal similarity coefficient of site population.
此处对上述最小化模型作进一步的解释。该最小化模型的目标函数由三项构成。目标函数的第一项由预测时间监测站点统计的人数与训练时段监测站点人数在时间轴上的线性加权求和之间的误差平方和构成。在目标函数最小化意义下,该项的含义可理解为预测时间监测站点的统计数据能够用训练时段监测站点统计数据进行线性加权来表示,权重为预测时间与训练时段的站点相似度。目标函数的第二项是相似度的平方和,该项的含义可以解释为待求解的时间相似度系数在允许的范围应当尽量小,以提高时间相似度系数的泛化性。将目标函数的前两项相结合,就是经典的岭回归模型。目标函数的第三项是时间相似度系数的一范数,该项的含义可解释如下:在求解时间相似度系数时,极小化该项的目标的希望当前预测人数只与少数训练时段有较高的相似度,而与其它训练时段的相似度为0。比如,某天上午8点的交通状态应该与过去一段时间每天上午8点的交通状态相关性很大,而与其他时刻的交通状态关系不大。由于在最小化变量的一范数时会导致稀疏的求解结果,因此目标函数中加入对时间相似度系数的一范数项。另外,时间相似度系数应当大于等于零,因此模型中需要对时间相似度系数加入非负约束。The above minimization model is further explained here. The objective function of this minimization model consists of three terms. The first term of the objective function consists of the sum of squared errors between the number of people counted at the monitoring site at the forecast time and the linearly weighted sum of the number of people at the monitoring site during the training period on the time axis. In the sense of objective function minimization, the meaning of this item can be understood as the statistical data of the monitoring stations at the forecast time can be represented by linear weighting of the statistical data of the monitoring stations during the training period, and the weight is the similarity of the stations between the forecast time and the training period. The second term of the objective function is the sum of the squares of the similarity. The meaning of this term can be interpreted as the temporal similarity coefficient to be solved should be as small as possible within the allowable range to improve the generalization of the temporal similarity coefficient. Combining the first two items of the objective function is the classic ridge regression model. The third term of the objective function is the one norm of the temporal similarity coefficient. The meaning of this term can be explained as follows: when solving the temporal similarity coefficient, the hope of minimizing the objective of this term is that the current number of predictions is only related to a few training periods. higher similarity, while the similarity with other training sessions is 0. For example, the traffic status at 8 am on a certain day should have a strong correlation with the traffic status at 8 am every day in the past period, but not much with the traffic status at other times. Since the one-norm of the variable is minimized, it will lead to sparse solution results, so a one-norm term for the temporal similarity coefficient is added to the objective function. In addition, the temporal similarity coefficient should be greater than or equal to zero, so a non-negative constraint needs to be added to the temporal similarity coefficient in the model.
上述最小化模型一共包含p(S-1)+1个需要优化的变量(即αs,s=1,2,…,p(S-1)+1)。将目标函数的平方项展开后发现,该目标函数是二次连续非光滑凸函数,有全局最优解。目标函数的前两项是光滑函数,后一项是非光滑凸函数。因此,可采用数学优化中现有的凸规划算法获得全局最优解。The above-mentioned minimization model includes p(S-1)+1 variables to be optimized (ie αs , s=1, 2, . . . , p(S-1)+1). After expanding the square term of the objective function, it is found that the objective function is a quadratic continuous non-smooth convex function with a global optimal solution. The first two terms of the objective function are smooth functions, and the latter terms are non-smooth convex functions. Therefore, the existing convex programming algorithm in mathematical optimization can be used to obtain the global optimal solution.
最后,在求解上述模型获得相似度系数αs,s=1,2,…,p(S-1)+1,之后,将作为预测时段监测站点的站点人数与训练时段监测站点的站点人数之间的时间相似度系数进行使用。Finally, after solving the above model to obtain the similarity coefficient αs , s=1,2,...,p(S-1)+1, it will be used as the sum of the number of sites at the monitoring site during the prediction period and the number of sites at the monitoring site during the training period The temporal similarity coefficient between them is used.
在步骤600中,基于所述公共交通站点人数矩阵,根据所述时间相似度系数,预测所有站点的站点预测人数,具体包括:In
步骤610:将时间相似度系数按照时间顺序排列,得到时间相似度系数向量α:Step 610: Arrange the temporal similarity coefficients in chronological order to obtain a temporal similarity coefficient vector α:
α=[α1,α2,…,αp(S-1)+1]T;α=[α1 ,α2 ,...,αp(S-1)+1 ]T ;
其中,α1,α2,…,αp(S-1)+1分别为预测时段内的各监测站点的站点人数与训练时段各站点的站点人数之间的时间相似度系数,自然数S为连续时间区间的总个数,p为重采样过程的时间采样率,上标T表示向量或矩阵转置。Among them, α1 , α2 ,...,αp(S-1)+1 are the time similarity coefficients between the number of people at each monitoring site in the prediction period and the number of people at each site in the training period, and the natural number S is The total number of continuous time intervals, p is the time sampling rate of the resampling process, and the superscript T represents the vector or matrix transpose.
步骤620:根据公共交通站点人数矩阵X与时间相似度系数向量α,得到预测时段内所有站点的预测人数向量Y:Step 620: According to the public transport station population matrix X and the time similarity coefficient vector α, obtain the predicted population vector Y of all stations within the prediction period:
Y=Xα。Y=Xα.
步骤630:根据预测时段内所有站点的预测人数向量Y,确定所有站点的站点预测人数。Step 630: Determine the site predicted number of people at all sites according to the predicted population vector Y of all sites in the prediction period.
根据预测时段所有站点的预测人数向量Y确定的所有站点的站点预测人数,既包含了监测站点的预测人数,也包含了非监测站点的预测人数。The predicted number of people at all sites determined according to the predicted number of people at all sites during the forecast period, includes both the predicted number of people at monitoring sites and the predicted number of people at non-monitored sites.
其中,在步骤400、步骤500与步骤600中,只统计了一个给定的预测时间区间内的各监测站点的人数统计,并且仅预测了该给定时间区间的所有站点的站点人数。在实际应用时,可以给定多个预测时间区间。对于多个预测时间区间情形,对每一个给定的预测时间区间,重复步骤400、步骤500与步骤600,从而完成多个预测时间区间内的站点人数预测。采用以上同时多个预测时间区间的方式即可获得长时间的站点人数预测。Among them, in
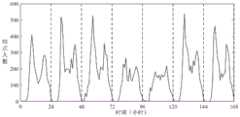
下面说明本发明的预测效果。为了验证本发明的有效性,用北京市公交为例进行实验。该实验在一个月公交上下站记录数据集上进行,并以第一周作为训练时段,后三周作为预测时段。图2是某一个非监测站点在训练时段内,重采样之前的站点人数随时间变化的曲线图,可以发现站点人数在时间维度上具有强烈的周期性。Next, the prediction effect of the present invention will be described. In order to verify the effectiveness of the present invention, an experiment is carried out with Beijing public transportation as an example. The experiment was carried out on a one-month bus stop record data set, and the first week was used as the training period, and the last three weeks were used as the prediction period. Figure 2 is a graph showing the change of the number of people at a non-monitored site over time before resampling during the training period. It can be found that the number of people at the site has a strong periodicity in the time dimension.
图3是三个星期的预测时段内该站点的实际站点人数与预测站点人数的对比图。实线是代表真实的站点人数,虚线是本发明的预测人数,由于时间轴的维度过长,为使预测结果的展示更为清晰,依次画出预测时间内每周的预测结果。图3的实验结果表明,本发明的预测人数与真实人数较为接近,预测效果良好,在长时预测任务中仍能保持较高的预测准确率。图3所示仅展示了某一个非监测站点的预测结果,实际上本发明也能用于城市公共交通的全部站点人数的预测问题。Figure 3 is a comparison of the actual and predicted site population at the site during the three-week forecast period. The solid line represents the actual number of people at the site, and the dotted line is the predicted number of people in the present invention. Since the dimension of the time axis is too long, in order to make the display of the prediction results clearer, the weekly prediction results within the prediction time are drawn in turn. The experimental results in FIG. 3 show that the predicted number of people in the present invention is relatively close to the real number of people, the prediction effect is good, and a high prediction accuracy can still be maintained in long-term prediction tasks. Figure 3 only shows the prediction result of a certain non-monitoring station, in fact, the present invention can also be used for the prediction of the number of people in all stations of urban public transportation.
进一步地,本发明还提供一种城市公共交通站点人数的预测系统,可提高长时段预测的精度。Further, the present invention also provides a system for predicting the number of people in urban public transport stations, which can improve the accuracy of long-term prediction.
如图4所示,本发明城市公共交通站点人数的预测系统包括历史数据统计单元1、特征向量构建单元2、分层聚类单元3、人数向量构建单元4、模型建立单元5及人数预测单元6。As shown in FIG. 4 , the system for predicting the number of people at urban public transport stations of the present invention includes a historical
具体地,所述历史数据统计单元1用于统计在训练时段内待测城市公共交通所有站点各时间区间内的站点人数,构建在训练时段内的公共交通站点人数矩阵;Specifically, the historical data
所述特征向量构建单元2用于根据所述公共交通站点人数矩阵,构建站点特征向量;Described
所述分层聚类单元3用于根据所述站点特征向量对公共交通站点进行层次聚类,并根据聚类结果从各站点中确定监测站点;The
所述人数向量构建单元4用于统计在预测时段内各监测站点的站点人数,构建预测时段内的监测站点人数向量;Described headcount vector construction unit 4 is used for counting the station headcount of each monitoring site in the forecast period, and constructs the monitoring site headcount vector within the forecast period;
所述模型建立单元5用于根据所述公共交通站点人数矩阵及预测时段内的监测站点人数向量,建立基于非负约束的稀疏岭回归模型,以确定预测时段内的各监测站点的站点人数与训练时段各站点的站点人数之间的时间相似度系数;The
所述人数预测单元6用于基于所述公共交通站点人数矩阵,根据所述时间相似度系数,预测所有站点的站点预测人数。The number of
此外,本发明还提供了一种城市公共交通站点人数的预测系统,包括:In addition, the present invention also provides a system for predicting the number of people at urban public transport stations, including:
处理器;以及processor; and
被安排成存储计算机可执行指令的存储器,所述可执行指令在被执行时使所述处理器执行以下操作:memory arranged to store computer-executable instructions which, when executed, cause the processor to:
统计在训练时段内待测城市公共交通所有站点各时间区间内的站点人数,构建在训练时段内的公共交通站点人数矩阵;Count the number of people in each time interval of all public transport stations in the city to be tested during the training period, and build a matrix of the number of public transport stations within the training period;
根据所述公共交通站点人数矩阵,构建站点特征向量;According to the public transport station population matrix, construct a station feature vector;
根据所述站点特征向量对公共交通站点进行层次聚类,并根据聚类结果从各站点中确定监测站点;Perform hierarchical clustering on public transport stations according to the station feature vector, and determine monitoring stations from each station according to the clustering result;
统计在预测时段内各监测站点的站点人数,构建预测时段内的监测站点人数向量;Count the number of people at each monitoring site during the forecast period, and construct a vector of people at the monitoring sites within the forecast period;
根据所述公共交通站点人数矩阵及预测时段内的监测站点人数向量,建立基于非负约束的稀疏岭回归模型,以确定预测时段内的各监测站点的站点人数与训练时段各站点的站点人数之间的时间相似度系数;According to the public transport station population matrix and the monitoring site population vector within the forecast period, a sparse ridge regression model based on non-negative constraints is established to determine the difference between the site population of each monitoring site during the forecast period and the site population of each site during the training period time similarity coefficient between
基于所述公共交通站点人数矩阵,根据所述时间相似度系数,预测所有站点的站点预测人数。Based on the public transportation station population matrix, and according to the temporal similarity coefficient, the predicted station population of all stations is predicted.
本发明还提供了一种计算机可读存储介质,所述计算机可读存储介质存储一个或多个程序,所述一个或多个程序当被包括多个应用程序的电子设备执行时,使得所述电子设备执行以下操作:The present invention also provides a computer-readable storage medium storing one or more programs that, when executed by an electronic device including a plurality of application programs, cause the The electronic device does the following:
统计在训练时段内待测城市公共交通所有站点各时间区间内的站点人数,构建在训练时段内的公共交通站点人数矩阵;Count the number of people in each time interval of all public transport stations in the city to be tested during the training period, and build a matrix of the number of public transport stations within the training period;
根据所述公共交通站点人数矩阵,构建站点特征向量;According to the public transport station population matrix, construct a station feature vector;
根据所述站点特征向量对公共交通站点进行层次聚类,并根据聚类结果从各站点中确定监测站点;Perform hierarchical clustering on public transport stations according to the station feature vector, and determine monitoring stations from each station according to the clustering result;
统计在预测时段内各监测站点的站点人数,构建预测时段内的监测站点人数向量;Count the number of people at each monitoring site during the forecast period, and construct a vector of people at the monitoring sites within the forecast period;
根据所述公共交通站点人数矩阵及预测时段内的监测站点人数向量,建立基于非负约束的稀疏岭回归模型,以确定预测时段内的各监测站点的站点人数与训练时段各站点的站点人数之间的时间相似度系数;According to the public transport station population matrix and the monitoring site population vector within the forecast period, a sparse ridge regression model based on non-negative constraints is established to determine the difference between the site population of each monitoring site during the forecast period and the site population of each site during the training period time similarity coefficient between
基于所述公共交通站点人数矩阵,根据所述时间相似度系数,预测所有站点的站点预测人数。Based on the public transportation station population matrix, and according to the temporal similarity coefficient, the predicted station population of all stations is predicted.
相对于现有技术,本发明城市公共交通站点人数的预测系统、计算机可读存储介质与上述城市公共交通站点人数的预测方法的有益效果相同,在此不再赘述。Compared with the prior art, the system and computer-readable storage medium of the present invention have the same beneficial effects as the above-mentioned method for predicting the number of people in urban public transport stations, and will not be repeated here.
至此,已经结合附图所示的优选实施方式描述了本发明的技术方案,但是,本领域技术人员容易理解的是,本发明的保护范围显然不局限于这些具体实施方式。在不偏离本发明的原理的前提下,本领域技术人员可以对相关技术特征作出等同的更改或替换,这些更改或替换之后的技术方案都将落入本发明的保护范围之内。So far, the technical solutions of the present invention have been described with reference to the preferred embodiments shown in the accompanying drawings, however, those skilled in the art can easily understand that the protection scope of the present invention is obviously not limited to these specific embodiments. Without departing from the principle of the present invention, those skilled in the art can make equivalent changes or substitutions to the relevant technical features, and the technical solutions after these changes or substitutions will fall within the protection scope of the present invention.
Claims (10)


Priority Applications (1)
| Application Number | Priority Date | Filing Date | Title |
|---|---|---|---|
| CN202010940563.4ACN111985731B (en) | 2020-09-09 | 2020-09-09 | Prediction method and system for the number of people at urban public transport stations |
Applications Claiming Priority (1)
| Application Number | Priority Date | Filing Date | Title |
|---|---|---|---|
| CN202010940563.4ACN111985731B (en) | 2020-09-09 | 2020-09-09 | Prediction method and system for the number of people at urban public transport stations |
Publications (2)
| Publication Number | Publication Date |
|---|---|
| CN111985731Atrue CN111985731A (en) | 2020-11-24 |
| CN111985731B CN111985731B (en) | 2021-09-07 |
Family
ID=73450240
Family Applications (1)
| Application Number | Title | Priority Date | Filing Date |
|---|---|---|---|
| CN202010940563.4AActiveCN111985731B (en) | 2020-09-09 | 2020-09-09 | Prediction method and system for the number of people at urban public transport stations |
Country Status (1)
| Country | Link |
|---|---|
| CN (1) | CN111985731B (en) |
Cited By (4)
| Publication number | Priority date | Publication date | Assignee | Title |
|---|---|---|---|---|
| CN113034889A (en)* | 2021-03-15 | 2021-06-25 | 重庆交通开投科技发展有限公司 | Round time calculation method based on public traffic network and GPS data |
| CN114463978A (en)* | 2022-02-10 | 2022-05-10 | 深圳明弘电子科技有限公司 | Data monitoring method based on rail transit information processing terminal |
| CN116630705A (en)* | 2023-05-24 | 2023-08-22 | 东北大学 | A large-sample two-dimensional image dataset construction method for VOC responses |
| CN119395629A (en)* | 2024-12-31 | 2025-02-07 | 成都华日通讯技术股份有限公司 | Method, device, equipment and medium for locating electromagnetic radiation source based on fusion information |
Citations (6)
| Publication number | Priority date | Publication date | Assignee | Title |
|---|---|---|---|---|
| US20120278130A1 (en)* | 2011-04-28 | 2012-11-01 | Empire Technology Development Llc | Mobile traffic forecasting using public transportation information |
| CN107045673A (en)* | 2017-03-31 | 2017-08-15 | 杭州电子科技大学 | Public bicycles changes in flow rate amount Forecasting Methodology based on heap Model Fusion |
| CN108417038A (en)* | 2018-05-09 | 2018-08-17 | 华中科技大学鄂州工业技术研究院 | Method and system for predicting bus passenger flow |
| CN109919358A (en)* | 2019-01-31 | 2019-06-21 | 中国科学院软件研究所 | A real-time site traffic prediction method based on neural network spatiotemporal attention mechanism |
| CN109933040A (en)* | 2017-12-18 | 2019-06-25 | 中国科学院沈阳自动化研究所 | A fault monitoring method based on hierarchical density peak clustering and the most similar mode |
| CN110222873A (en)* | 2019-05-14 | 2019-09-10 | 重庆邮电大学 | A kind of subway station passenger flow forecast method based on big data |
- 2020
- 2020-09-09CNCN202010940563.4Apatent/CN111985731B/enactiveActive
Patent Citations (6)
| Publication number | Priority date | Publication date | Assignee | Title |
|---|---|---|---|---|
| US20120278130A1 (en)* | 2011-04-28 | 2012-11-01 | Empire Technology Development Llc | Mobile traffic forecasting using public transportation information |
| CN107045673A (en)* | 2017-03-31 | 2017-08-15 | 杭州电子科技大学 | Public bicycles changes in flow rate amount Forecasting Methodology based on heap Model Fusion |
| CN109933040A (en)* | 2017-12-18 | 2019-06-25 | 中国科学院沈阳自动化研究所 | A fault monitoring method based on hierarchical density peak clustering and the most similar mode |
| CN108417038A (en)* | 2018-05-09 | 2018-08-17 | 华中科技大学鄂州工业技术研究院 | Method and system for predicting bus passenger flow |
| CN109919358A (en)* | 2019-01-31 | 2019-06-21 | 中国科学院软件研究所 | A real-time site traffic prediction method based on neural network spatiotemporal attention mechanism |
| CN110222873A (en)* | 2019-05-14 | 2019-09-10 | 重庆邮电大学 | A kind of subway station passenger flow forecast method based on big data |
Non-Patent Citations (2)
| Title |
|---|
| YANG NING 等: "ST-DRN: Deep Residual Networks for Spatio-Temporal Metro Stations Crowd Flows Forecast", 《2018 INTERNATIONAL JOINT CONFERENCE ON NEURAL NETWORKS (IJCNN)》* |
| 张和杰: "地铁客流监测系统关键技术研究及应用", 《中国优秀硕士学位论文全文数据库 基础科学辑》* |
Cited By (5)
| Publication number | Priority date | Publication date | Assignee | Title |
|---|---|---|---|---|
| CN113034889A (en)* | 2021-03-15 | 2021-06-25 | 重庆交通开投科技发展有限公司 | Round time calculation method based on public traffic network and GPS data |
| CN114463978A (en)* | 2022-02-10 | 2022-05-10 | 深圳明弘电子科技有限公司 | Data monitoring method based on rail transit information processing terminal |
| CN114463978B (en)* | 2022-02-10 | 2024-03-29 | 深圳明弘电子科技有限公司 | Data monitoring method based on track traffic information processing terminal |
| CN116630705A (en)* | 2023-05-24 | 2023-08-22 | 东北大学 | A large-sample two-dimensional image dataset construction method for VOC responses |
| CN119395629A (en)* | 2024-12-31 | 2025-02-07 | 成都华日通讯技术股份有限公司 | Method, device, equipment and medium for locating electromagnetic radiation source based on fusion information |
Also Published As
| Publication number | Publication date |
|---|---|
| CN111985731B (en) | 2021-09-07 |
Similar Documents
| Publication | Publication Date | Title |
|---|---|---|
| CN110570651B (en) | Road network traffic situation prediction method and system based on deep learning | |
| CN111985731B (en) | Prediction method and system for the number of people at urban public transport stations | |
| CN112330215B (en) | Urban vehicle demand prediction method, equipment and storage medium | |
| CN113591380B (en) | Traffic flow prediction method, medium and equipment based on graph Gaussian process | |
| CN110599236A (en) | Short-time parking demand prediction method based on GRU model | |
| CN108648445B (en) | Dynamic traffic situation prediction method based on traffic big data | |
| CN114692984A (en) | Traffic prediction method based on multi-step coupling graph convolution network | |
| CN114118508B (en) | A method for predicting air passenger flow in OD market based on spatiotemporal convolutional network | |
| CN117436653A (en) | Prediction model construction method and prediction method for travel demands of network about vehicles | |
| CN111242395A (en) | Method and device for constructing prediction model for OD (origin-destination) data | |
| CN118587893B (en) | Urban traffic flow prediction method based on dynamic adaptive convolutional neural network | |
| CN119047618A (en) | Traffic prediction method based on dynamic causal analysis and space-time self-adaptive fusion map learning | |
| CN113362637A (en) | Regional multi-field-point vacant parking space prediction method and system | |
| CN117829375B (en) | Method, device, equipment and medium for predicting multi-region demand of inter-city shuttle passenger transport | |
| Yang et al. | Short-term prediction of airway congestion index using machine learning methods | |
| Arjona et al. | A deep learning approach to real-time parking availability prediction for smart cities | |
| CN113674524A (en) | Multi-scale short-term traffic flow prediction modeling, prediction method and system based on LSTM-GASVR | |
| Rahman et al. | Attention based deep hybrid networks for traffic flow prediction using google maps data | |
| CN120299242A (en) | Intelligent traffic flow statistics and prediction platform based on multi-source data fusion | |
| CN118297129A (en) | Model training method, device and driving behavior prediction method | |
| CN118313638B (en) | Method, device, equipment and medium for predicting long-term travel demand of inter-city network about car based on SRFE-BLP-converter | |
| CN114139984A (en) | Risk prediction method of urban traffic accident based on collaborative perception of traffic flow and accident | |
| Wu et al. | A novel dynamically adjusted regressor chain for taxi demand prediction | |
| Slimani et al. | Road traffic forecasting using a real data set in Morocco | |
| CN118411849A (en) | Parking lot advanced prediction method based on multi-source information fusion |
Legal Events
| Date | Code | Title | Description |
|---|---|---|---|
| PB01 | Publication | ||
| PB01 | Publication | ||
| SE01 | Entry into force of request for substantive examination | ||
| SE01 | Entry into force of request for substantive examination | ||
| GR01 | Patent grant | ||
| GR01 | Patent grant |