CN111803065A - Dangerous traffic scene identification method and system based on electroencephalogram data - Google Patents
Dangerous traffic scene identification method and system based on electroencephalogram dataDownload PDFInfo
- Publication number
- CN111803065A CN111803065ACN202010581608.3ACN202010581608ACN111803065ACN 111803065 ACN111803065 ACN 111803065ACN 202010581608 ACN202010581608 ACN 202010581608ACN 111803065 ACN111803065 ACN 111803065A
- Authority
- CN
- China
- Prior art keywords
- eeg
- spectral density
- power spectral
- driver
- index
- Prior art date
- Legal status (The legal status is an assumption and is not a legal conclusion. Google has not performed a legal analysis and makes no representation as to the accuracy of the status listed.)
- Granted
Links
Images


Classifications
- A—HUMAN NECESSITIES
- A61—MEDICAL OR VETERINARY SCIENCE; HYGIENE
- A61B—DIAGNOSIS; SURGERY; IDENTIFICATION
- A61B5/00—Measuring for diagnostic purposes; Identification of persons
- A61B5/16—Devices for psychotechnics; Testing reaction times ; Devices for evaluating the psychological state
- A61B5/165—Evaluating the state of mind, e.g. depression, anxiety
- A—HUMAN NECESSITIES
- A61—MEDICAL OR VETERINARY SCIENCE; HYGIENE
- A61B—DIAGNOSIS; SURGERY; IDENTIFICATION
- A61B5/00—Measuring for diagnostic purposes; Identification of persons
- A61B5/16—Devices for psychotechnics; Testing reaction times ; Devices for evaluating the psychological state
- A61B5/18—Devices for psychotechnics; Testing reaction times ; Devices for evaluating the psychological state for vehicle drivers or machine operators
- A—HUMAN NECESSITIES
- A61—MEDICAL OR VETERINARY SCIENCE; HYGIENE
- A61B—DIAGNOSIS; SURGERY; IDENTIFICATION
- A61B5/00—Measuring for diagnostic purposes; Identification of persons
- A61B5/72—Signal processing specially adapted for physiological signals or for diagnostic purposes
- A61B5/7203—Signal processing specially adapted for physiological signals or for diagnostic purposes for noise prevention, reduction or removal
- A—HUMAN NECESSITIES
- A61—MEDICAL OR VETERINARY SCIENCE; HYGIENE
- A61B—DIAGNOSIS; SURGERY; IDENTIFICATION
- A61B5/00—Measuring for diagnostic purposes; Identification of persons
- A61B5/72—Signal processing specially adapted for physiological signals or for diagnostic purposes
- A61B5/7225—Details of analogue processing, e.g. isolation amplifier, gain or sensitivity adjustment, filtering, baseline or drift compensation
- A—HUMAN NECESSITIES
- A61—MEDICAL OR VETERINARY SCIENCE; HYGIENE
- A61B—DIAGNOSIS; SURGERY; IDENTIFICATION
- A61B5/00—Measuring for diagnostic purposes; Identification of persons
- A61B5/72—Signal processing specially adapted for physiological signals or for diagnostic purposes
- A61B5/7235—Details of waveform analysis
- A61B5/725—Details of waveform analysis using specific filters therefor, e.g. Kalman or adaptive filters
- A—HUMAN NECESSITIES
- A61—MEDICAL OR VETERINARY SCIENCE; HYGIENE
- A61B—DIAGNOSIS; SURGERY; IDENTIFICATION
- A61B5/00—Measuring for diagnostic purposes; Identification of persons
- A61B5/74—Details of notification to user or communication with user or patient; User input means
- A61B5/746—Alarms related to a physiological condition, e.g. details of setting alarm thresholds or avoiding false alarms
- G—PHYSICS
- G06—COMPUTING OR CALCULATING; COUNTING
- G06F—ELECTRIC DIGITAL DATA PROCESSING
- G06F30/00—Computer-aided design [CAD]
- G06F30/20—Design optimisation, verification or simulation
- G—PHYSICS
- G06—COMPUTING OR CALCULATING; COUNTING
- G06Q—INFORMATION AND COMMUNICATION TECHNOLOGY [ICT] SPECIALLY ADAPTED FOR ADMINISTRATIVE, COMMERCIAL, FINANCIAL, MANAGERIAL OR SUPERVISORY PURPOSES; SYSTEMS OR METHODS SPECIALLY ADAPTED FOR ADMINISTRATIVE, COMMERCIAL, FINANCIAL, MANAGERIAL OR SUPERVISORY PURPOSES, NOT OTHERWISE PROVIDED FOR
- G06Q10/00—Administration; Management
- G06Q10/06—Resources, workflows, human or project management; Enterprise or organisation planning; Enterprise or organisation modelling
- G06Q10/063—Operations research, analysis or management
- G06Q10/0635—Risk analysis of enterprise or organisation activities
- G—PHYSICS
- G06—COMPUTING OR CALCULATING; COUNTING
- G06Q—INFORMATION AND COMMUNICATION TECHNOLOGY [ICT] SPECIALLY ADAPTED FOR ADMINISTRATIVE, COMMERCIAL, FINANCIAL, MANAGERIAL OR SUPERVISORY PURPOSES; SYSTEMS OR METHODS SPECIALLY ADAPTED FOR ADMINISTRATIVE, COMMERCIAL, FINANCIAL, MANAGERIAL OR SUPERVISORY PURPOSES, NOT OTHERWISE PROVIDED FOR
- G06Q10/00—Administration; Management
- G06Q10/06—Resources, workflows, human or project management; Enterprise or organisation planning; Enterprise or organisation modelling
- G06Q10/063—Operations research, analysis or management
- G06Q10/0639—Performance analysis of employees; Performance analysis of enterprise or organisation operations
- G06Q10/06393—Score-carding, benchmarking or key performance indicator [KPI] analysis
- G—PHYSICS
- G08—SIGNALLING
- G08G—TRAFFIC CONTROL SYSTEMS
- G08G1/00—Traffic control systems for road vehicles
- G08G1/01—Detecting movement of traffic to be counted or controlled
- G08G1/0104—Measuring and analyzing of parameters relative to traffic conditions
- G08G1/0125—Traffic data processing
- G—PHYSICS
- G08—SIGNALLING
- G08G—TRAFFIC CONTROL SYSTEMS
- G08G1/00—Traffic control systems for road vehicles
- G08G1/01—Detecting movement of traffic to be counted or controlled
- G08G1/0104—Measuring and analyzing of parameters relative to traffic conditions
- G08G1/0137—Measuring and analyzing of parameters relative to traffic conditions for specific applications
- G—PHYSICS
- G08—SIGNALLING
- G08G—TRAFFIC CONTROL SYSTEMS
- G08G1/00—Traffic control systems for road vehicles
- G08G1/16—Anti-collision systems
- G08G1/166—Anti-collision systems for active traffic, e.g. moving vehicles, pedestrians, bikes
- A—HUMAN NECESSITIES
- A61—MEDICAL OR VETERINARY SCIENCE; HYGIENE
- A61B—DIAGNOSIS; SURGERY; IDENTIFICATION
- A61B2503/00—Evaluating a particular growth phase or type of persons or animals
- A61B2503/20—Workers
- A61B2503/22—Motor vehicles operators, e.g. drivers, pilots, captains
Landscapes
- Health & Medical Sciences (AREA)
- Engineering & Computer Science (AREA)
- Life Sciences & Earth Sciences (AREA)
- Physics & Mathematics (AREA)
- Business, Economics & Management (AREA)
- Human Resources & Organizations (AREA)
- Surgery (AREA)
- Psychiatry (AREA)
- Medical Informatics (AREA)
- Public Health (AREA)
- General Health & Medical Sciences (AREA)
- Heart & Thoracic Surgery (AREA)
- Animal Behavior & Ethology (AREA)
- Biomedical Technology (AREA)
- Molecular Biology (AREA)
- General Physics & Mathematics (AREA)
- Pathology (AREA)
- Biophysics (AREA)
- Veterinary Medicine (AREA)
- Signal Processing (AREA)
- Physiology (AREA)
- Theoretical Computer Science (AREA)
- Economics (AREA)
- Entrepreneurship & Innovation (AREA)
- Strategic Management (AREA)
- Artificial Intelligence (AREA)
- Computer Vision & Pattern Recognition (AREA)
- Educational Administration (AREA)
- Development Economics (AREA)
- Quality & Reliability (AREA)
- General Business, Economics & Management (AREA)
- Tourism & Hospitality (AREA)
- Operations Research (AREA)
- Marketing (AREA)
- Game Theory and Decision Science (AREA)
- Child & Adolescent Psychology (AREA)
- Developmental Disabilities (AREA)
- Educational Technology (AREA)
- Hospice & Palliative Care (AREA)
- Psychology (AREA)
Abstract
Description
Translated fromChinese技术领域technical field
本发明涉及交通驾驶安全领域,尤其涉及一种基于脑电数据的危险 交通场景辨识方法及系统。The present invention relates to the field of traffic driving safety, in particular to a method and system for identifying dangerous traffic scenes based on EEG data.
背景技术Background technique
随着社会经济的快速发展,我国汽车保有量迅速的提高,道路建设 不断的推进,与此同时,交通场景日益丰富、道路交通参与者持续增长, 道路交通环境变得愈加复杂,交通安全事故发生量逐年增长。交通场景 的危险程度能够直接影响驾驶员的生理和心理状态,当驾驶员处于较为 危险的交通场景时,驾驶员所承受的精神负荷较大,容易使驾驶员出现 决策迟缓、操作错误的现象,极易引起交通事故。面对危险的道路交通 场景,科学度量交通场景危险程度、准确评估驾驶员精神负荷,采取合 理措施将驾驶员精神负荷控制在合理区间,降低驾驶风险,成为了重要 的问题。With the rapid development of society and economy, the number of automobiles in my country has increased rapidly, and road construction has continued to advance. At the same time, traffic scenarios have become increasingly abundant, road traffic participants have continued to grow, road traffic environment has become more complex, and traffic safety accidents have occurred. The volume increases year by year. The degree of danger of the traffic scene can directly affect the physiological and psychological state of the driver. When the driver is in a relatively dangerous traffic scene, the driver's mental load is relatively large, which is easy to make the driver's decision-making delay and operation error phenomenon. Very easy to cause traffic accidents. Faced with dangerous road traffic scenarios, it has become an important issue to scientifically measure the degree of danger of traffic scenarios, accurately assess the mental load of drivers, and take reasonable measures to control the mental load of drivers within a reasonable range to reduce driving risks.
交通场景危险程度的研究,不仅能有效的提升人类驾驶员的驾驶安 全,减少道路交通事故的发生率,而且还能为智能驾驶与车辆安全技术 的研究提供理论基础。The research on the degree of danger of traffic scenes can not only effectively improve the driving safety of human drivers and reduce the incidence of road traffic accidents, but also provide a theoretical basis for the research on intelligent driving and vehicle safety technology.
对自动驾驶车辆来讲,最终判断智能驾驶有什么样的功能、达到什 么性能、能否在日常的交通环境中驾驶,必须完成车辆的技术考核,考 核中很重要的一个环节就是交通场景的测试。因为无人驾驶车辆的算法 性能与交通场景危险程度之间存在负相关关系,难度过高的测试场景会 导致车辆环境认知和理解算法表现较差,无法准确的评估车辆性能,因 此场景难度将直接影响车辆的测试结果,他的研究对于智能车辆的评价 十分重要。然而,现有关于交通场景的危险程度识别的研究较为缺乏, 常用的研究的方法缺乏一定的客观性和量化性的数据支持。For autonomous vehicles, to finally judge what kind of functions intelligent driving has, what performance it can achieve, and whether it can drive in the daily traffic environment, the technical assessment of the vehicle must be completed. A very important part of the assessment is the test of traffic scenarios. . Because there is a negative correlation between the algorithm performance of unmanned vehicles and the degree of danger of the traffic scene, a test scene that is too difficult will lead to poor performance of the vehicle environment cognition and understanding algorithm, and it is impossible to accurately evaluate the vehicle performance. It directly affects the test results of the vehicle, and his research is very important for the evaluation of intelligent vehicles. However, the existing research on the identification of the danger level of traffic scenes is relatively lacking, and the commonly used research methods lack certain objective and quantitative data support.
现有研究交通场景危险程度的方法主要是选取与交通场景难度相关 的因素,将其作为评价指标,对他们进行定性、定量描述以实现对交通 场景危险程度的评价。选取的指标按其特点可分类为静态指标和动态指 标。静态指标主要包括相关专业人士的主观看法、对道路交通环境影响 较大的因素、道路交通事故数据。动态指标主要将反映车辆或驾驶员运 动状态的因素作为评价指标。静态指标或动态指标方法主要是从因素端 出发,即将影响交通场景危险程度的环境因素作为评价指标。而交通环 境危险程度的确定应该是基于驾驶员的意识和行为的,是动态变化的。 现有的这种研究方法未能从驾驶员视角定量、客观的定义和描述交通场 景危险程度。The existing methods of studying the danger degree of traffic scenes mainly select factors related to the difficulty of traffic scenes, take them as evaluation indicators, and describe them qualitatively and quantitatively to realize the evaluation of the degree of danger of traffic scenes. The selected indicators can be classified into static indicators and dynamic indicators according to their characteristics. Static indicators mainly include subjective opinions of relevant professionals, factors that have a greater impact on the road traffic environment, and road traffic accident data. The dynamic index mainly takes the factors reflecting the vehicle or driver's motion state as the evaluation index. The static index or dynamic index method mainly starts from the factor side, that is, the environmental factors that affect the dangerous degree of the traffic scene are used as the evaluation index. The determination of the degree of danger in the traffic environment should be based on the driver's awareness and behavior, and it is dynamic. The existing research methods fail to quantitatively and objectively define and describe the danger level of traffic scenarios from the driver's perspective.
发明内容SUMMARY OF THE INVENTION
为了解决上述技术问题,本发明的目的在于提供一种基于脑电数据 的危险交通场景辨识方法及系统。In order to solve the above technical problems, the purpose of the present invention is to provide a method and system for identifying dangerous traffic scenes based on EEG data.
根据本发明的一个方面,提供一种基于脑电数据的危险交通场景辨 识方法,包括以下步骤:According to an aspect of the present invention, there is provided a method for identifying dangerous traffic scenes based on EEG data, comprising the following steps:
基于交通场景,获取刺激对象和实验变量;Obtain stimulus objects and experimental variables based on traffic scenarios;
通过刺激对象和实验变量完成对驾驶员的驾驶测试,获取预设时 长内驾驶员包含脑电信号的EEG数据;Complete the driving test of the driver by stimulating objects and experimental variables, and obtain the EEG data of the driver including the EEG signal within a preset time period;
对采集到的脑电信号进行预处理,包括去除脑电信号中的信号噪 音;Preprocessing the collected EEG signals, including removing signal noise in the EEG signals;
对预处理后的脑电信号提取特征指标,并采用数理统计的方法分 析得到具有显著性的特征指标;Extract characteristic indexes from the preprocessed EEG signals, and use mathematical statistics to analyze to obtain significant characteristic indexes;
计算具有显著性的特征指标的功率谱密度的预测值与真值之间的 差值;Calculate the difference between the predicted value and the true value of the power spectral density of the significant feature index;
根据所述差值辨识交通场景的危险程度。The degree of danger of the traffic scene is identified according to the difference.
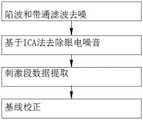
进一步的,对采集到的脑电信号进行预处理,去除脑电信号中的 信号噪音,包括陷波和带通滤波去噪、基于ICA法的眼电去噪、实验 变量刺激段数据提取、基线校正。Further, the collected EEG signals are preprocessed to remove signal noise in the EEG signals, including notch and band-pass filter denoising, EEG denoising based on ICA method, experimental variable stimulus segment data extraction, baseline Correction.
进一步的,对预处理后的脑电信号提取特征指标,包括:从EEG 数据提取出若干节律波的功率谱密度作为特征指标。Further, extracting characteristic indices from the preprocessed EEG signals includes: extracting power spectral density of several rhythmic waves from the EEG data as characteristic indices.
进一步的,采用数理统计的方法分析得到具有显著性的特征指标, 包括:Further, the method of mathematical statistics is used to analyze and obtain significant characteristic indicators, including:
提取全脑α波、β波、θ波、δ波,得到4个特征指标;Extract the whole brain alpha wave, beta wave, theta wave, delta wave, and get 4 characteristic indicators;
将脑通道按额叶、顶叶、枕叶和颞叶划分为四个脑区,分别对四 个脑区提取脑电δ波、θ波、α波和β波的功率谱密度,得到16个特 征指标;The brain channel is divided into four brain regions according to the frontal lobe, parietal lobe, occipital lobe and temporal lobe, and the power spectral density of EEG delta wave, theta wave, alpha wave and beta wave is extracted from the four brain regions, and 16 brain regions are obtained. characteristic index;
采用功率谱估计方法分析驾驶过程中驾驶员的脑电信号,The power spectrum estimation method was used to analyze the driver's EEG signal during driving,
其中,所述AR功率谱估计模型为:Wherein, the AR power spectrum estimation model is:

AR功率谱估计模型中的阶数p使用代价函数进行估计,-jtw为复 指数信号,AR功率谱估计模型的系数cpi和σ2使用Burg算法进行求取, 使AR模型前后项预测误差的功率之和为最小;The order p in the AR power spectrum estimation model is estimated using the cost function, -jtw is the complex exponential signal, and the coefficients cpi and σ2 of the AR power spectrum estimation model are calculated using the Burg algorithm, so that the prediction error of the front and rear items of the AR model is equal to The sum of power is the minimum;
采用正态性检验对采集到的特征指标的P(w)差异性进行检验分 析;The P(w) difference of the collected characteristic indexes was tested and analyzed by normality test;
对P(w)服从正态分布和方差齐性要求的特征指标进行单因素方差 分析,对P(w)不服从正态分布或不满足方差齐性要求的特征指标进行 非参数方差分析;One-way ANOVA is performed on the characteristic indexes whose P(w) obeys the normal distribution and variance homogeneity requirements, and nonparametric variance analysis is performed on the characteristic indexes whose P(w) does not obey the normal distribution or the variance homogeneity requirements;
确定P(w)小于预设值的特征指标为具有显著性的特征指标。It is determined that the feature index whose P(w) is less than the preset value is a significant feature index.
进一步的,计算具有显著性的特征指标的功率谱密度的预测值, 包括如下步骤:Further, calculating the predicted value of the power spectral density of the significant characteristic index includes the following steps:
将预设时长划分为n个时间窗口,时间窗口对应的具有显著性的 特征指标的功率谱密度的脑电信号数据为:The preset duration is divided into n time windows, and the EEG signal data of the power spectral density of the significant characteristic index corresponding to the time window is:
x(0)=(x(0)(1),x(0)(2),…,x(0)(n)),其中n是脑电信号数据的个数。x(0) =(x(0) (1),x(0) (2),…,x(0) (n)), where n is the number of EEG signal data.
原始数据一次累加生成序列为:The original data is accumulated once and the sequence is:
x(1)=(x(1)(1),x(1)(2),…,x(1)(n))x(1) =(x(1) (1),x(1) (2),…,x(1) (n))
其中:in:

基于x(1)建立GM(1,1)模型的一阶灰色微分方程:The first-order grey differential equation of the GM(1,1) model is established based on x(1) :

并用最小二乘法计算该方程的待辨识参数a和u。其中,a为发展 参数,u为灰色作用量。And use the least squares method to calculate the parameters to be identified a and u of the equation. Among them, a is the development parameter, and u is the gray action.
令a=(a,u)T,则由最小二乘法得到:Let a=(a,u)T , then it is obtained by the least squares method:
a=(BTB)-1BTYna=(BT B)-1 BT Yn
其中B和Yn和分别为:where B and Yn and respectively are:

Yn=(x(0)(2),x(0)(3),…,x(0)(n))TYn = (x(0) (2),x(0) (3),…,x(0) (n))T
由以上各式,解得一阶灰色微分方程为:From the above equations, the first-order gray differential equation is solved as:

因此得到预测值:So get the predicted value:

进一步的,计算具有显著性的特征指标的功率谱密度的预测值与 真值之间的差值:
其中,
进一步的,计算具有显著性的特征指标的功率谱密度的预测值与 真值之间的差值,还包括:对模型进行相对误差ε(t)检验和后验差C、P 进行检验:Further, calculating the difference between the predicted value and the true value of the power spectral density of the significant characteristic index, also includes: testing the relative error ε(t) of the model and testing the posterior differences C and P:


目的是去除具有显著性的特征指标的功率谱密度预测值不符合相 对误差检验和后验差检验的数据。The purpose is to remove the data for which the power spectral density prediction value of the significant characteristic index does not conform to the relative error test and the posterior difference test.
进一步的,根据所述差值辨识交通场景的危险程度,包括:Further, identifying the degree of danger of the traffic scene according to the difference includes:
根据所述差值,计算具有显著性的特征指标的功率谱密度的预测 值与真值之间的均值μ和标准差σ2;According to the difference, calculate the mean μ and the standard deviation σ2 between the predicted value of the power spectral density of the significant feature index and the true value;
通过灰色预测法得到的具有显著性的特征指标的功率谱密度的预 测值与实际值差值的正态分布特征(μ,σ2),交通因素危险度的指标 为:Complexityscene={μ具有显著性的特征指标,σ2具有显著性的特征指标},通过所述指标反应 交通场景的危险程度。The normal distribution characteristics (μ, σ2 ) of the difference between the predicted value of the power spectral density and the actual value of the significant feature index obtained by the gray prediction method, the index of the traffic factor risk is: Complexityscene = {μhas A significant characteristic index , σ2is a significant characteristic index }, through which the degree of danger of the traffic scene is reflected.
根据本发明的另一个方面,提供了一种基于脑电数据的危险交通场 景辨识系统,包括:According to another aspect of the present invention, there is provided a dangerous traffic scene recognition system based on EEG data, comprising:
第一数据获取模块,配置用于基于交通场景,获取刺激对象和实 验变量;a first data acquisition module, configured to acquire stimulus objects and experimental variables based on the traffic scene;
第二数据获取模块,配置用于通过刺激对象和实验变量完成对驾 驶员的驾驶测试时获取预设时长内驾驶员包含脑电信号的EEG数据;The second data acquisition module is configured to obtain the EEG data of the driver including the EEG signal in the preset time period when completing the driving test to the driver by stimulating the object and the experimental variable;
预处理模块,配置用于对采集到的脑电信号进行预处理,去除脑 电信号中的信号噪音;The preprocessing module is configured to preprocess the collected EEG signals to remove signal noise in the EEG signals;
特征指标提取分析模块,配置用于对预处理后的脑电信号,提取 特征指标,并采用数理统计的方法分析得到具有显著性的特征指标;The feature index extraction and analysis module is configured to extract the feature index from the preprocessed EEG signal, and use the method of mathematical statistics to analyze and obtain the significant feature index;
计算模块,配置用于计算具有显著性的特征指标的功率谱密度的 预测值与真值之间的差值;A calculation module, configured to calculate the difference between the predicted value and the true value of the power spectral density of the significant characteristic index;
危险程度辨识模块,根据配置用于根据所述差值辨识交通场景的 危险程度。The danger level identification module is configured to identify the danger level of the traffic scene according to the difference.
另外,本发明还提供一种设备,包括:In addition, the present invention also provides a device, comprising:
一个或多个处理器;one or more processors;
存储器,用于存储一个或多个程序,memory for storing one or more programs,
当所述一个或多个程序被所述一个或多个处理器执行时,使得所 述一个或多个处理器执行如上任一项所述的方法。The one or more programs, when executed by the one or more processors, cause the one or more processors to perform a method as described in any of the above.
根据本发明的另一个方面,提供了一种存储有计算机程序的计算机 可读存储介质,该程序被处理器执行时实现如上任一项所述的方法。According to another aspect of the present invention, there is provided a computer-readable storage medium storing a computer program, the program implementing the method according to any one of the above when executed by a processor.
与现有技术相比,本发明具有以下有益效果:Compared with the prior art, the present invention has the following beneficial effects:
1、本发明示例的基于脑电数据的危险交通场景辨识方法,从驾驶 员视角出发研究场景危险度,以不同的交通环境建立交通场景作为研 究对象,以驾驶员驾驶过程中的脑电数据作为量化、评价交通场景危 险度的指标,探索驾驶员脑电与交通环境因素间的内在关联,建立了 基于驾驶员脑电的交通环境危险度辨识模型。1. The method for identifying dangerous traffic scenes based on EEG data in the example of the present invention studies the risk degree of the scene from the perspective of the driver, establishes traffic scenes with different traffic environments as the research object, and uses the EEG data during the driver's driving process as the research object. To quantify and evaluate the indicators of the risk degree of traffic scenes, explore the internal relationship between the driver's EEG and traffic environment factors, and establish a traffic environment risk identification model based on the driver's EEG.
该方法从人类驾驶员的视角量化交通系统的危险程度,更为客观的 分析交通场景的危险程度,有针对性的分析交通环境中的交通因素(刺 激对象和实验变量),并判别交通环境的危险程度,可以科学的度量交 通场景危险程度、准确的评估驾驶员精神负荷,对驾驶员进行有效的 安全预警,有利于将驾驶员的精神负荷控制在合理区间,有效的降低驾驶风险。This method quantifies the degree of danger of the traffic system from the perspective of human drivers, analyzes the degree of danger of the traffic scene more objectively, analyzes the traffic factors (stimulus objects and experimental variables) in the traffic environment in a targeted manner, and discriminates the risk of the traffic environment. The degree of danger can scientifically measure the degree of danger of traffic scenes, accurately assess the mental load of drivers, and provide effective safety warnings to drivers, which is conducive to controlling the mental load of drivers within a reasonable range and effectively reducing driving risks.
2、本发明示例的基于脑电数据的危险交通场景辨识系统,根据交 通场景的刺激对象和实验变量,驾驶员脑电信号为量化评价交通场景危 险度的指标,探索驾驶员脑电与刺激对象和实验变量间的内在关联,建 立基于脑电信号的交通场景危险度辨识模型,选取能反应驾驶员精神负 荷的指标作为评价交通场景危险程度的指标,有利于将驾驶员的精神负 荷控制在合理区间,有效的降低驾驶风险。2. The dangerous traffic scene identification system based on EEG data of the example of the present invention, according to the stimulus objects and experimental variables of the traffic scene, the driver's EEG signal is an index for quantitatively evaluating the risk degree of the traffic scene, and the driver's EEG and stimulus objects are explored. The intrinsic correlation with experimental variables, establish a traffic scene risk identification model based on EEG signals, and select indicators that can reflect the driver's mental load as an indicator to evaluate the risk of traffic scenes, which is conducive to controlling the driver's mental load at a reasonable level. range, effectively reducing driving risks.
3、本发明中示例的设备,通过处理器执行基于脑电数据的危险交 通场景辨识方法,能够对驾驶员进行有效的安全预警,有利于将驾驶 员的精神负荷控制在合理区间,有效的降低驾驶风险。3. The device exemplified in the present invention, through the processor executing the method for identifying dangerous traffic scenes based on EEG data, can provide effective safety warning to the driver, which is beneficial to control the mental load of the driver in a reasonable range and effectively reduce the driving risk.
4、本发明中示例的可读存储介质,储存有被处理器执行时实现的所 述基于脑电数据的危险交通场景辨识方法,对驾驶员进行有效的安全 预警,有利于将驾驶员的精神负荷控制在合理区间,有效的降低驾驶 风险。4. The readable storage medium exemplified in the present invention stores the described method for identifying dangerous traffic scenes based on EEG data when executed by the processor, which provides an effective safety warning to the driver, which is conducive to improving the driver's spirit. The load is controlled in a reasonable range, effectively reducing the driving risk.
附图说明Description of drawings
图1为实验例1中不同危险度的行人过街场景示意图;Figure 1 is a schematic diagram of pedestrians crossing the street with different degrees of danger in Experimental Example 1;
图2为实验例1中脑电信号的预处理流程图;Fig. 2 is the preprocessing flow chart of EEG signal in Experimental Example 1;
图3为实验例1中某驾驶员脑电的32个IC分量与眼电信号相关性 图;Fig. 3 is the correlation diagram of 32 IC components of a driver's EEG and the EOG signal in Experimental Example 1;
图4为实验例1中某驾驶员脑电的某一通道去眼电前后的EEG信号 图;Fig. 4 is the EEG signal diagram of a certain channel of a driver's EEG before and after removing the EEG in Experimental Example 1;
图5为实验例1中某驾驶员脑电信号去基线漂移前后对比图;Figure 5 is a comparison diagram of a driver's EEG signal before and after the baseline drift in Experimental Example 1;
图6为实验例1中某驾驶员经过预处理前后的脑电波形对比图;Figure 6 is a comparison diagram of the EEG waveforms of a driver before and after preprocessing in Experimental Example 1;
图7为实验例1中某一驾驶员的全脑功率谱密度分布图;Fig. 7 is the whole-brain power spectral density distribution diagram of a certain driver in Experimental Example 1;
图8为实验例1中某驾驶员顶叶区α波功率谱密度的预测曲线;Fig. 8 is the prediction curve of the α-wave power spectral density in the parietal region of a certain driver in Experimental Example 1;
图9为实验例1中基于灰色预测法的差值计算示意图;9 is a schematic diagram of the difference calculation based on the gray prediction method in Experimental Example 1;
图10为实验例1中不同危险因素影响下的预测值与实际值差值概率 密度分布;Figure 10 is the probability density distribution of the difference between the predicted value and the actual value under the influence of different risk factors in Experimental Example 1;
图11为实施例2中行人过街危险场景中驾驶员的顶叶区α波功率谱 密度的差值分布图;Fig. 11 is the difference distribution diagram of the alpha wave power spectral density of the driver's parietal lobe region in the danger scene of pedestrian crossing the street in
图12为实施例2中车辆变速危险场景中驾驶员的顶叶区α波功率谱 密度的差值分布图;Fig. 12 is the difference distribution diagram of the alpha wave power spectral density of the driver's parietal lobe region in the vehicle speed change danger scene in the
图13为实施例2中车辆变道危险场景中驾驶员的顶叶区α波功率谱 密度的差值分布图;Fig. 13 is the difference distribution diagram of the alpha wave power spectral density of the driver's parietal lobe region in the dangerous scene of vehicle lane change in
图14为实施例2中三种危险因素的预测值与实际值差值概率密度分 布图;Figure 14 is the probability density distribution diagram of the difference between the predicted value and the actual value of the three risk factors in Example 2;
图15为本发明流程图;Fig. 15 is the flow chart of the present invention;
图16为本发明实施例1设备的结构示意图。FIG. 16 is a schematic structural diagram of a device in
具体实施方式Detailed ways
为了更好的了解本发明的技术方案,下面结合说明书附图和具体实 施例对本发明作进一步说明。In order to better understand the technical solutions of the present invention, the present invention will be further described below with reference to the accompanying drawings and specific embodiments of the description.
实施例1:Example 1:
本实施例提供一种基于脑电数据的危险交通场景辨识系统,包括:This embodiment provides a dangerous traffic scene identification system based on EEG data, including:
第一数据获取模块,配置用于基于交通场景,获取刺激对象和实 验变量;a first data acquisition module, configured to acquire stimulus objects and experimental variables based on the traffic scene;
第二数据获取模块,配置用于通过刺激对象和实验变量完成对驾 驶员的驾驶测试时获取预设时长内驾驶员包含脑电信号的EEG数据, 本实施例第二数据获取模块将脑通道分为32个独立通道。The second data acquisition module is configured to acquire the EEG data including the EEG signal of the driver within a preset time period when the driving test of the driver is completed by using the stimulation object and the experimental variable. The second data acquisition module in this embodiment divides the brain channels into for 32 independent channels.
预处理模块,配置用于对采集到的脑电信号进行预处理,去除脑 电信号中的信号噪音,具体的,预处理模块包括,The preprocessing module is configured to preprocess the collected EEG signal to remove signal noise in the EEG signal. Specifically, the preprocessing module includes:
陷波和带通滤波去噪单元,配置用于采用带宽为1-50Hz的带通 FIR滤波器去除高频噪音,保留1-50HZ的频带信号;Notch and band-pass filter denoising unit, configured to remove high-frequency noise with a band-pass FIR filter with a bandwidth of 1-50Hz, and retain the frequency band signal of 1-50Hz;
基于ICA法的眼电去噪单元,配置用于将脑电数据分解为32个独 立分量,然后计算各个独立分量与眼电之间的相关系数,去除相关系 数较大的若干独立分量,再将其余独立成分进行ICA逆运算重构去除 眼电噪音的脑电信号;The EOG denoising unit based on the ICA method is configured to decompose the EEG data into 32 independent components, then calculate the correlation coefficient between each independent component and the EOG, remove several independent components with large correlation coefficients, and then decompose the EEG data into 32 independent components. The remaining independent components are subjected to ICA inverse operation to reconstruct the EEG signal to remove the EEG noise;
实验变量刺激段数据提取单元,配置用于将脑电信号按实验变量 刺激段和非实验变量刺激段进行划分,将同类刺激诱发的脑电数据从 连续的脑电数据中提取出来,划分为若干段等长的实验变量刺激段, 以刺激出现的时间起点为零时刻,以时间窗为长度截取数据段。The experimental variable stimulation segment data extraction unit is configured to divide the EEG signal according to the experimental variable stimulation segment and the non-experimental variable stimulation segment, and extract the EEG data induced by the same type of stimulation from the continuous EEG data, and divide it into several The experimental variable stimulus segment with the same length, the data segment is intercepted with the time window as the length of the time point zero when the stimulus appears.
基线校正单元,配置用于将实验变量刺激段的所有脑电信号值与 零时刻的基础幅值逐一相减,得到新的平稳电位值。The baseline correction unit is configured to subtract all the EEG signal values of the experimental variable stimulation segment from the basal amplitude value at time zero one by one to obtain a new stable potential value.
特征指标提取分析模块,配置用于对预处理后的脑电信号,提取 特征指标,并采用数理统计的方法分析得到具有显著性的特征指标, 具体的,特征指标提取分析模块包括,The feature index extraction and analysis module is configured to extract the feature index from the preprocessed EEG signal, and analyze the characteristic index with the method of mathematical statistics to obtain the significant feature index. Specifically, the feature index extraction and analysis module includes:
特征指标提取单元,配置用于从EEG数据提取出若干节律波的功 率谱密度作为特征指标,提取过程为:从脑电信号中分别提取出α波、 β波、θ波、δ波,四种节律波的功率谱密度作为全脑平均功率谱密 度的特征指标:The feature index extraction unit is configured to extract the power spectral density of several rhythmic waves from the EEG data as the feature index. The power spectral density of rhythmic waves is used as a characteristic indicator of the average power spectral density of the whole brain:

其中,fup表示节律波对应的频率上界,fdown表示节律波对应的频 率下界,作为可选方案,提取全脑α波、β波、θ波、δ波,得到4 个特征指标;Among them, fup represents the upper bound of the frequency corresponding to the rhythmic wave, and fdown represents the lower bound of the frequency corresponding to the rhythmic wave. As an optional solution, the whole brain α wave, β wave, θ wave, and δ wave are extracted to obtain 4 characteristic indicators;
将脑通道按额叶、顶叶、枕叶和颞叶划分为四个脑区,分别对四 个脑区提取脑电δ波、θ波、α波和β波的功率谱密度,得到16个特 征指标;The brain channel is divided into four brain regions according to the frontal lobe, parietal lobe, occipital lobe and temporal lobe, and the power spectral density of EEG delta wave, theta wave, alpha wave and beta wave is extracted from the four brain regions, and 16 brain regions are obtained. characteristic index;
显著性的特征指标分析单元,配置用于采用数理统计的方法分析 得到具有显著性的特征指标,分析过程包括:The significant characteristic index analysis unit is configured to use mathematical statistics to analyze and obtain significant characteristic indicators. The analysis process includes:
采用功率谱估计方法分析驾驶过程中驾驶员的脑电信号,The power spectrum estimation method was used to analyze the driver's EEG signal during driving,
其中,所述AR功率谱估计模型为:Wherein, the AR power spectrum estimation model is:

AR功率谱估计模型中的阶数p使用代价函数进行估计,-jtw为复 指数信号,AR功率谱估计模型的系数cpi和σ2使用Burg算法进行求取, 使AR模型前后项预测误差的功率之和为最小;The order p in the AR power spectrum estimation model is estimated using the cost function, -jtw is the complex exponential signal, and the coefficients cpi and σ2 of the AR power spectrum estimation model are calculated using the Burg algorithm, so that the prediction error of the front and rear items of the AR model is equal to The sum of power is the minimum;
采用正态性检验对采集到的特征指标的P(w)差异性进行检验分 析;The P(w) difference of the collected characteristic indexes was tested and analyzed by normality test;
对P(w)服从正态分布和方差齐性要求的特征指标进行单因素方差 分析,对P(w)不服从正态分布或不满足方差齐性要求的特征指标进行 非参数方差分析;One-way ANOVA is performed on the characteristic indexes whose P(w) obeys the normal distribution and variance homogeneity requirements, and nonparametric variance analysis is performed on the characteristic indexes whose P(w) does not obey the normal distribution or the variance homogeneity requirements;
确定P(w)小于预设值的特征指标为具有显著性的特征指标。It is determined that the feature index whose P(w) is less than the preset value is a significant feature index.
计算模块,配置用于计算具有显著性的特征指标的功率谱密度的 预测值与真值之间的差值,具体的,计算模块包括:The calculation module is configured to calculate the difference between the predicted value and the true value of the power spectral density of the significant characteristic index. Specifically, the calculation module includes:
预测值计算单元,配置用于计算计算具有显著性的特征指标的功 率谱密度的预测值,步骤如下:The predicted value calculation unit is configured to calculate the predicted value of the power spectral density of the significant characteristic index, and the steps are as follows:
将预设时长划分为n个时间窗口,时间窗口对应的具有显著性的 特征指标的功率谱密度的脑电信号数据为:The preset duration is divided into n time windows, and the EEG signal data of the power spectral density of the significant characteristic index corresponding to the time window is:
x(0)=(x(0)(1),x(0)(2),…,x(0)(n)),其中n是脑电信号数据的个数。x(0) =(x(0) (1),x(0) (2),…,x(0) (n)), where n is the number of EEG signal data.
原始数据一次累加生成序列为:The original data is accumulated once and the sequence is:
x(1)=(x(1)(1),x(1)(2),…,x(1)(n))x(1) =(x(1) (1),x(1) (2),…,x(1) (n))
其中:in:

基于x(1)建立GM(1,1)模型的一阶灰色微分方程:The first-order grey differential equation of the GM(1,1) model is established based on x(1) :

并用最小二乘法计算该方程的待辨识参数a和u。其中,a为发展 参数,u为灰色作用量。And use the least squares method to calculate the parameters to be identified a and u of the equation. Among them, a is the development parameter, and u is the gray action.
令a=(a,u)T,则由最小二乘法得到:Let a=(a,u)T , then it is obtained by the least squares method:
a=(BTB)-1BTYna=(BT B)-1 BT Yn
其中B和Yn和分别为:where B and Yn and respectively are:

Yn=(x(0)(2),x(0)(3),…,x(0)(n))TYn = (x(0) (2),x(0) (3),…,x(0) (n))T
由以上各式,解得一阶灰色微分方程为:From the above equations, the first-order gray differential equation is solved as:

因此得到预测值:So get the predicted value:

差值计算单元,配置用于计算具有显著性的特征指标的功率谱密 度的预测值与真值之间的差值,步骤如下:The difference calculation unit is configured to calculate the difference between the predicted value and the true value of the power spectral density of the significant feature index, and the steps are as follows:
计算具有显著性的特征指标的功率谱密度的预测值与真值之间的 差值e(tN):Calculate the difference e(tN ) between the predicted value and the true value of the power spectral density of the significant feature index:

其中,
检验模块,配置用于对显著性的特征指标的功率谱密度预测值进 行检验,步骤如下:The test module is configured to test the predicted value of the power spectral density of the significant feature index. The steps are as follows:
对模型进行相对误差ε(t)检验和后验差C、P进行检验:The model is tested for the relative error ε(t) and the posterior differences C and P:


目的是去除具有显著性的特征指标的功率谱密度预测值不符合相 对误差检验和后验差检验的数据,具体的,根据表1,本实验基于灰 色预测模型,去除不合格的相对误差ε(t)检验和后验差C、P,The purpose is to remove the data that the power spectral density prediction value of the significant characteristic index does not conform to the relative error test and the posterior difference test. Specifically, according to Table 1, this experiment is based on the gray prediction model to remove the unqualified relative error ε ( t) test and posterior difference C, P,
表1Table 1
危险程度辨识模块,根据配置用于所述差值辨识交通场景的危险 程度,步骤如下:The danger level identification module is configured to identify the danger level of the traffic scene according to the difference, and the steps are as follows:
根据所述差值,计算具有显著性的特征指标的功率谱密度的预测 值与真值之间的均值μ和标准差σ2;According to the difference, calculate the mean μ and the standard deviation σ2 between the predicted value of the power spectral density of the significant feature index and the true value;
通过灰色预测法得到的具有显著性的特征指标的功率谱密度的预 测值与实际值差值的正态分布特征(μ,σ2),交通因素危险度的指标 为:Complexityscene={μ具有显著性的特征指标,σ2具有显著性的特征指标};The normal distribution characteristics (μ, σ2 ) of the difference between the predicted value of the power spectral density and the actual value of the significant feature index obtained by the gray prediction method, the index of the traffic factor risk is: Complexityscene = {μhas Significant feature index , σ2significant feature index };
根据所述指标辨识交通场景的危险程度。The danger level of the traffic scene is identified according to the index.
本实施例提供应用上述基于脑电数据的危险交通场景辨识系统的 危险交通场景辨识方法,包括以下步骤:The present embodiment provides a dangerous traffic scene identification method using the above-mentioned EEG data-based dangerous traffic scene identification system, including the following steps:
步骤1:基于交通场景,获取刺激对象和实验变量;Step 1: Based on the traffic scene, obtain stimulus objects and experimental variables;
步骤2:通过刺激对象和实验变量完成对驾驶员的驾驶测试,获 取预设时长内驾驶员包含脑电信号的EEG数据;Step 2: Complete the driving test of the driver by stimulating the object and experimental variables, and obtain the EEG data of the driver including the EEG signal within the preset time period;
步骤3:对采集到的脑电信号进行预处理,去除脑电信号中的信 号噪音;对采集到的脑电信号进行预处理,包括去除脑电信号中的信 号噪音,包括陷波和带通滤波去噪、基于ICA法的眼电去噪、实验变 量刺激段数据提取、基线校正。Step 3: Preprocessing the collected EEG signal to remove signal noise in the EEG signal; Preprocessing the collected EEG signal, including removing signal noise in the EEG signal, including notch and bandpass Filter denoising, ICA-based electroophthalmic denoising, experimental variable stimulus segment data extraction, baseline correction.
步骤4:对预处理后的脑电信号提取特征指标,并采用数理统计 的方法分析得到具有显著性的特征指标,具体包括:Step 4: Extract characteristic indicators from the preprocessed EEG signals, and analyze and obtain significant characteristic indicators by means of mathematical statistics, specifically including:
步骤4-1:从EEG数据提取出若干节律波的功率谱密度作为特征 指标,包括:从脑电信号中分别提取出α波、β波、θ波、δ波,四 种节律波的功率谱密度作为全脑平均功率谱密度的特征指标:Step 4-1: Extract the power spectral densities of several rhythmic waves from the EEG data as characteristic indicators, including: extracting α, β, θ, and δ waves from the EEG signal, respectively, and the power spectra of the four rhythmic waves Density as a characteristic indicator of the average power spectral density of the whole brain:

其中,fup表示节律波对应的频率上界,fdown表示节律波对应的频 率下界;作为可选方案,提取全脑α波、β波、θ波、δ波,得到4 个特征指标;Among them, fup represents the upper bound of the frequency corresponding to the rhythmic wave, and fdown represents the lower bound of the frequency corresponding to the rhythmic wave; as an optional solution, extract the whole brain α wave, β wave, theta wave, δ wave, and obtain 4 characteristic indicators;
将脑通道按额叶、顶叶、枕叶和颞叶划分为四个脑区,分别对四 个脑区提取脑电δ波、θ波、α波和β波的功率谱密度,得到16个特 征指标;The brain channel is divided into four brain regions according to the frontal lobe, parietal lobe, occipital lobe and temporal lobe, and the power spectral density of EEG delta wave, theta wave, alpha wave and beta wave is extracted from the four brain regions, and 16 brain regions are obtained. characteristic index;
步骤4-2:采用数理统计的方法分析得到具有显著性的特征指标, 包括以下步骤:采用功率谱估计方法分析驾驶过程中驾驶员的脑 电信号,Step 4-2: adopting the method of mathematical statistics to analyze and obtain significant characteristic indicators, including the following steps: using the power spectrum estimation method to analyze the driver's EEG signal during the driving process,
其中,所述AR功率谱估计模型为:Wherein, the AR power spectrum estimation model is:

AR功率谱估计模型中的阶数p使用代价函数进行估计,-jtw为复 指数信号,AR功率谱估计模型的系数cpi和σ2使用Burg算法进行求取, 使AR模型前后项预测误差的功率之和为最小;The order p in the AR power spectrum estimation model is estimated using the cost function, -jtw is the complex exponential signal, and the coefficients cpi and σ2 of the AR power spectrum estimation model are calculated using the Burg algorithm, so that the prediction error of the front and rear items of the AR model is equal to The sum of power is the minimum;
采用正态性检验对采集到的特征指标的P(w)差异性进行检验分 析;The P(w) difference of the collected characteristic indexes was tested and analyzed by normality test;
对P(w)服从正态分布和方差齐性要求的特征指标进行单因素方差 分析,对P(w)不服从正态分布或不满足方差齐性要求的特征指标进行 非参数方差分析;One-way ANOVA is performed on the characteristic indexes whose P(w) obeys the normal distribution and variance homogeneity requirements, and nonparametric variance analysis is performed on the characteristic indexes whose P(w) does not obey the normal distribution or the variance homogeneity requirements;
确定P(w)小于预设值的特征指标为具有显著性的特征指标。It is determined that the feature index whose P(w) is less than the preset value is a significant feature index.
步骤5:计算具有显著性的特征指标的功率谱密度的预测值与真 值之间的差值,包括;Step 5: Calculate the difference between the predicted value and the true value of the power spectral density of the significant feature index, including;
步骤5-1:计算具有显著性的特征指标的功率谱密度的预测值:Step 5-1: Calculate the predicted value of the power spectral density of the significant feature index:
将预设时长划分为n个时间窗口,时间窗口对应的具有显著性的 特征指标的功率谱密度的脑电信号数据为:The preset duration is divided into n time windows, and the EEG signal data of the power spectral density of the significant characteristic index corresponding to the time window is:
x(0)=(x(0)(1),x(0)(2),…,x(0)(n)),其中n是脑电信号数据的个数。x(0) =(x(0) (1),x(0) (2),…,x(0) (n)), where n is the number of EEG signal data.
原始数据一次累加生成序列为:The original data is accumulated once and the sequence is:
x(1)=(x(1)(1),x(1)(2),…,x(1)(n))x(1) =(x(1) (1),x(1) (2),…,x(1) (n))
其中:in:

基于x(1)建立GM(1,1)模型的一阶灰色微分方程:The first-order grey differential equation of the GM(1,1) model is established based on x(1) :

并用最小二乘法计算该方程的待辨识参数a和u。其中,a为发展 参数,u为灰色作用量。And use the least squares method to calculate the parameters to be identified a and u of the equation. Among them, a is the development parameter, and u is the gray action.
令a=(a,u)T,则由最小二乘法得到:Let a=(a,u)T , then it is obtained by the least squares method:
a=(BTB)-1BTYna=(BT B)-1 BT Yn
其中B和Yn和分别为:where B and Yn and respectively are:

Yn=(x(0)(2),x(0)(3),…,x(0)(n))TYn = (x(0) (2),x(0) (3),…,x(0) (n))T
由以上各式,解得一阶灰色微分方程为:From the above equations, the first-order gray differential equation is solved as:

因此得到预测值:So get the predicted value:

根据所述差值辨识交通场景的危险程度。The degree of danger of the traffic scene is identified according to the difference.
步骤5-2:对模型进行相对误差ε(t)检验和后验差C、P进行检验:Step 5-2: Carry out the relative error ε(t) test and the posterior difference C, P test on the model:


目的是去除具有显著性的特征指标的功率谱密度预测值不符合相 对误差检验和后验差检验的数据,具体的,根据表1,本实验基于灰 色预测模型,去除不合格的相对误差ε(t)检验和后验差C、P。The purpose is to remove the data that the power spectral density prediction value of the significant characteristic index does not conform to the relative error test and the posterior difference test. Specifically, according to Table 1, this experiment is based on the gray prediction model, and the unqualified relative error ε( t) Test and posterior difference C, P.
步骤5-3:计算具有显著性的特征指标的功率谱密度的预测值与 真值之间的差值:
其中,
步骤6:根据所述差值辨识交通场景的危险程度,包括:Step 6: Identify the danger level of the traffic scene according to the difference, including:
步骤6-1:根据所述差值,计算具有显著性的特征指标的功率谱 密度的预测值与真值之间的均值μ和标准差σ2;Step 6-1: Calculate the mean μ and the standard deviation σ2 between the predicted value of the power spectral density of the significant feature index and the true value according to the difference;
步骤6-2:通过灰色预测法得到的具有显著性的特征指标的功率 谱密度的预测值与实际值差值的正态分布特征(μ,σ2),交通因素危 险度的指标为:Complexityscene={μ具有显著性的特征指标,σ2具有显著性的特征指标},通过所 述指标反应交通场景的危险程度。Step 6-2: The normal distribution characteristic (μ, σ2 ) of the difference between the predicted value and the actual value of the power spectral density of the significant characteristic index obtained by the gray prediction method, and the index of the traffic factor risk is: Complexityscene = {μhas a significant feature index , σ2has a significant feature index }, through which the degree of danger of the traffic scene is reflected.
对筛选出的显著性特征指标进行相关性分析,了解各特征指标之 间的相关程度,然后对相关程度较高的指标进行降维,构造交通危险 度影响因素的最优指标集,用于交通场景危险度辨识模型的搭建,当 交通因素的危险度较低时,驾驶员受到交通因素的刺激较小,且刺激 前后的驾驶员脑电信号变化往往较为平缓,反之亦然。因此,驾驶员 受到交通因素影响前后,脑电信号变化的平滑程度可以反映出当前交 通因素的危险度。The correlation analysis is carried out on the selected significant characteristic indicators to understand the degree of correlation between the characteristic indicators, and then the dimensionality reduction of the indicators with a higher degree of correlation is carried out to construct the optimal indicator set of the influencing factors of traffic risk, which is used for traffic In the construction of the scene risk identification model, when the risk of the traffic factor is low, the driver is less stimulated by the traffic factor, and the changes of the driver's EEG signal before and after stimulation are often gentle, and vice versa. Therefore, before and after the driver is affected by traffic factors, the smoothness of changes in EEG signals can reflect the current risk of traffic factors.
本实施例的一种设备,所述设备包括:一个或多个处理器;A device in this embodiment, the device includes: one or more processors;
存储器,用于存储一个或多个程序,memory for storing one or more programs,
当所述一个或多个程序被所述一个或多个处理器执行时,使得所 述一个或多个处理器执行上述任一项所述的方法,通过处理器执行基 于脑电数据的危险交通场景辨识方法,能够对驾驶员进行有效的安全 预警,有利于将驾驶员的精神负荷控制在合理区间,有效的降低驾驶 风险。When the one or more programs are executed by the one or more processors, the one or more processors are caused to execute the method described in any one of the above, and the dangerous traffic based on the EEG data is executed by the processor. The scene recognition method can provide effective safety warning to the driver, which is beneficial to control the driver's mental load in a reasonable range and effectively reduce the driving risk.
本实施例的一种存储有计算机程序的计算机可读存储介质,该程 序被处理器执行时实现上述任一项所述的方法,储存有被处理器执行 时实现的所述基于脑电数据的危险交通场景辨识方法,有效的降低驾 驶风险。进一步介绍如下:In this embodiment, a computer-readable storage medium is stored with a computer program. When the program is executed by a processor, any one of the methods described above is implemented, and when the program is executed by the processor, the computer-readable storage medium based on EEG data is stored. Dangerous traffic scene identification method can effectively reduce driving risk. Further introduction is as follows:
计算机系统包括中央处理单元(CPU)101,其可以根据存储在只读存 储器(ROM)102中的程序或者从存储部分加载到随机访问存储器(RAM)103 中的程序而执行各种适当的动作和处理。在RAM103中,还存储有系统操 作所需的各种程序和数据。CPU 101、ROM 102以及RAM 103通过总线104 彼此相连。输入/输出(I/O)接口105也连接至总线104。The computer system includes a central processing unit (CPU) 101 that can perform various appropriate actions and in accordance with a program stored in a read only memory (ROM) 102 or a program loaded from a storage portion into a random access memory (RAM) 103. deal with. In the
以下部件连接至I/O接口105:包括键盘、鼠标等的输入部分106; 包括诸如阴极射线管(CRT)、液晶显示器(LCD)等以及扬声器等的输出部 分;包括硬盘等的存储部分108;以及包括诸如LAN卡、调制解调器等的 网络接口卡的通信部分109。通信部分109经由诸如因特网的网络执行通 信处理。驱动器也根据需要连接至I/O接口105。可拆卸介质511,诸如磁盘、光盘、磁光盘、半导体存储器等等,根据需要安装在驱动器510 上,以便于从其上读出的计算机程序根据需要被安装入存储部分108。The following components are connected to the I/O interface 105: an
特别地,根据本发明的实施例,上文参考流程图15描述的过程可以 被实现为计算机软件程序。例如,本发明的实施例1包括一种计算机程 序产品,其包括承载在计算机可读介质上的计算机程序,该计算机程序 包含用于执行流程图所示的方法的程序代码。在这样的实施例中,该计 算机程序可以通过通信部分从网络上被下载和安装,和/或从可拆卸介质 被安装。在该计算机程序被中央处理单元(CPU)101执行时,执行本申请 的系统中限定的上述功能。In particular, the process described above with reference to
需要说明的是,本发明所示的计算机可读介质可以是计算机可读信 号介质或者计算机可读存储介质或者是上述两者的任意组合。计算机可 读存储介质例如可以是——但不限于——电、磁、光、电磁、红外线、 或半导体的系统、装置或器件,或者任意以上的组合。计算机可读存储 介质的更具体的例子可以包括但不限于:具有一个或多个导线的电连接、 便携式计算机磁盘、硬盘、随机访问存储器(RAM)、只读存储器(ROM)、 可擦式可编程只读存储器(EPROM或闪存)、光纤、便携式紧凑磁盘只读存 储器(CD-ROM)、光存储器件、磁存储器件、或者上述的任意合适的组合。 在本发明中,计算机可读存储介质可以是任何包含或存储程序的有形介 质,该程序可以被指令执行系统、装置或者器件使用或者与其结合使用。 而在本发明中,计算机可读的信号介质可以包括在基带中或者作为载波 一部分传播的数据信号,其中承载了计算机可读的程序代码。这种传播 的数据信号可以采用多种形式,包括但不限于电磁信号、光信号或上述 的任意合适的组合。计算机可读的信号介质还可以是计算机可读存储介 质以外的任何计算机可读介质,该计算机可读介质可以发送、传播或者 传输用于由指令执行系统、装置或者器件使用或者与其结合使用的程序。 计算机可读介质上包含的程序代码可以用任何适当的介质传输,包括但 不限于:无线、电线、光缆、RF等等,或者上述的任意合适的组合。It should be noted that the computer-readable medium shown in the present invention may be a computer-readable signal medium or a computer-readable storage medium or any combination of the above two. A computer-readable storage medium can be, for example, but not limited to, an electrical, magnetic, optical, electromagnetic, infrared, or semiconductor system, apparatus or device, or a combination of any of the above. More specific examples of computer readable storage media may include, but are not limited to, electrical connections with one or more wires, portable computer disks, hard disks, random access memory (RAM), read only memory (ROM), erasable Programmable read only memory (EPROM or flash memory), fiber optics, portable compact disk read only memory (CD-ROM), optical storage devices, magnetic storage devices, or any suitable combination of the foregoing. In the present invention, a computer-readable storage medium may be any tangible medium that contains or stores a program that can be used by or in conjunction with an instruction execution system, apparatus, or device. In the present invention, however, a computer-readable signal medium may include a data signal propagated in baseband or as part of a carrier wave, carrying computer-readable program code therein. Such propagated data signals may take a variety of forms including, but not limited to, electromagnetic signals, optical signals, or any suitable combination of the foregoing. A computer-readable signal medium can also be any computer-readable medium other than a computer-readable storage medium that can transmit, propagate, or transport the program for use by or in connection with the instruction execution system, apparatus, or device . Program code embodied on a computer readable medium may be transmitted using any suitable medium including, but not limited to, wireless, wireline, optical fiber cable, RF, etc., or any suitable combination of the foregoing.
附图中的框图16,图示了按照本发明各种实施例1的系统、方法和 计算机程序产品的可能实现的体系架构、功能和操作。在这点上,流程 图或框图中的每个方框可以代表一个模块、程序段、或代码的一部分, 上述模块、程序段、或代码的一部分包含一个或多个用于实现规定的逻 辑功能的可执行指令。也应当注意,在有些作为替换的实现中,方框中所标注的功能也可以以不同于附图中所标注的顺序发生。例如,两个接 连地表示的方框实际上可以基本并行地执行,它们有时也可以按相反的 顺序执行,这依所涉及的功能而定。也要注意的是,框图或流程图中的 每个方框、以及框图或流程图中的方框的组合,可以用执行规定的功能 或操作的专用的基于硬件的系统来实现,或者可以用专用硬件与计算机指令的组合来实现。
描述于本发明实施例中所涉及到的模块或单元可以通过软件的方式 实现,也可以通过硬件的方式来实现,所描述的单元也可以设置在处理 器中。其中,这些单元的名称在某种情况下并不构成对该单元本身的限 定。所描述的单元或模块也可以设置在处理器中,例如,可以描述为: 一种基于脑电数据的危险交通场景辨识系统,包括:第一数据获取模 块、第二数据获取模块、预处理模块、特征指标提取分析模块、计算 模块和危险程度辨识模块,其中,这些模块的名称在某种情况下并不构 成对该单元本身的限定,例如,预处理模块还可以被描述为“用于对采 集到的脑电信号进行预处理,去除脑电信号中的信号噪音的预处理模 块”。The modules or units described in the embodiments of the present invention may be implemented in software or hardware, and the described units may also be set in a processor. Among them, the name of these units does not constitute a limitation of the unit itself under certain circumstances. The described unit or module can also be set in the processor, for example, it can be described as: A dangerous traffic scene recognition system based on EEG data, including: a first data acquisition module, a second data acquisition module, and a preprocessing module , feature index extraction and analysis module, calculation module and risk degree identification module, wherein the names of these modules do not constitute a limitation of the unit itself in some cases, for example, the preprocessing module can also be described as "used to The collected EEG signal is preprocessed to remove the signal noise in the EEG signal.”
作为另一方面,本申请还提供了一种计算机可读介质,该计算机可 读介质可以是上述实施例中描述的电子设备中所包含的;也可以是单独 存在,而未装配入该电子设备中。上述计算机可读介质承载有一个或者 多个程序,当上述一个或者多个程序被一个该电子设备执行时,使得该 电子设备实现如上述实施例中所述的基于脑电数据的危险交通场景辨 识方法。As another aspect, the present application also provides a computer-readable medium. The computer-readable medium may be included in the electronic device described in the above embodiments; it may also exist alone without being assembled into the electronic device. middle. The above-mentioned computer-readable medium carries one or more programs, and when the above-mentioned one or more programs are executed by an electronic device, the electronic device realizes the identification of dangerous traffic scenes based on EEG data as described in the above-mentioned embodiments method.
例如,所述电子设备可以实现如图15中所示的:步骤S1:基于交 通场景,获取刺激对象和实验变量;步骤S2:用于通过刺激对象和实 验变量完成对驾驶员的驾驶测试时获取预设时长内驾驶员包含脑电信 号的EEG数据;步骤S3:对采集到的脑电信号进行预处理,去除脑电 信号中的信号噪音;步骤S4:对预处理后的脑电信号提取特征指标, 并采用数理统计的方法分析得到具有显著性的特征指标;步骤S5:计 算具有显著性的特征指标的功率谱密度的预测值与真值之间的差值; 步骤S6:根据所述差值辨识交通场景的危险程度。For example, the electronic device can implement as shown in FIG. 15 : Step S1 : obtaining stimulation objects and experimental variables based on the traffic scene; Step S2 : obtaining the stimulation objects and experimental variables when completing the driving test of the driver The driver contains the EEG data of the EEG signal within the preset time period; Step S3: preprocessing the collected EEG signal to remove signal noise in the EEG signal; Step S4: extracting features from the preprocessed EEG signal and adopting the method of mathematical statistics to analyze and obtain the significant characteristic index; Step S5: Calculate the difference between the predicted value and the true value of the power spectral density of the significant characteristic index; Step S6: According to the difference The value identifies the danger level of the traffic scene.
应当注意,尽管在上文详细描述中提及了用于动作执行的设备的若 干模块或者单元,但是这种划分并非强制性的。实际上,根据本公开的 实施方式,上文描述的两个或更多模块或者单元的特征和功能可以在一 个模块或者单元中具体化。反之,上文描述的一个模块或者单元的特征 和功能可以进一步划分为由多个模块或者单元来具体化。It should be noted that although several modules or units of the apparatus for action performance are mentioned in the above detailed description, this division is not mandatory. Indeed, the features and functions of two or more modules or units described above may be embodied in one module or unit according to embodiments of the present disclosure. Conversely, the features and functions of one module or unit described above may be further divided into multiple modules or units to be embodied.
此外,尽管在附图中以特定顺序描述了本公开中方法的各个步骤, 但是,这并非要求或者暗示必须按照该特定顺序来执行这些步骤,或是 必须执行全部所示的步骤才能实现期望的结果。附加的或备选地,可以 省略某些步骤,将多个步骤合并为一个步骤执行,以及/或者将一个步骤 分解为多个步骤执行等。Additionally, although the various steps of the methods of the present disclosure are depicted in the figures in a particular order, this does not require or imply that the steps must be performed in the particular order, or that all illustrated steps must be performed to achieve the desired result. Additionally or alternatively, certain steps may be omitted, multiple steps may be combined into one step for execution, and/or one step may be decomposed into multiple steps for execution, etc.
实验例1:Experimental example 1:
本实验例以过街行人交通因素为刺激对象,以驾驶员车辆与过街 行人刺激触发点间的不同距离为实验变量,设计了两种危险程度不同 的实验场景,研究不同危险程度的交通因素影响下的驾驶员脑电特征, 构建了辨识模型,具体步骤如下:In this experimental example, the traffic factor of pedestrians crossing the street is used as the stimulus object, and the different distances between the driver's vehicle and the stimulus trigger point of the pedestrian crossing the street are used as the experimental variables. The driver's EEG features were identified, and an identification model was constructed. The specific steps are as follows:
第一步:本实验设置两种场景中行人过街刺激触发点的距离分别 为120m和60m,具体场景设置如图1所示。实验共安排了30名驾驶 员参与,需要每名驾驶员分别完成120m和60m两个场景的驾驶测试。 实验中为平衡场景的顺序因素,设置两个场景的出现顺序随机。Step 1: In this experiment, the distances of the trigger points for pedestrians crossing the street in the two scenarios are set to be 120m and 60m respectively. The specific scene settings are shown in Figure 1. A total of 30 drivers were arranged to participate in the experiment, and each driver was required to complete the driving test in two scenarios of 120m and 60m respectively. In the experiment, in order to balance the order factors of the scenes, the order of appearance of the two scenes is set to be random.
当驾驶员车辆与过街行人刺激之间的距离为120m时,驾驶员能较 早的发现过街行人,并有较长的反应时间进行驾驶行为的决策,因此 视120m处发生的刺激为危险程度较小的交通因素。当驾驶员车辆与过 街行人刺激之间的距离设置为60m时,为了避免发生交通事故,驾驶 员发现刺激后必须立即做出应急行为。60m处的过街行人对驾驶员具 有较大的刺激,因此视60m处刺激为危险程度较大的交通因素。When the distance between the driver's vehicle and the stimuli of pedestrians crossing the street is 120m, the driver can detect pedestrians crossing the street earlier and have a longer reaction time to make decisions on driving behavior. Therefore, the stimuli occurring at 120m are regarded as more dangerous. Small traffic factor. When the distance between the driver's vehicle and the stimulus of pedestrians crossing the street is set to 60m, in order to avoid traffic accidents, the driver must take emergency actions immediately after finding the stimulus. Pedestrians crossing the street at 60m have greater stimulation to the driver, so the stimulation at 60m is regarded as a traffic factor with a greater degree of danger.
第二步:获取预设时长内驾驶员包含脑电信号的EEG数据,作为 可选方案,本发明采用NeurOne32导的脑电采集设备,以非侵入性采 集方法从32导脑电通道收集驾驶员EEG数据。以国际脑电图学会联合 会的10-20国际标准导联体系为脑电极的安放标准,参考电极位于Cz 点,采样频率为500Hz。Step 2: Obtain the EEG data of the driver including the EEG signal within the preset time period. As an optional solution, the present invention adopts the NeurOne 32-lead EEG acquisition device to collect the driver from the 32-lead EEG channel in a non-invasive collection method. EEG data. The 10-20 international standard lead system of the International Federation of Electroencephalography Societies was used as the placement standard for brain electrodes, the reference electrode was located at the Cz point, and the sampling frequency was 500 Hz.
本实验例分别提取了驾驶员受行人过街刺激前的24s脑电数据和 受刺激时的3s脑电数据,并以3s为时间窗,对采集到的脑电信号进 行预处理,去除信号噪音。脑电信号的预处理过程可分为四个主要步 骤,具体流程如图2所示。In this experimental example, the 24s EEG data before the driver is stimulated by pedestrians crossing the street and the 3s EEG data when the driver is stimulated are respectively extracted, and the collected EEG signals are preprocessed to remove the signal noise with 3s as the time window. The EEG signal preprocessing process can be divided into four main steps, the specific process is shown in Figure 2.
Step1.陷波和带通滤波去噪:Step1. Notch and bandpass filter denoising:
陷波器可去除特定频率分量,首先运用陷波去除50HZ的工频噪 音,而尽可能避免对其他有用频率分量的影响:The notch filter can remove specific frequency components. First, use the notch to remove the power frequency noise of 50Hz, and try to avoid the influence on other useful frequency components as much as possible:

其中,ω0为限波器截止频率,即为本研究中50Hz的工频信号。然 后采用一个带宽为1-50Hz的带通FIR滤波器去除高频噪音,保留 1-50HZ的频带信号。Among them, ω0 is the cut-off frequency of the wave limiter, which is the power frequency signal of 50 Hz in this study. Then a band-pass FIR filter with a bandwidth of 1-50Hz is used to remove high-frequency noise, and the frequency band signal of 1-50Hz is retained.
Step2.基于ICA法去除眼电噪音:Step2. Based on the ICA method to remove the electro-ophthalmic noise:
本研究中运用独立分量分析方法(ICA)去除眼电伪迹。主要原理 是将脑电数据分解为32个独立分量,然后计算各个独立成分与眼电之 间的相关系数,去除相关系数较大的独立成分,再将其余无关的独立 成分进行ICA逆运算重构为纯净的脑电信号。如图3所示,为某一驾 驶员ICA法去眼电的分析过程。分量IC18和IC27与眼电信号之间的 相关性较大,是造成原始信号干扰的眼电伪迹成分,因此,去除IC18 分量与IC27分量,再通过重构脑电信号,就能得到分离眼动伪迹后的 脑电信号。如图4所示,为去眼电噪音前、后的EEG信号,从时域上 可以观察到波形的毛刺减少,眼电伪迹基本被清除,得到纯净的脑电 数据。In this study, independent component analysis (ICA) was used to remove oculoelectric artifacts. The main principle is to decompose the EEG data into 32 independent components, then calculate the correlation coefficient between each independent component and the EOG, remove the independent component with a large correlation coefficient, and then perform the ICA inverse operation to reconstruct the remaining independent components. for pure EEG signals. As shown in Figure 3, the analysis process of removing the electro-oculogram for a certain driver's ICA method. The correlation between components IC18 and IC27 and the EEG signal is relatively large, and they are the EEG artifact components that cause the interference of the original signal. Therefore, by removing the IC18 component and the IC27 component, and then reconstructing the EEG signal, the separated eye can be obtained. EEG signal after motion artifact. As shown in Figure 4, in order to remove the EEG signal before and after the EEG noise, it can be observed from the time domain that the burr of the waveform is reduced, the EEG artifact is basically removed, and pure EEG data is obtained.
Step3.刺激段数据提取:Step3. Stimulus segment data extraction:
得到纯净的脑电数据后,再将脑电信号按事件刺激段和非事件刺 激段进行划分,将同类刺激诱发的脑电数据从连续的脑电数据中提取 出来,划分为若干段等长的刺激事件数据段。本实施例设置了3s时间 窗长度,并在一个场景中设置了三次同类的刺激事件。After obtaining pure EEG data, the EEG signal is divided into event stimulus segments and non-event stimulus segments, and the EEG data induced by similar stimuli are extracted from the continuous EEG data and divided into several segments of equal length. Stimulus event data segment. In this embodiment, the time window length of 3s is set, and three stimulation events of the same type are set in one scene.
Step4.基线校正:Step4. Baseline correction:
基线校正使得脑电数据从偏向横轴的某一侧变成围绕横轴上下波 动。如图5所示,为某一通道去基线漂移前后的脑电数据对比图。Baseline correction makes the EEG data fluctuate from one side of the horizontal axis to fluctuate around the horizontal axis. As shown in Figure 5, it is a comparison chart of EEG data before and after the baseline drift of a certain channel is removed.
最终,经过上述四个预处理步骤得出的脑电图波形呈现正常,且 具备分析的状态。如图6所示。Finally, the EEG waveform obtained through the above four preprocessing steps is normal and ready for analysis. As shown in Figure 6.
第三步:采用AR模型方法进行功率谱估计,该方法只需要短程 数据就可以获得较高地功率谱并能方便地转化成特征向量:The third step: use the AR model method to estimate the power spectrum. This method only needs short-range data to obtain a higher power spectrum and can easily convert it into a eigenvector:
AR功率谱估计模型为:
AR功率谱估计模型中的阶数p通常使用代价函数来估计,本实验 例p=20,系数cpi和σ2本文使用Burg算法进行求取。如图7所示,为驾 驶过程中某一驾驶员的全脑功率谱密度分布图。其原理是使AR模型前 后项预测误差的功率之和为最小,直接从已知脑电信号数据
为提取出脑电波中有用的信息,本实验例从全部脑电信号中分别 提取出四种节律波的功率谱密度(α波、β波、θ波、δ波)作为特征 指标:In order to extract useful information from brain waves, this experimental example extracts the power spectral density of four rhythmic waves (α, β, θ, and δ waves) from all EEG signals as characteristic indicators:

其中,fup表示节律波对应的频率上界,fdown表示节律波对应的频 率下界。Among them, fup represents the upper bound of the frequency corresponding to the rhythmic wave, and fdown represents the lower bound of the frequency corresponding to the rhythmic wave.
第四步:分析关于全脑平均功率谱密度的4种指标。Step 4: Analyze 4 indicators about the average power spectral density of the whole brain.
在3s时间窗下,全脑平均α波功率谱密度和全脑平均β波功率谱 密度均服从正态分布,但经检验只有全脑平均β波功率谱密度服从方 差齐性(p=0.258>0.05),因此对全脑平均β波功率谱密度的脑电信号 数据进行方差分析(F检验),对另外三个指标的脑电信号数据进行非 参数检验(H检验)。经方差分析,在3s时间窗下,全脑平均功率谱 密度在四个频段均不存在显著性差异,因此各个频段的全脑平均功率 谱密度指标均不能作为驾驶人精神负荷的表征指标。Under the 3s time window, the whole-brain average α-wave power spectral density and the whole-brain average β-wave power spectral density obey the normal distribution, but only the whole-brain average β-wave power spectral density obeys the homogeneity of variance (p=0.258> 0.05), therefore, analysis of variance (F test) was performed on the EEG signal data of the average β-wave power spectral density of the whole brain, and nonparametric test (H test) was performed on the EEG signal data of the other three indicators. The variance analysis showed that in the 3s time window, there was no significant difference in the average power spectral density of the whole brain in the four frequency bands. Therefore, the average power spectral density of the whole brain in each frequency band could not be used as a representative index of the driver's mental load.
分析从额叶、顶叶、枕叶、颞叶四个脑区提取的δ波、θ波、α 波和β波的功率谱密度指标。在3s时间窗下,顶叶区平均δ功率谱密 度、顶叶区平均β功率谱密度、枕叶区平均δ功率谱密度和颞叶区平 均α功率谱密度4个指标满足正态分布和方差齐次性,因此对它们进行单因素分析,对不满足正态分布或方差齐次性的其余指标进行非参 数检验。结果表明,顶叶区平均α波功率谱密度存在显著性差异 (p=0.011<0.05),可以作为驾驶人精神负荷的唯一表征指标,其余的 指标均无显著性。The power spectral density indexes of delta wave, theta wave, alpha wave and beta wave extracted from four brain regions of frontal lobe, parietal lobe, occipital lobe and temporal lobe were analyzed. Under the 3s time window, the average delta power spectral density in the parietal lobe area, the average beta power spectral density in the parietal lobe area, the average delta power spectral density in the occipital lobe area, and the average alpha power spectral density in the temporal lobe area satisfy the normal distribution and variance. Homogeneity, so univariate analysis was performed on them, and nonparametric tests were performed on the remaining indicators that did not satisfy normal distribution or homogeneity of variance. The results showed that there was a significant difference in the average α-wave power spectral density in the parietal lobe area (p=0.011<0.05), which could be used as the only indicator of the driver's mental load, and the other indicators were not significant.
在本实验中,将驾驶员的顶叶区α波功率谱密度作为具有显著性的 特征指标来分析和量化交通因素的危险程度。In this experiment, the alpha wave power spectral density of the driver's parietal lobe region is used as a significant characteristic index to analyze and quantify the danger degree of traffic factors.
第五步:基于实验得到脑电信号数据,分别分析驾驶员在两个实 验场景中的顶叶区α波功率谱密度,得到分析结果如图7所示。Step 5: Based on the EEG signal data obtained from the experiment, analyze the alpha wave power spectral density of the driver in the parietal lobe area in the two experimental scenarios respectively, and the analysis results are shown in Figure 7.
在不同的交通危险因素影响下,驾驶员的顶叶区α波功率谱密度均 会出现变小的趋势,但不同的危险因素刺激(120m和60m)影响下, 顶叶区α波功率谱密度变小的幅度不同。当驾驶员在120m距离的行人 过街场景中驾驶时,交通场景中影响因素的危险程度较低,驾驶人对 刺激反应较小,刺激出现前后的脑电波波形变化会相应的较为平滑, 顶叶区α波的功率谱密度变化也会相应较小。当驾驶员在60m距离的 行人过街场景中驾驶时,交通因素的危险程度较大,驾驶员的脑电波 波形及顶叶区α波的功率谱密度变化也有较大变化。因此,驾驶人受 到交通复杂因素影响前后,顶叶区α波功率谱密度变化的大小及平滑程度能反映当前因素的危险程度。Under the influence of different traffic risk factors, the α-wave power spectral density of the driver's parietal lobe area will tend to decrease, but under the influence of different risk factors (120m and 60m), the α-wave power spectral density of the parietal lobe area will decrease. The magnitude of the reduction is different. When the driver is driving in a pedestrian crossing scene with a distance of 120m, the risk of the influencing factors in the traffic scene is low, the driver's response to the stimulus is small, and the changes in the brain wave waveform before and after the stimulus appear relatively smooth, and the parietal lobe region is relatively smooth. The power spectral density change of the alpha wave will also be correspondingly smaller. When the driver is driving in a pedestrian crossing scene with a distance of 60m, the traffic factor is more dangerous, and the driver's brainwave waveform and the power spectral density of the alpha wave in the parietal lobe also have a large change. Therefore, before and after the driver is affected by complex traffic factors, the magnitude and smoothness of the change in the power spectral density of the alpha wave in the parietal lobe region can reflect the risk of the current factors.
第六步:本实验基于刺激前序时间的顶叶区α波功率谱密度,进行 刺激时刻预测。将24s的前序时间以3s为时间窗划分为8个预测样本, 来预测刺激时刻的顶叶区α波功率谱密度值。本实验基于灰色预测法进 行刺激时刻的灰色预测,获得了顶叶区α波功率谱密度的局部拟合函 数,具体步骤如下:Step 6: In this experiment, based on the power spectral density of alpha waves in the parietal lobe region at the pre-stimulus time, the stimulation moment is predicted. The pre-order time of 24 s was divided into 8 prediction samples with 3 s as the time window to predict the α wave power spectral density value of the parietal lobe region at the time of stimulation. In this experiment, based on the gray prediction method, the gray prediction of the stimulus time was performed, and the local fitting function of the α-wave power spectral density in the parietal lobe region was obtained. The specific steps are as follows:
驾驶员顶叶区α波功率谱密度的脑电信号数据为:The EEG data of the alpha wave power spectral density in the driver's parietal lobe are:
x(0)=(x(0)(1),x(0)(2),…,x(0)(n))x(0) =(x(0) (1),x(0) (2),…,x(0) (n))
其中n是脑电信号数据的个数。where n is the number of EEG signal data.
原始数据一次累加生成序列为:The original data is accumulated once and the sequence is:
x(1)=(x(1)(1),x(1)(2),…,x(1)(n))x(1) =(x(1) (1),x(1) (2),…,x(1) (n))
其中:in:

基于x(1)建立GM(1,1)模型的一阶灰色微分方程:The first-order grey differential equation of the GM(1,1) model is established based on x(1) :

并用最小二乘法计算该方程的待辨识参数a和u。其中,a为发展 参数,u为灰色作用量。And use the least squares method to calculate the parameters to be identified a and u of the equation. Among them, a is the development parameter, and u is the gray action.
令a=(a,u)T,则由最小二乘法得到:Let a=(a,u)T , then it is obtained by the least squares method:
a=(BTB)-1BTYna=(BT B)-1 BT Yn
其中,B和Yn和分别为:Among them, B and Yn sum are respectively:

Yn=(x(0)(2),x(0)(3),…,x(0)(n))TYn = (x(0) (2),x(0) (3),…,x(0) (n))T
Yn=(x(0)(2),x(0)(3),…,x(0)(n))TYn = (x(0) (2),x(0) (3),…,x(0) (n))T
由以上所述,解得一阶灰色微分方程为:From the above, the solution of the first-order gray differential equation is:

得到预测值:Get the predicted value:

第七步:对模型进行相对误差ε(t)检验和后验差C、P检验:Step 7: Perform relative error ε(t) test and posterior difference C, P test on the model:


对全部驾驶员的脑电数据进行灰色预测与检验,顶叶区α波功率 谱密度预测值均满足误差检验,如图8所示,为一名驾驶员的脑电信 号灰色预测曲线。All drivers’ EEG data were predicted and tested in gray, and the predicted values of α-wave power spectral density in the parietal lobe area met the error test, as shown in Figure 8, which is the gray prediction curve of a driver’s EEG signal.
最终得到:end up with:

其中,驾驶员顶叶区α波功率谱密度的预测值与真值之间的差值 e(tN)。
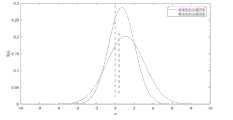
第八步:在预测值与实际值的差值所构成的正态分布中,均值μ和 标准差σ2反应了脑电信号变化的剧烈程度,间接反应了交通因素的复 杂程度。对比分析较小复杂度(120m)和较大复杂度(60m)的行人过 街刺激影响下的驾驶员顶叶区α波功率谱密度差值的正态分布曲线(拟 合后),结果如图10所示。具有较大复杂度的交通复杂因素,其差值 对应的正态分布特征中均值μ的绝对值和标准差σ2均较大。Step 8: In the normal distribution formed by the difference between the predicted value and the actual value, the mean μ and the standard deviation σ2 reflect the intensity of changes in EEG signals, and indirectly reflect the complexity of traffic factors. The normal distribution curve (after fitting) of the alpha wave power spectral density difference in the driver's parietal area under the influence of pedestrian crossing stimuli with small complexity (120m) and large complexity (60m) is compared and analyzed, and the results are shown in the figure 10 shown. For the traffic complex factors with greater complexity, the absolute value of the mean μ and the standard deviation σ2 in the normal distribution characteristics corresponding to the difference values are larger.
实验例2:Experimental example 2:
本实验例针对行人过街、车辆变速、车辆变道三种交通危险因素 的危险度构建了辨识模型,并对比分析了三种交通危险因素的危险度, 具体步骤如下:In this experimental example, an identification model is built for the risk of pedestrian crossing the street, vehicle speed change, and vehicle lane changing, and the risk degree of the three traffic risk factors is compared and analyzed. The specific steps are as follows:
本实验例与实验例1相同的脑电数据预处理过程、特征指标确定 过程不再赘述,本实验例与实验例1不同的特征在于对比分析含有不 同元素的场景危险度:The same EEG data preprocessing process and feature index determination process of this experimental example and experimental example 1 will not be repeated here. The difference between this experimental example and experimental example 1 lies in the comparative analysis of the risk degree of scenes containing different elements:
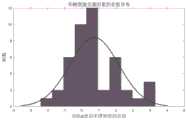
本实验基于得到的显著性脑电指标为顶叶区α波功率谱密度,计算 驾驶员顶叶区α波功率谱密度的预测值与真值之间的差值e(tN),并对差 值的分布情况进行正态检验。得到行人过街、车辆变速、车辆变道三 种交通危险因素的顶叶区α波功率谱密度差值,均具有良好的正态分布 特性,如图11至图13所示。In this experiment, based on the obtained significant EEG index of alpha wave power spectral density in the parietal lobe area, the difference e(tN ) between the predicted value and the true value of the alpha wave power spectral density in the driver's parietal lobe area was calculated, and the The distribution of differences was tested for normality. The difference of α-wave power spectral density in the parietal lobe region of the three traffic risk factors of pedestrian crossing, vehicle speed change, and vehicle lane change are obtained, all of which have good normal distribution characteristics, as shown in Figure 11 to Figure 13.
将三种交通危险因素的顶叶区α波功率谱密度差值的正态分析结 果,分别记作他们的危险度比较指标:The normal analysis results of the difference in alpha wave power spectral density in the parietal lobe of the three traffic risk factors are recorded as their risk comparison indexes:
Complexity过街行人={μ顶区α波,σ2顶区α波}={1.084,1.980}Pedestrians crossing the street in Complexity = {α wave inthe top area of μ, α wave inthe top area of σ2 } = {1.084, 1.980}
Complexity变速车辆={μ顶区α波,σ2顶区α波}={0.736,1.431}Complexityvariable speed vehicle = {μtop region alpha wave , σ2top region alpha wave } = {0.736, 1.431}
Complexity变道车辆={μ顶区α波,σ2顶区α波}={0.833,1.693}Complexitylane changing vehicle = {α wave inthe top area of μ, α wave inthe top area of σ2 } = {0.833, 1.693}
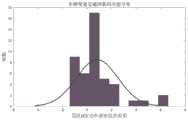
差值的正态分布曲线(拟合后)如图14所示。具有较大危险度的 交通因素,其对应的正态分布特征中均值μ的绝对值和标准差σ2均较 大。因此,由危险度指标可知,三种交通因素的危险度由小到大依次 为:行人过街>车辆变道>车辆变速。The normal distribution curve of the difference (after fitting) is shown in Figure 14. The traffic factors with larger risk degree have larger absolute value and standard deviation σ2 of the mean μ in the corresponding normal distribution characteristics. Therefore, it can be seen from the risk index that the risk of the three traffic factors from small to large is: pedestrian crossing the street > vehicle lane change > vehicle speed change.
过街行人在无标志标线的道路上突然出现,对于驾驶员来说有很 大的不确定性与突然性,其给予驾驶员的反应时间很短,造成的精神 负荷最大,并且驾驶法规告诉驾驶员碰撞行人所导致的事故严重性相 较于车辆追尾、车辆刮碰事故的严重性更大,这导致行人刺激对驾驶 员的精神负荷更大。前方车辆变速行为有很大的突然性,但在车辆变 速前,车灯的变换会对其余车辆起到一定的警示作用,这使得驾驶员 反应决策时间增加。相较于突发、无预警的过街行人因素,其影响较 小、复杂度较底。车辆变道行为是一种具有时间长度的驾驶过程行为, 其突发性较行人过街、车辆变速小很多。该刺激发生时给与驾驶员的反应时间较长,对驾驶员的精神负荷影响在三种影响因素中最小。The sudden appearance of pedestrians crossing the street on the road without signs and markings has great uncertainty and suddenness for the driver. The reaction time given to the driver is very short, causing the greatest mental load, and the driving laws tell the driver The severity of the accident caused by the collision of pedestrians with pedestrians is greater than that of vehicle rear-end collisions and vehicle scraping accidents, which leads to pedestrian stimulation on the driver's mental load. The shifting behavior of the vehicle ahead is very sudden, but before the vehicle shifts, the change of the headlights will have a certain warning effect on other vehicles, which increases the driver's reaction and decision-making time. Compared with the sudden and unwarranted pedestrians crossing the street, its impact is smaller and the complexity is lower. Vehicle lane-changing behavior is a long-term driving process behavior, and its suddenness is much smaller than that of pedestrians crossing the street and vehicles changing speed. The driver's reaction time was longer when the stimulus occurred, and the influence on the driver's mental load was the smallest among the three influencing factors.
以上描述仅为本申请的较佳实施例以及对所运用技术原理的说明。 本领域技术人员应当理解,本申请中所涉及的发明范围,并不限于上述 技术特征的特定组合而成的技术方案,同时也应涵盖在不脱离所述发明 构思的情况下,由上述技术特征或其等同特征进行任意组合而形成的其 它技术方案。例如上述特征与本申请中公开的(但不限于)具有类似功能 的技术特征进行互相替换而形成的技术方案。The above description is only a preferred embodiment of the present application and an illustration of the applied technical principles. Those skilled in the art should understand that the scope of the invention involved in this application is not limited to the technical solution formed by the specific combination of the above-mentioned technical features, and should also cover the above-mentioned technical features without departing from the inventive concept. Other technical solutions formed by any combination of its equivalent features. For example, a technical solution formed by replacing the above features with the technical features disclosed in this application (but not limited to) with similar functions.
Claims (10)
Translated fromChinese


Priority Applications (1)
| Application Number | Priority Date | Filing Date | Title |
|---|---|---|---|
| CN202010581608.3ACN111803065B (en) | 2020-06-23 | 2020-06-23 | Dangerous traffic scene identification method and system based on electroencephalogram data |
Applications Claiming Priority (1)
| Application Number | Priority Date | Filing Date | Title |
|---|---|---|---|
| CN202010581608.3ACN111803065B (en) | 2020-06-23 | 2020-06-23 | Dangerous traffic scene identification method and system based on electroencephalogram data |
Publications (2)
| Publication Number | Publication Date |
|---|---|
| CN111803065Atrue CN111803065A (en) | 2020-10-23 |
| CN111803065B CN111803065B (en) | 2023-12-26 |
Family
ID=72846493
Family Applications (1)
| Application Number | Title | Priority Date | Filing Date |
|---|---|---|---|
| CN202010581608.3AActiveCN111803065B (en) | 2020-06-23 | 2020-06-23 | Dangerous traffic scene identification method and system based on electroencephalogram data |
Country Status (1)
| Country | Link |
|---|---|
| CN (1) | CN111803065B (en) |
Cited By (7)
| Publication number | Priority date | Publication date | Assignee | Title |
|---|---|---|---|---|
| CN112396093A (en)* | 2020-10-29 | 2021-02-23 | 中国汽车技术研究中心有限公司 | Driving scene classification method, device and equipment and readable storage medium |
| CN112426162A (en)* | 2020-11-23 | 2021-03-02 | 重庆邮电大学 | Fatigue detection method based on electroencephalogram signal rhythm entropy |
| CN112494053A (en)* | 2020-12-23 | 2021-03-16 | 深圳市德力凯医疗设备股份有限公司 | Method, system, equipment and storage medium for monitoring cerebral anoxia risk degree |
| CN113017650A (en)* | 2021-03-12 | 2021-06-25 | 南昌航空大学 | Electroencephalogram feature extraction method and system based on power spectral density image |
| CN113449589A (en)* | 2021-05-16 | 2021-09-28 | 桂林电子科技大学 | Method for calculating driving strategy of unmanned automobile in urban traffic scene |
| CN116595429A (en)* | 2022-12-27 | 2023-08-15 | 北京津发科技股份有限公司 | Driver state evaluation method and system |
| CN119848627A (en)* | 2024-12-31 | 2025-04-18 | 清华大学 | Method, device, equipment, medium and product for identifying driving perception based on electroencephalogram signals |
Citations (16)
| Publication number | Priority date | Publication date | Assignee | Title |
|---|---|---|---|---|
| US20090040054A1 (en)* | 2007-04-11 | 2009-02-12 | Nec Laboratories America, Inc. | Real-time driving danger level prediction |
| WO2011101988A1 (en)* | 2010-02-22 | 2011-08-25 | トヨタ自動車株式会社 | Risk degree calculation device |
| CN104598993A (en)* | 2015-01-14 | 2015-05-06 | 南京信息工程大学 | Blink time based driver fatigue driving prediction method |
| DE102014004395B3 (en)* | 2014-03-26 | 2015-06-18 | Audi Ag | Method for operating a driver assistance system and motor vehicle |
| CN106897566A (en)* | 2017-02-28 | 2017-06-27 | 北京积水潭医院 | A kind of construction method and device of risk prediction model |
| CN107044893A (en)* | 2017-03-15 | 2017-08-15 | 何宗路 | A kind of Dynamic High-accuracy sensing and transmission method based on time domain encoding and decoding |
| CN107095670A (en)* | 2017-05-27 | 2017-08-29 | 西南交通大学 | Time of driver's reaction Forecasting Methodology |
| CN107357762A (en)* | 2017-06-08 | 2017-11-17 | 长安大学 | A kind of traffic potential danger method of discrimination based on driving human eye dynamic characteristic |
| CN107909854A (en)* | 2017-12-13 | 2018-04-13 | 北京交通大学 | A kind of braking method for early warning and system based on brain wave |
| CN108693973A (en)* | 2018-04-17 | 2018-10-23 | 北京理工大学 | A kind of emergency detecting system of fusion EEG signals and environmental information |
| US20190146492A1 (en)* | 2017-11-14 | 2019-05-16 | GM Global Technology Operations LLC | Method And Apparatus For Scenario Generation And Parametric Sweeps For The Development & Evaluation Of Autonomous Driving Systems |
| CN109835348A (en)* | 2019-01-25 | 2019-06-04 | 中国汽车技术研究中心有限公司 | A kind of screening technique and device of road traffic danger scene |
| CN109875582A (en)* | 2019-01-26 | 2019-06-14 | 江西科技学院 | Driving fatigue detection method and system |
| KR20190115953A (en)* | 2018-04-04 | 2019-10-14 | 한국전력공사 | System and method for diagnosing risk of power plant using rate of change of deviation |
| CN110648045A (en)* | 2019-08-14 | 2020-01-03 | 中国平安人寿保险股份有限公司 | Risk assessment method, electronic device and computer-readable storage medium |
| CN111166326A (en)* | 2019-12-23 | 2020-05-19 | 杭州电子科技大学 | An EEG Signal Recognition Method for Safe Semi-supervised Learning Based on Adaptive Risk |
- 2020
- 2020-06-23CNCN202010581608.3Apatent/CN111803065B/enactiveActive
Patent Citations (16)
| Publication number | Priority date | Publication date | Assignee | Title |
|---|---|---|---|---|
| US20090040054A1 (en)* | 2007-04-11 | 2009-02-12 | Nec Laboratories America, Inc. | Real-time driving danger level prediction |
| WO2011101988A1 (en)* | 2010-02-22 | 2011-08-25 | トヨタ自動車株式会社 | Risk degree calculation device |
| DE102014004395B3 (en)* | 2014-03-26 | 2015-06-18 | Audi Ag | Method for operating a driver assistance system and motor vehicle |
| CN104598993A (en)* | 2015-01-14 | 2015-05-06 | 南京信息工程大学 | Blink time based driver fatigue driving prediction method |
| CN106897566A (en)* | 2017-02-28 | 2017-06-27 | 北京积水潭医院 | A kind of construction method and device of risk prediction model |
| CN107044893A (en)* | 2017-03-15 | 2017-08-15 | 何宗路 | A kind of Dynamic High-accuracy sensing and transmission method based on time domain encoding and decoding |
| CN107095670A (en)* | 2017-05-27 | 2017-08-29 | 西南交通大学 | Time of driver's reaction Forecasting Methodology |
| CN107357762A (en)* | 2017-06-08 | 2017-11-17 | 长安大学 | A kind of traffic potential danger method of discrimination based on driving human eye dynamic characteristic |
| US20190146492A1 (en)* | 2017-11-14 | 2019-05-16 | GM Global Technology Operations LLC | Method And Apparatus For Scenario Generation And Parametric Sweeps For The Development & Evaluation Of Autonomous Driving Systems |
| CN107909854A (en)* | 2017-12-13 | 2018-04-13 | 北京交通大学 | A kind of braking method for early warning and system based on brain wave |
| KR20190115953A (en)* | 2018-04-04 | 2019-10-14 | 한국전력공사 | System and method for diagnosing risk of power plant using rate of change of deviation |
| CN108693973A (en)* | 2018-04-17 | 2018-10-23 | 北京理工大学 | A kind of emergency detecting system of fusion EEG signals and environmental information |
| CN109835348A (en)* | 2019-01-25 | 2019-06-04 | 中国汽车技术研究中心有限公司 | A kind of screening technique and device of road traffic danger scene |
| CN109875582A (en)* | 2019-01-26 | 2019-06-14 | 江西科技学院 | Driving fatigue detection method and system |
| CN110648045A (en)* | 2019-08-14 | 2020-01-03 | 中国平安人寿保险股份有限公司 | Risk assessment method, electronic device and computer-readable storage medium |
| CN111166326A (en)* | 2019-12-23 | 2020-05-19 | 杭州电子科技大学 | An EEG Signal Recognition Method for Safe Semi-supervised Learning Based on Adaptive Risk |
Non-Patent Citations (4)
| Title |
|---|
| SHUMIN FENG; BIN SHENG: "Research on Driving Workload Characteristics of Drivers Under Various Dangerous Scenarios Based on EEG"* |
| 何莎: "驾驶员在无信号交叉口避撞过程中脑电行为特性研究", pages 17 - 72* |
| 盛彬: "基于信息融合的驾驶危险场景分析识别研究", 《中国优秀硕士论文全文数据库 工程科技Ⅱ辑》* |
| 罗丹: "地方高校教学事故的新陈代谢GM(1,1)模型预测方法", pages 1 - 3* |
Cited By (10)
| Publication number | Priority date | Publication date | Assignee | Title |
|---|---|---|---|---|
| CN112396093A (en)* | 2020-10-29 | 2021-02-23 | 中国汽车技术研究中心有限公司 | Driving scene classification method, device and equipment and readable storage medium |
| CN112396093B (en)* | 2020-10-29 | 2022-10-14 | 中国汽车技术研究中心有限公司 | Driving scene classification method, device, device and readable storage medium |
| CN112426162A (en)* | 2020-11-23 | 2021-03-02 | 重庆邮电大学 | Fatigue detection method based on electroencephalogram signal rhythm entropy |
| CN112494053A (en)* | 2020-12-23 | 2021-03-16 | 深圳市德力凯医疗设备股份有限公司 | Method, system, equipment and storage medium for monitoring cerebral anoxia risk degree |
| CN112494053B (en)* | 2020-12-23 | 2023-10-03 | 深圳市德力凯医疗设备股份有限公司 | Method, system, equipment and storage medium for monitoring hypoxia risk degree of brain |
| CN113017650A (en)* | 2021-03-12 | 2021-06-25 | 南昌航空大学 | Electroencephalogram feature extraction method and system based on power spectral density image |
| CN113017650B (en)* | 2021-03-12 | 2022-06-28 | 南昌航空大学 | An EEG feature extraction method and system based on power spectral density image |
| CN113449589A (en)* | 2021-05-16 | 2021-09-28 | 桂林电子科技大学 | Method for calculating driving strategy of unmanned automobile in urban traffic scene |
| CN116595429A (en)* | 2022-12-27 | 2023-08-15 | 北京津发科技股份有限公司 | Driver state evaluation method and system |
| CN119848627A (en)* | 2024-12-31 | 2025-04-18 | 清华大学 | Method, device, equipment, medium and product for identifying driving perception based on electroencephalogram signals |
Also Published As
| Publication number | Publication date |
|---|---|
| CN111803065B (en) | 2023-12-26 |
Similar Documents
| Publication | Publication Date | Title |
|---|---|---|
| CN111803065B (en) | Dangerous traffic scene identification method and system based on electroencephalogram data | |
| Yang et al. | Comparison among driving state prediction models for car-following condition based on EEG and driving features | |
| CN102835955B (en) | A method for automatic removal of electro-oculogram artifacts in EEG signals without threshold setting | |
| CN111643077B (en) | Identification method for complexity of traffic dynamic factors based on electroencephalogram data | |
| CN109480872B (en) | Driving fatigue detection method based on electroencephalogram signal frequency band energy ratio characteristics | |
| CN103110418A (en) | Electroencephalogram signal characteristic extracting method | |
| CN103690163A (en) | ICA (independent component analysis) and HHT (Hilbert-Huang transform) fusion based automatic electrooculogram interference eliminating method | |
| CN109602417A (en) | Sleep stage method and system based on random forest | |
| CN115017996B (en) | Mental load prediction method and system based on multiple physiological parameters | |
| Chaibi et al. | A comparaison of methods for detection of high frequency oscillations (HFOs) in human intacerberal EEG recordings | |
| CN111657923A (en) | Method and system for testing danger perception capability of driver | |
| CN114403896A (en) | A method for removing oculoelectric artifacts in single-channel EEG signals | |
| Hu et al. | Analysis on biosignal characteristics to evaluate road rage of younger drivers: A driving simulator study | |
| Boashash et al. | Time-frequency signal and image processing of non-stationary signals with application to the classification of newborn EEG abnormalities | |
| Wang et al. | RETRACTED ARTICLE: Application of music in relief of driving fatigue based on EEG signals | |
| Li et al. | An EEG-based method for detecting drowsy driving state | |
| Sreekrishna et al. | Real time cascaded moving average filter for detrending of electroencephalogram signals | |
| CN106821318A (en) | A kind of multiple dimensioned quantitative analysis method of EEG signals | |
| CN116636859A (en) | Evaluation method and system for visual cognition capability based on electroencephalogram signals | |
| CN109953757A (en) | Real-time monitoring method of mental load for continuous tracking control and shooting tasks | |
| Liu et al. | Drivers’ workload electroencephalogram characteristics in cognitive tasks based on improved multiscale sample entropy | |
| Liu et al. | A diffusion-based feature enhancement approach for driving behavior classification with EEG data | |
| Stevenson et al. | A nonlinear model of newborn EEG with nonstationary inputs | |
| Haupt et al. | Steering wheel motion analysis for detection of the driver’s drowsiness | |
| Taghizadeh-Sarabi et al. | EEG-based analysis of human driving performance in turning left and right using Hopfield neural network |
Legal Events
| Date | Code | Title | Description |
|---|---|---|---|
| PB01 | Publication | ||
| PB01 | Publication | ||
| SE01 | Entry into force of request for substantive examination | ||
| SE01 | Entry into force of request for substantive examination | ||
| GR01 | Patent grant | ||
| GR01 | Patent grant |