CN111640507B - Quantum prediction method for human health state - Google Patents
Quantum prediction method for human health stateDownload PDFInfo
- Publication number
- CN111640507B CN111640507BCN202010509886.8ACN202010509886ACN111640507BCN 111640507 BCN111640507 BCN 111640507BCN 202010509886 ACN202010509886 ACN 202010509886ACN 111640507 BCN111640507 BCN 111640507B
- Authority
- CN
- China
- Prior art keywords
- data
- dimensional linear
- linear harmonic
- wave function
- harmonic oscillator
- Prior art date
- Legal status (The legal status is an assumption and is not a legal conclusion. Google has not performed a legal analysis and makes no representation as to the accuracy of the status listed.)
- Expired - Fee Related
Links
Images


Classifications
- G—PHYSICS
- G16—INFORMATION AND COMMUNICATION TECHNOLOGY [ICT] SPECIALLY ADAPTED FOR SPECIFIC APPLICATION FIELDS
- G16H—HEALTHCARE INFORMATICS, i.e. INFORMATION AND COMMUNICATION TECHNOLOGY [ICT] SPECIALLY ADAPTED FOR THE HANDLING OR PROCESSING OF MEDICAL OR HEALTHCARE DATA
- G16H50/00—ICT specially adapted for medical diagnosis, medical simulation or medical data mining; ICT specially adapted for detecting, monitoring or modelling epidemics or pandemics
- G16H50/30—ICT specially adapted for medical diagnosis, medical simulation or medical data mining; ICT specially adapted for detecting, monitoring or modelling epidemics or pandemics for calculating health indices; for individual health risk assessment
- A—HUMAN NECESSITIES
- A61—MEDICAL OR VETERINARY SCIENCE; HYGIENE
- A61B—DIAGNOSIS; SURGERY; IDENTIFICATION
- A61B5/00—Measuring for diagnostic purposes; Identification of persons
- A61B5/02—Detecting, measuring or recording for evaluating the cardiovascular system, e.g. pulse, heart rate, blood pressure or blood flow
- A61B5/024—Measuring pulse rate or heart rate
- G—PHYSICS
- G06—COMPUTING OR CALCULATING; COUNTING
- G06F—ELECTRIC DIGITAL DATA PROCESSING
- G06F17/00—Digital computing or data processing equipment or methods, specially adapted for specific functions
- G06F17/10—Complex mathematical operations
- G06F17/18—Complex mathematical operations for evaluating statistical data, e.g. average values, frequency distributions, probability functions, regression analysis
Landscapes
- Engineering & Computer Science (AREA)
- Health & Medical Sciences (AREA)
- Physics & Mathematics (AREA)
- Data Mining & Analysis (AREA)
- Life Sciences & Earth Sciences (AREA)
- General Physics & Mathematics (AREA)
- Medical Informatics (AREA)
- Public Health (AREA)
- Mathematical Analysis (AREA)
- Mathematical Optimization (AREA)
- Cardiology (AREA)
- Theoretical Computer Science (AREA)
- Pathology (AREA)
- Mathematical Physics (AREA)
- General Health & Medical Sciences (AREA)
- Computational Mathematics (AREA)
- Pure & Applied Mathematics (AREA)
- Databases & Information Systems (AREA)
- Biomedical Technology (AREA)
- Algebra (AREA)
- Primary Health Care (AREA)
- Probability & Statistics with Applications (AREA)
- Evolutionary Biology (AREA)
- Bioinformatics & Computational Biology (AREA)
- Bioinformatics & Cheminformatics (AREA)
- Software Systems (AREA)
- General Engineering & Computer Science (AREA)
- Epidemiology (AREA)
- Operations Research (AREA)
- Physiology (AREA)
- Biophysics (AREA)
- Heart & Thoracic Surgery (AREA)
- Molecular Biology (AREA)
- Surgery (AREA)
- Animal Behavior & Ethology (AREA)
- Veterinary Medicine (AREA)
- Measuring And Recording Apparatus For Diagnosis (AREA)
Abstract
Translated fromChinese
Description
Translated fromChinese技术领域technical field
本发明属于人体健康状态预测领域,具体涉及一种基于量子力学原理的人体健康状态预测方法。The invention belongs to the field of human body health state prediction, in particular to a human body health state prediction method based on the principle of quantum mechanics.
背景技术Background technique
随着现代医疗技术的不断发展,人类对多种疾病的治疗效果已经达到了前所未有的水平。但另一方面,却缺乏有效的疾病预测手段,即大多情况下只能做到“治已病”,对潜在患病对象的情况掌握不够清晰准确,无法较好地实现“治未病”这一目标。为此,医学界在疾病预测领域开展了大量的研究,并建立了一些疾病风险预测工具,例如,临床上关于心血管疾病就有诸如Framingham、QRISK、PROCAM、ASSIGN等评分标准。此外,Logistic回归模型也是一种常见的预测疾病的基础数学模型,即通过了解自变量X来估计医生所关心的疾病发生概率P的大小。但是,潜在的预测变量筛选往往基于专业判断和既往文献研究,且疾病的复杂性和动态性使得简单的数学预测模型存在一定的误差率,对预测未来疾病发展情况的参考价值有限。With the continuous development of modern medical technology, the therapeutic effect of human beings on various diseases has reached an unprecedented level. However, on the other hand, there is a lack of effective disease prediction methods, that is, in most cases, it is only possible to "treat the disease", and the situation of the potential diseased object is not clear and accurate enough to better realize the "preventive treatment" of the disease. a goal. To this end, the medical community has carried out a lot of research in the field of disease prediction, and established some disease risk prediction tools. For example, there are clinical scoring standards such as Framingham, QRISK, PROCAM, ASSIGN, etc. for cardiovascular disease. In addition, the logistic regression model is also a common basic mathematical model for predicting diseases, that is, by knowing the independent variable X to estimate the size of the probability P of the disease that doctors care about. However, the screening of potential predictors is often based on professional judgment and previous literature research, and the complexity and dynamics of diseases make simple mathematical prediction models have a certain error rate, and the reference value for predicting future disease development is limited.
近几年来,随着信息技术的迅猛发展,尤其是以人工智能为代表的计算机科学在疾病预测研究领域已经产生了重要的成果,基于以神经网络为核心的深度学习使得计算机模型对疾病预测水平有了显著提升。例如,利用卷积神经网络(CNN)模型能够快速学习并提取在一个时间周期内各类器官病变和人体状态病变的图像特征,使得计算机对某一类特定疾病的识别水平显著提升,帮助人类揭示了一些疾病的发病特征和潜在表现。同时,基于大数据和云计算,计算机能够大幅提升对海量病例的分析处理速度并进行疾病建模,从而提升疾病预测的成功概率。In recent years, with the rapid development of information technology, especially computer science represented by artificial intelligence has produced important results in the field of disease prediction research. Deep learning based on neural networks has enabled computer models to predict the level of disease. There has been a significant improvement. For example, the convolutional neural network (CNN) model can quickly learn and extract the image features of various organ lesions and human state lesions in a time period, which can significantly improve the computer's recognition level for a certain type of specific disease and help humans reveal The pathogenesis and underlying manifestations of some diseases are discussed. At the same time, based on big data and cloud computing, computers can greatly speed up the analysis and processing of massive cases and conduct disease modeling, thereby increasing the probability of success in disease prediction.
虽然人工智能技术大大提升了对某些疾病的预测水平,但其弊端也十分明显:一是大多只能对单一种类疾病进行预测。众所周知,疾病之间是存在复杂关联的,一些疾病会引起并发症。以高血压为例,人工智能通过提取识别高血压患者的特征,推导出该患者存在心脑血管疾病的概率,但高血压除了会诱发心脑血管疾病外,还会引发其他脏器的病变,且病变情况因人而异,故人工智能技术较难实现多种并发疾病的预测;此外,现有基于人工智能的疾病预测方法虽然可以对多种疾病进行预测,但是其对算力要求较高,且预测精度难以达到预期。二是对特定疾病的预测能力不强。由于人工智能主要应用场景为图像识别,对于一些表征明显的疾病,人工智能技术能够较快地准确提取表征并进行预测,但对于一些表征不明显的疾病,如痛风等,计算机无法通过图像识别进行病症判断;另一方面,痛风的症状和风湿性关节炎、滑囊炎等相似,若通过简单地分析病例数据进行判断,则会降低预测准确度,需要后期的人工诊断干预。三是人工智能算法需要耗费大量的算力,换句话说,需要高容量存储设备和高性能人工智能专用芯片支撑,因而成本较高,难以广泛应用于移动智能终端、可穿戴健康设备等小型、微型电子产品中,且由于人工智能算法需要访问大量医疗专家数据库系统和知识图谱,其数据平台兼容性不强,运行成本高昂。Although artificial intelligence technology has greatly improved the prediction level of certain diseases, its drawbacks are also very obvious: first, most of them can only predict a single type of disease. It is well known that there are complex relationships between diseases, and some diseases can cause complications. Taking hypertension as an example, artificial intelligence deduces the probability of cardiovascular and cerebrovascular diseases by extracting and identifying the characteristics of hypertensive patients. Moreover, the disease conditions vary from person to person, so it is difficult for artificial intelligence technology to predict multiple concurrent diseases; in addition, although the existing artificial intelligence-based disease prediction methods can predict a variety of diseases, they require high computing power. , and the prediction accuracy is difficult to meet expectations. Second, the ability to predict specific diseases is not strong. Since the main application scenario of artificial intelligence is image recognition, for some diseases with obvious characteristics, artificial intelligence technology can quickly and accurately extract the characteristics and make predictions, but for some diseases with less obvious characteristics, such as gout, the computer cannot use image recognition Disease judgment; on the other hand, the symptoms of gout are similar to rheumatoid arthritis, bursitis, etc. If the judgment is made by simply analyzing the case data, the prediction accuracy will be reduced, and later manual diagnosis intervention is required. Third, artificial intelligence algorithms need to consume a lot of computing power. In other words, high-capacity storage devices and high-performance artificial intelligence-specific chips are required, so the cost is high, and it is difficult to be widely used in mobile smart terminals, wearable health devices and other small, In microelectronic products, and because artificial intelligence algorithms need to access a large number of medical expert database systems and knowledge maps, their data platform compatibility is not strong, and the operating cost is high.
基于上述缺陷,如果能够实现疾病预测向低成本、小型化、智能化、实时化、精确化等方向同时发展,就能够大大提高疾病预测技术的应用范围,不仅为医疗机构、科研团队和患者带来极大帮助,且具有广阔的商业应用前景。Based on the above shortcomings, if disease prediction can be simultaneously developed in the direction of low cost, miniaturization, intelligence, real-time, and precision, the application scope of disease prediction technology can be greatly improved, not only for medical institutions, scientific research teams and patients. It is of great help and has broad commercial application prospects.
发明内容SUMMARY OF THE INVENTION
本发明的目的在于为解决现有疾病预测方法的缺陷而提出的一种基于量子力学原理的人体健康状态预测方法,为医疗机构、科研团队及患者等群体和个人提供科学有效的健康状态量化预测。The purpose of the present invention is to propose a method for predicting the health state of a human body based on the principle of quantum mechanics in order to solve the defects of the existing disease prediction methods, so as to provide scientific and effective quantitative prediction of the health state for medical institutions, scientific research teams, patients and other groups and individuals .
为了达到以上目的,本发明提出了一种基于量子力学原理的人体健康状态预测方法,包括以下步骤:步骤1:通过收集强相关数据和弱相关数据,对强相关数据和弱相关数据进行求导操作,建立强相关数据和弱相关数据与一维线性谐振子参数之间的内在联系;步骤2:通过确定强相关数据和弱相关数据与一维线性谐振子参数之间的内在联系,求解一维线性谐振子波函数参数,进而求解一维线性谐振子量子态的本征波函数;步骤3:对位置坐标轴进行分段,使得一维线性谐振子波函数被相应划分为若干区间,并求出各分段区间内的波函数概率密度函数积分值,得到一维线性谐振子处在各分段区间的概率,从而实现对某一时间范围内的人体健康状态的量化预测。In order to achieve the above purpose, the present invention proposes a method for predicting human health state based on the principle of quantum mechanics, including the following steps: Step 1: by collecting strong correlation data and weak correlation data, derivation of strong correlation data and weak correlation data operation to establish the intrinsic relationship between the strong correlation data and weak correlation data and the one-dimensional linear harmonic oscillator parameters; Step 2: by determining the intrinsic relationship between the strong correlation data and weak correlation data and the one-dimensional linear harmonic oscillator parameters, solve a Step 3: Segment the position coordinate axis, so that the one-dimensional linear harmonic wave function is divided into several intervals accordingly, and The integral value of the probability density function of the wave function in each subsection is obtained, and the probability of the one-dimensional linear harmonic oscillator in each subsection is obtained, so as to realize the quantitative prediction of the human health state in a certain time range.
在本发明的一个实例中,其中,所述步骤1中收集强相关数据和弱相关数据,强相关数据是指与人体健康状态具有直接关联的数据,包括但不限于心率、血压、血糖、血氧等健康指标数据;弱相关数据是指与人体健康状态具有间接关联的数据,其对健康的影响会间接反应到人体健康指标上,如环境数据、饮食习惯、作息习惯、运动数据等。在本发明的一个实例中,其中,所述步骤1中收集强相关数据和弱相关数据,其收集及获取方式包括传感器、历史数据记录、移动终端记录、专业机构公布等。In an example of the present invention, strong correlation data and weak correlation data are collected in
在本发明的一个实例中,其中,所述步骤1中对强相关数据和弱相关数据进行求导操作,求导操作包括但不限于对强相关数据和弱相关数据的一阶求导、二阶求导或多阶求导,以及上述数据的各阶导数构成的线性、非线性组合、数学方程等。In an example of the present invention, wherein, in the
在本发明的一个实例中,其中,所述步骤1中对强相关数据和弱相关数据进行求导操作,强相关数据和弱相关数据的求导在数学理论中是对时间进行连续求导,在实际情况中,可以将不同时间间隔内的强相关数据和弱相关数据的差值作为近似连续求导值。In an example of the present invention, wherein, in the
在本发明的一个实例中,其中,所述将不同时间间隔内的强相关数据和弱相关数据的差值作为近似连续求导值,时间间隔可以任意选取,包括但不限于每秒、每分钟、每小时、每日、每周、每月、每季度、每年等。In an example of the present invention, the difference between the strongly correlated data and the weakly correlated data in different time intervals is used as an approximate continuous derivation value, and the time interval can be arbitrarily selected, including but not limited to every second, every minute , hourly, daily, weekly, monthly, quarterly, yearly, etc.
在本发明的一个实例中,其中,所述步骤2中通过确定强相关数据和弱相关数据与一维线性谐振子参数之间的内在联系,可以求出波函数参数,波函数参数包括能量本征值、能量本征态能级、一维线性谐振子谐振频率、一维线性谐振子谐振系数等。In an example of the present invention, in the
在本发明的一个实例中,其中,所述步骤3中对位置坐标轴进行分段,使得一维线性谐振子波函数被相应划分为若干区间,其位置坐标轴进行分段按照降序或者升序的原则,对一维线性谐振子波函数进行量化细分,细分层次根据实际需要分析的疾病种类来确定,细分间距形式包括但不限于等距划分、等差划分、等比划分、正态分布划分等。In an example of the present invention, in the step 3, the position coordinate axis is segmented, so that the one-dimensional linear harmonic wave function is correspondingly divided into several intervals, and the position coordinate axis is segmented in descending or ascending order. In principle, the one-dimensional linear harmonic wave function is quantified and subdivided, and the subdivision level is determined according to the type of disease that needs to be analyzed. distribution, etc.
在本发明的一个实例中,其中,所述对位置坐标轴进行分段按照降序或者升序的原则,对一维线性谐振子波函数进行量化细分,量化细分区间的含义包括但不限于人体健康水平、身体体质、抵御不同程度疾病水平等。以平面二维直角坐标系(x-y)为例,x轴被划分为若干区间,其中:按照降序原则,(0,1)区间表示人体健康水平“最高”或者身体体质“最好”状态,相应地,(4,5)区间表示人体健康水平“最低”或者身体体质“最差”状态;按照升序原则,(0,1)区间表示人体“患病”程度最轻,相应地,(4,5)区间表示人体“患病”程度最重。In an example of the present invention, the segmenting of the position coordinate axis is performed according to the principle of descending or ascending order, and the one-dimensional linear harmonic wave function is quantified and subdivided, and the meaning of the quantized subdivision interval includes but is not limited to the human body Health level, physical fitness, resistance to different degrees of disease, etc. Taking the plane two-dimensional rectangular coordinate system (x-y) as an example, the x-axis is divided into several intervals, among which: according to the principle of descending order, the interval (0,1) represents the "highest" level of human health or the "best" state of physical fitness. Ground, the interval (4,5) represents the “lowest” state of human health or the “worst” state of physical fitness; according to the principle of ascending order, the interval (0,1) represents the least “illness” of the human body, and accordingly, (4, 5) The interval indicates that the human body is the most “ill”.
在本发明的一个实例中,其中,所述步骤3中对位置坐标轴进行分段,使得一维线性谐振子波函数被相应划分为若干区间,利用量子力学中量子态波函数概率密度函数等于波函数与其自身共轭相乘的绝对值这一公式,对任意分段区间内的波函数概率值进行计算,从而求得波函数处于各个区间的概率,进而直观体现人体健康状态的量化分布情况。In an example of the present invention, wherein, in the step 3, the position coordinate axis is segmented, so that the one-dimensional linear harmonic wave function is correspondingly divided into several intervals, and the probability density function of the quantum state wave function in quantum mechanics is equal to The formula of the absolute value of the multiplication of the wave function and its own conjugate calculates the probability value of the wave function in any subsection interval, so as to obtain the probability of the wave function in each interval, and then intuitively reflects the quantitative distribution of human health status. .
在本发明的一个实例中,其中,所述步骤3中实现对某一时间范围内的人体健康状态的量化预测,时间范围包括历史某一时间范围数据,当前时刻和历史某一时刻之间的时间范围,当前时刻和未来某一时刻之间的时间范围,以及未来某一时间范围。In an example of the present invention, wherein, in the step 3, the quantitative prediction of the human health state within a certain time range is implemented, and the time range includes historical data in a certain time range, and the data between the current moment and a certain historical moment in history. The time range, the time range between the current moment and some time in the future, and the time range in the future.
相对于现有技术,本发明提出了一种全新的基于量子力学原理的人体健康状态预测方法,通过采集强相关数据和弱相关数据,采用近似连续求导的方法,建立强相关数据和弱相关数据与一维线性谐振子参数之间的内在联系,求出一维线性谐振子量子态波函数参数;根据确定的波函数参数,利用定态薛定谔方程,求出一维线性谐振子量子态波函数;通过对位置坐标轴进行分段,使得一维线性谐振子波函数被相应划分为若干区间,并求出各分段区间内的波函数概率密度函数的积分值,得到一维线性谐振子处在各分段区间的概率,最终实现对某一时间范围内的人体健康状态的量化预测。Compared with the prior art, the present invention proposes a brand-new method for predicting the health state of the human body based on the principle of quantum mechanics. According to the intrinsic relationship between the data and the parameters of the one-dimensional linear harmonic oscillator, the quantum state wave function parameters of the one-dimensional linear harmonic oscillator are obtained; according to the determined wave function parameters, the steady-state Schrödinger equation is used to obtain the one-dimensional linear harmonic oscillator quantum state wave function; by segmenting the position coordinate axis, the one-dimensional linear harmonic oscillator wave function is divided into several intervals, and the integral value of the probability density function of the wave function in each segmented interval is obtained, and the one-dimensional linear harmonic oscillator is obtained. The probability of being in each segment interval can finally realize the quantitative prediction of human health status within a certain time range.
另一方面,相对于现有技术,本发明提出的一种全新的基于量子力学原理的人体健康状态预测方法,对强相关数据和弱相关数据的求导操作包括对强相关数据和弱相关数据的一阶求导、二阶求导或多阶求导,或各阶求导方式之间的线性组合、者非线性组合、数学方程等,这样可以模拟复杂疾病发展模型和多种内外因诱发疾病的模型,相较于当前大部分疾病预测模型只能对单一疾病预测而言,该方法能够在理论上实现对多种疾病的预测。On the other hand, compared with the prior art, the present invention proposes a brand-new method for predicting human health state based on the principle of quantum mechanics. The derivation operation for strongly correlated data and weakly correlated data includes the First-order derivation, second-order derivation or multi-order derivation, or linear combination, nonlinear combination, mathematical equation, etc. Compared with most current disease prediction models that can only predict a single disease, this method can theoretically predict multiple diseases.
此外,相对于现有技术,本发明提出的一种全新的基于量子力学原理的人体健康状态预测方法采用求导的方式,减少对大数据和算法训练的依靠,只需要对实时数据进行求导分析,就能够推算出预测结果,大大减少时间计算复杂度和空间计算复杂度,能够广泛应用于小型、微型化电子设备,如移动智能终端、可穿戴设备等,扩展了该方法的实际应用场景,能够降低企业和用户获取健康预测数据的成本,较人工智能算法而言,未来更具发展前景。In addition, compared with the prior art, a brand-new method for predicting human health state based on the principle of quantum mechanics proposed by the present invention adopts the method of derivation, which reduces the dependence on big data and algorithm training, and only needs to be derived from real-time data. After analysis, the prediction results can be calculated, which greatly reduces the time and space calculation complexity, and can be widely used in small and miniaturized electronic devices, such as mobile smart terminals, wearable devices, etc., which expands the practical application scenarios of this method. , which can reduce the cost of obtaining health prediction data for enterprises and users, and has more development prospects in the future than artificial intelligence algorithms.
附图说明Description of drawings
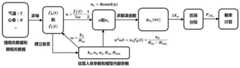
图1为本发明提供的一种人体健康状态的量子预测方法的一个实例原理说明图。FIG. 1 is a schematic diagram illustrating an example of a quantum prediction method of a human body health state provided by the present invention.
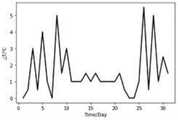
图2为本发明提供的一个实例中广州市2018年1月份每日气温差值绝对值折线图。FIG. 2 is a line graph of the absolute value of the daily temperature difference in Guangzhou in January 2018 in an example provided by the present invention.
图3本发明提供的一个实例中在温度差、心率差相同情况下计算结果为“异常”状态的概率(Hin=65)Fig. 3 In an example provided by the present invention, in the case of the same temperature difference and the same heart rate difference, the calculation result is the probability of an "abnormal" state (Hin =65)
图4本发明提供的一个实例中在温度差、心率差相同情况下计算结果为“异常”状态的概率(Hin=70)Fig. 4 In an example provided by the present invention, the calculation result is the probability of an "abnormal" state (Hin =70) when the temperature difference and the heart rate difference are the same
图5本发明提供的一个实例中在温度差、心率差相同情况下计算结果为“异常”状态的概率(Hin=75)Fig. 5 In an example provided by the present invention, the calculation result is the probability of an "abnormal" state (Hin =75) when the temperature difference and the heart rate difference are the same
图6本发明提供的一个实例中在温度差、心率差相同情况下计算结果为“异常”状态的概率(Hin=80)Fig. 6 In an example provided by the present invention, in the case of the same temperature difference and the same heart rate difference, the calculation result is the probability of an "abnormal" state (Hin =80)
具体实施方式Detailed ways
以下描述用于解释本发明提出之方法以便于本领域专业人士能够实现本发明得到的结果。以下描述中的案例只是作为一种举例,本领域专业人士可以根据此方法选取不同的数据类型进行求导操作得到其他预测模型。在以下之描述中所涉及的本发明的基本原理可以应用于其他实施方法和改进方法等包含本发明原理和思想的其他技术方法。The following description is used to explain the method proposed by the present invention so that those skilled in the art can realize the results obtained by the present invention. The case in the following description is only an example, and professionals in the field can select different data types to perform derivation operations to obtain other prediction models according to this method. The basic principles of the present invention referred to in the following description can be applied to other technical methods including the principles and ideas of the present invention, such as other implementation methods and improvement methods.
本发明实施实例提供了一种人体健康状态的量子预测方法,该方法通过收集强相关数据和弱相关数据,对强相关数据和弱相关数据进行求导操作,建立强相关数据和弱相关数据与一维线性谐振子参数之间的关系式,进而确定谐振子参数,根据确定的参数求解一维线性谐振子的量子态本征波函数;对位置坐标轴进行分段,使得一维线性谐振子波函数被相应划分为若干区间,并求出各分段区间内的波函数概率密度函数的积分值,得到一维线性谐振子处在各分段区间的概率。An example of the present invention provides a quantum prediction method for human health status. The method collects strong correlation data and weak correlation data, performs derivation operation on the strong correlation data and weak correlation data, and establishes the correlation between the strong correlation data and the weak correlation data. The relationship between the parameters of the one-dimensional linear harmonic oscillator, and then determine the harmonic oscillator parameters, and solve the quantum state eigenwave function of the one-dimensional linear harmonic oscillator according to the determined parameters; segment the position coordinate axis, so that the one-dimensional linear harmonic oscillator The wave function is correspondingly divided into several intervals, and the integral value of the probability density function of the wave function in each subsection is obtained, and the probability of the one-dimensional linear harmonic oscillator in each subsection is obtained.
在本实例中,选取每日外界气温值作为弱相关数据,用符号T表示,选取每日人体心率值作为强相关数据,用符号H表示,其中:In this example, the daily outside air temperature value is selected as the weak correlation data, which is represented by the symbol T, and the daily human heart rate value is selected as the strong correlation data, which is represented by the symbol H, wherein:
每日外界气温值可以通过用户当地气象信息网站或手机天气预报应用程序等方式获取,以当日最高气温和最低气温取平均作为当日外界气温值;The daily outside air temperature value can be obtained through the user's local weather information website or mobile weather forecast application, etc., and the average of the day's highest temperature and lowest temperature is taken as the day's outside air temperature value;
每日人体心率值可以通过智能可穿戴设备或到医院进行测量等方式记录获得,以人体在静止休息状态下的心率作为当日人体心率值。The daily human heart rate value can be recorded and obtained by means of smart wearable devices or measurement in the hospital, and the human heart rate in the state of rest and rest is taken as the human heart rate value of the day.
在获得每日外界气温值和每日人体心率值后,分别采取求导的方式进行数据处理,其中:After obtaining the daily outside air temperature value and the daily human heart rate value, the derivation method is used for data processing, wherein:
通过对第i日外界气温值Ti和前一日外界气温值Ti-1作差值绝对值计算,得到气温差值绝对值ΔT=|Ti-Ti-1|;By calculating the absolute value of the difference between the outside air temperature value T i on the ith day and the outside air temperature value Ti-1 on the previous day, the absolute value of the temperature difference value ΔT=|Ti -Ti-1 | is obtained;
通过对第i日人体心率值Hi和前一日人体心率值Hi-1作差值绝对值计算,得到心率差值绝对值ΔH=|Hi-Hi-1|;By calculating the absolute value of the difference between the human heart rate value H i on the ith day and the human heart rate value Hi-1 on the previous day, the absolute value of the heart rate difference ΔH=|Hi -Hi-1 | is obtained;
由于在实际情况中,可以将不同时间间隔内的强相关数据和弱相关数据的差值作为近似连续求导值,因此可以得到在一天为时间间隔的外界气温值关于时间的导数f′T(t)=ΔT=|Ti-Ti-1|,一天为时间间隔的心率值关于时间的导数f′H(t)=ΔH=|Hi-Hi-1|。In practice, the difference between the strongly correlated data and the weakly correlated data in different time intervals can be used as an approximate continuous derivative value, so the derivativef'T of the outside air temperature value with respect to time at a time interval of one day can be obtained ( t)=ΔT=|Ti -Ti-1 |, the derivative of the heart rate value with respect to time for a time interval of one day f'H (t)=ΔH=|Hi -Hi-1 |.
在本实例中,用采集或获取的强相关数据和弱相关数据,采取求导的方式,估算出一维线性谐振子量子态波函数参数,随后列出一维线性谐振子本征态波函数的定态薛定谔方程:


进一步地,求解上述方程,得到一维线性谐振子波函数的一般表示形式:
上式中,


很明显,只要确定α和n的值,即可确定一维线性谐振子波函数
本实例中,建立温度关于时间的导数和能量本征值E之间的函数关系:


本实例中,令


上式中,a1、a2为权重因子,用于修正谐振系数k,Hlim为截止心率,截止心率是个人所处其年龄段的心率值范围的一个基准参数。通常而言,正常人静息状态下心率一般为60-100次/分钟,可因年龄、性别或其他生理因素产生个体差异。一般来说,年龄越小,心率越快,老年人心跳比年轻人慢,女性的心率比同龄男性快。静息状态下,成人正常心率为60-100次/分钟,理想心率应为55-70次/分钟,运动员的心率较普通成人偏慢,一般为50次/分钟左右。据此,截止心率Hlim可以定义为心率范围内的下限值,且固有心率Hin和截止心率之间的关系为:Hin>Hlim。In the above formula, a1 and a2 are weight factors used to correct the resonance coefficient k, and Hlim is the cut-off heart rate, which is a reference parameter for the range of heart rate values in the age group of the individual. Generally speaking, the resting heart rate of a normal person is generally 60-100 beats/min, and individual differences may occur due to age, gender or other physiological factors. Generally speaking, the younger the age, the faster the heart rate, the heart rate of the elderly is slower than that of the young, and the heart rate of women is faster than that of men of the same age. In the resting state, the normal heart rate of adults is 60-100 beats/min, and the ideal heart rate should be 55-70 beats/min. The heart rate of athletes is slower than that of ordinary adults, generally about 50 beats/min. Accordingly, the cut-off heart rate Hlim can be defined as the lower limit value within the heart rate range, and the relationship between the intrinsic heart rate Hin and the cut-off heart rate is: Hin >Hlim .
进一步地,根据求导得到的f′H(t)和f′T(t)的值及设置参数a1、a2、Hin、Hlim的值,最终确定一维线性谐振子波函数的两个重要参数nr和α,进而求出表达式
求出
根据量子力学中一维线性谐振子的特性,可以对一维线性谐振子波函数概率密度函数进行分段积分,得到未来一段时间范围内波函数

上述说明的本实例的具体实施方式和原理流程详见图1。The specific implementation and principle flow of the present example described above are detailed in FIG. 1 .
进一步地,图1所述的内容可通过手机应用程序,或桌面应用程序等软件方式实现。图1涉及到的硬件部分可通过以下所述设备中的一种或多种实现:各类专用传感器,各类智能穿戴设备,移动智能终端,各类计算机设备等。图1涉及到的数据存储与管理相关功能可通过数据库管理系统及相关应用程序实现。Further, the content described in FIG. 1 may be implemented by software such as a mobile phone application or a desktop application. The hardware part involved in FIG. 1 can be implemented by one or more of the following devices: various types of dedicated sensors, various types of smart wearable devices, mobile smart terminals, various types of computer equipment, and the like. The data storage and management related functions involved in Figure 1 can be implemented through a database management system and related applications.
本实例中,利用计算机语言Python编写代码对所述实例进行建模。需要说明的是,本发明实施的实例所依赖的计算机语言可以是多种的,包括但不限于Python,Matlab,Java,C++,C语言及其衍生分支语言等,但其核心程序代码必须遵循权利要求中所述的原理步骤进行设计。In this instance, the computer language Python is used to write code to model the instance. It should be noted that the examples of the present invention may rely on a variety of computer languages, including but not limited to Python, Matlab, Java, C++, C language and its derivative branch languages, etc., but its core program code must comply with the rights Design according to the principle steps described in the requirements.
首先,采集外界气温值数据,数据来源为中国气象局历史记录。以广州市2018年1月份气象数据为实验数据,其具体每日气温记录详见表1。First of all, collect the data of outside temperature value, the data source is the historical records of the China Meteorological Administration. Taking the meteorological data of Guangzhou in January 2018 as the experimental data, the specific daily temperature records are shown in Table 1.
表1广州市2018年1月份气象数据Table 1 Guangzhou meteorological data in January 2018
对上述数据进行求导,计算得到f′T(t)的值,具体见表2。The above data are derived, and the value of f'T (t) is obtained by calculation, as shown in Table 2 for details.
表2广州市2018年1月份每日气温差值绝对值。Table 2 The absolute value of the daily temperature difference in Guangzhou in January 2018.
根据表2的数据,绘制广州市2018年1月份每日气温差值绝对值折线图,详见图2。According to the data in Table 2, draw a line chart of the absolute value of the daily temperature difference in Guangzhou in January 2018, see Figure 2 for details.
很明显,根据图2可得:在1月4日至1月5日期间,气温下降幅度达到4℃,1月7日至1月8日气温下降幅度达到5℃,1月25日至1月26日气温下降幅度达到5.5℃,1月27日至1月28日气温下降幅度达到5℃,此处说述气温下降幅度即温度关于时间的导数f′T(t)。Obviously, according to Figure 2, it can be obtained: from January 4 to January 5, the temperature drop reached 4 °C, from January 7 to January 8, the temperature dropped to 5 °C, and from January 25 to 1 The temperature drop on January 26 reached 5.5℃, and from January 27th to January 28th, the temperature drop reached 5℃. The temperature drop is described here, that is, the derivative of temperature with respect to time, f′T (t).
进一步地,根据温度值关于时间的导数和能量本征值E之间的函数关系:
根据图2的数据结果,可以发现,f′T(t)的值有0.0,0.5,1.0,1.5,2.5,3.0,4.0,5.0,5.5共9种,其计算求得的nr值分别对应详见表3。According to the data results in Figure 2, it can be found that the values of f'T (t) are 0.0, 0.5, 1.0, 1.5, 2.5, 3.0, 4.0, 5.0, 5.5, a total of 9 types, and the calculated nr values correspond to See Table 3 for details.
表3不同的f′T(t)对应的nr取值。The values of nr corresponding to different f'T (t) in Table 3.

同时,采集人体心率数据。在本实例中,暂不考虑运动员心率值的范围。在实际情况下,人体每日心率值变化范围不会过大。基于此,采用Python随机数生成的方式,让人体每日心率值生成范围在56-60次/分钟。At the same time, the human heart rate data is collected. In this example, the range of athlete's heart rate values is not considered for now. In actual situations, the variation range of the daily heart rate value of the human body will not be too large. Based on this, the random number generation method in Python is used to generate the daily heart rate value of the human body in the range of 56-60 beats/min.
根据本实例中心率值关于时间的导数和谐振系数k之间的函数关系:

表4不同的f′H(t)对应的α2取值Table 4 Values of α2 corresponding to different f'H (t)

进一步地,在确定nr和α的值后,对位置坐标轴进行分段,使得一维线性谐振子波函数被相应划分为若干区间。根据权利要求所述,量化细分区间的含义包括但不限于人体健康水平、身体体质、抵御不同程度疾病水平等。在本实例中,以人体健康水平作为量化细分区间的具体含义。按照降序的原则,令区间ΔX1∈[0,2)代表“健康”状态,区间ΔX2∈[2,3)代表“亚健康”状态,区间ΔX3∈[3,4)代表“不舒服”状态,区间ΔX4∈[4,5)为“生病”状态,区间ΔX5∈[5,10)为“病情加重”状态。对一维线性谐振子波函数概率密度函数进行分段积分,得到未来一段时间范围内波函数

表5不同温度差对应不同心率差(f′T(t)=0.0,0.5,1.0)情况下的健康概率预测(Hin=65)Table 5 Health probability prediction (Hin = 65) under different temperature differences corresponding to different heart rate differences (f'T (t) = 0.0, 0.5, 1.0)

表6不同温度差对应不同心率差(f′T(t)=1.5,2.5,3.0)情况下的健康概率预测(Hin=65)Table 6 Health probability prediction (Hin = 65) under different temperature differences corresponding to different heart rate differences (f'T (t) = 1.5, 2.5, 3.0)

表7不同温度差对应不同心率差(fT′(t)=0.0,0.5,1.0)情况下的健康概率预测(Hin=65)Table 7 Health probability prediction (Hin = 65) in the case of different temperature differences corresponding to different heart rate differences (fT′ (t) = 0.0, 0.5, 1.0)

需要说明的是,求得的“不舒服”状态概率仅为区间ΔX3∈[3,4)内的波函数概率密度积分,求得的“生病”状态概率仅为区间ΔX3∈[4,5)内的波函数概率密度积分,求得的“病情加重”状态概率仅为区间ΔX3∈[5,10)内的波函数概率密度积分,“生病”状态不包括“病情加重”状态,“不舒服”状态实际意义代表人体感到不舒服但未达到生病的程度,“生病”状态实际意义代表人体已经生病但未达到重病的程度。It should be noted that the obtained "uncomfortable" state probability is only the probability density integral of the wave function in the interval ΔX3 ∈ [3,4), and the obtained "sick" state probability is only the interval ΔX3 ∈ [4, 5), the obtained probability of the “sick” state is only the probability density integral of the wave function in the interval ΔX3 ∈ [5,10), and the “sick” state does not include the “sick” state, The actual meaning of the "uncomfortable" state means that the human body feels uncomfortable but has not reached the level of being sick, and the actual meaning of the "sick" state means that the human body is sick but has not reached the level of serious illness.
通过计算分析可知,Hin固定时,当f′H(t)的值大于3时,“不舒服”状态、“生病”状态、“病情加重”状态的概率都呈下降态势,当f′H(t)的值在0至2的范围内变化时,“不舒服”状态、“生病”状态、“病情加重”状态的概率值均变化。将“不舒服”状态、“生病”状态、“病情加重”状态这三种状态作为“异常”状态归类,则当一维线性谐振子本征能量能级nr越大时,“异常”状态的概率值有增加的趋势。Through calculation and analysis, it can be seen that when Hin is fixed, when the value of f'H (t) is greater than 3, the probability of "uncomfortable" state, "sick" state and "sick" state all show a downward trend. When f'H When the value of (t) is changed in the range of 0 to 2, the probability values of the "uncomfortable" state, the "sick" state, and the "sickness" state all change. The three states of "uncomfortable", "sick" and "exacerbated" are classified as "abnormal" states, then when the intrinsic energy level nr of the one-dimensional linear harmonic oscillator is larger, the "abnormal" state The probability value of the state has a tendency to increase.
现在对不同的固定值Hin进行计算对比,分析“异常”状态的概率情况。令Hin分别为70和80,则通过上述模型运行,得到结果如表8至表9所示。Now calculate and compare different fixed values of Hin to analyze the probability of an "abnormal" state. Let Hin be 70 and 80 respectively, then run through the above model, and the results are shown in Tables 8 to 9.
表8不同温度差对应不同心率差情况下的健康概率预测(Hin=70)Table 8 Health probability prediction under different temperature differences corresponding to different heart rate differences (Hin = 70)

表9不同温度差对应不同心率差情况下的健康概率预测(Hin=80)Table 9 Health probability prediction under different temperature differences corresponding to different heart rate differences (Hin = 80)

通过计算分析可知,每日温差绝对值f′T(t)相同时,人体固有心率Hin越大,nr越大;且同样地,当f′H(t)的值大于3时,“异常”状态的概率呈下降态势,当f′H(t)的值在0至2的范围内变化时,“异常”状态的概率值均变化。进一步地,讨论每日温差绝对值f′T(t)和每日心率差绝对值f′H(t)均相同时,不同Hin对应的健康概率具体情况见表10至表12。Through calculation and analysis, it can be seen that when the absolute value of the daily temperature difference f'T (t) is the same, the greater the human body's inherent heart rate Hin , the greater the nr ; and similarly, when the value of f'H (t) is greater than 3, " The probability of the "abnormal" state shows a downward trend. When the value off'H (t) changes in the range of 0 to 2, the probability value of the "abnormal" state changes. Further, when it is discussed that the absolute value of the daily temperature difference f'T (t) and the absolute value of the daily heart rate difference f'H (t) are the same, the specific conditions of the health probability corresponding to different Hin are shown in Table 10 to Table 12.
表10温度差绝对值不同、心率差绝对值相同(f′H(t)=1)的情况下的健康概率预测(Hin不同)Table 10 Health probability prediction (different Hin ) when the absolute value of the temperature difference is different and the absolute value of the heart rate difference is the same (f'H (t)=1)

表11温度差绝对值不同、心率差绝对值相同(f′H(t)=1)的情况下的健康概率预测(Hin不同)Table 11 Health probability prediction (different Hin ) when the absolute value of the temperature difference is different and the absolute value of the heart rate difference is the same (f'H (t)=1)

表12温度差绝对值不同、心率差绝对值相同(f′H(t)=2)的情况下的健康概率预测(Hin不同)Table 12 Health probability prediction (different Hin ) when the absolute value of the temperature difference is different and the absolute value of the heart rate difference is the same (f'H (t)=2)

根据上述表中的数据,绘制直方图,得到不同Hin对应的健康概率情况,详见图3至图6。According to the data in the above table, draw a histogram to obtain the health probability corresponding to different Hin , see Figure 3 to Figure 6 for details.
通过分析上述图表,可以发现:随着Hin的增加,模型的“异常”状态概率分布情况相似,“异常”状态概率受f′T(t)的影响程度要小于受f′H(t)的影响程度。另一方面,从图3至图6可知,f′T(t)越大,“异常”状态概率越大,f′H(t)越小,“异常”状态概率越大。By analyzing the above chart, it can be found that with the increase of Hin , the probability distribution of the "abnormal" state of the model is similar, and the probability of the "abnormal" state is less affected by f'T (t) than by f'H (t) degree of influence. On the other hand, it can be seen from Fig. 3 to Fig. 6 that the larger f'T (t) is, the greater the probability of "abnormal" state is, and the smaller f'H (t) is, the greater the probability of "abnormal" state is.
综上所述,该结果能够较好地对应实际情况:儿童的固有心率Hin相比较于年轻人而言会更高,且需要说明的是,此处及上文中提到的Hin并非固定不变的,而是在某一较长的时间段范围内可近似视作是稳定不变的,如30-40岁之间,40-50岁之间等年龄段范围内的Hin近似为平稳的。因此,儿童群体在遇到气温下降速率大的时间段时易患病。另一方面,无论Hin的取值范围如何,当f′T(t)越大时,f′H(t)越大,“异常”状态概率越小,其解释如下,心率随温度调节能力强的个人其对外界环境变化的适应能力更强,患病的风险也随之降低,即解释了冬春季节为流行病高发季节且的儿童以及抵抗力差的成年人和老年人为易感群体,本实例中得出的数据结果同实际情况符合较好。To sum up, this result can better correspond to the actual situation: the intrinsic heart rate Hin of children is higher than that of young people, and it should be noted that the Hin mentioned here and above is not fixed Invariant, but can be approximately regarded as stable in a longer period of time. For example, Hin in the age range of 30-40 years old and 40-50 years old is approximately stable. As a result, groups of children are susceptible to illness when they experience periods of high temperature drop. On the other hand, regardless of the value range of Hin , when f'T (t) is larger, f'H (t) is larger, and the probability of "abnormal" state is smaller, which is explained as follows, the ability of heart rate to adjust with temperature Strong individuals are more adaptable to changes in the external environment, and the risk of disease is also reduced, which explains that winter and spring are high epidemic seasons and children, adults and the elderly with poor resistance are susceptible groups. , the data results obtained in this example are in good agreement with the actual situation.
另一方面,根据《广州市2011-2018年流感样病例暴发疫情特征分析》中所述:“2011-2018年,广州市流感样病例暴发疫情共423起,总体呈上升趋势,疫情主要集中于3-6月(167起,39.48%),和12-1月(175起,41.37%)。疫情主要集中在小学(70.92%)和中学(15.37%)。B型流感209起,占49.41%,A(H1N1)pdm09型73起,占17.26%、A(H3N2)型72起,占17.02%。疫情持续时间与首发病例到介入疫情时间呈正相关,(Spearman相关系数为0.19,P0.01)。结论是2011-2018年广州市流感样病例暴发疫情主要集中在3-6月,但2017和2018连续两年的冬季出现第二个暴发疫情高峰,中、小学是高发场所。”由此可见,本实例中得出的数据结果也较好符合上述报告描述的流感暴发情况。On the other hand, according to "Analysis of Outbreak Characteristics of Influenza-like Cases in Guangzhou from 2011 to 2018": "From 2011 to 2018, there were 423 outbreaks of influenza-like cases in Guangzhou, showing an overall upward trend. March-June (167 cases, 39.48%), and December-January (175 cases, 41.37%). The epidemic is mainly concentrated in primary schools (70.92%) and middle schools (15.37%). Type B influenza 209 cases, accounting for 49.41% , A(H1N1)pdm09 type 73 cases, accounting for 17.26%, A(H3N2) type 72 cases, accounting for 17.02%. The duration of the epidemic is positively correlated with the time from the first case to the intervention of the epidemic, (Spearman correlation coefficient is 0.19, P<0.01) The conclusion is that the outbreak of influenza-like cases in Guangzhou from 2011 to 2018 was mainly concentrated in March to June, but the second peak of the outbreak occurred in the winter of 2017 and 2018 for two consecutive years, and middle and primary schools were the high-incidence places." It can be seen that , the data results obtained in this example are also better in line with the influenza outbreak described in the above report.
综合表1至表8及图2至图6的数据情况,可以得出结论:基于量子力学原理的人体健康状态预测方法能够量化体现人体健康状态概率,该基于量子力学原理的人体健康状态预测方法的实现了对弱相关数据(在本实例中是每日气温数据)和对强相关数据(在本实例中是每日心率数据)的求导操作,进而建立强相关数据和弱相关数据与一维线性谐振子参数之间的内在联系,在得到参数后对波函数概率密度进行分段积分求出人体“异常”状态概率。该方法中的模型具有很强的可调性,在于其强相关数据和弱相关数据的选取范围很广,能够反映不同的致病机理。此外,该方法中的求导操作可以根据实际需要进行变型,改变强相关数据和弱相关数据对一维线性谐振子波函数参数的影响程度,形成不同的情况。进一步地,对位置坐标轴量化分段操作的可调性很强,可以根据实际疾病的发展进程划分不同的人体状态区间,最终将波函数概率密度对应区间积分得到不同的概率结果。Combining the data in Tables 1 to 8 and Figures 2 to 6, it can be concluded that the human health state prediction method based on the principle of quantum mechanics can quantify the probability of human health state. The derivation operation of weak correlation data (in this example, daily temperature data) and strong correlation data (in this example, daily heart rate data) is realized, and then strong correlation data and weak correlation data are established with a The intrinsic relationship between the parameters of the dimensional linear harmonic oscillator is obtained. After the parameters are obtained, the probability density of the wave function is piecewise integrated to obtain the "abnormal" state probability of the human body. The model in this method has strong tunability, because it has a wide selection range of strong correlation data and weak correlation data, which can reflect different pathogenic mechanisms. In addition, the derivation operation in this method can be modified according to actual needs, changing the degree of influence of strongly correlated data and weakly correlated data on the parameters of the one-dimensional linear harmonic oscillator wave function to form different situations. Further, the quantification and segmentation of the position coordinate axis is highly adjustable, and different human body state intervals can be divided according to the actual development process of the disease, and finally different probability results can be obtained by integrating the corresponding interval of the probability density of the wave function.
可以理解,本发明专利中描述的一种基于量子力学原理的人体健康状态预测方法中的一个实例只是一种示范,具体实例的实施并不会受到严格限制,可以通过采集不同的强相关数据和弱相关数据,设置不同的求导形式、权重以及人体本征状态参数和不同的人体状态区间形成不同的变型。此处描述的变型和其他具体实施步骤其波函数必须是一维线性谐振子波函数,其波函数参数必须通过强相关数据和弱相关数据通过求导方式来确定。It can be understood that an example of a method for predicting human health state based on the principle of quantum mechanics described in the patent of the present invention is only a demonstration, and the implementation of the specific example is not strictly limited. Weak correlation data, set different derivation forms, weights, and human body eigenstate parameters and different human body state intervals to form different variants. The wave function of the variant and other specific implementation steps described here must be a one-dimensional linear harmonic wave function, and its wave function parameters must be determined by means of derivation from strongly correlated data and weakly correlated data.
根据本发明的另一方面,强相关数据和弱相关数据的采集方式是多样的,本发明中的一种实例是调取中国气象局历史数据作为每日气温数据。显然,每日气温数据可以是历史数据,也可以是当前数据甚至专业机构对未来情况的预测数据;心率数据的采集方式也可以是各类传感器、感应器、信号转换设备等电子设备。最终形成的人体“异常”状态概率可以是通过数据方式展示在屏显设备上,如移动智能终端、手机、个人计算机等,图表可以存储不显示,也可以随数据一并显示。According to another aspect of the present invention, the collection methods of strong correlation data and weak correlation data are various. One example of the present invention is to retrieve historical data of China Meteorological Administration as daily temperature data. Obviously, daily temperature data can be historical data, current data or even prediction data of future conditions by professional institutions; heart rate data can also be collected by various types of sensors, sensors, signal conversion equipment and other electronic equipment. The final probability of the "abnormal" state of the human body can be displayed on screen display devices by means of data, such as mobile smart terminals, mobile phones, personal computers, etc. The charts can be stored and not displayed, or can be displayed together with the data.
本领域的专业人士应该理解,上述描述及附图、表格所示的本发明的一个实例只是作为举例而不限制本发明,本发明的目的已经完整并有效地体现。本发明的技术原理和步骤已在本发明一个实例中进行详细的说明,在遵循原理步骤的前提下,可对本发明实施方式进行调整修改。Those skilled in the art should understand that an example of the present invention shown in the above description, drawings, and tables is only an example and does not limit the present invention, and the purpose of the present invention has been fully and effectively embodied. The technical principles and steps of the present invention have been described in detail in an example of the present invention. On the premise of following the principles and steps, the embodiments of the present invention may be adjusted and modified.
Claims (11)
Translated fromChinese


Priority Applications (1)
| Application Number | Priority Date | Filing Date | Title |
|---|---|---|---|
| CN202010509886.8ACN111640507B (en) | 2020-06-07 | 2020-06-07 | Quantum prediction method for human health state |
Applications Claiming Priority (1)
| Application Number | Priority Date | Filing Date | Title |
|---|---|---|---|
| CN202010509886.8ACN111640507B (en) | 2020-06-07 | 2020-06-07 | Quantum prediction method for human health state |
Publications (2)
| Publication Number | Publication Date |
|---|---|
| CN111640507A CN111640507A (en) | 2020-09-08 |
| CN111640507Btrue CN111640507B (en) | 2022-10-14 |
Family
ID=72333330
Family Applications (1)
| Application Number | Title | Priority Date | Filing Date |
|---|---|---|---|
| CN202010509886.8AExpired - Fee RelatedCN111640507B (en) | 2020-06-07 | 2020-06-07 | Quantum prediction method for human health state |
Country Status (1)
| Country | Link |
|---|---|
| CN (1) | CN111640507B (en) |
Families Citing this family (3)
| Publication number | Priority date | Publication date | Assignee | Title |
|---|---|---|---|---|
| US12093785B2 (en)* | 2020-11-13 | 2024-09-17 | Amazon Technologies, Inc. | High-fidelity measurement of bosonic modes |
| CN113593712B (en)* | 2021-08-10 | 2023-09-12 | 中国科学院科技战略咨询研究院 | Methods and devices for monitoring the impact of temperature rise on human health |
| CN116458872B (en)* | 2023-06-13 | 2023-09-05 | 汶上县人民医院 | Method and system for analyzing respiratory data |
Citations (3)
| Publication number | Priority date | Publication date | Assignee | Title |
|---|---|---|---|---|
| WO2007097224A1 (en)* | 2006-02-22 | 2007-08-30 | Osaka University | Quantum state estimation method, quantum state estimation device and computer program |
| CN103049804A (en)* | 2013-01-15 | 2013-04-17 | 西安交通大学 | Stock price trend prediction method based on quantum mechanics and social network |
| CN110046762A (en)* | 2019-04-12 | 2019-07-23 | 浙江工业大学 | A kind of bus passenger flow prediction technique based on cosmic string soul algorithm |
- 2020
- 2020-06-07CNCN202010509886.8Apatent/CN111640507B/ennot_activeExpired - Fee Related
Patent Citations (4)
| Publication number | Priority date | Publication date | Assignee | Title |
|---|---|---|---|---|
| WO2007097224A1 (en)* | 2006-02-22 | 2007-08-30 | Osaka University | Quantum state estimation method, quantum state estimation device and computer program |
| JPWO2007097224A1 (en)* | 2006-02-22 | 2009-07-09 | 国立大学法人大阪大学 | Quantum state estimation method, quantum state estimation device, and computer program |
| CN103049804A (en)* | 2013-01-15 | 2013-04-17 | 西安交通大学 | Stock price trend prediction method based on quantum mechanics and social network |
| CN110046762A (en)* | 2019-04-12 | 2019-07-23 | 浙江工业大学 | A kind of bus passenger flow prediction technique based on cosmic string soul algorithm |
Non-Patent Citations (1)
| Title |
|---|
| 量子力学哲理与中医具身临床思维的相关性研究;胡臻 等;《温州医科大学学报》;20170725(第07期);全文* |
Also Published As
| Publication number | Publication date |
|---|---|
| CN111640507A (en) | 2020-09-08 |
Similar Documents
| Publication | Publication Date | Title |
|---|---|---|
| US11755121B2 (en) | Gesture information processing method and apparatus, electronic device, and storage medium | |
| Yu et al. | Personalized health monitoring system of elderly wellness at the community level in Hong Kong | |
| Chiang et al. | Using wearables and machine learning to enable personalized lifestyle recommendations to improve blood pressure | |
| CN109805898B (en) | Critical death prediction method based on attention mechanism time sequence convolution network algorithm | |
| CN111640507B (en) | Quantum prediction method for human health state | |
| CN117558460B (en) | Chronic disease management method and system based on small sample learning and large language model | |
| Ba et al. | A data-driven machine learning integrated wearable medical sensor framework for elderly care service | |
| US12387847B2 (en) | Method and an apparatus for detecting a level of cardiovascular disease | |
| CN108847280A (en) | The smart cloud medical treatment real-time management system of case-based reasioning | |
| CN115862850B (en) | Modeling method and device of hepatocellular carcinoma monitoring model based on longitudinal multidimensional data | |
| US20230077726A1 (en) | Classification processing of an electrophysiological signal based on spatial locations of channels of the signal | |
| CN105718726A (en) | Medical auxiliary examination system knowledge acquisition and inference method based on rough set | |
| CN112992375A (en) | Early warning method, early warning device, equipment and medium for diseases | |
| CN118315024A (en) | Special medical food recommendation system and method based on artificial intelligence | |
| CN118692706A (en) | AI-based intelligent analysis system and method for urinary tract functional status | |
| CN112102939B (en) | Cardiovascular and cerebrovascular disease reference information prediction system, method and device and electronic equipment | |
| CN110176283A (en) | The associated chronic diseases management method of space-time big data, storage medium and terminal | |
| CN118039071A (en) | Health assessment method, device, equipment and storage medium based on metabolic model | |
| CN119446507A (en) | A patient pain prediction method and device based on wearable device | |
| Leitner et al. | Classification of patient recovery from COVID-19 symptoms using consumer wearables and machine learning | |
| CN108877932A (en) | Smart cloud medical method, computer readable storage medium and terminal | |
| Deeba et al. | Utilization of machine learning algorithms for prediction of diseases | |
| CN120183663A (en) | A personalized health management information recommendation method, system and electronic device | |
| Fu et al. | Dynamical differential covariance based brain network for motor intent recognition | |
| CN120183662A (en) | A method, system, electronic device and storage medium for generating health management suggestions |
Legal Events
| Date | Code | Title | Description |
|---|---|---|---|
| PB01 | Publication | ||
| PB01 | Publication | ||
| SE01 | Entry into force of request for substantive examination | ||
| SE01 | Entry into force of request for substantive examination | ||
| GR01 | Patent grant | ||
| GR01 | Patent grant | ||
| CF01 | Termination of patent right due to non-payment of annual fee | Granted publication date:20221014 | |
| CF01 | Termination of patent right due to non-payment of annual fee |