CN111580500B - Evaluation method for safety of automatic driving automobile - Google Patents
Evaluation method for safety of automatic driving automobileDownload PDFInfo
- Publication number
- CN111580500B CN111580500BCN202010391236.8ACN202010391236ACN111580500BCN 111580500 BCN111580500 BCN 111580500BCN 202010391236 ACN202010391236 ACN 202010391236ACN 111580500 BCN111580500 BCN 111580500B
- Authority
- CN
- China
- Prior art keywords
- gaussian
- clustering
- scene
- parameter
- test
- Prior art date
- Legal status (The legal status is an assumption and is not a legal conclusion. Google has not performed a legal analysis and makes no representation as to the accuracy of the status listed.)
- Active
Links
- 238000011156evaluationMethods0.000titleclaimsabstractdescription32
- 238000012360testing methodMethods0.000claimsabstractdescription101
- 238000000034methodMethods0.000claimsabstractdescription86
- 238000009826distributionMethods0.000claimsabstractdescription67
- 239000000203mixtureSubstances0.000claimsabstractdescription44
- 238000012545processingMethods0.000claimsabstractdescription42
- 239000006185dispersionSubstances0.000claimsabstractdescription18
- 238000004422calculation algorithmMethods0.000claimsdescription58
- 239000011159matrix materialSubstances0.000claimsdescription38
- 230000008569processEffects0.000claimsdescription35
- 238000004364calculation methodMethods0.000claimsdescription12
- 230000008859changeEffects0.000claimsdescription11
- 238000003064k means clusteringMethods0.000claimsdescription9
- 238000004088simulationMethods0.000claimsdescription7
- 238000012937correctionMethods0.000claimsdescription6
- 238000004458analytical methodMethods0.000claimsdescription4
- 238000010998test methodMethods0.000claimsdescription4
- 238000007476Maximum LikelihoodMethods0.000claimsdescription3
- 238000002759z-score normalizationMethods0.000claimsdescription3
- 238000013461designMethods0.000abstractdescription4
- 230000007547defectEffects0.000abstractdescription3
- 238000011076safety testMethods0.000abstract1
- 230000006870functionEffects0.000description18
- 238000010586diagramMethods0.000description6
- 238000010606normalizationMethods0.000description3
- 238000007619statistical methodMethods0.000description3
- 230000001133accelerationEffects0.000description2
- 230000008901benefitEffects0.000description2
- 230000006872improvementEffects0.000description2
- NAWXUBYGYWOOIX-SFHVURJKSA-N(2s)-2-[[4-[2-(2,4-diaminoquinazolin-6-yl)ethyl]benzoyl]amino]-4-methylidenepentanedioic acidChemical compoundC1=CC2=NC(N)=NC(N)=C2C=C1CCC1=CC=C(C(=O)N[C@@H](CC(=C)C(O)=O)C(O)=O)C=C1NAWXUBYGYWOOIX-SFHVURJKSA-N0.000description1
- 230000009286beneficial effectEffects0.000description1
- 238000013135deep learningMethods0.000description1
- 230000007812deficiencyEffects0.000description1
- 238000011161developmentMethods0.000description1
- 238000005516engineering processMethods0.000description1
- 238000012854evaluation processMethods0.000description1
- 238000004519manufacturing processMethods0.000description1
- 230000000717retained effectEffects0.000description1
- 238000009781safety test methodMethods0.000description1
- 238000012546transferMethods0.000description1
Images


Classifications
- G—PHYSICS
- G05—CONTROLLING; REGULATING
- G05B—CONTROL OR REGULATING SYSTEMS IN GENERAL; FUNCTIONAL ELEMENTS OF SUCH SYSTEMS; MONITORING OR TESTING ARRANGEMENTS FOR SUCH SYSTEMS OR ELEMENTS
- G05B23/00—Testing or monitoring of control systems or parts thereof
- G05B23/02—Electric testing or monitoring
- G05B23/0205—Electric testing or monitoring by means of a monitoring system capable of detecting and responding to faults
- G05B23/0218—Electric testing or monitoring by means of a monitoring system capable of detecting and responding to faults characterised by the fault detection method dealing with either existing or incipient faults
- G05B23/0243—Electric testing or monitoring by means of a monitoring system capable of detecting and responding to faults characterised by the fault detection method dealing with either existing or incipient faults model based detection method, e.g. first-principles knowledge model
- G—PHYSICS
- G05—CONTROLLING; REGULATING
- G05B—CONTROL OR REGULATING SYSTEMS IN GENERAL; FUNCTIONAL ELEMENTS OF SUCH SYSTEMS; MONITORING OR TESTING ARRANGEMENTS FOR SUCH SYSTEMS OR ELEMENTS
- G05B2219/00—Program-control systems
- G05B2219/20—Pc systems
- G05B2219/24—Pc safety
- G05B2219/24065—Real time diagnostics
Landscapes
- Physics & Mathematics (AREA)
- General Physics & Mathematics (AREA)
- Engineering & Computer Science (AREA)
- Automation & Control Theory (AREA)
- Information Retrieval, Db Structures And Fs Structures Therefor (AREA)
- Testing Of Devices, Machine Parts, Or Other Structures Thereof (AREA)
Abstract
Description
Translated fromChinese技术领域technical field
本发明属于自动驾驶汽车测试技术领域,涉及一种针对自动驾驶汽车安全性的评价方法,尤其涉及一种多维度测试场景下自动驾驶安全性的评价方法。The invention belongs to the technical field of automatic driving vehicle testing, and relates to an evaluation method for the safety of automatic driving vehicles, in particular to an evaluation method for automatic driving safety in a multi-dimensional test scenario.
背景技术Background technique
随着深度学习、云计算、大数据等技术的不断提高,实现自动驾驶汽车的量产已具备了技术可能性。由于自动驾驶在减少污染、提升安全、降低拥堵等方面的优势,自动驾驶已成为汽车产业的未来趋势。然而,如何保证自动驾驶汽车的安全性成为制约自动驾驶进一步发展的障碍。由于自动驾驶功能的不断提高,其可应用的场景逐渐变得复杂,影响自动驾驶安全性的因素也变得越来越多。With the continuous improvement of deep learning, cloud computing, big data and other technologies, it is already technically possible to realize the mass production of autonomous vehicles. Due to the advantages of autonomous driving in reducing pollution, improving safety, and reducing congestion, autonomous driving has become the future trend of the automotive industry. However, how to ensure the safety of autonomous vehicles has become an obstacle to the further development of autonomous driving. Due to the continuous improvement of automatic driving functions, its applicable scenarios have gradually become more complex, and there are more and more factors affecting the safety of automatic driving.
现有的自动驾驶测试多着重于测试方法,以发明专利《一种自动驾驶测试场景再现模拟方法、装置及系统》(申请号201910223012.3:)、发明专利《一种自动驾驶车辆测试仿真场景生成方法》(申请号:201910443763.6)、发明专利《一种自动驾驶仿真测试场景的生成方法及生成系统》(申请号:201910797521.7)这类测试方法类专利为例,其首先通过收集自动驾驶的行驶环境信息,然后分析其发生事故或存在危险的关键场景,提取场景中要素及参数变化范围,最后通过一定的装置及方法在仿真的环境中进行重现。Existing autonomous driving tests mostly focus on test methods, with the invention patent "A Method, Device and System for Reproducing Simulation of Autonomous Driving Test Scenarios" (Application No. 201910223012.3:) and the invention patent "A Method for Generating Simulation Scenarios for Automated Driving Vehicle Tests" "(application number: 201910443763.6), invention patent "A method and generation system for automatic driving simulation test scene" (application number: 201910797521.7) such test method patents as examples, which first collect the driving environment information of automatic driving , and then analyze the key scenes where accidents or dangers occur, extract the elements and parameter variation ranges in the scene, and finally reproduce them in the simulated environment through certain devices and methods.
这些相关专利对于如何评价其安全性则稍显薄弱,大多只分析了测试场景的生成方法,而对于后续如何评价自动驾驶的安全性未进行详细的描述。由于自动驾驶汽车应用场景的复杂性,使用简单的单一测试用例的通过性评价不能表现其整体性能,应基于统计数据的方式,从统计分析的角度出发,才能对其进行评价。These related patents are slightly weak on how to evaluate their safety. Most of them only analyze the generation method of test scenarios, but do not describe in detail how to evaluate the safety of autonomous driving in the future. Due to the complexity of the application scenarios of autonomous vehicles, the passability evaluation using a simple single test case cannot express its overall performance. It should be evaluated based on statistical data and from the perspective of statistical analysis.
发明内容SUMMARY OF THE INVENTION
为了解决现有评价方法的缺失,本发明提供一种自动驾驶汽车安全性评价方法。In order to solve the deficiencies of the existing evaluation methods, the present invention provides a safety evaluation method for an automatic driving vehicle.
本发明是采用如下技术方案实现的:The present invention adopts following technical scheme to realize:
一种针对自动驾驶汽车安全性的评价方法,用于测试和评价自动驾驶算法的安全性,基于一种基于场景的自动驾驶汽车测试方法,基于场景的测试方法根据客户需要自行选择自动驾驶汽车测试逻辑场景,按照被测算法的功能自行设定逻辑场景参数空间范围,考虑传感器精度、算法效率、算法精度、测试平台运行频率、测试平台性能将逻辑场景中的连续参数进行离散化处理获得具体测试用例,使用穷举法将得到的所有具体测试用例在仿真环境下进行测试,所有具体测试用例的试验结果中发生碰撞的情况所对应的具体测试用例参数形成数据集合X1,数据集合X1为一个数据矩阵,矩阵的每一行为一个具体测试用例所对应的一组场景要素参数,矩阵的每一列为一类场景要素参数的所有值,基于这种测试方法获得具体场景要素数据集合X1,本方法设定具体场景要素数据集合X1的数据处理流程并设定安全性评价指标,对自动驾驶汽车安全性进行评价,其特征在于,本方法的具体步骤如下:An evaluation method for the safety of autonomous vehicles, which is used to test and evaluate the safety of autonomous driving algorithms, based on a scenario-based testing method for autonomous vehicles, which selects autonomous vehicle testing based on customer needs Logic scenario, according to the function of the algorithm to be tested, set the parameter space range of the logic scenario, considering sensor accuracy, algorithm efficiency, algorithm accuracy, test platform operating frequency, and test platform performance to discretize the continuous parameters in the logic scene to obtain specific tests Use case, use the exhaustive method to test all the specific test cases obtained in the simulation environment, and the specific test case parameters corresponding to the collision in the test results of all specific test cases form a data set X1 , and the data set X1 is A data matrix, each row of the matrix is a set of scene element parameters corresponding to a specific test case, and each column of the matrix is all values of a class of scene element parameters, based on this test method, the specific scene element data set X1 is obtained, The method sets the data processing flow of the specific scene element data set X1 and sets the safety evaluation index to evaluate the safety of the autonomous vehicle. It is characterized in that the specific steps of the method are as follows:
步骤一、将具体场景要素数据集合X1按照如下数据处理流程进行处理:Step1 : Process the specific scene element data set X1 according to the following data processing flow:
将试验数据对称化处理:以所选逻辑场景的场景要素参数类型建立坐标系,各个坐标轴所对应的内容即为逻辑场景中不同的场景要素参数类型;逻辑场景中不同场景要素参数对应的参数空间均存在上限和下限,危险边界为理论情况下容易发生危险的参数空间位置的上限或下限;将具体场景要素数据集合X1在建立的坐标系下根据不同的场景要素危险边界数值形成的坐标轴按顺序进行对称化处理,即具体场景要素数据集合X1以列为单位发生改变,每次对称时发生对称的列以该类型参数的危险边界数值为对称轴产生新数据,其他未发生对称的列数值不变,其他未发生对称的列复制并且其数值按照之前的对应顺序与复制后的列形成新的对称后的数据;每次对称后将对称得到的新数据和原始数据一起作为下次对称的原始数据;对称化处理完成后得到对称化处理后的数据集合X2,X2的矩阵定义与X1相同;Symmetric processing of test data: establish a coordinate system based on the scene element parameter type of the selected logic scene, and the content corresponding to each coordinate axis is the different scene element parameter types in the logic scene; the parameters corresponding to different scene element parameters in the logic scene The space has an upper limit and a lower limit, and the danger boundary is the upper limit or lower limit of the parameter space location that is prone to danger under theoretical conditions; the specific scene element data set X1 is formed in the established coordinate system according to different scene element danger boundary values. The axes are symmetric in sequence, that is, the specific scene element data set X1 changes in units of columns, and the column that is symmetric each time it is symmetric takes the danger boundary value of the type of parameter as the symmetry axis to generate new data, and the other does not have symmetry. The values of the columns remain unchanged, and other non-symmetrical columns are copied and their values form new symmetrical data with the copied columns in the previous corresponding order; after each symmetry, the new data obtained by symmetry and the original data are used as the following Sub-symmetric original data; after the symmetric processing is completed, the symmetric processed data set X2 is obtained, and the matrix definition of X2 is the same as that of X1 ;
将对称化处理后的试验数据集合X2进行标准化处理,得到标准化处理后的坐标系中的试验数据集X:采用Z-score归一化方法对危险参数进行标准化处理,如式(1)所示:Standardize the test data set X2 after symmetric processing to obtain the test data set X in the coordinate system after standardization: use the Z-score normalization method to standardize the risk parameters, as shown in formula (1). Show:

式中,xf是标准化处理后的数据集合X的第f维参数列向量,bf是对称化处理后数据集合X2矩阵的第f维参数列向量,bf_mean是对称化处理后数据集合X2矩阵的第f维参数的均值,sf是对称化处理后数据集合X2矩阵的第f维参数的标准差,下角标f代表逻辑场景的第f个维度即X1矩阵的第f列也就是第f类场景要素,d为所选逻辑场景的变量维度总数即X1矩阵的列数也就是场景要素类型的数量;In the formula, xf is the f-th dimension parameter column vector of the standardized data set X, bf is the f-th dimension parameter column vector of the symmetric data set X2 matrix, and bf_mean is the symmetric processed data set. The mean value of the f-th dimension parameter of the X2 matrix, sf is the standard deviation of the f-th dimension parameter of the X2 matrix of the data set after symmetric processing, and the subscript f represents the f-th dimension of the logical scene, that is, the f-th dimension of the X1 matrix The column is the f-th type of scene element, and d is the total number of variable dimensions of the selected logical scene, that is, the number of columns of the X1 matrix, that is, the number of scene element types;
初步计算标准化处理后的坐标系中的试验数据集合X的聚类中心数目:采用计算组内残差平方和的方式计算危险参数聚类中心数量,组内残差平方和是指所有聚类中每个类内的要素距离其聚类中心的误差的平方的总和,如式(2)所示;采用K-means聚类方法对数据集合进行聚类,聚类中心g设置为1到10分别聚类10次,分别计算这10次聚类结果的组内残差平方和;当组内残差平方和变化速率变慢时,即认为增大聚类数目也不能对聚类结果进行有效的提高,该速率变化的拐点数即为聚类中心数目;Preliminarily calculate the number of cluster centers of the test data set X in the standardized coordinate system: calculate the number of risk parameter cluster centers by calculating the residual sum of squares within the group. The sum of the squares of the errors between the elements in each class and its cluster center is shown in formula (2); the K-means clustering method is used to cluster the data set, and the cluster center g is set to be 1 to 10, respectively

式中,Y为组内残差平方和,m为所有数据点的数量即标准化处理后的坐标系中的试验数据集合X的行数,x’为使用初步聚类得到的不同聚类的聚类中心;In the formula, Y is the residual sum of squares within the group, m is the number of all data points, that is, the number of rows of the experimental data set X in the coordinate system after standardized processing, and x' is the clustering of different clusters obtained by preliminary clustering. class center;
选择后续聚类方式:当计算得到的聚类中心只有一个时,使用单高斯模型聚类方法对试验数据进行聚类,当聚类中心存在多个时,使用高斯混合模型进行聚类;Select the subsequent clustering method: when there is only one cluster center calculated, use the single-Gaussian model clustering method to cluster the test data; when there are multiple cluster centers, use the Gaussian mixture model for clustering;
单高斯模型聚类:单高斯模型聚类方法的公式如(3)所示:Single Gaussian model clustering: The formula of the single Gaussian model clustering method is shown in (3):

式中,P(x|θs)为单一高斯模型概率密度函数,θs为高斯模型的参数,包括均值和标准差,Σ为用来描述各维变量相关度的协方差矩阵,μ为危险参数向量的均值,由于数据已经经过了对称化和标准化处理,所以若只存在单高斯型的情况下经过处理后分布的均值为0,标准差为1;In the formula, P(x|θs ) is the probability density function of a single Gaussian model, θs is the parameters of the Gaussian model, including the mean and standard deviation, Σ is the covariance matrix used to describe the correlation of each dimension variable, μ is the risk The mean value of the parameter vector, because the data has been symmetric and standardized, so if there is only a single Gaussian type, the mean value of the processed distribution is 0, and the standard deviation is 1;
高斯混合模型聚类:高斯混合模型聚类又名EM聚类算法,通过迭代进行E-step和M-step来获得如式(4)所示的高斯混合模型;Gaussian mixture model clustering: Gaussian mixture model clustering, also known as EM clustering algorithm, obtains the Gaussian mixture model shown in equation (4) by iteratively performing E-step and M-step;

式中,G(x|θ)为高斯混合模型概率密度函数,φ(x|θk)为高斯混合模型中的不同高斯分布,θ为高斯混合模型的参数,包括第k个单高斯模型的权重αk和模型参数θk,θk包括均值μk和标准差σk,K为单个高斯模型的总个数即计算得到的聚类中心数量;In the formula, G(x|θ) is the probability density function of the Gaussian mixture model, φ(x|θk ) is the different Gaussian distributions in the Gaussian mixture model, and θ is the parameter of the Gaussian mixture model, including the kth single Gaussian model. Weight αk and model parameters θk , θk includes mean μk and standard deviation σk , K is the total number of a single Gaussian model, that is, the number of calculated cluster centers;
统计得到的高斯模型参数:统计单高斯模型聚类或高斯混合模型聚类的聚类后的所有高斯分布的均值、标准差;Gaussian model parameters obtained by statistics: the mean and standard deviation of all Gaussian distributions after clustering of single Gaussian model clustering or Gaussian mixture model clustering;
删除因对称处理产生的多余高斯分布:删除除坐标原点位置处其他因对称处理产生的多余高斯分布,这些需要删除的多余的高斯分布的特点是均值存在对称、标准差相同,这类高斯分布只需要保留原始的一个;Delete the redundant Gaussian distribution caused by symmetrical processing: delete the redundant Gaussian distribution caused by symmetrical processing except for the position of the coordinate origin. The characteristics of these redundant Gaussian distributions that need to be deleted are that the mean value is symmetrical and the standard deviation is the same. This kind of Gaussian distribution only Need to keep the original one;
步骤二、确定自动驾驶安全性评价指标,定义逻辑场景中发生碰撞的具体测试用例参数聚类得到的连续分布参数范围即聚类得到的高斯分布范围为被测自动驾驶算法在该逻辑场景下的危险域,本方法提出的安全性评价指标包括危险域离散度、危险域范围和场景危险率:Step 2: Determine the self-driving safety evaluation index, and define the continuous distribution parameter range obtained by clustering the parameters of the specific test case that collides in the logical scenario, that is, the Gaussian distribution range obtained by clustering, which is the range of the tested self-driving algorithm in this logical scenario. Dangerous domain, the safety evaluation index proposed by this method includes the hazard domain dispersion, the hazard domain range and the scene hazard rate:
危险域离散度:本方法使用危险域离散度用来表示进行测试时发现危险的困难程度,包括两部分,一是不同危险域相对于逻辑场景中最危险边界点的距离,最危险边界点为给定的逻辑场景参数空间中各个参数维度的危险边界的交点,二是不同危险域之间的相对距离;由于数据经过对称化及标准化处理,逻辑场景中最危险边界点转化成为标准化处理后的坐标系内的坐标原点,不同聚类中心相对于标准化处理后的坐标系的坐标原点的欧氏距离db即为不同危险域相对于最危险边界点的距离;其他不同危险域之间的相对距离用类间距离ds表示,下标k表示不同的高斯分布,db-k为不同高斯分布的欧式距离,ds-k为不同高斯分布的类间距离,如式(5)和(6)所示;Danger domain dispersion: This method uses the danger domain dispersion to express the difficulty of finding danger during testing, including two parts, one is the distance between different danger domains relative to the most dangerous boundary point in the logic scene, the most dangerous boundary point is The intersection of the danger boundaries of each parameter dimension in the given logical scene parameter space, and the second is the relative distance between different danger domains; because the data is symmetric and standardized, the most dangerous boundary points in the logic scene are transformed into standardized ones. The coordinate origin in the coordinate system, the Euclidean distance db of different cluster centers relative to the coordinate origin of the standardized coordinate system is the distance between different danger areas relative to the most dangerous boundary point; the relative distance between other different danger areas The distance is represented by the inter-class distance ds , the subscript k represents different Gaussian distributions, dbk is the Euclidean distance of different Gaussian distributions, and dsk is the inter-class distance of different Gaussian distributions, as shown in equations (5) and (6) ;


式中,μk为聚类中心的位置即高斯分布的均值,μmean为除原点外的聚类中心的均值,下标k表示不同的聚类;In the formula, μk is the position of the cluster center, that is, the mean value of the Gaussian distribution, μmean is the mean value of the cluster center except the origin, and the subscript k represents different clusters;
第k个危险域的危险域离散度dh_k为:The hazard domain dispersion dh_k of the kth hazard domain is:
dh_k=a·db_k+c·ds_k (7)dh_k = a db_k + c ds_k (7)
式中,a和c均为权重系数,a和c的具体数值根据测试所选逻辑场景任意定义,a和c的和为1;In the formula, a and c are weight coefficients, the specific values of a and c are arbitrarily defined according to the logic scenario selected by the test, and the sum of a and c is 1;
危险域范围:本方法使用危险域范围作为自动驾驶安全性另一个评价指标,用来描述被测逻辑场景中发生碰撞的具体测试用例形成的连续分布的危险域的覆盖范围;危险域范围Sk综合考虑参数的危险程度及其分布范围,采用高斯分布标准差表示,第k个危险域的危险域范围Sk为:Dangerous domain range: This method uses the dangerous domain range as another evaluation index of automatic driving safety, which is used to describe the coverage of the continuous distribution of the dangerous domain formed by the specific test cases in which the collision occurs in the tested logic scenario; the dangerous domain range Sk Considering the risk degree of the parameter and its distribution range comprehensively, it is expressed by the standard deviation of Gaussian distribution, and the risk domain range Sk of the kth risk domain is:

式中,ω为不同维度参数的重要程度系数,σk为高斯分布的标准差,f代表逻辑场景的第f个维度即X1矩阵的第f列也就是第f类场景要素,ω采用层次分析法确定,通过建立参数判别矩阵并计算矩阵最大特征值和其对应的加权向量,在检验经过一致性通过后,最大特征值对应的加权向量即为不同参数的重要程度ω;In the formula, ω is the importance coefficient of different dimension parameters, σk is the standard deviation of the Gaussian distribution, f represents the f-th dimension of the logical scene, that is, the f-th column of the X1 matrix is the f-th type of scene element, and ω adopts the level The analysis method determines that by establishing a parameter discrimination matrix and calculating the maximum eigenvalue of the matrix and its corresponding weighted vector, after the consistency test is passed, the weighted vector corresponding to the maximum eigenvalue is the importance of different parameters ω;
场景危险率:本方法将危险域离散度和危险域范围两个指标进行耦合,建立可量化的聚类评价指标——场景危险率Rd;Scenario hazard rate: This method couples the two indicators of hazard domain dispersion and hazard domain range, and establishes a quantifiable clustering evaluation index—scenario hazard ratio Rd ;
场景危险率Rd如式(9)所示:The scene hazard rate Rd is shown in formula (9):

式中,S1为标准化处理后的坐标系中的坐标原点处的危险域范围,Smin为理论最小危险域范围,即在给定场景下,假设自动驾驶汽车以理想状态进行操作计算得到的危险域范围,该计算流程与公式(1)至(8)的流程相同且为保证数据的可比性,计算Smin值的标准化过程即公式(1)时,其标准化过程应将理想危险参数映射到测试危险参数域进行修正,修正过程如(10)所示:In the formula, S1 is the range of the danger zone at the origin of the coordinates in the standardized coordinate system, and Smin is the range of the theoretical minimum danger zone, that is, in a given scenario, assuming that the autonomous vehicle operates in an ideal state. The scope of the hazard domain, the calculation process is the same as the process of formulas (1) to (8) and in order to ensure the comparability of the data, when the standardization process for calculating the Smin value is the formula (1), the standardization process should map the ideal hazard parameters. Go to the test hazard parameter domain for correction, and the correction process is shown in (10):

式中sk_v为理论最优算法数据处理计算标准化过程中使用的标准差参数即具体场景要素数据集合X1不同列数值的标准差,sk_t为被测算法试验结果在标准化过程中使用的标准差参数即理想情况测试结果中发生碰撞的具体场景要素数据集合不同列数值的标准差;In the formula, sk_v is the standard deviation parameter used in the standardization process of the theoretical optimal algorithm data processing calculation, that is, the standard deviation of different column values of the specific scene element data set X1 , and sk_t is the standard used in the standardization process of the test results of the algorithm under test. The difference parameter is the standard deviation of the different column values of the specific scene element data set that collides in the ideal test result;
由式(9)可知,场景危险率Rd的值越小,则表示所测试的自动驾驶算法在给定的多维度逻辑场景下安全性越好,其下限值为1,如果场景危险率Rd的值超过1.5,则表示所测试的自动驾驶算法的安全性就比较差,需要进一步优化。It can be seen from formula (9) that the smaller the value of the scene hazard rate Rd , the better the safety of the tested automatic driving algorithm in the given multi-dimensional logic scene, and its lower limit is 1. If the scene hazard rate is If the value of Rd exceeds 1.5, it means that the safety of the tested automatic driving algorithm is relatively poor and needs to be further optimized.
进一步的技术方案包括:Further technical solutions include:
高斯混合模型聚类的具体过程为:The specific process of Gaussian mixture model clustering is as follows:
高斯混合模型聚类别称为EM聚类算法,其将数据参数集合分解为多个高斯概率密度函数分布组成的模型,如公式(4)所示:The Gaussian mixture model clustering category is called the EM clustering algorithm, which decomposes the data parameter set into a model composed of multiple Gaussian probability density function distributions, as shown in formula (4):

式中,G(x|θ)为高斯混合模型概率密度函数,φ(x|θk)为高斯混合模型中的不同高斯分布,θ为高斯混合模型的参数,包括第k个单高斯模型的权重αk和模型参数θk,θk包括均值μk和标准差σk,K为单个高斯模型的个数;In the formula, G(x|θ) is the probability density function of the Gaussian mixture model, φ(x|θk ) is the different Gaussian distributions in the Gaussian mixture model, and θ is the parameter of the Gaussian mixture model, including the kth single Gaussian model. Weight αk and model parameters θk , θk includes mean μk and standard deviation σk , K is the number of a single Gaussian model;
通过极大似然法对θ进行估计:Estimate θ by maximum likelihood:
θ*=argmaxL(θ) (11)θ* = argmaxL(θ) (11)

应用迭代算法对上式进行求解,EM算法的E-step为计算Q函数,Q函数代表给定第p轮迭代的参数θp之后高斯混合模型G(x|θp)与给定数据之间的相似程度,如公式(13)所示;The iterative algorithm is used to solve the above formula. The E-step of the EM algorithm is to calculate the Q function. The Q function represents the difference between the Gaussian mixture model G(x|θp ) and the given data after the parameter θp of thep -th iteration is given. The similarity degree of , as shown in formula (13);

式中,

EM算法中的M-step为最大化Q函数,当计算第(p+1)步的参数θp+1时,对第p步的αk、μk、σk求偏导并使其等于0,就可以使得Q函数极大化;The M-step in the EM algorithm is to maximize the Q function. When calculating the parameter θp+1 of the (p+1)th step, the partial derivatives of αk , μk , and σk of the pth step are calculated and made equal to 0, the Q function can be maximized;
重复进行EM算法的E-step和M-step直至模型收敛即可得到高斯混合模型G(x|θ),即为所求的高斯混合模型。Repeat the E-step and M-step of the EM algorithm until the model converges to obtain the Gaussian mixture model G(x|θ), which is the required Gaussian mixture model.
K-means聚类算法的过程如下:The process of K-means clustering algorithm is as follows:
(1)自行确定g值,即希望得到的聚类数量,本方法中g的值设定为1到10;(1) Determine the g value by yourself, that is, the desired number of clusters, the value of g in this method is set to 1 to 10;
(2)从数据集合X2中随机选择g个数据点作为聚类中心;(2) randomly select g data points from the data set X2 as the cluster centers;
(3)对数据集X2中每一个点,计算其与每一个聚类中心的欧式距离,将其划分到欧式距离最近的聚类中心所属的聚类;(3) For each point in the data set X2 , calculate the Euclidean distance between it and each cluster center, and divide it into the cluster to which the nearest cluster center belongs to the Euclidean distance;
(4)将所有数据归好聚类后,共有g个聚类,重新计算这g个聚类的聚类中心;(4) After classifying all data into clusters, there are g clusters in total, and the cluster centers of these g clusters are recalculated;
(5)如果新计算出来每个聚类的聚类中心和原来选择的各个聚类的聚类中心之间的欧式距离小于等于设置的阈值,则表示重新计算的质心的位置变化不大,结果收敛,即聚类已经达到期望的结果,算法终止;(5) If the Euclidean distance between the newly calculated cluster center of each cluster and the originally selected cluster center is less than or equal to the set threshold, it means that the position of the recalculated centroid does not change much, and the result Convergence, that is, the clustering has reached the desired result, and the algorithm terminates;
(6)如果新计算出来每个聚类的聚类中心和原来选择的各个聚类的聚类中心之间的欧式距离大于设置的阈值,则表示算法结果差,将新计算得到的聚类中心作为初始聚类中心,重新进行3-5步。(6) If the Euclidean distance between the newly calculated cluster center of each cluster and the previously selected cluster center is greater than the set threshold, it means that the algorithm result is poor, and the newly calculated cluster center As the initial cluster center, repeat steps 3-5.
与现有技术相比本发明的有益效果是:Compared with the prior art, the beneficial effects of the present invention are:
本发明提供的一种针对自动驾驶汽车安全性的评价方法,可充分考虑自动驾驶汽车在真实环境行驶时的统计学规律,不但可以描述发现自动驾驶汽车设计缺陷的困难程度,还可以描述自动驾驶汽车设计缺陷的影响范围,并能通过量化的方式描述自动驾驶汽车在逻辑场景中的安全性。该评价方法可以满足自动驾驶评价领域对自动驾驶汽车安全性评价的需求,具有广泛的应用前景。The method for evaluating the safety of an autonomous vehicle provided by the present invention can fully consider the statistical laws of the autonomous vehicle when driving in a real environment, and can not only describe the difficulty of finding the design defects of the autonomous vehicle, but also The scope of impact of vehicle design flaws and the ability to quantify the safety of autonomous vehicles in logical scenarios. The evaluation method can meet the needs of self-driving car safety evaluation in the field of self-driving evaluation, and has broad application prospects.
附图说明Description of drawings
下面结合附图对本发明作进一步的说明:Below in conjunction with accompanying drawing, the present invention is further described:
图1为本发明提供的一种针对自动驾驶汽车安全性的评价方法的流程框图;1 is a flowchart of a method for evaluating the safety of an autonomous vehicle provided by the present invention;
图2为本发明实施例提供的本方法步骤一的数据处理流程示意图;2 is a schematic diagram of a data processing flowchart of
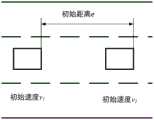
图3为本发明实施例提供的一种被测逻辑场景的示意图;3 is a schematic diagram of a tested logic scenario provided by an embodiment of the present invention;
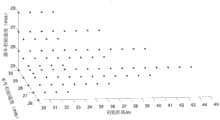
图4为本发明实施提供的一种该测试场景下某种自动驾驶算法的试验结果图;4 is a test result diagram of a certain automatic driving algorithm under the test scenario provided by the implementation of the present invention;
图5为将图三中的实验结果经过本发明实施提供的数据处理所得到的结果示意图;5 is a schematic diagram of the results obtained by subjecting the experimental results in FIG. 3 to data processing provided by the implementation of the present invention;
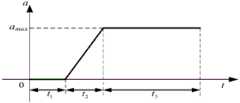
图6为本发明实施例测试场景示例下的理想算法的减速度与时间曲线。FIG. 6 is a deceleration and time curve of an ideal algorithm under an example of a test scenario according to an embodiment of the present invention.
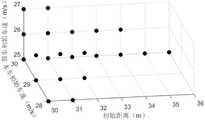
图7为本发明实施提供的一种该测试场景下理想算法的试验结果图。FIG. 7 is a test result diagram of an ideal algorithm under the test scenario provided by the implementation of the present invention.
具体实施方式Detailed ways
下面结合附图对本实用新型作详细的描述:Below in conjunction with accompanying drawing, the utility model is described in detail:
为了解决当前自动驾驶安全性尚无可靠评价方法的难题,本发明实施提供了一种基于多维度逻辑场景的自动驾驶安全性测试方法,其通过对该逻辑场景下自动驾驶的试验数据进行统计分析,使用统计的方式对自动驾驶的安全性进行评价,在本发明实施例中,以前车紧急制动的逻辑场景作为案例进行描述。In order to solve the problem that there is no reliable evaluation method for the current automatic driving safety, the present invention provides an automatic driving safety test method based on a multi-dimensional logic scenario, which performs statistical analysis on the test data of automatic driving in the logic scenario. , using a statistical method to evaluate the safety of automatic driving. In the embodiment of the present invention, the logic scenario of emergency braking of the preceding vehicle is used as a case for description.
步骤一、将具体场景要素数据集合X1按照如下数据处理流程进行处理:Step1 : Process the specific scene element data set X1 according to the following data processing flow:
将试验数据对称化处理,对称化处理的好处在于将试验数据处理成一个完整的高斯分布并将数据分布的中心转移到逻辑场景危险边界的交点:以所选逻辑场景的场景要素参数类型建立坐标系,各个坐标轴所对应的内容即为逻辑场景中不同的场景要素参数类型;逻辑场景中不同场景要素参数对应的参数空间均存在上限和下限,危险边界为理论情况下容易发生危险的参数空间位置的上限或下限,以本发明所选择的前车紧急制动场景为例,前车制动时本车的速度越大则本车与前车发生碰撞的风险越大,因此场景参数中的本车速度应选择其上限作为危险边界;将具体场景要素数据集合X1在建立的坐标系下根据不同的场景要素危险边界数值形成的坐标轴按顺序进行对称化处理,即具体场景要素数据集合X1以列为单位发生改变,每次对称时发生对称的列以该类型参数的危险边界数值为对称轴产生新数据,其他未发生对称的列数值不变,其他未发生对称的列复制并且其数值按照之前的对应顺序与复制后的列形成新的对称后的数据;每次对称后将对称得到的新数据和原始数据一起作为下次对称的原始数据(以数据(20,30)、(25,30)、(25,35)为例,其危险边界为(15,40),首先将第一维数据进行对称,(20 25 25)关于15的对称数据为(10 5 5),第二维数据不变并与第一维的对称数据按照原本的顺序进行结合得到第一维对称后的数据(10,30),(5,30),(5,35),此时的数据包括(20,30)、(25,30)、(25,35),(10,30),(5,30),(5,35),然后将该组数据的第二维进行对称,(30 30 35 30 30 35)关于40的对称数据为(50 50 45 50 50 45),第一维数据不变并与第二维的对称数据按照原本的顺序进行结合得到第二维对称后的数据(20,50),(25,50),(25,45),(10,50),(5,50),(5,45),最终得到完全对称后的数据(20,30)、(25,30)、(25,35),(10,30),(5,30),(5,35),(20,50),(25,50),(25,45),(10,50),(5,50),(5,45));对称化处理完成后得到对称化处理后的数据集合X2,X2的矩阵定义与X1相同;Symmetric processing of test data, the advantage of symmetric processing is to process the test data into a complete Gaussian distribution and transfer the center of the data distribution to the intersection of the logical scene danger boundary: establish coordinates with the scene element parameter type of the selected logical scene The content corresponding to each coordinate axis is the different scene element parameter types in the logic scene; the parameter spaces corresponding to different scene element parameters in the logic scene have upper and lower limits, and the danger boundary is the parameter space that is prone to danger under theoretical conditions. The upper or lower limit of the position. Taking the emergency braking scenario of the preceding vehicle selected by the present invention as an example, the greater the speed of the vehicle when the vehicle in front is braking, the greater the risk of collision between the vehicle and the vehicle ahead. The upper limit of the speed of the vehicle should be selected as the danger boundary; the coordinate axes formed by the specific scene element data set X1 in the established coordinate system according to different scene element danger boundary values should be symmetrically processed in sequence, that is, the specific scene element data set. X1 is changed in units of columns. Each time symmetry occurs, the column with symmetry generates new data with the dangerous boundary value of the type parameter as the symmetry axis. The value of other columns without symmetry remains unchanged. Other columns without symmetry are copied and Its values form new symmetrical data with the copied column in the previous corresponding order; after each symmetry, the new symmetrically obtained data and the original data are used as the next symmetrical original data (with data (20, 30), Take (25, 30) and (25, 35) as an example. The danger boundary is (15, 40). First, the first dimension data is symmetrical. The symmetrical data of (20 25 25) about 15 is (10 5 5), The second dimension data remains unchanged and is combined with the first dimension symmetrical data in the original order to obtain the first dimension symmetrical data (10, 30), (5, 30), (5, 35), the data at this time Including (20, 30), (25, 30), (25, 35), (10, 30), (5, 30), (5, 35), and then symmetric to the second dimension of this set of data, ( 30 30 35 30 30 35) The symmetrical data about 40 is (50 50 45 50 50 45), the first dimension data remains unchanged and combined with the second dimension symmetrical data in the original order to obtain the second dimension symmetrical data (20, 50), (25, 50), (25, 45), (10, 50), (5, 50), (5, 45), and finally get completely symmetrical data (20, 30), ( 25, 30), (25, 35), (10, 30), (5, 30), (5, 35), (20, 50), (25, 50), (25, 45), (10, 50), (5, 50), (5, 45)); after the symmetric processing is completed, the symmetric processed data set X2 is obtained, and the matrix definition of X2 is the same as that of X1 ;
将对称化处理后的试验数据集合X2进行标准化处理,得到标准化处理后的坐标系中的试验数据集X,标准化处理的意义是在于将不同维度之间数据的差异尺度处理至相同尺度,从而避免基于距离的聚类方法(本发明使用的基于高斯模型的聚类和K-means聚类)产生失误:采用Z-score归一化方法对危险参数进行标准化处理,如式(1)所示:Standardize the experimental data set X2 after the symmetric processing to obtain the experimental data set X in the coordinate system after the normalization processing. Avoid errors in distance-based clustering methods (Gaussian model-based clustering and K-means clustering used in the present invention): use Z-score normalization method to standardize risk parameters, as shown in formula (1) :

式中,xf是标准化处理后的数据集合X的第f维参数列向量,bf是对称化处理后数据集合X2矩阵的第f维参数列向量,bf_mean是对称化处理后数据集合X2矩阵的第f维参数的均值,sf是对称化处理后数据集合X2矩阵的第f维参数的标准差,下角标f代表逻辑场景的第f个维度即X1矩阵的第f列也就是第f类场景要素,d为所选逻辑场景的变量维度总数即X1矩阵的列数也就是场景要素类型的数量;In the formula, xf is the f-th dimension parameter column vector of the standardized data set X, bf is the f-th dimension parameter column vector of the symmetric data set X2 matrix, and bf_mean is the symmetric processed data set. The mean value of the f-th dimension parameter of the X2 matrix, sf is the standard deviation of the f-th dimension parameter of the X2 matrix of the data set after symmetric processing, and the subscript f represents the f-th dimension of the logical scene, that is, the f-th dimension of the X1 matrix The column is the f-th type of scene element, and d is the total number of variable dimensions of the selected logical scene, that is, the number of columns of the X1 matrix, that is, the number of scene element types;
标准化处理过程中首先计算不同列数据的均值和标准差,然后将该列的均值和标准差带入公式(1)之中,然后将这一列的每一个数值带入公式(1)之中,从而得到这一列每一个数据的标准化处理后的数据,将所有列的数据都经过标准化处理之后即可得到标准化处理后的数据集合X;In the standardization process, the mean and standard deviation of the data in different columns are first calculated, and then the mean and standard deviation of the column are brought into formula (1), and then each value of this column is brought into formula (1), Thus, the standardized data of each data in this column is obtained, and the standardized data set X can be obtained after the data of all columns are standardized;
初步计算标准化处理后的坐标系中的试验数据集合X的聚类中心数目:采用计算组内残差平方和的方式计算危险参数聚类中心数量,组内残差平方和是指所有聚类中每个类内的要素距离其聚类中心的误差的平方的总和,如式(2)所示;采用K-means聚类方法对数据集合X进行初步聚类,聚类中心g设置为1到10分别聚类10次,分别计算这10次聚类结果的组内残差平方和;Preliminarily calculate the number of cluster centers of the test data set X in the standardized coordinate system: calculate the number of risk parameter cluster centers by calculating the residual sum of squares within the group. The sum of the squares of the errors of the elements in each class from its cluster center, as shown in formula (2); the K-means clustering method is used to perform preliminary clustering on the data set X, and the cluster center g is set from 1 to 10
K-means聚类算法的过程如下:The process of K-means clustering algorithm is as follows:
(1)自行确定g值,即希望得到的聚类数量,本方法中g的值设定为1到10;(1) Determine the g value by yourself, that is, the desired number of clusters, the value of g in this method is set to 1 to 10;
(2)从数据集合X2中随机选择g个数据点作为聚类中心;(2) randomly select g data points from the data set X2 as the cluster centers;
(3)对数据集X2中每一个点,计算其与每一个聚类中心的欧式距离,将其划分到欧式距离最近的聚类中心所属的聚类;(3) For each point in the data set X2 , calculate the Euclidean distance between it and each cluster center, and divide it into the cluster to which the nearest cluster center belongs to the Euclidean distance;
(4)将所有数据归好聚类后,共有g个聚类,重新计算这g个聚类的聚类中心;(4) After classifying all data into clusters, there are g clusters in total, and the cluster centers of these g clusters are recalculated;
(5)如果新计算出来每个聚类的聚类中心和原来选择的各个聚类的聚类中心之间的欧式距离小于等于设置的阈值,则表示重新计算的质心的位置变化不大,结果收敛,即聚类已经达到期望的结果,算法终止;(5) If the Euclidean distance between the newly calculated cluster center of each cluster and the originally selected cluster center is less than or equal to the set threshold, it means that the position of the recalculated centroid does not change much, and the result Convergence, that is, the clustering has reached the desired result, and the algorithm terminates;
(6)如果新计算出来每个聚类的聚类中心和原来选择的各个聚类的聚类中心之间的欧式距离大于设置的阈值,则表示算法结果差,将新计算得到的聚类中心作为初始聚类中心,重新进行3-5步。(6) If the Euclidean distance between the newly calculated cluster center of each cluster and the previously selected cluster center is greater than the set threshold, it means that the algorithm result is poor, and the newly calculated cluster center As the initial cluster center, repeat steps 3-5.
当组内残差平方和变化速率变慢时,即认为增大聚类数目也不能对聚类结果进行有效的提高,该速率变化的拐点数即为聚类中心数目;When the rate of change of the residual sum of squares within the group becomes slow, it is considered that increasing the number of clusters cannot effectively improve the clustering results, and the number of inflection points of the rate change is the number of cluster centers;

式中,Y为组内残差平方和,m为所有数据点的数量即标准化处理后的坐标系中的试验数据集合X的行数,x’为使用初步聚类得到的不同聚类的聚类中心;In the formula, Y is the residual sum of squares within the group, m is the number of all data points, that is, the number of rows of the experimental data set X in the coordinate system after standardized processing, and x' is the clustering of different clusters obtained by preliminary clustering. class center;
选择后续聚类方式:当计算得到的聚类中心只有一个时,使用单高斯模型聚类方法对试验数据进行聚类,当聚类中心存在多个时,使用高斯混合模型进行聚类(基于高斯模型的聚类方法得到的高斯模型参数可用于进行后续的评价过程);Select the subsequent clustering method: when there is only one cluster center calculated, use the single Gaussian model clustering method to cluster the test data; when there are multiple cluster centers, use the Gaussian mixture model for clustering (based on Gaussian The Gaussian model parameters obtained by the clustering method of the model can be used for the subsequent evaluation process);
单高斯模型聚类:单高斯模型聚类方法的公式如(3)所示:Single Gaussian model clustering: The formula of the single Gaussian model clustering method is shown in (3):

式中,P(x|θs)为单一高斯模型概率密度函数,θs为高斯模型的参数,包括均值和标准差,Σ为用来描述各维变量相关度的协方差矩阵,μ为危险参数向量的均值,由于数据已经经过了对称化和标准化处理,所以若只存在单高斯型的情况下经过处理后分布的均值为0,标准差为1;In the formula, P(x|θs ) is the probability density function of a single Gaussian model, θs is the parameters of the Gaussian model, including the mean and standard deviation, Σ is the covariance matrix used to describe the correlation of each dimension variable, μ is the risk The mean value of the parameter vector, because the data has been symmetric and standardized, so if there is only a single Gaussian type, the mean value of the processed distribution is 0, and the standard deviation is 1;
高斯混合模型聚类:高斯混合模型聚类又名EM聚类算法,通过迭代进行E-step和M-step来获得如式(4)所示的高斯混合模型;Gaussian mixture model clustering: Gaussian mixture model clustering, also known as EM clustering algorithm, obtains the Gaussian mixture model shown in equation (4) by iteratively performing E-step and M-step;

式中,G(x|θ)为高斯混合模型概率密度函数,φ(x|θk)为高斯混合模型中的不同高斯分布,θ为高斯混合模型的参数,包括第k个单高斯模型的权重αk和模型参数θk,θk包括均值μk和标准差σk,K为单个高斯模型的总个数即计算得到的聚类中心数量;In the formula, G(x|θ) is the probability density function of the Gaussian mixture model, φ(x|θk ) is the different Gaussian distributions in the Gaussian mixture model, and θ is the parameter of the Gaussian mixture model, including the kth single Gaussian model. Weight αk and model parameters θk , θk includes mean μk and standard deviation σk , K is the total number of a single Gaussian model, that is, the number of calculated cluster centers;
通过极大似然法对θ进行估计:Estimate θ by maximum likelihood:
θ*=argmaxL(θ) (11)θ* = argmaxL(θ) (11)

应用迭代算法对上式进行求解,EM算法的E-step为计算Q函数,Q函数代表给定第p轮迭代的参数θp之后高斯混合模型G(x|θp)与给定数据之间的相似程度,如公式(13)所示;The iterative algorithm is used to solve the above formula. The E-step of the EM algorithm is to calculate the Q function. The Q function represents the difference between the Gaussian mixture model G(x|θp ) and the given data after the parameter θp of thep -th iteration is given. The similarity degree of , as shown in formula (13);

式中,

EM算法中的M-step为最大化Q函数,当计算第(p+1)步的参数θp+1时,对第p步的αk、μk、σk求偏导并使其等于0,就可以使得Q函数极大化;The M-step in the EM algorithm is to maximize the Q function. When calculating the parameter θp+1 of the (p+1)th step, the partial derivatives of αk , μk , and σk of the pth step are calculated and made equal to 0, the Q function can be maximized;
重复进行EM算法的E-step和M-step直至模型收敛即可得到高斯混合模型G(x|θ),即为所求的高斯混合模型。Repeat the E-step and M-step of the EM algorithm until the model converges to obtain the Gaussian mixture model G(x|θ), which is the required Gaussian mixture model.
统计得到的高斯模型参数:统计单高斯模型聚类或高斯混合模型聚类的聚类后的所有高斯分布的均值、标准差;Gaussian model parameters obtained by statistics: the mean and standard deviation of all Gaussian distributions after clustering of single Gaussian model clustering or Gaussian mixture model clustering;
删除因对称处理产生的多余高斯分布:删除除坐标原点位置处其他因对称处理产生的多余高斯分布,这些需要删除的多余的高斯分布的特点是均值存在对称、标准差相同,这类高斯分布只需要保留原始的一个(例如得到的几个高斯分布的参数(均值和标准差)为(0,5)、(2,2)、(-2,2)、(1,3)、(-1,3),通过观察可以发现(2,2)和(-2,2),(1,3)和(-1,3)的均值对称,标准差相同,这就说明(-2,2)和(-1,3)是因对称化处理产生的多余高斯分布,应删除,结果只需要保留均值和方差为(0,5)、(2,2)、(1,3)的这三组高斯分布);Delete the redundant Gaussian distribution caused by symmetrical processing: delete the redundant Gaussian distribution caused by symmetrical processing except for the position of the coordinate origin. The characteristics of these redundant Gaussian distributions that need to be deleted are that the mean value is symmetrical and the standard deviation is the same. This kind of Gaussian distribution only It is necessary to keep the original one (for example, the parameters (mean and standard deviation) of several Gaussian distributions obtained are (0, 5), (2, 2), (-2, 2), (1, 3), (-1 , 3), it can be found by observation that (2, 2) and (-2, 2), (1, 3) and (-1, 3) have symmetrical means and the same standard deviation, which means (-2, 2) and (-1, 3) are redundant Gaussian distributions due to symmetric processing and should be deleted. As a result, only the three groups with mean and variance (0, 5), (2, 2), and (1, 3) need to be retained. Gaussian distribution);
步骤二、确定自动驾驶安全性评价指标,定义逻辑场景中发生碰撞的具体测试用例参数聚类得到的连续分布参数范围(即聚类得到的高斯分布范围)为被测自动驾驶算法在该逻辑场景下的危险域,本方法提出的安全性评价指标包括危险域离散度、危险域范围和场景危险率:Step 2: Determine the self-driving safety evaluation index, and define the continuous distribution parameter range obtained by clustering the parameters of the specific test case that collides in the logical scenario (ie, the Gaussian distribution range obtained by clustering) as the tested self-driving algorithm in this logical scenario. The safety evaluation index proposed by this method includes the hazard domain dispersion, the hazard domain range and the scene hazard rate:
危险域离散度:本方法使用危险域离散度用来表示进行测试时发现危险的困难程度,包括两部分,一是不同危险域相对于逻辑场景中最危险边界点的距离,最危险边界点为给定的逻辑场景参数空间中各个参数维度的危险边界的交点,二是不同危险域之间的相对距离(由于最危险边界点是最容易发生危险的位置,因此该处可以视为危险发生的基本点,其他位置发生事故与该处的位置越远则表明其被发现的难度越大,同时若存在多个分布,且他们之间分布的距离越大则不同分布发现的难度也越大);由于数据经过对称化及标准化处理,逻辑场景中最危险边界点转化成为标准化处理后的坐标系内的坐标原点,不同聚类中心相对于标准化处理后的坐标系的坐标原点的欧氏距离db即为不同危险域相对于最危险边界点的距离,;其他不同危险域之间的相对距离用类间距离ds表示,下标k表示不同的高斯分布,db-k为不同高斯分布的欧式距离,ds-k为不同高斯分布的类间距离,如式(5)和(6)所示;Danger domain dispersion: This method uses the danger domain dispersion to express the difficulty of finding danger during testing, including two parts, one is the distance between different danger domains relative to the most dangerous boundary point in the logic scene, the most dangerous boundary point is The intersection of the danger boundaries of each parameter dimension in the given logical scene parameter space, and the second is the relative distance between different danger domains (because the most dangerous boundary point is the location where danger is most likely to occur, it can be regarded as the place where danger occurs. The basic point, the farther the accident occurs in other locations and the location there, the more difficult it is to find it. At the same time, if there are multiple distributions, and the greater the distance between them, the more difficult it is to find different distributions) ;Because the data is symmetric and standardized, the most dangerous boundary point in the logical scene is transformed into the coordinate origin in the standardized coordinate system, and the Euclidean distance d of different cluster centers relative to the coordinate origin of the standardized coordinate systemb is the distance between different danger areas relative to the most dangerous boundary point; the relative distance between other different danger areas is represented by the inter-class distance ds , the subscript k represents different Gaussian distributions, and dbk is the Euclidean of different Gaussian distributions distance, dsk is the inter-class distance of different Gaussian distributions, as shown in equations (5) and (6);


式中,μk为聚类中心的位置即高斯分布的均值,μmean为除原点外的聚类中心的均值,下标k表示不同的聚类;In the formula, μk is the position of the cluster center, that is, the mean value of the Gaussian distribution, μmean is the mean value of the cluster center except the origin, and the subscript k represents different clusters;
第k个危险域的危险域离散度dh_k为:The hazard domain dispersion dh_k of the kth hazard domain is:
dh_k=a·db_k+c·ds_k (7)dh_k = a db_k + c ds_k (7)
式中,a和c均为权重系数,a和c的具体数值根据测试所选逻辑场景任意定义,a和c的和为1;In the formula, a and c are weight coefficients, the specific values of a and c are arbitrarily defined according to the logic scenario selected by the test, and the sum of a and c is 1;
危险域范围:本方法使用危险域范围作为自动驾驶安全性另一个评价指标,用来描述被测逻辑场景中发生碰撞的具体测试用例形成的连续分布的危险域的覆盖范围,危险域的覆盖范围越大则表明被测算法发生事故的风险越大;危险域范围Sk综合考虑参数的危险程度及其分布范围,采用高斯分布标准差表示,第k个危险域的危险域范围Sk为:Dangerous domain scope: This method uses the dangerous domain scope as another evaluation index of automatic driving safety, which is used to describe the coverage of the continuous distribution of the dangerous domain formed by the specific test cases of collisions in the tested logic scenario, and the coverage of the dangerous domain. The larger the value is, the greater the risk of accidents occurring in the tested algorithm; the risk domain rangeSk comprehensively considers the risk degree and distribution range of the parameters, and is represented by the standard deviation of the Gaussian distribution. The risk domain range Sk of thekth risk domain is:

式中,ω为不同维度参数的重要程度系数,σk为高斯分布的标准差,f代表逻辑场景的第f个维度即X1矩阵的第f列也就是第f类场景要素,ω采用层次分析法确定,通过建立参数判别矩阵并计算矩阵最大特征值和其对应的加权向量,在检验经过一致性通过后,最大特征值对应的加权向量即为不同参数的重要程度ω;In the formula, ω is the importance coefficient of different dimension parameters, σk is the standard deviation of the Gaussian distribution, f represents the f-th dimension of the logical scene, that is, the f-th column of the X1 matrix is the f-th type of scene element, and ω adopts the level The analysis method determines that by establishing a parameter discrimination matrix and calculating the maximum eigenvalue of the matrix and its corresponding weighted vector, after the consistency test is passed, the weighted vector corresponding to the maximum eigenvalue is the importance of different parameters ω;
场景危险率:本方法将危险域离散度和危险域范围两个指标进行耦合,建立可量化的聚类评价指标——场景危险率Rd;Scenario hazard rate: This method couples the two indicators of hazard domain dispersion and hazard domain range, and establishes a quantifiable clustering evaluation index—scenario hazard ratio Rd ;
场景危险率Rd如式(9)所示:The scene hazard rate Rd is shown in formula (9):

式中,S1为标准化处理后的坐标系中的坐标原点处的危险域范围,Smin为理论最小危险域范围,即在给定场景下,假设自动驾驶汽车以理想状态进行操作计算得到的危险域范围,该计算流程与公式(1)至(8)的流程相同且为保证数据的可比性,计算Smin值的标准化过程即公式(1)时,其标准化过程应将理想危险参数映射到测试危险参数域进行修正,修正过程如(10)所示:In the formula, S1 is the range of the danger zone at the origin of the coordinates in the standardized coordinate system, and Smin is the range of the theoretical minimum danger zone, that is, in a given scenario, assuming that the autonomous vehicle operates in an ideal state. The scope of the hazard domain, the calculation process is the same as the process of formulas (1) to (8) and in order to ensure the comparability of the data, when the standardization process for calculating the Smin value is the formula (1), the standardization process should map the ideal hazard parameters. Go to the test hazard parameter domain for correction, and the correction process is shown in (10):

式中sk_v为理论最优算法数据处理计算标准化过程中使用的标准差参数即具体场景要素数据集合X1不同列数值的标准差,sk_t为被测算法试验结果在标准化过程中使用的标准差参数即理想情况测试结果中发生碰撞的具体场景要素数据集合不同列数值的标准差;In the formula, sk_v is the standard deviation parameter used in the standardization process of the theoretical optimal algorithm data processing calculation, that is, the standard deviation of different column values of the specific scene element data set X1 , and sk_t is the standard used in the standardization process of the test results of the algorithm under test. The difference parameter is the standard deviation of the different column values of the specific scene element data set that collides in the ideal test result;
由式(9)可知,场景危险率Rd的值越小,则表示所测试的自动驾驶算法在给定的多维度逻辑场景下安全性越好,其下限值为1,如果场景危险率Rd的值超过1.5,则表示所测试的自动驾驶算法的安全性就比较差,需要进一步优化。参见图3,本发明以前车紧急制动作为示例测试场景。需要说明的是,本案例仅在本次发明中起示例作用,本文所提出的测试评价方法不局限于该案例,对于其他测试场景仍可使用本发明后续提出的评价方法。本发明选择本车初速度v1、前车与本车之间的初始距离d、前车初速度v2作为逻辑场景的测试参数。接下来对该示例场景进行描述,被测自动驾驶车辆以初始速度v1在中间车道向前行驶;前车在本车前距离d处以初速度v2向前行驶,并以8m/s2的减速度进行减速,持续1.5s;之后,前车以3m/s2的加速度加速,持续3s;最后前车以1m/s2的加速度缓慢加速直至30m/s。在本发明实施例中,选择本车初速度v1、前车与本车之间的初始距离d、前车初速度v2作为逻辑场景的测试参数,它们的参数空间范围分别为[15m/s,30m/s]、[30m,50m]、[25m/s,35m/s]。当选择其他测试场景时,可参照本实施案例进行具体设置。It can be seen from formula (9) that the smaller the value of the scene hazard rate Rd , the better the safety of the tested automatic driving algorithm in the given multi-dimensional logic scene, and its lower limit is 1. If the scene hazard rate is If the value of Rd exceeds 1.5, it means that the safety of the tested automatic driving algorithm is relatively poor and needs to be further optimized. Referring to FIG. 3 , the present invention takes the emergency braking of the front vehicle as an example test scenario. It should be noted that this case only serves as an example in the present invention, and the test evaluation method proposed in this paper is not limited to this case, and the evaluation methods proposed in the present invention can still be used for other test scenarios. The present invention selects the initial velocity v1 of the vehicle, the initial distance d between the preceding vehicle and the vehicle, and the initial velocity v2 of the preceding vehicle as the test parameters of the logic scenario. Next, the example scenario is described. The tested autonomous vehicle drives forward in the middle lane atan initial speed v1; the preceding vehicle drives forward at an initial speed v2 at a distance d in front of the vehicle, and moves forward at a speed of8m /s2 Decelerate for 1.5s; after that, the preceding vehicle accelerates at an acceleration of 3m/s2 for 3s; finally, the preceding vehicle accelerates slowly at an acceleration of 1m/s2 until30m /s. In the embodiment of the present invention, the initial velocity v1 of the vehicle, the initial distance d between the preceding vehicle and the vehicle, and the initial velocity v2 of the preceding vehicle are selected as the test parameters of the logic scenario, and their parameter space ranges are [15m/ s, 30m/s], [30m, 50m], [25m/s, 35m/s]. When selecting other test scenarios, you can refer to this implementation case for specific settings.
参照图2中的第1步和第2步,根据传感器精度、软件平台仿真频率、算法精度等对逻辑场景进行离散化处理,以车载毫米波雷达工作精度为例,其远距离精度为±0.5m,中距离精度为±0.25m,因此考虑传感器精度可选距离单位为1m进行离散。同理考虑其他因素,本文最终选择的速度的离散单位为1m/s,距离的离散单位为1m,并使用穷举的方法在仿真环境下完成了3696次试验。Referring to
参照图4,本发明对该示例进行了试验并得到了某算法相应的试验数据结果,其中82组发生碰撞的测试用例对应的参数即为评价所需要的试验参数集合X1。Referring to FIG. 4 , the present invention conducts a test on this example and obtains test data results corresponding to an algorithm, wherein the parameters corresponding to the 82 groups of collision test cases are the test parameter set X1 required for evaluation.
参见图2第3步,对试验数据进行对称化处理。通过对本示例逻辑场景进行分析可知,前车制动时本车的初速度越大发生碰撞的风险越大,前车制动时前车与本车之间的距离越短发生碰撞的风险越大,前车制动时前车的速度越小发生碰撞的风险越大,根据分析可知本案例中针对该测试场景选择的对称轴分别为:本车初速度v1为30m/s的坐标轴、前车与本车之间的初始距离d为30m的坐标轴、前车初速度v2为25m/s的坐标轴,将试验得到的试验数据根据这三个坐标轴分别进行对称化处理得到数据集合X2。Referring to step 3 in Figure 2, the experimental data is symmetric. By analyzing the logic scenario of this example, it can be seen that the higher the initial speed of the vehicle in front of braking, the greater the risk of collision, and the shorter the distance between the vehicle in front and the vehicle when the front vehicle is braking, the greater the risk of collision , the smaller the speed of the preceding vehicle when braking, the greater the risk of collision. According to the analysis, the symmetry axes selected for this test scenario in this case are: the coordinate axis where the vehicle's initial speed v1 is 30m/s, The coordinate axis where the initial distance d between the preceding vehicle and the vehicle is 30m, and the coordinate axis where the initial speed v2 of the preceding vehicle is 25m/s.The test data obtained by the test are symmetrically processed according to these three coordinate axes respectively to obtain the data. Set X2 .
参见图2第4步,对对称化处理后的数据集合X2进行标准化处理,将数据集合X2的每一列都按照公式(1)进行标准化处理,首先计算每一列数据的均值,然后将每一列数据的均值带入公式(1)进行计算,标准化过程的数据集均值为(30,30,25),标准差为(5.2366,1.2987,1.2223),将这两组数据带入公式(1)对数据集合X2进行标准化处理得到数据集合X。Referring to step 4 of Fig. 2, standardize the symmetrical data set X2 , and standardize each column of the data set X2 according to formula (1), first calculate the mean value of each column of data, and then The mean of a column of data is brought into formula (1) for calculation. The data set mean of the standardization process is (30, 30, 25), and the standard deviation is (5.2366, 1.2987, 1.2223), and these two sets of data are brought into formula (1) The data set X is obtained by normalizing the data set X2 .
参见图5,该图即为该示例的试验数据经过对称处理及标准处理后的试验数据集合X的图像。Referring to FIG. 5 , this figure is an image of the experimental data set X after the experimental data of this example are processed symmetrically and standardly.
参照图2第5步,计算对称处理及标准化处理后的试验数据聚类中心数量。Referring to step 5 of Figure 2, calculate the number of cluster centers of the test data after symmetrical processing and normalization processing.
本实施例中将数据集合X带入K-means聚类之中,并将K-means聚类的聚类中心数量分别设置为1至10进行聚类,计算聚类中心为1至10时的每个聚类过程的组内残差平方和,计算得到当聚类中心设置为1时组内残差平方和的变化即较慢,因此数据集合X的聚类中心数目为1。In this embodiment, the data set X is brought into the K-means clustering, and the number of cluster centers of the K-means clustering is set to 1 to 10 for clustering, and the number of cluster centers is calculated to be 1 to 10. The residual sum of squares within the group of each clustering process is calculated. When the cluster center is set to 1, the change of the residual sum of squares within the group is slower, so the number of cluster centers in the data set X is 1.
参照图2第6步,运行图2中第7步单高斯模型聚类。Referring to step 6 in Figure 2, run the single Gaussian model clustering in
参照图2第8步,将试验数据进行单高斯模型聚类,将数据集合X的数据带入公式(3)中。Referring to step 8 of FIG. 2, the test data is clustered by a single Gaussian model, and the data of the data set X is brought into the formula (3).
参照图2第9步,得到的高斯模型均值为0,标准差为1。Referring to step 9 in Figure 2, the obtained Gaussian model has a mean value of 0 and a standard deviation of 1.
参照图2第10步,由于仅有标准化处理后的坐标系下的一个高斯分布,因此本次聚类无需删除多余聚类。Referring to step 10 of FIG. 2 , since there is only one Gaussian distribution in the coordinate system after normalization, it is not necessary to delete redundant clusters in this clustering.
参照发明中提到的危险域离散度,本次示例中数据仅存在一个聚类,将得到的高斯分布参数带入公式(5)(6)(7),最终计算得到该高斯分布对应的危险域离散度为0。Referring to the hazard domain dispersion mentioned in the invention, there is only one cluster in the data in this example, and the obtained Gaussian distribution parameters are brought into formula (5)(6)(7), and the risk corresponding to the Gaussian distribution is finally calculated. The domain dispersion is 0.
参照发明中提到的危险域范围的计算公式(8),计算本次示例数据的危险域范围。With reference to the calculation formula (8) of the dangerous domain range mentioned in the invention, the dangerous domain range of this example data is calculated.
首先计算本发明示例的不同参数的重要程度系数w,根据层次分析方法,本发明建立的参数判别矩阵如式(15)所示,该判别矩阵的从上到下/从左至右的参数类型为本车速度、本车与前车距离、前车速度:First, calculate the importance degree coefficient w of different parameters in the example of the present invention. According to the AHP method, the parameter discrimination matrix established by the present invention is shown in formula (15). The speed of the vehicle, the distance between the vehicle and the vehicle in front, and the speed of the vehicle in front:

计算得到该矩阵的最大特征值为3.004,对应的加权向量为[0.1220,0.6483,0.2297]。随后进行层次分析法的一致性检验,结果通过,因此得到的加权向量[0.1220,0.6483,0.2297]即为本示例中不同参数的重要程度系数w。The maximum eigenvalue of the matrix is calculated to be 3.004, and the corresponding weight vector is [0.1220, 0.6483, 0.2297]. Then, the consistency check of AHP is carried out, and the result is passed. Therefore, the obtained weighted vector [0.1220, 0.6483, 0.2297] is the importance degree coefficient w of different parameters in this example.
将上述数据带入危险域范围的计算公式(8),计算得到的本示例的危险域范围为1。Bringing the above data into the calculation formula (8) of the danger domain range, the calculated danger domain range of this example is 1.
参照发明中提到的场景危险率的计算过程,计算本示例用数据的场景危险率。首先计算理论最小危险域范围Smin。With reference to the calculation process of the scene risk rate mentioned in the invention, the scene risk rate of the data used in this example is calculated. First, the theoretical minimum danger zone range Smin is calculated.
参照图6,该图为理论情况下该场景中的最优算法制动减速度变化图。Referring to FIG. 6 , this figure is a change diagram of the optimal algorithm braking deceleration in this scenario under theoretical conditions.
参照图7,图7即为将图6的最优算法带入该逻辑场景中进行试验所得到的数据结果。Referring to FIG. 7 , FIG. 7 is the data result obtained by bringing the optimal algorithm of FIG. 6 into the logic scenario for testing.
将图7中的数据进行图2中的第3步对称化处理,得到处理后的数据均值为(30,30,25)、标准差为(2.2669,0.8660,0.9280)。按照式(10)将该对称化处理后的数据进行修正处理,得到修正后的高斯分布标准差为(0.4329,0.6668,0.7592)。The data in Figure 7 is subjected to the third step of symmetric processing in Figure 2, and the mean value of the processed data is (30, 30, 25) and the standard deviation is (2.2669, 0.8660, 0.9280). According to the formula (10), the data after the symmetric processing is corrected, and the corrected standard deviation of the Gaussian distribution is (0.4329, 0.6668, 0.7592).
参照发明中提到的危险域范围计算公式(8),将修正后的标准差数据和之前计算得到的不同参数的重要程度系数w带入公式(8)得到Smin的数值为0.4435。Referring to the calculation formula (8) of the danger zone range mentioned in the invention, the corrected standard deviation data and the previously calculated importance coefficients of different parameters are brought into formula (8) to obtain the value of Smin as 0.4435.
参照发明中提到的场景危险率计算过程公式(9),最终得到该示例的场景危险率为3.5071,大于1.5,示例中算法的安全性差。Referring to the formula (9) of the scene risk rate calculation process mentioned in the invention, the scene risk rate of this example is finally obtained as 3.5071, which is greater than 1.5, and the security of the algorithm in the example is poor.
Claims (3)
Translated fromChinese


Priority Applications (1)
| Application Number | Priority Date | Filing Date | Title |
|---|---|---|---|
| CN202010391236.8ACN111580500B (en) | 2020-05-11 | 2020-05-11 | Evaluation method for safety of automatic driving automobile |
Applications Claiming Priority (1)
| Application Number | Priority Date | Filing Date | Title |
|---|---|---|---|
| CN202010391236.8ACN111580500B (en) | 2020-05-11 | 2020-05-11 | Evaluation method for safety of automatic driving automobile |
Publications (2)
| Publication Number | Publication Date |
|---|---|
| CN111580500A CN111580500A (en) | 2020-08-25 |
| CN111580500Btrue CN111580500B (en) | 2022-04-12 |
Family
ID=72126546
Family Applications (1)
| Application Number | Title | Priority Date | Filing Date |
|---|---|---|---|
| CN202010391236.8AActiveCN111580500B (en) | 2020-05-11 | 2020-05-11 | Evaluation method for safety of automatic driving automobile |
Country Status (1)
| Country | Link |
|---|---|
| CN (1) | CN111580500B (en) |
Families Citing this family (20)
| Publication number | Priority date | Publication date | Assignee | Title |
|---|---|---|---|---|
| CN112100836B (en)* | 2020-09-07 | 2022-06-07 | 腾讯科技(深圳)有限公司 | Method and device for acquiring vehicle boundary parameters |
| CN112433519A (en)* | 2020-11-09 | 2021-03-02 | 温州大学大数据与信息技术研究院 | Unmanned driving detection system and vehicle driving detection method |
| CN113092133B (en)* | 2021-04-07 | 2024-03-22 | 冒坚 | Ultrasonic radar in-loop automatic driving test method based on Gaussian clustering |
| CN113419942B (en)* | 2021-04-30 | 2022-10-14 | 吉林大学 | Automatic driving safety evaluation method based on natural driving data |
| CN113204742A (en)* | 2021-05-11 | 2021-08-03 | 雄狮汽车科技(南京)有限公司 | Vehicle control parameter calibration method and device and vehicle |
| CN113378301B (en)* | 2021-06-22 | 2022-05-24 | 北京航空航天大学 | Importance sampling-based key test case generation method for unmanned vehicle overtaking scene |
| CN113377662B (en)* | 2021-06-24 | 2022-09-27 | 吉林大学 | A safety evaluation method for autonomous driving based on potential field method and information entropy |
| CN113485301B (en)* | 2021-07-20 | 2022-05-17 | 合肥工业大学 | A quantitative evaluation method for the expected functional safety performance of autonomous vehicle control systems |
| CN113468670B (en)* | 2021-07-20 | 2023-11-03 | 合肥工业大学 | Performance evaluation method for whole vehicle level of automatic driving vehicle |
| CN113705802B (en)* | 2021-07-26 | 2023-09-08 | 深圳市易成自动驾驶技术有限公司 | Synchronous calculation method, device, system, program product and medium for automatic driving |
| CN114544191B (en)* | 2021-12-28 | 2024-05-03 | 文远苏行(江苏)科技有限公司 | Automatic driving test scene quantitative evaluation method and related equipment |
| CN115453589A (en)* | 2022-08-19 | 2022-12-09 | 中国科学院深圳先进技术研究院 | Attack detection method based on automatic driving, terminal device and storage medium |
| CN115576224B (en)* | 2022-11-22 | 2023-10-10 | 中国重汽集团济南动力有限公司 | An adaptive cruise control system simulation test and evaluation method |
| CN116009516B (en)* | 2023-01-12 | 2024-09-24 | 清华大学 | Method and device for realizing self-adaptive acceleration test |
| CN116401111B (en)* | 2023-05-26 | 2023-09-05 | 中国第一汽车股份有限公司 | Function detection method and device of brain-computer interface, electronic equipment and storage medium |
| CN117152714B (en)* | 2023-08-22 | 2025-08-22 | 易控智驾科技股份有限公司 | Processing method and device for target detection program of unmanned vehicle |
| CN116957344B (en)* | 2023-09-20 | 2023-12-08 | 清华大学苏州汽车研究院(相城) | Safety evaluation method, device, equipment and medium for automatic emergency braking system |
| CN118171134B (en)* | 2024-05-13 | 2024-07-23 | 临沂大学 | A method and system for optimizing and processing sports physical test data in colleges and universities |
| CN118675250B (en)* | 2024-08-20 | 2024-10-29 | 中汽智联技术有限公司 | Vehicle running condition monitoring method and system based on artificial intelligence |
| CN119323881A (en)* | 2024-10-15 | 2025-01-17 | 中汽智联技术有限公司 | Unknown key scene recognition method and system based on intersection scene space |
Citations (22)
| Publication number | Priority date | Publication date | Assignee | Title |
|---|---|---|---|---|
| JP2003034200A (en)* | 2001-07-24 | 2003-02-04 | Hitachi Ltd | Car control method |
| CN102292681A (en)* | 2008-11-25 | 2011-12-21 | 皮尔茨公司 | Safety control and method for controlling an automated system having a plurality of system hardware components |
| CN102705303A (en)* | 2012-05-16 | 2012-10-03 | 北京航空航天大学 | Fault location method based on residual and double-stage Elman neural network for hydraulic servo system |
| CN103729798A (en)* | 2014-01-29 | 2014-04-16 | 河南理工大学 | Coal mine safety evaluation system based on improved k-means clustering |
| CN106682586A (en)* | 2016-12-03 | 2017-05-17 | 北京联合大学 | Method for real-time lane line detection based on vision under complex lighting conditions |
| CN107037817A (en)* | 2017-06-19 | 2017-08-11 | 吉林大学 | A kind of intelligent electric motor car longitudinal side is to integrated control platform and vehicle |
| CN107063228A (en)* | 2016-12-21 | 2017-08-18 | 上海交通大学 | Targeted attitude calculation method based on binocular vision |
| CN107577843A (en)* | 2017-08-02 | 2018-01-12 | 吉林大学 | Evaluation Method of Coupling Relationship Between Crash Waveform and Constraint System Characteristics |
| CN108225364A (en)* | 2018-01-04 | 2018-06-29 | 吉林大学 | A kind of pilotless automobile driving task decision system and method |
| CN108255151A (en)* | 2017-12-15 | 2018-07-06 | 工业和信息化部计算机与微电子发展研究中心(中国软件评测中心) | A kind of evaluation system of automatic driving vehicle |
| CN108647582A (en)* | 2018-04-19 | 2018-10-12 | 河南科技学院 | Goal behavior identification and prediction technique under a kind of complex dynamic environment |
| CN108764359A (en)* | 2018-06-01 | 2018-11-06 | 吉林大学 | The k means clustering methods of printenv |
| CN109146158A (en)* | 2018-08-03 | 2019-01-04 | 青海大学 | A kind of Alpine Meadow ecosystem health analysis method, computer |
| CN109327838A (en)* | 2018-11-20 | 2019-02-12 | 吉林大学 | A Spectrum Resource Allocation Method Based on Spectral Clustering in Heterogeneous Cellular Networks |
| CN109341778A (en)* | 2018-11-23 | 2019-02-15 | 泉州装备制造研究所 | An information-based intelligent control system and control method for safety monitoring of tailings pond |
| CN109375632A (en)* | 2018-12-17 | 2019-02-22 | 清华大学 | A real-time trajectory planning method for autonomous vehicles |
| CN109491364A (en)* | 2018-11-19 | 2019-03-19 | 长安大学 | A kind of drive robot system and control method for vehicle testing |
| CN109493681A (en)* | 2018-11-30 | 2019-03-19 | 吉林大学 | A kind of man-machine test-drive platform driven altogether of intelligent automobile |
| CN109542081A (en)* | 2018-11-14 | 2019-03-29 | 江苏大学 | A kind of line up train Risk estimation method based on vehicle projectile deceleration history under line |
| CN109741007A (en)* | 2018-12-12 | 2019-05-10 | 北京航空航天大学 | A screening method for subjects in aviation cockpit workload test |
| CN109844832A (en)* | 2016-12-30 | 2019-06-04 | 同济大学 | A kind of multi-modal accident detection method based on journey time distribution |
| CN110040147A (en)* | 2019-04-23 | 2019-07-23 | 吉林大学 | A kind of method of travel speed optimization under the lateral constraint of saturation of autonomous driving vehicle |
Family Cites Families (3)
| Publication number | Priority date | Publication date | Assignee | Title |
|---|---|---|---|---|
| US20110301433A1 (en)* | 2010-06-07 | 2011-12-08 | Richard Scott Sadowsky | Mental state analysis using web services |
| CN107421752B (en)* | 2017-07-13 | 2019-06-11 | 同济大学 | An accelerated reconstruction method of intelligent vehicle test scene |
| US11442445B2 (en)* | 2017-08-02 | 2022-09-13 | Strong Force Iot Portfolio 2016, Llc | Data collection systems and methods with alternate routing of input channels |
- 2020
- 2020-05-11CNCN202010391236.8Apatent/CN111580500B/enactiveActive
Patent Citations (22)
| Publication number | Priority date | Publication date | Assignee | Title |
|---|---|---|---|---|
| JP2003034200A (en)* | 2001-07-24 | 2003-02-04 | Hitachi Ltd | Car control method |
| CN102292681A (en)* | 2008-11-25 | 2011-12-21 | 皮尔茨公司 | Safety control and method for controlling an automated system having a plurality of system hardware components |
| CN102705303A (en)* | 2012-05-16 | 2012-10-03 | 北京航空航天大学 | Fault location method based on residual and double-stage Elman neural network for hydraulic servo system |
| CN103729798A (en)* | 2014-01-29 | 2014-04-16 | 河南理工大学 | Coal mine safety evaluation system based on improved k-means clustering |
| CN106682586A (en)* | 2016-12-03 | 2017-05-17 | 北京联合大学 | Method for real-time lane line detection based on vision under complex lighting conditions |
| CN107063228A (en)* | 2016-12-21 | 2017-08-18 | 上海交通大学 | Targeted attitude calculation method based on binocular vision |
| CN109844832A (en)* | 2016-12-30 | 2019-06-04 | 同济大学 | A kind of multi-modal accident detection method based on journey time distribution |
| CN107037817A (en)* | 2017-06-19 | 2017-08-11 | 吉林大学 | A kind of intelligent electric motor car longitudinal side is to integrated control platform and vehicle |
| CN107577843A (en)* | 2017-08-02 | 2018-01-12 | 吉林大学 | Evaluation Method of Coupling Relationship Between Crash Waveform and Constraint System Characteristics |
| CN108255151A (en)* | 2017-12-15 | 2018-07-06 | 工业和信息化部计算机与微电子发展研究中心(中国软件评测中心) | A kind of evaluation system of automatic driving vehicle |
| CN108225364A (en)* | 2018-01-04 | 2018-06-29 | 吉林大学 | A kind of pilotless automobile driving task decision system and method |
| CN108647582A (en)* | 2018-04-19 | 2018-10-12 | 河南科技学院 | Goal behavior identification and prediction technique under a kind of complex dynamic environment |
| CN108764359A (en)* | 2018-06-01 | 2018-11-06 | 吉林大学 | The k means clustering methods of printenv |
| CN109146158A (en)* | 2018-08-03 | 2019-01-04 | 青海大学 | A kind of Alpine Meadow ecosystem health analysis method, computer |
| CN109542081A (en)* | 2018-11-14 | 2019-03-29 | 江苏大学 | A kind of line up train Risk estimation method based on vehicle projectile deceleration history under line |
| CN109491364A (en)* | 2018-11-19 | 2019-03-19 | 长安大学 | A kind of drive robot system and control method for vehicle testing |
| CN109327838A (en)* | 2018-11-20 | 2019-02-12 | 吉林大学 | A Spectrum Resource Allocation Method Based on Spectral Clustering in Heterogeneous Cellular Networks |
| CN109341778A (en)* | 2018-11-23 | 2019-02-15 | 泉州装备制造研究所 | An information-based intelligent control system and control method for safety monitoring of tailings pond |
| CN109493681A (en)* | 2018-11-30 | 2019-03-19 | 吉林大学 | A kind of man-machine test-drive platform driven altogether of intelligent automobile |
| CN109741007A (en)* | 2018-12-12 | 2019-05-10 | 北京航空航天大学 | A screening method for subjects in aviation cockpit workload test |
| CN109375632A (en)* | 2018-12-17 | 2019-02-22 | 清华大学 | A real-time trajectory planning method for autonomous vehicles |
| CN110040147A (en)* | 2019-04-23 | 2019-07-23 | 吉林大学 | A kind of method of travel speed optimization under the lateral constraint of saturation of autonomous driving vehicle |
Non-Patent Citations (5)
| Title |
|---|
| Contingency Planning Over Probabilistic Obstacle Predictions for Autonomous Road Vehicles;Jason Hardy;《IEEE Transactions on Robotics》;20131231;第913-929页* |
| Deep learning models for traffic flow prediction in autonomous vehicles;Arzoo Miglani;《Vehicular Communications》;20191231;第1-36页* |
| Super-resolution image reconstruction based on three-step-training neural networks;Fuzhen Zhu;《Journal of Systems Engineering and Electronics》;20101231;第934-940页* |
| 基于ITC的自动驾驶卡车编队跟驰安全性评价;陈丰;《长安大学学报(自然科学版)》;20191231;第97-105页* |
| 基于场景的自动驾驶汽车虚拟测试研究进展;朱冰等;《中国公路学报》;20191231;第32卷(第6期);第1-19页* |
Also Published As
| Publication number | Publication date |
|---|---|
| CN111580500A (en) | 2020-08-25 |
Similar Documents
| Publication | Publication Date | Title |
|---|---|---|
| CN111580500B (en) | Evaluation method for safety of automatic driving automobile | |
| CN113419942B (en) | Automatic driving safety evaluation method based on natural driving data | |
| US20220004769A1 (en) | Method and device for constructing autonomous driving test scenes, terminal and readable storage media | |
| CN110949398A (en) | Method for detecting abnormal driving behavior of first-vehicle drivers in vehicle formation driving | |
| WO2016091084A1 (en) | Complex network-based high speed train system safety evaluation method | |
| CN114090404A (en) | An automated driving acceleration test method considering efficiency and coverage | |
| CN117892178A (en) | Scene extraction method based on intelligent automobile traffic situation risk cognition | |
| CN116049668A (en) | Automatic driving accident severity prediction method based on machine learning | |
| CN112036297A (en) | Classification and extraction method of typical and extreme scenarios based on connected vehicle driving data | |
| CN114971156A (en) | Driving style analysis method based on big data dangerous scene | |
| CN113485301B (en) | A quantitative evaluation method for the expected functional safety performance of autonomous vehicle control systems | |
| CN113642108A (en) | Importance sampling-based key test case generation method for unmanned vehicle crossroad traffic scene | |
| CN107169223A (en) | Vehicle parameter instruction method based on vehicle handling stability test evaluation system | |
| CN108960074B (en) | Small-size pedestrian target detection method based on deep learning | |
| CN112150046A (en) | Road intersection safety risk index calculation method | |
| CN118170648A (en) | Comprehensive evaluation method of automatic driving test scene and related equipment | |
| CN116361175A (en) | Method for creating test scenes of automatic driving vehicles in different safety domains | |
| CN116560988A (en) | Intelligent vehicle driving capability boundary defining method and related equipment | |
| CN116484244A (en) | Analysis method of automatic driving accident mechanism based on clustering model | |
| CN113779864B (en) | Method and device for constructing running design area for automatic driving automobile | |
| CN113345223B (en) | Heterogeneity analysis method of car following behavior based on car following model calibration | |
| CN118736824A (en) | Traffic conflict identification and risk level prediction method and system based on deep learning | |
| CN118025185A (en) | Driving intention recognition method based on Gaussian mixture-hidden Markov model | |
| CN115482662B (en) | A method and system for predicting driver collision avoidance behavior under dangerous conditions | |
| CN114820216B (en) | A driving risk quantification method, classification method and prediction method |
Legal Events
| Date | Code | Title | Description |
|---|---|---|---|
| PB01 | Publication | ||
| PB01 | Publication | ||
| SE01 | Entry into force of request for substantive examination | ||
| SE01 | Entry into force of request for substantive examination | ||
| GR01 | Patent grant | ||
| GR01 | Patent grant |