CN111160650B - Adaboost algorithm-based traffic flow characteristic analysis and prediction method - Google Patents
Adaboost algorithm-based traffic flow characteristic analysis and prediction methodDownload PDFInfo
- Publication number
- CN111160650B CN111160650BCN201911401878.5ACN201911401878ACN111160650BCN 111160650 BCN111160650 BCN 111160650BCN 201911401878 ACN201911401878 ACN 201911401878ACN 111160650 BCN111160650 BCN 111160650B
- Authority
- CN
- China
- Prior art keywords
- prediction
- traffic flow
- weak
- neural network
- sample
- Prior art date
- Legal status (The legal status is an assumption and is not a legal conclusion. Google has not performed a legal analysis and makes no representation as to the accuracy of the status listed.)
- Active
Links
Images


Classifications
- G—PHYSICS
- G06—COMPUTING OR CALCULATING; COUNTING
- G06Q—INFORMATION AND COMMUNICATION TECHNOLOGY [ICT] SPECIALLY ADAPTED FOR ADMINISTRATIVE, COMMERCIAL, FINANCIAL, MANAGERIAL OR SUPERVISORY PURPOSES; SYSTEMS OR METHODS SPECIALLY ADAPTED FOR ADMINISTRATIVE, COMMERCIAL, FINANCIAL, MANAGERIAL OR SUPERVISORY PURPOSES, NOT OTHERWISE PROVIDED FOR
- G06Q10/00—Administration; Management
- G06Q10/04—Forecasting or optimisation specially adapted for administrative or management purposes, e.g. linear programming or "cutting stock problem"
- G—PHYSICS
- G06—COMPUTING OR CALCULATING; COUNTING
- G06N—COMPUTING ARRANGEMENTS BASED ON SPECIFIC COMPUTATIONAL MODELS
- G06N3/00—Computing arrangements based on biological models
- G06N3/02—Neural networks
- G06N3/08—Learning methods
- G06N3/084—Backpropagation, e.g. using gradient descent
- G—PHYSICS
- G06—COMPUTING OR CALCULATING; COUNTING
- G06N—COMPUTING ARRANGEMENTS BASED ON SPECIFIC COMPUTATIONAL MODELS
- G06N3/00—Computing arrangements based on biological models
- G06N3/12—Computing arrangements based on biological models using genetic models
- G06N3/126—Evolutionary algorithms, e.g. genetic algorithms or genetic programming
- G—PHYSICS
- G06—COMPUTING OR CALCULATING; COUNTING
- G06Q—INFORMATION AND COMMUNICATION TECHNOLOGY [ICT] SPECIALLY ADAPTED FOR ADMINISTRATIVE, COMMERCIAL, FINANCIAL, MANAGERIAL OR SUPERVISORY PURPOSES; SYSTEMS OR METHODS SPECIALLY ADAPTED FOR ADMINISTRATIVE, COMMERCIAL, FINANCIAL, MANAGERIAL OR SUPERVISORY PURPOSES, NOT OTHERWISE PROVIDED FOR
- G06Q50/00—Information and communication technology [ICT] specially adapted for implementation of business processes of specific business sectors, e.g. utilities or tourism
- G06Q50/40—Business processes related to the transportation industry
Landscapes
- Engineering & Computer Science (AREA)
- Physics & Mathematics (AREA)
- Theoretical Computer Science (AREA)
- Business, Economics & Management (AREA)
- Health & Medical Sciences (AREA)
- Biophysics (AREA)
- Life Sciences & Earth Sciences (AREA)
- General Physics & Mathematics (AREA)
- Economics (AREA)
- General Health & Medical Sciences (AREA)
- Human Resources & Organizations (AREA)
- Strategic Management (AREA)
- General Engineering & Computer Science (AREA)
- Molecular Biology (AREA)
- Tourism & Hospitality (AREA)
- Evolutionary Biology (AREA)
- Bioinformatics & Computational Biology (AREA)
- Marketing (AREA)
- Artificial Intelligence (AREA)
- Biomedical Technology (AREA)
- Bioinformatics & Cheminformatics (AREA)
- Computational Linguistics (AREA)
- Data Mining & Analysis (AREA)
- Evolutionary Computation (AREA)
- Software Systems (AREA)
- General Business, Economics & Management (AREA)
- Computing Systems (AREA)
- Mathematical Physics (AREA)
- Development Economics (AREA)
- Game Theory and Decision Science (AREA)
- Entrepreneurship & Innovation (AREA)
- Operations Research (AREA)
- Quality & Reliability (AREA)
- Physiology (AREA)
- Genetics & Genomics (AREA)
- Primary Health Care (AREA)
- Management, Administration, Business Operations System, And Electronic Commerce (AREA)
- Traffic Control Systems (AREA)
Abstract
Translated fromChinese
Description
Translated fromChinese技术领域technical field
本发明属于智能交通领域,具体涉及一种基于Adaboost算法的交通流特性分析与预测方法。The invention belongs to the field of intelligent traffic, and in particular relates to a traffic flow characteristic analysis and prediction method based on an Adaboost algorithm.
背景技术Background technique
城市交通控制系统的作用是对城市路网中的交通流进行合理控制,使其分时使用交叉路口,避免发生交通事故、防止交通拥塞并及时为车辆上的有关人员及行人提供交通状况信息以增进交通安全性。为了实现这种控制,系统需要对实时交通状况有即时的了解,同一种预测方法在不同时间段和地段交通流预测的精度存在差异,且同一组数据采用不同的预测方法得到的结果也是存在很大差异。The role of the urban traffic control system is to reasonably control the traffic flow in the urban road network, so that it can use the intersection in time, avoid traffic accidents, prevent traffic congestion, and provide traffic situation information to the relevant personnel and pedestrians on the vehicle in time to avoid traffic accidents. Improve traffic safety. In order to realize this control, the system needs to have an instant understanding of the real-time traffic conditions. The accuracy of traffic flow prediction of the same prediction method in different time periods and sections is different, and the results obtained by different prediction methods for the same set of data are also very different. big difference.
目前交通流分析研究主要是通过混沌理论的递归图法、Kolmogorov熵、 Lyapunov指数等进行混沌辨识,从而判定交通流是否具有可预测性。然而这些方法大多需要大量的样本量,计算方法也还不够成熟,不能进行可对比度量。交通状态的预测模型研究已经有不少的理论和方法,现有的短时交通流量预测方法大致可分为两大类,一类是基于确定的数学模型方法,另一类是基于知识的智能模型预测方法,例如提出的卡尔曼滤波预测交通流具有模型参数少、计算相对简便的特点,但难以反映交通流量预测过程中的非线性和不确定性;提出用遗传算法优化神经网络克服收敛速度慢、推广能力差等问题,这样就会使整个种群进化搜索效率低。由于早期神经网络采用传统BP学习解决了隐含层权值修正问题,而对于多峰值和不可微函数不可能有效地搜索到全局极小值,该方法具有对网络参数的赋值随机性和对初始值的敏感性,导致神经网络模型在工程应用中模拟结果不稳定;并且传统BP学习的一个缺点就是不能在线学习,需要积累足够的样本后统一训练,因此不能根据新样本实时的调整网络参数。At present, traffic flow analysis research mainly uses the recursive graph method of chaos theory, Kolmogorov entropy, Lyapunov exponent, etc. to identify chaos, so as to determine whether the traffic flow is predictable. However, most of these methods require a large sample size, and the computational methods are not yet mature enough to perform comparable measurements. There have been many theories and methods in the study of traffic state prediction models. The existing short-term traffic flow prediction methods can be roughly divided into two categories, one is based on deterministic mathematical model methods, and the other is based on knowledge-based intelligence. Model prediction methods, such as the proposed Kalman filter to predict traffic flow, have the characteristics of few model parameters and relatively simple calculation, but it is difficult to reflect the nonlinearity and uncertainty in the process of traffic flow prediction; it is proposed to use genetic algorithm to optimize neural network to overcome the convergence speed. Slow, poor generalization ability and other problems, which will make the entire population evolutionary search inefficient. Since the early neural network uses traditional BP learning to solve the problem of weight correction in the hidden layer, it is impossible to effectively search for the global minimum value for multi-peak and non-differentiable functions. The sensitivity of the value of the neural network model leads to unstable simulation results in engineering applications; and a disadvantage of traditional BP learning is that it cannot be learned online, and it needs to accumulate enough samples for unified training, so network parameters cannot be adjusted in real time according to new samples.
发明内容SUMMARY OF THE INVENTION
本发明针对现有技术的不足,提供了一种基于Adaboost算法的交通流特性分析与预测方法。Aiming at the deficiencies of the prior art, the present invention provides a traffic flow characteristic analysis and prediction method based on the Adaboost algorithm.
本发明解决技术问题所采取的技术方案为:The technical scheme adopted by the present invention to solve the technical problem is:
本发明具体包括以下各步骤:The present invention specifically includes the following steps:
步骤(1)基于R/S分析法的交通流的短时特性分析Step (1) Short-term characteristic analysis of traffic flow based on R/S analysis method
步骤(1-1)计算步骤:Step (1-1) Calculation steps:
设定一个时间序列{x(t)},t=1,2,…,M有以下计算。Set a time series {x(t)}, t=1,2,...,M has the following calculation.
1)把它分割成为长度为n的[M/n]个等长子序列段,Ia表示第a个子序列段,第a个上的时间序列段表示为{x(i)},i=1,2,…,n。Ea表示第a个子序列段上的均值:1) Divide it into [M/n] equal-length sub-sequence segments of length n, Ia represents the a-th sub-sequence segment, and the a-th time-series segment is represented as {x(i)}, i=1 ,2,…,n. Ea represents the mean on the a-th subsequence segment:

2)子序列段Ia中的元素对于均值的累积离差X(i,a):2) The cumulative dispersion X(i, a) of the elements in the subsequence segment Ia with respect to the mean:

3)子序列段Ia的极差


4)子序列段长度为n划分的重标极差值(R/S)n4) The rescaled range value (R/S) n divided by the subsequence segment length ofn

步骤(1-2)分析过程:Step (1-2) Analysis process:
根据赫斯特指数值的不同,可以将时间序列分为三种类型:Depending on the value of the Hurst exponent, time series can be divided into three types:
(1)0<H<0.5,说明该序列不是随机游走序列,是一种反相关性的时间序列,即未来的变化趋势与过去趋势相反,且H越接近于0反持续性越强。(1) 0<H<0.5, indicating that the sequence is not a random walk sequence, but an inverse correlation time series, that is, the future trend is opposite to the past trend, and the closer H is to 0, the stronger the inverse persistence.
(2)H=0.5,说明该序列是标准的随机游走序列,即未来变化趋势和过去趋势的增量没有关系。(2) H=0.5, indicating that the sequence is a standard random walk sequence, that is, there is no relationship between the future trend and the increment of the past trend.
(3)0.5<H<1,表示该时间序列具有持久性,过去的增加趋势预示未来的增加趋势,过去的减少趋势预示着将来的减少趋势。H趋于1时,表示过去与将来关系密切。根据持久性与反持久性对时间序列未来的变化趋势可做出定量分析。(3) 0.5<H<1, indicating that the time series is persistent, the increasing trend in the past indicates the increasing trend in the future, and the decreasing trend in the past indicates the decreasing trend in the future. When H tends to 1, it means that the past and the future are closely related. Quantitative analysis of the future trend of time series can be made according to persistence and anti-persistence.
步骤(2)交通流时间序列相空间重构Step (2) Phase space reconstruction of traffic flow time series
相空间重构理论是混沌系统分析中至关重要的部分,利用交通流时间序列数据构建相空间,可以将序列在演化的过程中隐藏着规律且有用内部信息体现出来。设交通流时间序列为
X={X(t)|X(t)=[x(t),x(t+τ),…,x(t+(m-1)τ)]T,t=1,2,…,M} (6)X={X(t)|X(t)=[x(t),x(t+τ),…,x(t+(m-1)τ)]T ,t=1,2,…,M } (6)
其中X为m×M维矩阵,重构后所得相空间的相点个数为M=N-(m-1)τ, M个相点在m维相空间中构成一个相型,它表示交通流系统在某一瞬间的状态,按时间增长的顺序将其相连,即可描述交通流系统在m维相空间中的演化轨迹,因此将原来的一维时间序列预测问题转化成m维相点序列的预测。假设预测的相点{X(t),X(t-1),…,X(t-k)},k=1,2,…,t-1已知,当前时刻t+(m-1)τ,需要预测的相点为{X(t+1),X(t+2),…,X(t+p)},其中p=1时称为一步预测,p>1时称为多步预测,预测模型可以表示为:where X is an m×M-dimensional matrix, the number of phase points in the phase space obtained after reconstruction is M=N-(m-1)τ, and the M phase points form a phase shape in the m-dimensional phase space, which represents the traffic The state of the flow system at a certain moment, by connecting them in the order of time growth, can describe the evolution trajectory of the traffic flow system in the m-dimensional phase space, so the original one-dimensional time series prediction problem is transformed into m-dimensional phase points Sequence prediction. Assuming that the predicted phase points {X(t), X(t-1),...,X(t-k)}, k=1,2,...,t-1 are known, the current time t+(m-1)τ, The phase points to be predicted are {X(t+1), X(t+2),...,X(t+p)}, where p=1 is called one-step prediction, and p>1 is called multi-step prediction , the prediction model can be expressed as:
{x(t+(m-1)τ+1),…,x(t+(m-1)τ+p)}=F(X(t),…,X(t-k)) (7){x(t+(m-1)τ+1),…,x(t+(m-1)τ+p)}=F(X(t),…,X(t-k)) (7)
利用前馈神经网络的泛化逼近能力,实现交通流的一步或者多步预测。本方法利用C-C方法计算嵌入维数和延迟时间,通过wolf方法计算交通流的最大 Lyapunov指数来判断交通流的混沌特性。Using the generalization approximation ability of feed-forward neural network, it can realize one-step or multi-step prediction of traffic flow. This method uses the C-C method to calculate the embedded dimension and delay time, and uses the wolf method to calculate the maximum Lyapunov exponent of the traffic flow to judge the chaotic characteristics of the traffic flow.
步骤(3)MEC-BP融合算法Step (3) MEC-BP fusion algorithm
思维进化算法是针对遗传算法的缺陷和模仿人类思维进化过程的一种新型进化算法。其继承了遗传算法的部分思想,又引入了“趋同”和“异化”两个新的操作算子。趋同和异化分别负责局部和全局寻优,两算子一定独立且相互协调,任一操作的改进都可提高算法的整体搜索效率,且其定向学习与记忆机制,使其具有极强的全局优化能力。The evolutionary algorithm of thinking is a new evolutionary algorithm aiming at the defects of genetic algorithm and imitating the evolution process of human thinking. It inherits part of the idea of genetic algorithm, and introduces two new operators of "convergence" and "dissimilation". Convergence and dissimilation are responsible for local and global optimization respectively. The two operators must be independent and coordinated with each other. The improvement of any operation can improve the overall search efficiency of the algorithm, and its directional learning and memory mechanism make it have a strong global optimization. ability.
设t为在MEC全局迭代中当前正在进行的迭代次数;ρ为在某个子种群内部迭代中当前正在进行的迭代次数。子群体中的每一个个体都代表了一组BP神经网络融合算法中的初始权值和阈值,而衡量单个个体Ni,j好坏的指标适用度则由训练后收敛的BP神经网络融合模型所得融合结果经进一步计算获得,在子种群的内部迭代中,各子种群中经过局部公告板选择出最优个体Ni,pbest,再令该个体代表整个子种群通过全局公告板参与全局竞争,选择出全局最优子种群Sgbest以及包含在内的全局最优个体Ngbest。经过多次迭代后,由最终全局最优个体所代表的初始权值和阈值训练而得的MEC- BP神经网络模型即为最终得到的多源交通数据融合模型。Let t be the number of iterations currently in progress in the global iteration of MEC; ρ be the number of iterations currently in progress in a certain subpopulation internal iteration. Each individual in the subgroup represents a set of initial weights and thresholds in the BP neural network fusion algorithm, and the index applicability to measure the quality of a single individual Ni,j is determined by the convergent BP neural network fusion model after training. The obtained fusion result is obtained by further calculation. In the internal iteration of the sub-population, the optimal individual Ni,pbest is selected from each sub-population through the local bulletin board, and then the individual represents the entire sub-population to participate in the global competition through the global bulletin board. The global optimal subpopulation Sgbest and the included global optimal individual Ngbest are selected . After many iterations, the MEC-BP neural network model trained by the initial weights and thresholds represented by the final global optimal individual is the final multi-source traffic data fusion model.
步骤(4)基于Adaboost算法的神经网络集成预测模型Step (4) Neural Network Integrated Prediction Model Based on Adaboost Algorithm
自适应增强算法(Adaboost)是通过反复搜索样本特征空间,获取样本权重,并在迭代过程中不断调整训练样本的权重,增加(减小)预测精度低(高)的样本的权重,并采用加权多数表决的方法组合形成一个强预测器,即加大(减小)预测误差率较小(大)的弱预测器的权值,使得它在表决中起较大(小)作用,显著提高学习算法的预测性能。The adaptive enhancement algorithm (Adaboost) is to repeatedly search the sample feature space, obtain the sample weight, and continuously adjust the weight of the training sample in the iterative process, increase (decrease) the weight of the sample with low (high) prediction accuracy, and use the weighted The majority voting method is combined to form a strong predictor, that is, increasing (decreasing) the weight of the weak predictor with a smaller (larger) prediction error rate, so that it plays a larger (smaller) role in voting and significantly improves learning. Predictive performance of the algorithm.
步骤(4-1)Adaboost算法步骤Step (4-1) Adaboost algorithm steps
Step1:数据获取和网络初始化。从样本空间选取m组训练样本T={(Xi,yi)},赋予训练样本权重分布为w1i=1/m,i=1,2,…,m,依据样本输入和输出维数确定网络结构,神经网络初始权重和阈值由改进思维进化算法优化获得,D(1)表示获得样本的初始权重,K表示预测器的数量。Step1: Data acquisition and network initialization. Select m groups of training samples T={(Xi , yi )} from the sample space, and assign the weight distribution to the training samples as w1i =1/m, i=1,2,...,m, according to the sample input and output dimensions Determine the network structure, the initial weight and threshold of the neural network are optimized by the improved thinking evolution algorithm, D(1) represents the initial weight of the obtained sample, and K represents the number of predictors.
D(1)=(w11,w12,…w1i,…,w1m) (8)D(1)=(w11 ,w12 ,...w1i ,...,w1m ) (8)
Step2:进行迭代k=1,2,…,KStep2: Iterate k=1,2,...,K
(a)训练第k个弱预测器时,用弱预测器Hk(x)训练样本并预测训练数据输出回归误差率ξk,计算训练集上的样本最大误差Ek和每个样本的相对误差ξki:(a) When training the kth weak predictor, use the weak predictor Hk (x) to train samples and predict the training data output regression error rate ξk , calculate the maximum error Ek of the samples on the training set and the relative value of each sample Error ξki :
Ek=max(|yi-Hk(Xi)) (9)Ek =max(|yi -Hk (Xi )) (9)


(b)计算该弱预测器在最终预测器中所占的权重ak:(b) Calculate the weightak occupied by the weak predictor in the final predictor:

(c)根据预测序列权重ak调整下一轮训练样本的权重:(c) Adjust the weight of the next round of training samples according to the predicted sequence weight ak :
D(k+1)=(wk+1,1,wk+1,2,…,wk+1,m) (13)D(k+1)=(wk+1,1 ,wk+1,2 ,…,wk+1,m ) (13)

Step3:训练K轮后得到K组弱预测函数Hk(x),按弱预测器权重组合各个弱预测函数得到强预测器h(x)为:Step3: After K rounds of training, K groups of weak prediction functions Hk (x) are obtained, and each weak prediction function is combined according to the weight of the weak predictor to obtain the strong predictor h (x):

Step4:为了更好地求出各组弱预测器的加权值,通过Adaboost算法训练MEC-BP神经网络得到K组弱预测器的弱预测函数值Hk(x)之后,再次采用预测误差平方和倒数准则进行每组弱预测函数的加权值wk求解,最终得到累加的强预测器h(x)=∑wk*Hk(xk,ak)。预测误差平方和越大,表明该项预测模型的预测精度就越低,从而它在组合预测中重要性就降低,对预测误差平方和较小的单项预测模型在组合预测中的应赋予较大加权系数。加权系数计算方法为:Step4: In order to better obtain the weighted value of each group of weak predictors, the MEC-BP neural network is trained by the Adaboost algorithm to obtain the weak prediction function value Hk (x) of the K groups of weak predictors, and the sum of squared prediction errors is used again. The reciprocal criterion is used to solve the weighted value wk of each group of weak prediction functions, and finally the accumulated strong predictor h(x)=∑wk *Hk (xk ,ak ) is obtained. The larger the sum of squares of the prediction errors, the lower the prediction accuracy of the prediction model, so its importance in the combined prediction is reduced. Weighting factor. The calculation method of the weighting coefficient is:

设yki为第k种弱预测器在第i时刻的预测值,yi为同一预测对象的第i时刻观测值,m表示时间长度,则Ek为第k种弱预测器的预测误差平方和。Let yki be the predicted value of the k-th weak predictor at the i-th time, yi be the observation value of the same prediction object at the i-th time, m represents the time length, then Ek is the prediction error square of the k-th weak predictor and.

本发明的有益效果:本发明针对短时交通流量的不确定性、复杂性和高度非线性的基本特征,R/S分析法应用于短时交通流分析,能揭示微观交通流运动的内在规律,定量地揭示交通系统的动态学特性。同时采用思维进化算法优化BP 神经网络的初始参数选取,提高神经网络的预测精度,将多个思维进化算法优化后的网络进行Adaboost算法集成有效综合决策,提高网络的泛化性,再此基础上通过预测误差平方和倒数准则重新调整Adaboost算法对弱预测器权值分布,使每个预测器最大程度提高网络预测精度。然后,采用PeMS系统数据集,根据创建的集成神经网络预测模型进行短时交通流的预测。Beneficial effects of the present invention: The present invention aims at the basic characteristics of uncertainty, complexity and high nonlinearity of short-term traffic flow, and the R/S analysis method is applied to the analysis of short-term traffic flow, which can reveal the inherent law of microscopic traffic flow movement , quantitatively revealing the dynamic characteristics of the traffic system. At the same time, the evolutionary thinking algorithm is used to optimize the selection of initial parameters of the BP neural network, and the prediction accuracy of the neural network is improved. The Adaboost algorithm is integrated into the network optimized by multiple thinking evolutionary algorithms for effective comprehensive decision-making to improve the generalization of the network. The weight distribution of weak predictors is re-adjusted by Adaboost algorithm through the prediction error square and reciprocal criterion, so that each predictor can maximize the prediction accuracy of the network. Then, using the PeMS system data set, the prediction of short-term traffic flow is carried out according to the created ensemble neural network prediction model.
附图说明Description of drawings
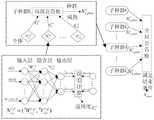
图1MEC-BP融合算法结构框图。Figure 1 is a block diagram of the structure of the MEC-BP fusion algorithm.
图2基于Adaboost算法的神经网络集成结构图。Fig. 2 The neural network integration structure diagram based on Adaboost algorithm.
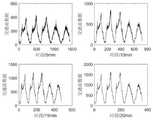
图3连续5天不同统计尺度交通流时间序列图。Figure 3. Time series diagram of traffic flow at different statistical scales for 5 consecutive days.
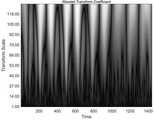
图4 5min间隔的短期交通流小波变换实部时频分布。Figure 4. Time-frequency distribution of real part of short-term traffic flow wavelet transform at 5min interval.
图5不同统计尺度的Hurst指数曲线图。Figure 5. Curves of Hurst exponents at different statistical scales.
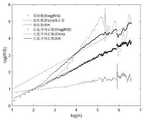
图6统计尺度10min的交通流时间序列的log(R/S)n和Vn关于logn变化曲线。Fig. 6 Change curves of log(R/S)n and Vn with respect to log n of the traffic flow time series with a statistical scale of 10 min.
图7相同时间长度不同统计尺度下得到的Vn随logn的变化曲线。Fig. 7 Variation curves of Vn with log n obtained under different statistical scales for the same time length.
图8不同统计尺度的交通流序列的三维相空间重构。Figure 8. 3D phase space reconstruction of traffic flow sequences at different statistical scales.
图9不同模型下的短时交通流的预测值比较。Fig. 9 Comparison of predicted values of short-term traffic flow under different models.
图10不同模型的交通流预测值与估计值的误差绝对值比较。Fig. 10 Comparison of absolute values of errors between predicted and estimated traffic flow for different models.
具体实施方式Detailed ways
本发明包括以下各步骤:The present invention includes the following steps:
步骤(1)基于R/S分析法的交通流的短时特性分析Step (1) Short-term characteristic analysis of traffic flow based on R/S analysis method
步骤(1-1)计算步骤:Step (1-1) Calculation steps:
设定一个时间序列{x(t)},t=1,2,…,M有以下计算。Set a time series {x(t)}, t=1,2,...,M has the following calculation.
1)把它分割成为长度为n的[M/n]个等长子序列段,Ia表示第a个子序列段,第a个上的时间序列段表示为{x(i)},i=1,2,…,n。Ea表示第a个子序列段上的均值:1) Divide it into [M/n] equal-length sub-sequence segments of length n, Ia represents the a-th sub-sequence segment, and the a-th time-series segment is represented as {x(i)}, i=1 ,2,…,n. Ea represents the mean on the a-th subsequence segment:

2)子序列段Ia中的元素对于均值的累积离差X(i,a):2) The cumulative dispersion X(i, a) of the elements in the subsequence segment Ia with respect to the mean:

3)子序列段Ia的极差


4)子序列段长度为n划分的重标极差值(R/S)n4) The rescaled range value (R/S) n divided by the subsequence segment length ofn

步骤(1-2)分析过程:Step (1-2) Analysis process:
根据赫斯特指数值的不同,可以将时间序列分为三种类型:Depending on the value of the Hurst exponent, time series can be divided into three types:
(1)0<H<0.5,说明该序列不是随机游走序列,是一种反相关性的时间序列,即未来的变化趋势与过去趋势相反,且H越接近于0反持续性越强。(1) 0<H<0.5, indicating that the sequence is not a random walk sequence, but an inverse correlation time series, that is, the future trend is opposite to the past trend, and the closer H is to 0, the stronger the inverse persistence.
(2)H=0.5,说明该序列是标准的随机游走序列,即未来变化趋势和过去趋势的增量没有关系。(2) H=0.5, indicating that the sequence is a standard random walk sequence, that is, there is no relationship between the future trend and the increment of the past trend.
(3)0.5<H<1,表示该时间序列具有持久性,过去的增加趋势预示未来的增加趋势,过去的减少趋势预示着将来的减少趋势。H趋于1时,表示过去与将来关系密切。根据持久性与反持久性对时间序列未来的变化趋势可做出定量分析。(3) 0.5<H<1, indicating that the time series is persistent, the increasing trend in the past indicates the increasing trend in the future, and the decreasing trend in the past indicates the decreasing trend in the future. When H tends to 1, it means that the past and the future are closely related. Quantitative analysis of the future trend of time series can be made according to persistence and anti-persistence.
步骤(2)交通流时间序列相空间重构Step (2) Phase space reconstruction of traffic flow time series
相空间重构理论是混沌系统分析中至关重要的部分,利用交通流时间序列数据构建相空间,可以将序列在演化的过程中隐藏着规律且有用内部信息体现出来。设交通流时间序列为
X={X(t)|X(t)=[x(t),x(t+τ),…,x(t+(m-1)τ)]T,t=1,2,…,M} (6)X={X(t)|X(t)=[x(t),x(t+τ),…,x(t+(m-1)τ)]T ,t=1,2,…,M } (6)
其中X为m×M维矩阵,重构后所得相空间的相点个数为M=N-(m-1)τ, M个相点在m维相空间中构成一个相型,它表示交通流系统在某一瞬间的状态,按时间增长的顺序将其相连,即可描述交通流系统在m维相空间中的演化轨迹,因此将原来的一维时间序列预测问题转化成m维相点序列的预测。假设预测的相点{X(t),X(t-1),…,X(t-k)},k=1,2,…,t-1已知,当前时刻t+(m-1)τ,需要预测的相点为{X(t+1),X(t+2),…,X(t+p)},其中p=1时称为一步预测,p>1时称为多步预测,预测模型可以表示为:where X is an m×M-dimensional matrix, the number of phase points in the phase space obtained after reconstruction is M=N-(m-1)τ, and the M phase points form a phase shape in the m-dimensional phase space, which represents the traffic The state of the flow system at a certain moment, by connecting them in the order of time growth, can describe the evolution trajectory of the traffic flow system in the m-dimensional phase space, so the original one-dimensional time series prediction problem is transformed into m-dimensional phase points Sequence prediction. Assuming that the predicted phase points {X(t), X(t-1),...,X(t-k)}, k=1,2,...,t-1 are known, the current time t+(m-1)τ, The phase points to be predicted are {X(t+1), X(t+2),...,X(t+p)}, where p=1 is called one-step prediction, and p>1 is called multi-step prediction , the prediction model can be expressed as:
{x(t+(m-1)τ+1),…,x(t+(m-1)τ+p)}=F(X(t),…,X(t-k)) (7){x(t+(m-1)τ+1),…,x(t+(m-1)τ+p)}=F(X(t),…,X(t-k)) (7)
利用前馈神经网络的泛化逼近能力,实现交通流的一步或者多步预测。本方法利用C-C方法计算嵌入维数和延迟时间,通过wolf方法计算交通流的最大 Lyapunov指数来判断交通流的混沌特性。Using the generalization approximation ability of feed-forward neural network, it can realize one-step or multi-step prediction of traffic flow. This method uses the C-C method to calculate the embedded dimension and delay time, and uses the wolf method to calculate the maximum Lyapunov exponent of the traffic flow to judge the chaotic characteristics of the traffic flow.
步骤(3)MEC-BP融合算法Step (3) MEC-BP fusion algorithm
思维进化算法是针对遗传算法的缺陷和模仿人类思维进化过程的一种新型进化算法。其继承了遗传算法的部分思想,又引入了“趋同”和“异化”两个新的操作算子。趋同和异化分别负责局部和全局寻优,两算子一定独立且相互协调,任一操作的改进都可提高算法的整体搜索效率,且其定向学习与记忆机制,使其具有极强的全局优化能力。The evolutionary algorithm of thinking is a new evolutionary algorithm aiming at the defects of genetic algorithm and imitating the evolution process of human thinking. It inherits part of the idea of genetic algorithm, and introduces two new operators of "convergence" and "dissimilation". Convergence and dissimilation are responsible for local and global optimization respectively. The two operators must be independent and coordinated with each other. The improvement of any operation can improve the overall search efficiency of the algorithm, and its directional learning and memory mechanism make it have a strong global optimization. ability.
根据附图1,t为在MEC全局迭代中当前正在进行的迭代次数;ρ为在某个子种群内部迭代中当前正在进行的迭代次数。子群体中的每一个个体都代表了一组BP神经网络融合算法中的初始权值和阈值,而衡量单个个体Ni,j好坏的指标适用度则由训练后收敛的BP神经网络融合模型所得融合结果经进一步计算获得,在子种群的内部迭代中,各子种群中经过局部公告板选择出最优个体Ni,pbest,再令该个体代表整个子种群通过全局公告板参与全局竞争,选择出全局最优子种群Sgbest以及包含在内的全局最优个体Ngbest。经过多次迭代后,由最终全局最优个体所代表的初始权值和阈值训练而得的MEC-BP神经网络模型即为最终得到的多源交通数据融合模型。According to Fig. 1, t is the number of iterations currently in progress in the global iteration of the MEC; ρ is the number of iterations currently in progress in the internal iteration of a certain sub-population. Each individual in the subgroup represents a set of initial weights and thresholds in the BP neural network fusion algorithm, and the index applicability to measure the quality of a single individual Ni,j is determined by the convergent BP neural network fusion model after training. The obtained fusion result is obtained by further calculation. In the internal iteration of the sub-population, the optimal individual Ni,pbest is selected from each sub-population through the local bulletin board, and then the individual represents the entire sub-population to participate in the global competition through the global bulletin board. The global optimal subpopulation Sgbest and the included global optimal individual Ngbest are selected . After many iterations, the MEC-BP neural network model trained by the initial weights and thresholds represented by the final global optimal individual is the final multi-source traffic data fusion model.
步骤(4)基于Adaboost算法的神经网络集成预测模型Step (4) Neural Network Integrated Prediction Model Based on Adaboost Algorithm
自适应增强算法(Adaboost)是通过反复搜索样本特征空间,获取样本权重,并在迭代过程中不断调整训练样本的权重,增加(减小)预测精度低(高)的样本的权重,并采用加权多数表决的方法组合形成一个强预测器,即加大(减小)预测误差率较小(大)的弱预测器的权值,使得它在表决中起较大(小)作用,显著提高学习算法的预测性能,见图2。The adaptive enhancement algorithm (Adaboost) is to repeatedly search the sample feature space, obtain the sample weight, and continuously adjust the weight of the training sample in the iterative process, increase (decrease) the weight of the sample with low (high) prediction accuracy, and use the weighted The majority voting method is combined to form a strong predictor, that is, increasing (decreasing) the weight of the weak predictor with a smaller (larger) prediction error rate, so that it plays a larger (smaller) role in voting and significantly improves learning. The prediction performance of the algorithm is shown in Figure 2.
步骤(4-1)Adaboost算法步骤Step (4-1) Adaboost algorithm steps
Step1:数据获取和网络初始化。从样本空间选取m组训练样本T={(Xi,yi)},赋予训练样本权重分布为w1i=1/m,i=1,2,…,m,依据样本输入和输出维数确定网络结构,神经网络初始权重和阈值由改进思维进化算法优化获得,D(1)表示获得样本的初始权重,K表示预测器的数量。Step1: Data acquisition and network initialization. Select m groups of training samples T={(Xi , yi )} from the sample space, and assign the weight distribution to the training samples as w1i =1/m, i=1,2,...,m, according to the sample input and output dimensions Determine the network structure, the initial weight and threshold of the neural network are optimized by the improved thinking evolution algorithm, D(1) represents the initial weight of the obtained sample, and K represents the number of predictors.
D(1)=(w11,w12,…w1i,…,w1m) (8)D(1)=(w11 ,w12 ,...w1i ,...,w1m ) (8)
Step2:进行迭代k=1,2,…,KStep2: Iterate k=1,2,...,K
(a)训练第k个弱预测器时,用弱预测器Hk(x)训练样本并预测训练数据输出回归误差率ξk,计算训练集上的样本最大误差Ek和每个样本的相对误差ξki:(a) When training the kth weak predictor, use the weak predictor Hk (x) to train samples and predict the training data output regression error rate ξk , calculate the maximum error Ek of the samples on the training set and the relative value of each sample Error ξki :
Ek=max(|yi-Hk(Xi)) (9)Ek =max(|yi -Hk (Xi )) (9)


(b)计算该弱预测器在最终预测器中所占的权重ak:(b) Calculate the weightak occupied by the weak predictor in the final predictor:

(c)根据预测序列权重ak调整下一轮训练样本的权重:(c) Adjust the weight of the next round of training samples according to the predicted sequence weight ak :
D(k+1)=(wk+1,1,wk+1,2,…,wk+1,m) (13)D(k+1)=(wk+1,1 ,wk+1,2 ,…,wk+1,m ) (13)

Step3:训练K轮后得到K组弱预测函数Hk(x),按弱预测器权重组合各个弱预测函数得到强预测器h(x)为:Step3: After K rounds of training, K groups of weak prediction functions Hk (x) are obtained, and each weak prediction function is combined according to the weight of the weak predictor to obtain the strong predictor h (x):

Step4:为了更好地求出各组弱预测器的加权值,通过Adaboost算法训练 MEC-BP神经网络得到K组弱预测器的弱预测函数值Hk(x)之后,再次采用预测误差平方和倒数准则进行每组弱预测函数的加权值wk求解,最终得到累加的强预测器h(x)=∑wk*Hk(xk,ak)。预测误差平方和越大,表明该项预测模型的预测精度就越低,从而它在组合预测中重要性就降低,对预测误差平方和较小的单项预测模型在组合预测中的应赋予较大加权系数。加权系数计算方法为:Step4: In order to better obtain the weighted value of each group of weak predictors, the MEC-BP neural network is trained by the Adaboost algorithm to obtain the weak prediction function value Hk (x) of the K groups of weak predictors, and the sum of squared prediction errors is used again. The reciprocal criterion is used to solve the weighted value wk of each group of weak prediction functions, and finally the accumulated strong predictor h(x)=∑wk *Hk (xk ,ak ) is obtained. The larger the sum of squares of the prediction errors, the lower the prediction accuracy of the prediction model, so its importance in the combined prediction is reduced. Weighting factor. The calculation method of the weighting coefficient is:

设yki为第k种弱预测器在第i时刻的预测值,yi为同一预测对象的第i时刻观测值,m表示时间长度,则Ek为第k种弱预测器的预测误差平方和。Let yki be the predicted value of the k-th weak predictor at the i-th time, yi be the observation value of the same prediction object at the i-th time, m represents the time length, then Ek is the prediction error square of the k-th weak predictor and.

步骤(5)载入PeMS数据集进行交通流仿真测试Step (5) Load the PeMS dataset for traffic flow simulation test
为验证本发明的有效性,使用PeMS系统中的源数据有两种:30秒的交通流量和车道占有率,它将30秒数据聚合生成5min、15min、1hour等数据集。实验数据集1:采集时间2011年5月2日—5月5日连续4个工作日的单个路段车流聚合,采用5min统计尺度下记录交通流数据;实验数据集2:采样时间为2011 年6月1日—2011年6月5日(周三到周日)连续5个日期的3个路段车流聚合,观测时间为每天连续24小时,采用5、10、15和20等不同统计尺度下记录交通流数据,分别得到了1440、720、480和360个数据。In order to verify the effectiveness of the present invention, there are two kinds of source data in the PeMS system: 30-second traffic flow and lane occupancy rate, which aggregates the 30-second data to generate 5min, 15min, 1hour and other data sets. Experimental Data Set 1: The collection time is from May 2, 2011 to May 5, 2011, and the collection time is the aggregation of traffic flow of a single road section for 4 consecutive working days, and the traffic flow data is recorded under the statistical scale of 5 minutes; Experimental Data Set 2: The sampling time is June 2011 From January 1st to June 5th, 2011 (Wednesday to Sunday), the traffic flow of 3 road sections on 5 consecutive days was aggregated. The observation time was 24 hours a day. Traffic was recorded under different statistical scales such as 5, 10, 15 and 20. Streaming data, we got 1440, 720, 480 and 360 data respectively.
图3中曲线之间的相似性说明在不同尺度上,交通流变化存在自相似性,观察时段5min数据中交通流时间序列的变化趋势,可以发现交通流数据呈现出明显的准周期性趋势。为了识别交通流数据的自相似性,采用小波变换对交通流数据进行分解,图4所示交通流数据的小波分解系数,小波系数指相似性指数(RI), RI越大自相似越大,由于出行需求的变化,工作日(前三天)和周末(后两天)的小波系数有所不同,说明交通流具有时段性,故可将交通流数据时段分为忙碌时段、空闲时段和正常时段。本实验数据表明,交通流时间段可以分为:忙碌时段为7:00-9:30,14:30-18:30;空闲时段为0:00-5:00;其余为正常时段。The similarity between the curves in Figure 3 shows that the traffic flow changes have self-similarity at different scales. By observing the change trend of the traffic flow time series in the 5-min data, it can be found that the traffic flow data presents an obvious quasi-periodic trend. In order to identify the self-similarity of the traffic flow data, the wavelet transform is used to decompose the traffic flow data. The wavelet decomposition coefficient of the traffic flow data is shown in Fig. 4. The wavelet coefficient refers to the similarity index (RI). The greater the RI, the greater the self-similarity. Due to the change of travel demand, the wavelet coefficients of weekdays (the first three days) and weekends (the last two days) are different, indicating that the traffic flow has time period, so the traffic flow data period can be divided into busy period, idle period and normal period time period. The experimental data shows that the traffic flow time periods can be divided into: busy periods are 7:00-9:30, 14:30-18:30; idle periods are 0:00-5:00; the rest are normal periods.
A.基于R/S分析法对短时交通流可预测分析结果A. Predictable analysis results of short-term traffic flow based on R/S analysis method
R/S分析法求解Hurst值会受到样本量的影响,为了可以对不同观测尺度的数据进行进一步的跟踪对比,以交通流的自然周期一天为单位对交通流序列进行累加,以最大程度地保留周期内表征交通流序列的变化规律的信息计算,以下是对数据集2交通流的分析。The Hurst value obtained by the R/S analysis method will be affected by the sample size. In order to further track and compare the data of different observation scales, the traffic flow sequence is accumulated in the natural cycle of the traffic flow per day to maximize the retention The information calculation that characterizes the change law of the traffic flow sequence in the cycle, the following is the analysis of the traffic flow of the
(1)图5为不同统计尺度不同天数的Hurst变化曲线,显示表明Hurst指数的值均位于区间[0.5,1],这表示交通流时间序列具有长期的记忆性质,表明交通流变化的整体方向将继承过去的整体趋势,过去的增加(减少)趋势预示未来的增加 (减少)趋势。图中每条曲线都随着时间长度的增加而呈整体下降趋势,即Hurst 指数随样本量的增加而降低,这表明在同一统计尺度范围内,当时间序列达到一定的尺度后,再增加数据,将破环原时间序列的自相似性;相同时间长度下Hurst 指数随时间统计尺度(s)的增加而呈现下降趋势,交通流序列具有短时有效性,随着时间的增长,时间序列的长记忆性减弱。(1) Figure 5 shows the Hurst change curves of different statistical scales and different days. It shows that the values of Hurst exponent are all in the interval [0.5, 1], which indicates that the traffic flow time series has a long-term memory property, indicating the overall direction of traffic flow changes. The overall trend of the past will be inherited, and the increase (decrease) trend in the past predicts the increase (decrease) trend in the future. Each curve in the figure shows an overall downward trend with the increase of the time length, that is, the Hurst index decreases with the increase of the sample size, which indicates that within the same statistical scale, when the time series reaches a certain scale, then increase the data , which will destroy the self-similarity of the original time series; under the same time length, the Hurst exponent shows a downward trend with the increase of the time statistical scale (s), and the traffic flow series has short-term validity. Decreased long memory.
(2)表1为三种不同时段对不同统计尺度相同天数(5天)的Hurst指数的计算,结果表明,相同统计尺度交通流从空闲时段到忙碌时段的Hurst指数呈递增趋势,这是因为对相同时间尺度下,交通越忙自相似越强,交通的可预测性越强;同一时段不同尺度的Hurst指数呈递减趋势,预计随着统计尺度的不断增大,Hurst 指数越接近0.5,交通流没有分形特征,主要是因为过去与未来不同存在了相关性时间序列为完全独立过程。(2) Table 1 shows the calculation of Hurst exponents for the same number of days (5 days) with different statistical scales in three different time periods. The results show that the Hurst exponents of traffic flows on the same statistical scale from idle time to busy time are increasing. This is because For the same time scale, the busier the traffic, the stronger the self-similarity, and the stronger the traffic predictability; the Hurst index of different scales at the same time period shows a decreasing trend. Flow does not have fractal characteristics, mainly because the past and future are different and there is a correlation. Time series is a completely independent process.
表1不同时段不同统计尺度相同天数的Hurst指数Table 1 Hurst index of the same number of days with different statistical scales in different time periods

(3)如果时间序列是具有长程相关性的,时间之间的相互依赖性是很强的。图6给出了在统计尺度10min的交通流时间序列的log(R/S)n和Vn关于logn变化曲线,可看出原始序列Vn持续上升并达到n=207时达到最大,然后急剧下降,所以可以断定统计尺度10min的交通流的平均循环周期为207min,也就是说该序列平均经过207min就失去了对初始条件的记忆;同时发现打乱序列后的Hurst 指数(0.6233)小于与原始序列的Hurst指数(0.7031),这是由于数据经打乱之后,破坏了原始序列的相关性结构,交通流时间序列的有序程度降低;打乱序列后发现Vn是一条平坦的曲线,说明该序列变成独立随机过程不具备长程相关性。(3) If the time series has long-range correlation, the interdependence between time is very strong. Figure 6 shows the change curves of log(R/S)n and Vn with respect to log n of the traffic flow time series with a statistical scale of 10 min. It can be seen that the original sequence Vn continues to rise and reaches a maximum when n=207, and then sharply Therefore, it can be concluded that the average circulation period of the traffic flow with a statistical scale of 10 minutes is 207 minutes, that is to say, the sequence loses its memory of the initial conditions after an average of 207 minutes. The Hurst exponent of the sequence (0.7031), this is because the correlation structure of the original sequence is destroyed after the data is scrambled, and the order degree of the traffic flow time series is reduced; after the sequence is scrambled, it is found that Vn is a flat curve, indicating that The sequence becomes an independent random process with no long-range correlation.
(4)图7为相同时间长度不同统计尺度下得到的Vn随logn的变化曲线,表是不同统计尺度下短时交通流序列的计算结果,发现随着统计尺度的减小则Vn所突变时间越长,即长记忆消失所需要的时间越长,但实际上这种长期的记忆性并非无穷长的,而是随时间逐渐减弱直至忘却,所以短时预测仍有可能。当τ=1hour 时该Vn统计量曲线上升趋势不明显,Hurst指数越接近0.5,则序列中的噪声越多,序列越接近随机过程。(4) Figure 7 shows the variation curve of Vn with log n obtained under different statistical scales for the same time length. The table shows the calculation results of short-term traffic flow sequences under different statistical scales. It is found that as the statistical scale decreases, Vn The longer the mutation time, the longer it takes for long-term memory to disappear, but in fact this long-term memory is not infinite, but gradually weakens over time until it is forgotten, so short-term prediction is still possible. When τ=1hour, the upward trend of theVn statistic curve is not obvious. The closer the Hurst exponent is to 0.5, the more noise in the sequence, and the closer the sequence is to a random process.
(5)为了定量描述交通流的复杂性,对基于分形、混沌和熵的交通复杂性进行分析,如表2所示,Hurst指数和样本熵随着统计尺度的增加而逐渐减小,发现5min采样的样本熵最大,则时间序列就越复杂;最大Lyapunov指数始终为正数,则该系统必定在某一矢量方向上的运动是不稳定的,同时意味着这一方向上有混沌吸引子的出现,是整个系统的运动处于混沌状态。根据图8所示,从交通流序列的重构相空间的不同分量可以看出,其轨迹反复折叠和相互交叉形成密集带,当统计尺度变得更大时,交通特征变得更明显。(5) In order to quantitatively describe the complexity of traffic flow, the traffic complexity based on fractal, chaos and entropy is analyzed. As shown in Table 2, Hurst exponent and sample entropy gradually decrease with the increase of statistical scale. If the sample entropy sampled is the largest, the time series will be more complicated; if the largest Lyapunov exponent is always positive, the system must be unstable in a certain vector direction, which means that there are chaotic attractors in this direction. , the motion of the whole system is in a chaotic state. According to Fig. 8, it can be seen from the different components of the reconstructed phase space of the traffic flow sequence that its trajectories are repeatedly folded and intersected to form dense bands, and when the statistical scale becomes larger, the traffic characteristics become more obvious.
表2不同统计尺度下交通流特征复杂性分析Table 2. Complexity analysis of traffic flow characteristics at different statistical scales

B.模型预测分析B. Model Predictive Analysis
根据交通流的特性设计BP神经网络,该网络分为输入层、隐含层和输出层三层,以窗宽为m=4时的特征向量及对应输出的构造过程,最终得到用于训练神经网络的样本为


其中:n为交通流数据序列的长度,yi为样本输出值,di为样本目标值。决定系数(R2)其指标越大模型效果更好,R2∈[0,1];均方误差(MSE)和平均绝对误差(MAD)的指标越小表明相应模型的结构越合理。Among them: n is the length of the traffic flow data sequence,yi is the sample output value, and di is the sample target value. The larger the coefficient of determination (R2 ), the better the model effect, R2 ∈ [0,1]; the smaller the index of mean square error (MSE) and mean absolute error (MAD), the more reasonable the structure of the corresponding model.
通过Matlab2017b仿真软件对传统BP、BP_Adaboost、MEC-BP方法和 MEC-BP_Adaboost模型和改进MEC-BP_Adaboost模型(本方法)进行训练,并利用训练好的模型对数据集1进行短时交通流单步预测,结果见表3及图9、10。The traditional BP, BP_Adaboost, MEC-BP methods, the MEC-BP_Adaboost model and the improved MEC-BP_Adaboost model (this method) are trained by the Matlab2017b simulation software, and the short-term traffic flow single-step prediction is performed on the
表3不同预测模型性能指标比较Table 3 Comparison of performance indicators of different prediction models

从上表3和图9、10可知,基于MEC-BP模型与传统BP模型相比,均方误差和平均绝对误差分别下降29.8%和3.5%,证明MEC在优化BP模型的初始参数方面的有效性;基于BP_Adaboost模型和传统BP模型相比,均方误差和平均绝对误差分别下降56.3%和27.1%,证明Adaboost算法对神经网络的泛化能力有极大的提升,表明Adaboost算法采用加权多数表决的方法,能有效提高模型的预测精度及避免模型“过拟合”现象的发生;基于本方法与BP模型相比,均方误差和平均绝对误差分别下降78.2%和46.4%,证明改进方法对交通流预测具有合理性;基于本方法和MEC-BP_Adaboost模型相比,均方误差和平均绝对误差分别下降44.9%和25.9%,证明了采用误差平方和倒数准则对弱预测器的权值大小,使弱预测器预测精度更高,更有效的提高预测器的泛化能力。It can be seen from the above Table 3 and Figures 9 and 10 that the mean square error and mean absolute error of the MEC-BP model are reduced by 29.8% and 3.5%, respectively, compared with the traditional BP model, which proves that MEC is effective in optimizing the initial parameters of the BP model. Based on the BP_Adaboost model and the traditional BP model, the mean square error and the mean absolute error decrease by 56.3% and 27.1% respectively, which proves that the Adaboost algorithm has greatly improved the generalization ability of the neural network, indicating that the Adaboost algorithm adopts weighted majority voting. Compared with the BP model, the mean square error and mean absolute error of this method are reduced by 78.2% and 46.4%, respectively, which proves that the improved method is effective for The traffic flow prediction is reasonable; based on this method and the MEC-BP_Adaboost model, the mean square error and mean absolute error are reduced by 44.9% and 25.9%, respectively, which proves that the weight of the weak predictor using the error squared reciprocal criterion, Make the weak predictor more accurate and more effective to improve the generalization ability of the predictor.
为了更好的表现出每个弱预测器的预测效果,通过预测误差平方和倒数方法进行每组弱预测函数的权值求解,使每个弱预测器的性能更好地表现出来,提高整个模型的决策性能,本发明和MEC-BP_Adaboost模型的每个弱预测器权重比较如表4所示:In order to better show the prediction effect of each weak predictor, the weights of each group of weak prediction functions are calculated by the method of the squared sum of the prediction errors, so that the performance of each weak predictor can be better displayed and the whole model can be improved. The decision performance of the present invention and the weight of each weak predictor of the MEC-BP_Adaboost model are compared as shown in Table 4:
表4两种模型中每个弱预测器的权重对比Table 4 Comparison of the weights of each weak predictor in the two models

由表4实验结果可以看出,根据10个MEC优化神经网络的改进后的权值大小发现,MEC-BP_Adaboost模型的第3、4和8的神经网络权值占比最大,说明这3个神经网络对交通流预测效果更明显,通过本方法的改进之后,降低其它神经网络对模型的影响小的权重,加大了这3个神经网络对整体模型影响的比重,充分利用该网络提供的有价值的信息,将预测结果的精确度最大化,这是因为各弱预测器的权重得到不断优化,Adaboost算法的提升能力得到不断增强,该模型有效的克服了时间序列突变带来的预误差,有较好的拟合真实的交通误差。It can be seen from the experimental results in Table 4 that according to the improved weights of the 10 MEC optimized neural networks, it is found that the third, fourth and eighth neural network weights of the MEC-BP_Adaboost model account for the largest proportions, indicating that these three neural networks The effect of the network on traffic flow prediction is more obvious. After the improvement of this method, the weight of other neural networks that have little influence on the model is reduced, and the proportion of the influence of these three neural networks on the overall model is increased. This is because the weight of each weak predictor is continuously optimized, and the improvement ability of the Adaboost algorithm is continuously enhanced. The model effectively overcomes the prediction error caused by the mutation of the time series. There is a better fit to the real traffic error.
为进一步验证模型的有效性和普遍性,采用数据集2进行2步、3步、4步、 5步预测,如表5所示,因此随着预测步数的增加,本方法的预测误差普遍小于原方法,但随着相同模型下,随着步长的增加预测精度下降。In order to further verify the validity and universality of the model,
表5不同模型不同预测步长的MSE值对比Table 5 Comparison of MSE values of different models with different prediction steps

Claims (1)
Translated fromChinese


Priority Applications (1)
| Application Number | Priority Date | Filing Date | Title |
|---|---|---|---|
| CN201911401878.5ACN111160650B (en) | 2019-12-31 | 2019-12-31 | Adaboost algorithm-based traffic flow characteristic analysis and prediction method |
Applications Claiming Priority (1)
| Application Number | Priority Date | Filing Date | Title |
|---|---|---|---|
| CN201911401878.5ACN111160650B (en) | 2019-12-31 | 2019-12-31 | Adaboost algorithm-based traffic flow characteristic analysis and prediction method |
Publications (2)
| Publication Number | Publication Date |
|---|---|
| CN111160650A CN111160650A (en) | 2020-05-15 |
| CN111160650Btrue CN111160650B (en) | 2022-08-09 |
Family
ID=70559329
Family Applications (1)
| Application Number | Title | Priority Date | Filing Date |
|---|---|---|---|
| CN201911401878.5AActiveCN111160650B (en) | 2019-12-31 | 2019-12-31 | Adaboost algorithm-based traffic flow characteristic analysis and prediction method |
Country Status (1)
| Country | Link |
|---|---|
| CN (1) | CN111160650B (en) |
Families Citing this family (4)
| Publication number | Priority date | Publication date | Assignee | Title |
|---|---|---|---|---|
| CN112861436A (en)* | 2021-02-18 | 2021-05-28 | 天津大学 | Real-time prediction method for engine emission |
| CN113345236A (en)* | 2021-06-11 | 2021-09-03 | 北京航空航天大学 | Time-space traffic state prediction method based on Transformer network |
| CN114241779B (en)* | 2022-02-24 | 2022-07-29 | 深圳市城市交通规划设计研究中心股份有限公司 | Short-time prediction method, computer and storage medium for urban expressway traffic flow |
| CN117494295B (en)* | 2024-01-03 | 2025-02-14 | 江苏安防科技有限公司 | A rail transit operation and maintenance method, system, electronic device and storage medium based on BIM |
Citations (3)
| Publication number | Priority date | Publication date | Assignee | Title |
|---|---|---|---|---|
| CN102708384A (en)* | 2012-06-04 | 2012-10-03 | 西南交通大学 | Bootstrapping weak learning method based on random fern and classifier thereof |
| EP3035314A1 (en)* | 2014-12-18 | 2016-06-22 | Be-Mobile NV | A traffic data fusion system and the related method for providing a traffic state for a network of roads |
| CN107688863A (en)* | 2017-07-13 | 2018-02-13 | 天津大学 | The short-term wind speed high accuracy combination forecasting method that adaptive iteration is strengthened |
- 2019
- 2019-12-31CNCN201911401878.5Apatent/CN111160650B/enactiveActive
Patent Citations (3)
| Publication number | Priority date | Publication date | Assignee | Title |
|---|---|---|---|---|
| CN102708384A (en)* | 2012-06-04 | 2012-10-03 | 西南交通大学 | Bootstrapping weak learning method based on random fern and classifier thereof |
| EP3035314A1 (en)* | 2014-12-18 | 2016-06-22 | Be-Mobile NV | A traffic data fusion system and the related method for providing a traffic state for a network of roads |
| CN107688863A (en)* | 2017-07-13 | 2018-02-13 | 天津大学 | The short-term wind speed high accuracy combination forecasting method that adaptive iteration is strengthened |
Non-Patent Citations (4)
| Title |
|---|
| Short-Term Tra±c Flow Prediction Model of Wavelet Neural Network Based on Mind Evolutionary Algorithm;Liqiang Xu 等;《International Journal of Pattern Recognition》;20180621;全文* |
| 基于BP-Adaboost模型的交通流量预测;朱志强;《福建交通科技》;20190430;全文* |
| 基于布谷鸟算法的小波神经网络短时交通流预测研究;黄晓慧;《中国优秀博硕士学位论文全文数据库(硕士)工程科技Ⅱ辑》;20170115;全文* |
| 混合交通流时间序列的去趋势波动分析;吴建军 等;《物理学报》;20110115;全文* |
Also Published As
| Publication number | Publication date |
|---|---|
| CN111160650A (en) | 2020-05-15 |
Similar Documents
| Publication | Publication Date | Title |
|---|---|---|
| CN111160650B (en) | Adaboost algorithm-based traffic flow characteristic analysis and prediction method | |
| CN110648014B (en) | A regional wind power forecasting method and system based on spatiotemporal quantile regression | |
| CN112487702A (en) | Method for predicting remaining service life of lithium ion battery | |
| CN110414045A (en) | Short-term wind speed prediction method based on VMD-GRU | |
| CN109754113A (en) | Load forecasting method based on dynamic time warping and long and short-term memory | |
| Wang et al. | Chaotic time series method combined with particle swarm optimization and trend adjustment for electricity demand forecasting | |
| CN105354646B (en) | Power load forecasting method for hybrid particle swarm optimization and extreme learning machine | |
| CN113159361A (en) | Short-term load prediction method and system based on VDM and Stacking model fusion | |
| CN113554466A (en) | Construction method, forecasting method and device for short-term electricity consumption forecasting model | |
| CN107590562A (en) | A kind of Short-Term Load Forecasting of Electric Power System based on changeable weight combination predicted method | |
| CN112614346B (en) | Short-term traffic flow prediction method based on singular spectrum analysis and echo state network | |
| CN112907970B (en) | Variable lane steering control method based on vehicle queuing length change rate | |
| CN116646927B (en) | A wind power prediction method based on segmented filtering and vertical and horizontal clustering | |
| CN114792158A (en) | Short-term power prediction method for multiple wind farms based on spatiotemporal fusion graph neural network | |
| CN114036850A (en) | Runoff prediction method based on VECGM | |
| CN115169714A (en) | Prediction method of passenger flow in and out of urban subway stations | |
| CN113947182B (en) | Traffic flow prediction model construction method based on dual-stage stacked graph convolution network | |
| CN112862177A (en) | Urban area concentration degree prediction method, equipment and medium based on deep neural network | |
| Ma et al. | Short-term traffic flow prediction based on genetic artificial neural network and exponential smoothing | |
| CN113947904A (en) | Multi-scale short-term traffic flow prediction method based on S-G filtering and deep belief network | |
| CN117354846A (en) | A 5G power network slicing traffic prediction method | |
| CN114117903A (en) | A short-term passenger flow prediction method for rail transit based on bp neural network | |
| Zhou et al. | Research on short-term traffic flow prediction based on KNN-GRU | |
| CN116667322A (en) | Electric Load Forecasting Method Based on Phase Space Reconstruction and Improved RBF Neural Network | |
| CN111832818A (en) | A multi-step prediction method for LSTM network power generation based on correlation analysis |
Legal Events
| Date | Code | Title | Description |
|---|---|---|---|
| PB01 | Publication | ||
| PB01 | Publication | ||
| SE01 | Entry into force of request for substantive examination | ||
| SE01 | Entry into force of request for substantive examination | ||
| TA01 | Transfer of patent application right | ||
| TA01 | Transfer of patent application right | Effective date of registration:20210330 Address after:310018 No.2 street, Baiyang street, Hangzhou Economic and Technological Development Zone, Zhejiang Province Applicant after:HANGZHOU DIANZI University Applicant after:STATE GRID HUBEI ELECTRIC POWER Co.,Ltd. Address before:310018 No.2 street, Baiyang street, Hangzhou Economic and Technological Development Zone, Zhejiang Province Applicant before:HANGZHOU DIANZI University | |
| GR01 | Patent grant | ||
| GR01 | Patent grant |