CN110942258A - A performance-driven approach to monitoring anomalies in industrial processes - Google Patents
A performance-driven approach to monitoring anomalies in industrial processesDownload PDFInfo
- Publication number
- CN110942258A CN110942258ACN201911254450.2ACN201911254450ACN110942258ACN 110942258 ACN110942258 ACN 110942258ACN 201911254450 ACN201911254450 ACN 201911254450ACN 110942258 ACN110942258 ACN 110942258A
- Authority
- CN
- China
- Prior art keywords
- equation
- formula
- matrix
- detection
- calculate
- Prior art date
- Legal status (The legal status is an assumption and is not a legal conclusion. Google has not performed a legal analysis and makes no representation as to the accuracy of the status listed.)
- Granted
Links
Images


Classifications
- G—PHYSICS
- G06—COMPUTING OR CALCULATING; COUNTING
- G06Q—INFORMATION AND COMMUNICATION TECHNOLOGY [ICT] SPECIALLY ADAPTED FOR ADMINISTRATIVE, COMMERCIAL, FINANCIAL, MANAGERIAL OR SUPERVISORY PURPOSES; SYSTEMS OR METHODS SPECIALLY ADAPTED FOR ADMINISTRATIVE, COMMERCIAL, FINANCIAL, MANAGERIAL OR SUPERVISORY PURPOSES, NOT OTHERWISE PROVIDED FOR
- G06Q10/00—Administration; Management
- G06Q10/06—Resources, workflows, human or project management; Enterprise or organisation planning; Enterprise or organisation modelling
- G06Q10/063—Operations research, analysis or management
- G06Q10/0639—Performance analysis of employees; Performance analysis of enterprise or organisation operations
- G—PHYSICS
- G06—COMPUTING OR CALCULATING; COUNTING
- G06F—ELECTRIC DIGITAL DATA PROCESSING
- G06F18/00—Pattern recognition
- G06F18/20—Analysing
- G06F18/21—Design or setup of recognition systems or techniques; Extraction of features in feature space; Blind source separation
- G06F18/213—Feature extraction, e.g. by transforming the feature space; Summarisation; Mappings, e.g. subspace methods
- G06F18/2135—Feature extraction, e.g. by transforming the feature space; Summarisation; Mappings, e.g. subspace methods based on approximation criteria, e.g. principal component analysis
- G—PHYSICS
- G06—COMPUTING OR CALCULATING; COUNTING
- G06Q—INFORMATION AND COMMUNICATION TECHNOLOGY [ICT] SPECIALLY ADAPTED FOR ADMINISTRATIVE, COMMERCIAL, FINANCIAL, MANAGERIAL OR SUPERVISORY PURPOSES; SYSTEMS OR METHODS SPECIALLY ADAPTED FOR ADMINISTRATIVE, COMMERCIAL, FINANCIAL, MANAGERIAL OR SUPERVISORY PURPOSES, NOT OTHERWISE PROVIDED FOR
- G06Q10/00—Administration; Management
- G06Q10/20—Administration of product repair or maintenance
Landscapes
- Engineering & Computer Science (AREA)
- Business, Economics & Management (AREA)
- Human Resources & Organizations (AREA)
- Theoretical Computer Science (AREA)
- Entrepreneurship & Innovation (AREA)
- Physics & Mathematics (AREA)
- Strategic Management (AREA)
- Economics (AREA)
- General Physics & Mathematics (AREA)
- Educational Administration (AREA)
- Computer Vision & Pattern Recognition (AREA)
- General Business, Economics & Management (AREA)
- Tourism & Hospitality (AREA)
- Quality & Reliability (AREA)
- Development Economics (AREA)
- Operations Research (AREA)
- Data Mining & Analysis (AREA)
- Marketing (AREA)
- General Engineering & Computer Science (AREA)
- Game Theory and Decision Science (AREA)
- Bioinformatics & Computational Biology (AREA)
- Evolutionary Biology (AREA)
- Bioinformatics & Cheminformatics (AREA)
- Life Sciences & Earth Sciences (AREA)
- Artificial Intelligence (AREA)
- Evolutionary Computation (AREA)
- Testing And Monitoring For Control Systems (AREA)
Abstract
Description
Translated fromChinese技术领域technical field
本发明工业过程监控技术领域,具体涉及一种性能驱动的工业过程异常监测方法。The present invention is in the technical field of industrial process monitoring, in particular to a performance-driven abnormality monitoring method for an industrial process.
背景技术Background technique
主元分析(Principal component analysis,简称PCA)作为一种经典的数据降维技术,在图像处理、信号处理等诸多领域取得了广泛的应用。近年来,PCA及其各种改进方法成为了工业过程监控领域的有效技术手段。Principal component analysis (PCA), as a classic data dimensionality reduction technique, has been widely used in many fields such as image processing and signal processing. In recent years, PCA and its various improvement methods have become effective technical means in the field of industrial process monitoring.
利用PCA建立工业过程数据模型的关键问题之一是选择合适个数的主元,这关乎所建模型的监控性能。过多的主元可能会包含测量噪声,过少的主元可能会丢失关键信息而不能反映过程的某些变化。针对主元选择问题,研究人员相继提出了许多准则或方法,例如特征值限制、交叉验证、CPV准则、VRE准则等。但是这些方法都没有考虑监控性能,比如特征值限制和CPV准则都认为小特征值对应的主元是测量噪声,二者都是以保留最大的信息量为出发点来选择主元的;VRE准则考虑的是重构性能,希望选出的主元具有最小的重构误差。因此,根据上述方式选出的主元可能对异常不敏感。One of the key issues in using PCA to build an industrial process data model is to select an appropriate number of pivots, which is related to the monitoring performance of the model. Too many pivots may contain measurement noise, and too few pivots may lose key information and fail to reflect some changes in the process. For the pivot selection problem, researchers have successively proposed many criteria or methods, such as eigenvalue restriction, cross-validation, CPV criterion, VRE criterion, etc. However, these methods do not consider the monitoring performance. For example, the eigenvalue limit and the CPV criterion both consider that the pivot corresponding to the small eigenvalue is the measurement noise. is the reconstruction performance, and it is hoped that the selected pivot has the smallest reconstruction error. Therefore, pivots selected in the above manner may be insensitive to anomalies.
目前,仅有少数方法在选择主元时考虑了监控性能。但是这些方法都有几个共同的缺陷。第一,严重依赖于故障方向,因而仅限于检测传感器故障,对复杂的过程故障则需要利用异常数据估计故障方向,但实际中故障数据通常难以获得且故障方向难以估计准确;第二,对于没有先验信息的未知故障,有学者提出了同时监控多个模型的并行监控方案,但是这会造成巨大的计算复杂度,不利于对过程进行实时监控;第三,这些方法都是离线确定主元的个数,且在在线监控阶段保持不变,因此对未知故障的监控性能并不理想。Currently, only a few methods consider monitoring performance when selecting pivots. But these methods share several common flaws. First, it depends heavily on the fault direction, so it is limited to detecting sensor faults. For complex process faults, abnormal data needs to be used to estimate the fault direction, but in practice, the fault data is usually difficult to obtain and the fault direction is difficult to estimate accurately; Unknown faults of prior information, some scholars have proposed a parallel monitoring scheme to monitor multiple models at the same time, but this will cause huge computational complexity, which is not conducive to real-time monitoring of the process; third, these methods are offline to determine the pivot And it remains unchanged in the online monitoring stage, so the monitoring performance for unknown faults is not ideal.
发明内容SUMMARY OF THE INVENTION
本发明的目的是针对上述不足,提出了一种依据检测性能指标动态地选择主元,不需要异常数据,也无需估计故障的方向和幅值的性能驱动的工业过程异常监测方法。The purpose of the present invention is to address the above deficiencies, and propose a performance-driven industrial process anomaly monitoring method that dynamically selects the main element according to the detection performance index, does not require abnormal data, and does not need to estimate the direction and amplitude of the fault.
本发明具体采用如下技术方案:The present invention specifically adopts following technical scheme:
一种性能驱动的工业过程异常监测方法,包括离线训练阶段和在线监测阶段;A performance-driven method for monitoring anomalies in industrial processes, including an offline training phase and an online monitoring phase;
离线训练阶段包括以下步骤:The offline training phase includes the following steps:
1.1、采集正常工况下的历史数据,得到训练数据集
1.2、用式(1)计算样本均值μx,并利用式(2)计算样本协方差矩阵Σx:1.2. Use formula (1) to calculate the sample mean μx , and use formula (2) to calculate the sample covariance matrix Σx :


其中,
1.3、对样本协方差矩阵Σx进行特征值分解,得到式(3):1.3. Decompose the eigenvalues of the sample covariance matrix Σx to obtain formula (3):
Σx=QΛQT (3)Σx = QΛQT (3)
其中,Q为一个正交矩阵,Λ=diag(λ[1],λ[2],…,λ[m])为一个对角矩阵,且有λ[1]≥λ[2]≥…≥λ[m];Among them, Q is an orthogonal matrix, Λ=diag(λ[1] ,λ[2] ,…,λ[m] ) is a diagonal matrix, and λ[1] ≥λ[2] ≥…≥ λ[m] ;
1.4、对训练数据集X中的第k个样本,1≤k≤N,
yk=QT(xk-μx) (4);yk =QT (xk -μx ) (4);
1.5、根据检测性能指标P的定义,计算成分向量yk对应的检测性能指标
1.6、基于选择矩阵W∈{0,1}m×d,得到选择之后的成分向量

1.7、将维度d从1到m依次遍历,得到使检测性能指标

1.8、根据选出的最优成分子集,计算第k个样本的检测统计量Dk,如式(5)所示:1.8. Calculate the detection statistic Dk of the kth sample according to the selected optimal component subset, as shown in formula (5):

其中,

1.9、给定显著性水平α,利用经验方法确定检测控制限ηα;1.9. Given the significance level α, use the empirical method to determine the detection control limitηα ;
在线监测阶段包括以下步骤:The online monitoring phase includes the following steps:
2.1、对于实时样本x,根据式(6)计算其成分向量y:2.1. For real-time sample x, calculate its component vector y according to formula (6):
y=QT(x-μx) (6);y=QT (x-μx ) (6);
2.2、根据检测性能指标P的定义,计算成分向量y对应的检测性能指标Py;2.2, according to the definition of the detection performance index P, calculate the detection performance index P y corresponding to the component vectory ;
2.3、基于选择矩阵W∈{0,1}m×d,得到选择之后的成分向量

2.4、将维度d从1到m依次遍历,得到使检测性能指标

2.5、根据选出的最优成分子集,计算实时样本x的检测统计量D,如式(7)所示:2.5. Calculate the detection statistic D of the real-time sample x according to the selected optimal component subset, as shown in formula (7):

其中,
2.6、将检测统计量D与控制限ηα比较,如果D大于ηα,则认为过程发生了异常,反之则处于正常状态。2.6. Compare the detection statistic D with the control limit ηα , if D is greater than ηα , it is considered that the process is abnormal, otherwise, it is in a normal state.
优选的,步骤1.5和2.2具体为:Preferably, steps 1.5 and 2.2 are specifically:
成分向量的均值μy和协方差矩阵Σy分别如式(8)和式(9)所示:The mean μy of the component vector and the covariance matrix Σy are shown in equations (8) and (9), respectively:


基于式(10)所示的加性故障模型:Based on the additive fault model shown in equation (10):
x=x*+Ξif (10)x = x* +Ξi f (10)
其中,x是故障样本,x*是对应的正常样本,Ξi是故障
成分向量y对应的马氏距离如式(11)所示:The Mahalanobis distance corresponding to the component vector y is shown in formula (11):

其中,y*=QT(x*-μx);Wherein, y* =QT (x* -μx );
根据向量的三角不等式,得到式(12):According to the triangular inequality of vectors, Equation (12) is obtained:

考虑到


||Λ-1/2QTΞif||>2χα(m) (13);||Λ-1/2 QT Ξif ||>2χα (m) (13);
成分向量y对应的检测性能指标定义为式(14):The detection performance index corresponding to the component vector y is defined as formula (14):

优选的,步骤1.6和2.3具体为:Preferably, steps 1.6 and 2.3 are specifically:
定义选择矩阵W如式(15)所示:The definition selection matrix W is shown in formula (15):

其中,d≤m,而且

对于成分向量y,选择之后的成分子集ys由式(16)给出:For the component vector y, the selected component subset ys is given by equation (16):

其均值为

成分子集ys对应的马氏距离如式(18)所示:The Mahalanobis distance corresponding to the component subset ys is shown in formula (18):

类似地,得到故障可检测的充分条件,即式(19):Similarly, a sufficient condition for fault detectability is obtained, that is, equation (19):
||(WTΛW)-1/2WTQTΞif||>2χα(d) (19);||(WT ΛW)-1/2 WT QT Ξi f||>2χα (d) (19);
于是,成分子集ys对应的性能指标

优选的,步骤1.7和2.4具体为:Preferably, steps 1.7 and 2.4 are specifically:
将式(15)中定义的选择矩阵记为


给定d(1≤d≤m)的情况下,式(21)转化为式(22):Given d (1≤d≤m), equation (21) is transformed into equation (22):

由于Ξif的值是未知的,式(22)其实是一个随机优化问题;Since the value ofΞif is unknown, equation (22) is actually a stochastic optimization problem;
根据式(10)所示的故障模型,可得Ξif=x-x*,因此Ξif可被视为一个服从高斯分布的随机变量,即有
Ξif=x-μx+e (23)Ξi f=x-μx +e (23)
其中,
将式(23)代入F(W)中,得到式(24):Substituting equation (23) into F(W), we get equation (24):
F(W)=(y+g)TW(WTΛW)-1WT(y+g) (24)F(W)=(y+g)T W(WT ΛW)-1 WT (y+g) (24)
其中,
考虑到(WTΛW)-1=WTΛ-1W,在统计意义下得到式(25):Considering (WT ΛW)-1 =WT Λ-1 W, equation (25) is obtained in statistical significance:

由于WWT是一个对角线元素全为0或1的对角矩阵,因此式(25)等号右边的两项分别化成式(26)和式(27)所示的形式:Since WWT is a diagonal matrix whose diagonal elements are all 0 or 1, the two terms on the right side of the equation (25) are transformed into the forms shown in equations (26) and (27), respectively:


其中,

在给定d的情况下,为了最大化


将维度d从1到m依次遍历,得到全局最优的选择矩阵W*如式(30)所示:Traverse the dimension d from 1 to m in turn to obtain the globally optimal selection matrix W* , as shown in formula (30):

本发明具有如下有益效果:The present invention has the following beneficial effects:
该方法依据检测性能指标动态地选择主元,所选的主元对异常敏感,可以获得较好的监控性能;该方法不需要异常数据,也无需估计故障的方向和幅值,对于没有先验信息的未知异常也可获得较好的监控性能;而且在线计算复杂度较低,有利于对工业过程进行实时监测。The method dynamically selects the pivot element according to the detection performance index. The selected pivot element is sensitive to anomalies and can obtain better monitoring performance; this method does not require abnormal data, nor does it need to estimate the direction and amplitude of the fault. The unknown anomaly of information can also obtain better monitoring performance; and the online computing complexity is low, which is conducive to real-time monitoring of industrial processes.
附图说明Description of drawings
图1是本发明离线训练和在线监测的流程图;Fig. 1 is the flow chart of off-line training and on-line monitoring of the present invention;
图2是基于马氏距离的监测结果示意图;Fig. 2 is a schematic diagram of monitoring results based on Mahalanobis distance;
图3是基于PCA的Q统计量的监测结果示意图;Fig. 3 is the monitoring result schematic diagram of the Q statistic based on PCA;
图4是基于PCA的T2统计量的监测结果示意图;Figure 4 is a schematic diagram of the monitoring results of PCA-based T2 statistics;
图5是基于本发明所提方法的监测结果示意图;Fig. 5 is the monitoring result schematic diagram based on the proposed method of the present invention;
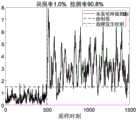
图6是基于本发明所提方法选择的主元个数示意图6 is a schematic diagram of the number of pivots selected based on the method proposed in the present invention
具体实施方式Detailed ways
结合图1,一种性能驱动的工业过程异常监测方法,包括离线训练阶段和在线监测阶段;Combined with Figure 1, a performance-driven industrial process anomaly monitoring method includes an offline training phase and an online monitoring phase;
离线训练阶段包括以下步骤:The offline training phase includes the following steps:
1.1、采集正常工况下的历史数据,得到训练数据集
1.2、用式(1)计算样本均值μx,并利用式(2)计算样本协方差矩阵Σx:1.2. Use formula (1) to calculate the sample mean μx , and use formula (2) to calculate the sample covariance matrix Σx :


其中,
1.3、对样本协方差矩阵Σx进行特征值分解,得到式(3):1.3. Decompose the eigenvalues of the sample covariance matrix Σx to obtain formula (3):
Σx=QΛQT (3)Σx = QΛQT (3)
其中,Q为一个正交矩阵,Λ=diag(λ[1],λ[2],…,λ[m])为一个对角矩阵,且有λ[1]≥λ[2]≥…≥λ[m];Among them, Q is an orthogonal matrix, Λ=diag(λ[1] ,λ[2] ,…,λ[m] ) is a diagonal matrix, and λ[1] ≥λ[2] ≥…≥ λ[m] ;
1.4、对训练数据集X中的第k个样本,1≤k≤N,
yk=QT(xk-μx) (4);yk =QT (xk -μx ) (4);
1.5、根据检测性能指标P的定义,计算成分向量yk对应的检测性能指标
1.6、基于选择矩阵W∈{0,1}m×d,得到选择之后的成分向量

1.7、将维度d从1到m依次遍历,得到使检测性能指标

1.8、根据选出的最优成分子集,计算第k个样本的检测统计量Dk,如式(5)所示:1.8. Calculate the detection statistic Dk of the kth sample according to the selected optimal component subset, as shown in formula (5):

其中,

1.9、给定显著性水平α,利用经验方法确定检测控制限ηα。1.9. Given the significance level α, use empirical methods to determine the detection control limit ηα .
在线监测阶段包括以下步骤:The online monitoring phase includes the following steps:
2.1、对于实时样本x,根据式(6)计算其成分向量y:2.1. For real-time sample x, calculate its component vector y according to formula (6):
y=QT(x-μx) (6);y=QT (x-μx ) (6);
2.2、根据检测性能指标P的定义,计算成分向量y对应的检测性能指标Py;2.2, according to the definition of the detection performance index P, calculate the detection performance index P y corresponding to the component vectory ;
2.3、基于选择矩阵W∈{0,1}m×d,得到选择之后的成分向量

2.4、将维度d从1到m依次遍历,得到使检测性能指标

2.5、根据选出的最优成分子集,计算实时样本x的检测统计量D,如式(7)所示:2.5. Calculate the detection statistic D of the real-time sample x according to the selected optimal component subset, as shown in formula (7):

其中,
2.6、将检测统计量D与控制限ηα比较,如果D大于ηα,则认为过程发生了异常,反之则处于正常状态。2.6. Compare the detection statistic D with the control limit ηα , if D is greater than ηα , it is considered that the process is abnormal, otherwise, it is in a normal state.
步骤1.5和2.2具体包括以下过程:Steps 1.5 and 2.2 specifically include the following processes:
成分向量的均值μy和协方差矩阵Σy分别如式(8)和式(9)所示:The mean μy of the component vector and the covariance matrix Σy are shown in equations (8) and (9), respectively:


基于式(10)所示的加性故障模型:Based on the additive fault model shown in equation (10):
x=x*+Ξif (10)x = x* +Ξi f (10)
其中,x是故障样本,x*是对应的正常样本,Ξi是故障
成分向量y对应的马氏距离如式(11)所示:The Mahalanobis distance corresponding to the component vector y is shown in formula (11):

其中,y*=QT(x*-μx);Wherein, y* =QT (x* -μx );
根据向量的三角不等式,得到式(12):According to the triangular inequality of vectors, Equation (12) is obtained:

考虑到


||Λ-1/2QTΞif||>2χα(m) (13);||Λ-1/2 QT Ξi f||>2χα (m) (13);
成分向量y对应的检测性能指标定义为式(14):The detection performance index corresponding to the component vector y is defined as formula (14):

步骤1.6和2.3具体包括以下过程:Steps 1.6 and 2.3 specifically include the following processes:
定义选择矩阵W如式(15)所示:The definition selection matrix W is shown in formula (15):

其中,d≤m,而且

对于成分向量y,选择之后的成分子集ys由式(16)给出:For the component vector y, the selected component subset ys is given by equation (16):

其均值为

成分子集ys对应的马氏距离如式(18)所示:The Mahalanobis distance corresponding to the component subset ys is shown in formula (18):

类似地,得到故障可检测的充分条件,即式(19):Similarly, a sufficient condition for fault detectability is obtained, that is, equation (19):
||(WTΛW)-1/2WTQTΞif||>2χα(d) (19);||(WT ΛW)-1/2 WT QT Ξi f||>2χα (d) (19);
于是,成分子集ys对应的性能指标

步骤1.7和2.4具体过程为:The specific process of steps 1.7 and 2.4 is:
将式(15)中定义的选择矩阵记为


给定d(1≤d≤m)的情况下,式(21)转化为式(22):Given d (1≤d≤m), equation (21) is transformed into equation (22):

由于Ξif的值是未知的,式(22)其实是一个随机优化问题;Since the value ofΞif is unknown, equation (22) is actually a stochastic optimization problem;
根据式(10)所示的故障模型,可得Ξif=x-x*,因此Ξif可被视为一个服从高斯分布的随机变量,即有
Ξif=x-μx+e (23)Ξi f=x-μx +e (23)
其中,
将式(23)代入F(W)中,得到式(24):Substituting equation (23) into F(W), we get equation (24):
F(W)=(y+g)TW(WTΛW)-1WT(y+g) (24)F(W)=(y+g)T W(WT ΛW)-1 WT (y+g) (24)
其中,
考虑到(WTΛW)-1=WTΛ-1W,在统计意义下得到式(25):Considering (WT ΛW)-1 =WT Λ-1 W, equation (25) is obtained in statistical significance:

由于WWT是一个对角线元素全为0或1的对角矩阵,因此式(25)等号右边的两项分别化成式(26)和式(27)所示的形式:Since WWT is a diagonal matrix whose diagonal elements are all 0 or 1, the two terms on the right side of the equation (25) are transformed into the forms shown in equations (26) and (27), respectively:


其中,

在给定d的情况下,为了最大化


将维度d从1到m依次遍历,得到全局最优的选择矩阵W*如式(30)所示:Traverse the dimension d from 1 to m in turn, and obtain the globally optimal selection matrix W* as shown in formula (30):

下面基于连续搅拌釜式加热器(Continuous stirred tank heater,简称CSTH),验证该监测方法,该过程提供了一个在工业过程监控领域被广泛研究的标准模型库。The monitoring method is validated below based on a continuous stirred tank heater (CSTH), which provides a standard model library that has been extensively studied in the field of industrial process monitoring.
在该过程中,热水和冷水混合且被蒸汽加热,其中温度和液位是具有标称值的被控变量。该过程模型中有三个PI控制器,分别控制温度、液位和冷水流量。不失一般性,在本实验室中该过程运行在第一种工况。测量样本由液位、冷水流量和温度三个传感器的测量值以及三个控制器的输出值组成,即x=[L,F,T,CL,CF,CT]T。In this process, hot and cold water are mixed and heated by steam, where temperature and liquid level are controlled variables with nominal values. There are three PI controllers in this process model, which control temperature, liquid level, and cold water flow. Without loss of generality, in this laboratory the process was run under the first condition. The measurement sample consists of the measured values of the three sensors of liquid level, cold water flow and temperature, and the output values of the three controllers, namely x=[L, F, T, CL , CF , CT ]T .
在离线训练阶段,采集正常工况下的2000个样本用于离线建模,显著性水平选为α=0.01,利用经验方法确定控制限。在在线监测阶段,产生1500个样本,其中前500个样本是正常的,从第501个样本开始引入异常状况,并一直持续到最后。该异常是一个幅值为+0.02,施加在液位传感器上的恒偏差故障。In the offline training stage, 2000 samples under normal working conditions were collected for offline modeling, the significance level was selected as α=0.01, and the control limit was determined by empirical method. In the online monitoring stage, 1500 samples are generated, of which the first 500 samples are normal, and abnormal conditions are introduced from the 501st sample and continue to the end. The anomaly is a constant deviation fault with an amplitude of +0.02 applied to the level sensor.
为了更清楚地展示本发明所提方法的优点,采用马氏距离和PCA方法作为对比。图2给出了基于马氏距离的监测结果示意图,图3和图4分别给出了基于PCA的Q统计量和T2统计量的监测结果示意图,图5给出了基于本发明所提方法的监测结果示意图。比较这四个图,可以得出:PCA在该方案中的监测结果较差,无论是Q统计量还是T2统计量,几乎都无法监测出异常,原因在于该故障的幅值较小,容易被噪声所掩盖;马氏距离可以部分监测出异常,但仍有20%以上的漏报率;本发明所提方法有着最优的监测结果,能以90%以上的检测率监测出异常。此外,图6给出了基于本发明所提方法选择的主元个数示意图。从图6可以看出,在异常发生之前所选主元个数有较大的变化,原因在于过程正常运行且存在测量噪声;但在异常发生之后,该方法能够迅速定位到对该异常最敏感的主元子集上,因而可以得到较好的监控性能。In order to demonstrate the advantages of the method proposed in the present invention more clearly, the Mahalanobis distance and the PCA method are used as a comparison. Figure 2 shows a schematic diagram of the monitoring results based on Mahalanobis distance, Figure 3 and Figure 4 respectively provide a schematic diagram of the monitoring results based on PCA's Q statistic and T2 statistic, and Figure 5 shows the method based on the present invention. Schematic diagram of the monitoring results. Comparing these four graphs, it can be concluded that the monitoring results of PCA in this scheme are poor. No matter it is the Q statistic or the T2 statistic, it is almost impossible to monitor the abnormality. The reason is that the amplitude of the fault is small and it is easy to Masked by noise; Mahalanobis distance can partially detect abnormality, but still has a false negative rate of more than 20%; the method proposed in the invention has the best monitoring result, and can detect abnormality with a detection rate of more than 90%. In addition, FIG. 6 shows a schematic diagram of the number of pivots selected based on the method proposed in the present invention. It can be seen from Figure 6 that the number of selected pivot elements changes greatly before the anomaly occurs, because the process is running normally and there is measurement noise; but after the anomaly occurs, the method can quickly locate the most sensitive to the anomaly. Therefore, better monitoring performance can be obtained.
当然,上述说明并非是对本发明的限制,本发明也并不仅限于上述举例,本技术领域的技术人员在本发明的实质范围内所做出的变化、改型、添加或替换,也应属于本发明的保护范围。Of course, the above description is not intended to limit the present invention, and the present invention is not limited to the above examples. Changes, modifications, additions or substitutions made by those skilled in the art within the essential scope of the present invention should also belong to the present invention. The scope of protection of the invention.
Claims (4)
Translated fromChinese


Priority Applications (1)
| Application Number | Priority Date | Filing Date | Title |
|---|---|---|---|
| CN201911254450.2ACN110942258B (en) | 2019-12-10 | 2019-12-10 | Performance-driven industrial process anomaly monitoring method |
Applications Claiming Priority (1)
| Application Number | Priority Date | Filing Date | Title |
|---|---|---|---|
| CN201911254450.2ACN110942258B (en) | 2019-12-10 | 2019-12-10 | Performance-driven industrial process anomaly monitoring method |
Publications (2)
| Publication Number | Publication Date |
|---|---|
| CN110942258Atrue CN110942258A (en) | 2020-03-31 |
| CN110942258B CN110942258B (en) | 2022-02-25 |
Family
ID=69909928
Family Applications (1)
| Application Number | Title | Priority Date | Filing Date |
|---|---|---|---|
| CN201911254450.2AActiveCN110942258B (en) | 2019-12-10 | 2019-12-10 | Performance-driven industrial process anomaly monitoring method |
Country Status (1)
| Country | Link |
|---|---|
| CN (1) | CN110942258B (en) |
Cited By (3)
| Publication number | Priority date | Publication date | Assignee | Title |
|---|---|---|---|---|
| CN111931349A (en)* | 2020-07-15 | 2020-11-13 | 中南大学 | Multiplicative Fault Diagnosis Method of CSTH Based on Dynamic Principal Component Analysis |
| CN113254874A (en)* | 2021-04-14 | 2021-08-13 | 山东科技大学 | Uncertainty non-stationary industrial process oriented anomaly monitoring method |
| CN116861224A (en)* | 2023-09-04 | 2023-10-10 | 鲁东大学 | Intermittent process soft measurement modeling system based on intermittent process soft measurement modeling method |
Citations (4)
| Publication number | Priority date | Publication date | Assignee | Title |
|---|---|---|---|---|
| CN105676833A (en)* | 2015-12-21 | 2016-06-15 | 海南电力技术研究院 | Power generation process control system fault detection method |
| CN108958226A (en)* | 2018-08-08 | 2018-12-07 | 太原理工大学 | Based on existence information potential-Principal Component Analysis Algorithm TE procedure failure testing method |
| CN109407652A (en)* | 2018-12-10 | 2019-03-01 | 中国石油大学(华东) | Multivariable industrial process fault detection method based on major-minor pca model |
| CN109459993A (en)* | 2018-12-06 | 2019-03-12 | 湖南师范大学 | A kind of process flow industry process online adaptive Fault monitoring and diagnosis method |
- 2019
- 2019-12-10CNCN201911254450.2Apatent/CN110942258B/enactiveActive
Patent Citations (4)
| Publication number | Priority date | Publication date | Assignee | Title |
|---|---|---|---|---|
| CN105676833A (en)* | 2015-12-21 | 2016-06-15 | 海南电力技术研究院 | Power generation process control system fault detection method |
| CN108958226A (en)* | 2018-08-08 | 2018-12-07 | 太原理工大学 | Based on existence information potential-Principal Component Analysis Algorithm TE procedure failure testing method |
| CN109459993A (en)* | 2018-12-06 | 2019-03-12 | 湖南师范大学 | A kind of process flow industry process online adaptive Fault monitoring and diagnosis method |
| CN109407652A (en)* | 2018-12-10 | 2019-03-01 | 中国石油大学(华东) | Multivariable industrial process fault detection method based on major-minor pca model |
Non-Patent Citations (7)
| Title |
|---|
| GANG LI 等: "Reconstruction based fault prognosis for continuous processes", 《CONTROL ENGINEERING PRACTICE》* |
| HONGQUAN JI 等: "On the use of recognition-based contribution for fault diagnosis", 《JOURNAL OF PROCESS CONTROL》* |
| JUN SHANG 等: "Fault detection based on augmented kernel Mahalanobis distance for nonlinear dynamic processes", 《COMPUTERS AND CHEMICAL ENGINEERING》* |
| JUN SHANG: "Recursive transformed component statistical analysis for incipient fault detection", 《AUTOMATICA》* |
| 常玉清 等: "基于多 PCA 模型的过程监测方法", 《仪器仪表学报》* |
| 荣智海 等: "基于核主成分分析的油色谱在线监测装置 异常状态快速辨识", 《高电压技术》* |
| 郭金玉 等: "基于 DMOLPP 的间歇过程在线故障检测", 《仪器仪表学报》* |
Cited By (5)
| Publication number | Priority date | Publication date | Assignee | Title |
|---|---|---|---|---|
| CN111931349A (en)* | 2020-07-15 | 2020-11-13 | 中南大学 | Multiplicative Fault Diagnosis Method of CSTH Based on Dynamic Principal Component Analysis |
| CN113254874A (en)* | 2021-04-14 | 2021-08-13 | 山东科技大学 | Uncertainty non-stationary industrial process oriented anomaly monitoring method |
| CN113254874B (en)* | 2021-04-14 | 2022-04-15 | 山东科技大学 | An Anomaly Monitoring Method for Uncertain Non-stationary Industrial Processes |
| CN116861224A (en)* | 2023-09-04 | 2023-10-10 | 鲁东大学 | Intermittent process soft measurement modeling system based on intermittent process soft measurement modeling method |
| CN116861224B (en)* | 2023-09-04 | 2023-12-01 | 鲁东大学 | Intermittent process soft sensor modeling system based on intermittent process soft sensor modeling method |
Also Published As
| Publication number | Publication date |
|---|---|
| CN110942258B (en) | 2022-02-25 |
Similar Documents
| Publication | Publication Date | Title |
|---|---|---|
| Harrou et al. | Statistical process monitoring using advanced data-driven and deep learning approaches: theory and practical applications | |
| Joe Qin | Statistical process monitoring: basics and beyond | |
| Mansouri et al. | Kernel PCA-based GLRT for nonlinear fault detection of chemical processes | |
| Yoon et al. | Fault diagnosis with multivariate statistical models part I: using steady state fault signatures | |
| Ma et al. | Fault detection for dynamic processes based on recursive innovational component statistical analysis | |
| Xiao et al. | An isolation enhanced PCA method with expert-based multivariate decoupling for sensor FDD in air-conditioning systems | |
| CN107092242B (en) | A kind of Industrial Process Monitoring method based on missing variable pca model | |
| CN110942258B (en) | Performance-driven industrial process anomaly monitoring method | |
| Wang et al. | KPCA-CCA-based quality-related fault detection and diagnosis method for nonlinear process monitoring | |
| Baklouti et al. | Iterated robust kernel fuzzy principal component analysis and application to fault detection | |
| Harrou et al. | Amalgamation of anomaly-detection indices for enhanced process monitoring | |
| CN102183699A (en) | Method for model mismatching detection and positioning of multivariate predictive control system in chemical process | |
| Wang et al. | Efficient nonlinear fault diagnosis based on kernel sample equivalent replacement | |
| CN108153267B (en) | Industrial process monitoring method based on error principal component analysis model | |
| Ma et al. | A novel three-stage quality oriented data-driven nonlinear industrial process monitoring strategy | |
| CN111368428A (en) | Sensor precision reduction fault detection method based on monitoring second-order statistics | |
| CN108181893B (en) | PCA-KDR-based fault detection method | |
| Szega | Methodology of advanced data validation and reconciliation application in industrial thermal processes | |
| Ji | Data-driven sensor fault diagnosis under closed-loop control with slow feature analysis | |
| Wang et al. | Orthogonal stationary component analysis for nonstationary process monitoring | |
| CN114879612A (en) | Blast furnace iron-making process monitoring method based on Local-DBKSSA | |
| Wang et al. | Concurrent fault detection and anomaly location in closed-loop dynamic systems with measured disturbances | |
| CN103207567A (en) | Low-false-alarm-rate improved principal component analysis process monitoring method and system | |
| Li et al. | Twofold weighted-based statistical feature KECA for nonlinear industrial process fault diagnosis | |
| Ma et al. | Dynamic process monitoring based on dot product feature analysis for thermal power plants |
Legal Events
| Date | Code | Title | Description |
|---|---|---|---|
| PB01 | Publication | ||
| PB01 | Publication | ||
| SE01 | Entry into force of request for substantive examination | ||
| SE01 | Entry into force of request for substantive examination | ||
| GR01 | Patent grant | ||
| GR01 | Patent grant |