CN110909911B - Aggregation method of multidimensional time series data considering space-time correlation - Google Patents
Aggregation method of multidimensional time series data considering space-time correlationDownload PDFInfo
- Publication number
- CN110909911B CN110909911BCN201910932946.4ACN201910932946ACN110909911BCN 110909911 BCN110909911 BCN 110909911BCN 201910932946 ACN201910932946 ACN 201910932946ACN 110909911 BCN110909911 BCN 110909911B
- Authority
- CN
- China
- Prior art keywords
- load
- photovoltaic
- power
- scene
- wind power
- Prior art date
- Legal status (The legal status is an assumption and is not a legal conclusion. Google has not performed a legal analysis and makes no representation as to the accuracy of the status listed.)
- Active
Links
Images
Classifications
- G—PHYSICS
- G06—COMPUTING OR CALCULATING; COUNTING
- G06Q—INFORMATION AND COMMUNICATION TECHNOLOGY [ICT] SPECIALLY ADAPTED FOR ADMINISTRATIVE, COMMERCIAL, FINANCIAL, MANAGERIAL OR SUPERVISORY PURPOSES; SYSTEMS OR METHODS SPECIALLY ADAPTED FOR ADMINISTRATIVE, COMMERCIAL, FINANCIAL, MANAGERIAL OR SUPERVISORY PURPOSES, NOT OTHERWISE PROVIDED FOR
- G06Q10/00—Administration; Management
- G06Q10/04—Forecasting or optimisation specially adapted for administrative or management purposes, e.g. linear programming or "cutting stock problem"
- G—PHYSICS
- G06—COMPUTING OR CALCULATING; COUNTING
- G06F—ELECTRIC DIGITAL DATA PROCESSING
- G06F18/00—Pattern recognition
- G06F18/20—Analysing
- G06F18/23—Clustering techniques
- G—PHYSICS
- G06—COMPUTING OR CALCULATING; COUNTING
- G06Q—INFORMATION AND COMMUNICATION TECHNOLOGY [ICT] SPECIALLY ADAPTED FOR ADMINISTRATIVE, COMMERCIAL, FINANCIAL, MANAGERIAL OR SUPERVISORY PURPOSES; SYSTEMS OR METHODS SPECIALLY ADAPTED FOR ADMINISTRATIVE, COMMERCIAL, FINANCIAL, MANAGERIAL OR SUPERVISORY PURPOSES, NOT OTHERWISE PROVIDED FOR
- G06Q50/00—Information and communication technology [ICT] specially adapted for implementation of business processes of specific business sectors, e.g. utilities or tourism
- G06Q50/06—Energy or water supply
- Y—GENERAL TAGGING OF NEW TECHNOLOGICAL DEVELOPMENTS; GENERAL TAGGING OF CROSS-SECTIONAL TECHNOLOGIES SPANNING OVER SEVERAL SECTIONS OF THE IPC; TECHNICAL SUBJECTS COVERED BY FORMER USPC CROSS-REFERENCE ART COLLECTIONS [XRACs] AND DIGESTS
- Y02—TECHNOLOGIES OR APPLICATIONS FOR MITIGATION OR ADAPTATION AGAINST CLIMATE CHANGE
- Y02E—REDUCTION OF GREENHOUSE GAS [GHG] EMISSIONS, RELATED TO ENERGY GENERATION, TRANSMISSION OR DISTRIBUTION
- Y02E10/00—Energy generation through renewable energy sources
- Y02E10/70—Wind energy
- Y02E10/76—Power conversion electric or electronic aspects
Landscapes
- Engineering & Computer Science (AREA)
- Business, Economics & Management (AREA)
- Theoretical Computer Science (AREA)
- Economics (AREA)
- Physics & Mathematics (AREA)
- Human Resources & Organizations (AREA)
- Strategic Management (AREA)
- General Physics & Mathematics (AREA)
- Data Mining & Analysis (AREA)
- Marketing (AREA)
- Tourism & Hospitality (AREA)
- General Business, Economics & Management (AREA)
- Health & Medical Sciences (AREA)
- Evolutionary Biology (AREA)
- Bioinformatics & Cheminformatics (AREA)
- Evolutionary Computation (AREA)
- Public Health (AREA)
- Water Supply & Treatment (AREA)
- General Health & Medical Sciences (AREA)
- Computer Vision & Pattern Recognition (AREA)
- Bioinformatics & Computational Biology (AREA)
- Primary Health Care (AREA)
- General Engineering & Computer Science (AREA)
- Artificial Intelligence (AREA)
- Life Sciences & Earth Sciences (AREA)
- Development Economics (AREA)
- Game Theory and Decision Science (AREA)
- Entrepreneurship & Innovation (AREA)
- Operations Research (AREA)
- Quality & Reliability (AREA)
- Supply And Distribution Of Alternating Current (AREA)
Abstract
Translated fromChinese
Description
Translated fromChinese技术领域technical field
本发明涉及多能源电力系统互补优化调度领域,特别是考虑时空相关性的多维时序数据的聚合方法。The invention relates to the field of complementary optimal scheduling of multi-energy power systems, in particular to an aggregation method of multi-dimensional time series data considering space-time correlation.
背景技术Background technique
随着煤炭、石油等不可再生资源的日益枯竭以及能源困局的日益严峻,风能、太阳能、潮汐能及生物质能等可再生能源在世界范围内愈发备受关注。其中对于风、光自然资源的利用是可再生能源发电技术中技术最成熟、最具开发价值的两种可再生能源。发展风电、光电对于保障能源安全,调整能源结构,减轻环境污染,实现可持续发展等都具有非常重要的意义。With the increasing depletion of non-renewable resources such as coal and oil and the increasingly severe energy dilemma, renewable energy such as wind energy, solar energy, tidal energy and biomass energy has attracted more and more attention worldwide. Among them, the utilization of natural resources of wind and light is the two most mature and valuable renewable energy sources in the renewable energy power generation technology. The development of wind power and photovoltaics is of great significance for ensuring energy security, adjusting the energy structure, reducing environmental pollution, and achieving sustainable development.
自然界风、光可再生能源具有高不确定性,该特性决定了风电、光电的功率具有很强的波动性,随着大规模风电、光电接入电网,这种功率波动将给电网的安全经济运行带来巨大挑战。通过分析风、光等不确定性电源发电的广域时空相关性,研究考虑多能源跨季互补的年/月优化调度方法,充分利用可再生能源资源之间的跨季互补作用,通过分析目标地区内风、光与负荷电场的典型出力场景,实现年/月电量计划的合理科学的制定,有效提高电网对可再生能源的消纳能力。Natural wind and photovoltaic renewable energy have high uncertainty, which determines that the power of wind power and photovoltaic has strong fluctuation. Operation brings great challenges. By analyzing the wide-area temporal and spatial correlation of power generation with uncertain power sources such as wind and light, the annual/monthly optimal scheduling method considering multi-energy inter-seasonal complementarity is studied, and the inter-seasonal complementarity between renewable energy resources is fully utilized. The typical output scenarios of wind, light and load power fields in the region realize the rational and scientific formulation of annual/monthly power plans, and effectively improve the grid's ability to absorb renewable energy.
目前,国内外对于优化调度的研究越来越广泛和深入。在进行风电/光伏的年/月电量计划制定研究的过程中发现风电、光伏与负荷的出力时间序列数据过于庞大,数据冗杂,这导致了进行年/月优化计算时,时间断面多,处理时间过长不能快速求解、难以满足年/月优化调度时效性的问题,并且数据的冗杂在很大程度上不利于构建风电、光伏与负荷的典型出力场景。目前最基础的方法是通过在原出力时间序列的数据点上进行等间隔抽样,从而构成新的出力序列;此外,还有采用基于信息熵的分段聚合近似方法,将原出力时间序列计算信息熵的分布并进行分段聚合近似,从而构成新的出力序列,此外还有基于主成分分析方法、基于离散傅里叶变换方法等,在此基础上运用k-means聚类或者层次聚类等聚类算法进行典型场景的构建。但以上聚合方法的结果不能很好的反应原序列的趋势与波动性。并且传统的k-means聚类算法对初始类中心选择的敏感性强,多次聚类的稳定性较差,同时不能给出最优分类数。层次聚类的缺点是计算量比较大,另外,由于层次聚类使用的是贪心算法,得到的显然只是局域最优,不一定就是全局最优。所以以上方法所得到的典型场景均存在不足。At present, the research on optimal scheduling at home and abroad is more and more extensive and in-depth. In the process of researching the annual/monthly power plan formulation of wind power/photovoltaic, it is found that the output time series data of wind power, photovoltaics and loads is too large and the data is redundant, which leads to the annual/monthly optimization calculation, which requires many time sections and processing time. Too long cannot be solved quickly, it is difficult to meet the timeliness of annual/monthly optimal scheduling, and the complexity of data is not conducive to the construction of typical output scenarios of wind power, photovoltaics and loads to a large extent. The most basic method at present is to form a new output sequence by sampling at equal intervals on the data points of the original output time series; in addition, there is also a piecewise aggregation approximation method based on information entropy to calculate the information entropy of the original output time series. The distribution of the data is approximated by piecewise aggregation to form a new output sequence. In addition, there are methods based on principal component analysis and discrete Fourier transform methods. On this basis, clustering such as k-means clustering or hierarchical clustering is used. Class algorithm for the construction of typical scenarios. However, the results of the above polymerization methods cannot reflect the trend and volatility of the original sequence very well. In addition, the traditional k-means clustering algorithm is highly sensitive to the selection of the initial cluster center, the stability of multiple clustering is poor, and the optimal number of classifications cannot be given. The disadvantage of hierarchical clustering is that the amount of calculation is relatively large. In addition, because the hierarchical clustering uses a greedy algorithm, it is obviously only a local optimum, not necessarily a global optimum. Therefore, the typical scenarios obtained by the above methods have shortcomings.
发明内容SUMMARY OF THE INVENTION
针对现有技术中存在的缺陷,本发明的目的在于提供一种考虑时空相关性的多维时序数据的聚合方法。该方法采用马尔可夫决策的方法优化出风电、光伏与负荷在不同初始状态组合下的最优动作策略。从而达到在该初始状态组合条件下所选的日场景组合在数值概率分布式上最接近原始时序数据。再采用马尔科夫蒙特卡洛方法抽样生成具有相关性的3×N的马尔可夫状态矩阵,将马尔科夫决策获得的最优动作策略与马尔可夫状态矩阵内的状态列向量组合相匹配,得到具有时空相关性的风电、光伏与负荷的聚合序列。In view of the defects existing in the prior art, the purpose of the present invention is to provide a method for aggregating multi-dimensional time series data considering the spatiotemporal correlation. The method adopts the Markov decision method to optimize the optimal action strategy of wind power, photovoltaic and load under different initial state combinations. Therefore, under the condition of the initial state combination, the selected daily scene combination is closest to the original time series data in terms of numerical probability distribution. Then use the Markov Monte Carlo method to sample and generate a 3×N Markov state matrix with correlation, and match the optimal action strategy obtained by the Markov decision with the state column vector combination in the Markov state matrix. , to obtain the aggregation sequence of wind power, photovoltaic and load with spatial and temporal correlation.
为达到以上目的,本发明采取的技术方案是:In order to achieve the above purpose, the technical scheme adopted in the present invention is:
一种考虑时空相关性的多维时序数据的聚合方法,包括如下步骤:A method for aggregation of multidimensional time series data considering spatiotemporal correlation, comprising the following steps:
S1、分别获取同时期长度为m的风电、光伏与负荷中长期历史功率序列,对各序列进行极值归一化处理得到长度为m的风电中长期功率时间序列、光伏中长期功率时间序列、负荷中长期功率时间序列;S1. Obtain the mid- and long-term historical power series of wind power, photovoltaic and load at the same period of length m respectively, and perform extreme value normalization on each sequence to obtain the mid- and long-term power time series of wind power, photovoltaic mid- and long-term power time series, Long-term power time series of loads;
其中,长度为m的风电中长期功率时间序列表示为:Among them, the medium and long-term power time series of wind power with length m is expressed as:


长度为m的光伏中长期功率时间序列表示为:The PV medium and long-term power time series with length m is expressed as:


长度为m的负荷中长期功率时间序列表示为:The medium and long-term power time series of a load of length m is expressed as:


然后对风电、光伏与负荷的中长期功率时间序列分别进行日场景分割获得相同数量的:Then the medium and long-term power time series of wind power, photovoltaic and load are divided into daily scenes to obtain the same number of:
风电日场景
其中

光伏日场景
其中

负荷日场景
其中

风电日场景SCwind、光伏日场景SCpv、负荷日场景SCload中所包含的日场景元素通过近邻传播聚类算法分别被分配到风电日场景集


其中,


其中


其中

其中nwi、npi与nli由近邻传播聚类算法通过计算获得的值;Among them, nwi , npi and nli are calculated by the nearest neighbor propagation clustering algorithm;
S2、在步骤S1的基础上,将采用近邻传播聚类算法获得的风电日场景、光伏日场景与负荷日场景的聚类结果作为状态量,得到风电、光伏与负荷的随机状态模型,由马尔可夫蒙特卡洛过程来表示,马尔可夫蒙特卡洛过程的高阶状态转移概率表示为:S2. On the basis of step S1, the clustering results of the wind power daily scene, photovoltaic daily scene and load daily scene obtained by using the neighbor propagation clustering algorithm are used as the state quantity, and the random state model of wind power, photovoltaic and load is obtained. The high-order state transition probability of the Markov Monte Carlo process is expressed as:


式中n表示马尔可夫聚合状态矩阵中的第n列状态且n∈[1,N],where n represents the nth column state in the Markov aggregation state matrix and n∈[1,N],


通过统计历史数据获得马尔可夫蒙特卡洛过程的状态转移概率矩阵:Obtain the state transition probability matrix of the Markov Monte Carlo process from statistical historical data:


S3、马尔科夫决策过程由五部分组成(S,A,{PSA},γ,R),S3, the Markov decision process consists of five parts (S, A, {PSA }, γ, R),
S是由聚类结果

第n步的状态集表示为:The state set of the nth step is expressed as:

A表示动作集,由聚类结果中各日场景集内所包含的日场景元素组成


第n步的动作集可以表示为:The action set of the nth step can be expressed as:

{PSA}表示状态转移概率,表示为:{PSA } represents the state transition probability, which is expressed as:

γ∈[0,1)表示阻尼系数,表示随着时间的推移回报率的折扣,按照经验值一般可以选择γ=0.5;γ∈[0, 1) represents the damping coefficient, which represents the discount of the rate of return over time. Generally, γ=0.5 can be selected according to the empirical value;
R代表误差函数:R stands for error function:


S4、定义值函数


利用贝尔曼等式求解

S5、将所有初始状态S0分别代入
S6、运用马尔可夫蒙特卡洛方法,通过Gibbs抽样生成由风电、光伏与负荷组成的3×N阶的马尔可夫聚合状态矩阵:S6. Use the Markov Monte Carlo method to generate a 3×N-order Markov aggregation state matrix composed of wind power, photovoltaics and loads through Gibbs sampling:

其中
S7、将马尔可夫状态矩阵内的每一组状态向量与最优策略的映射相匹配,得到日场景矩阵
其中


S8、判断日场景矩阵每行相邻的日场景间的首尾连接处差值是否大于中长期功率时间序列的一阶差分最大值,如果大于,则对首尾连接处进行小波滤波处理,直到差值小于一阶差分最大值,如果小于或等于,直接对日场景首尾相连,最后生成三条由N个日场景构成的聚合序列。S8. Determine whether the difference between the head and tail connections between adjacent daily scenes in each row of the daily scene matrix is greater than the maximum value of the first-order difference of the medium and long-term power time series. It is less than the maximum value of the first-order difference, and if it is less than or equal to, the daily scenes are directly connected end to end, and finally three aggregate sequences consisting of N daily scenes are generated.
本发明所述的方法考虑到了在优化调度层面进行年/月电量优化计算时,时间断面过多,数据量过大的问题,并且考虑到了在同一地区内的风、光与负荷因地形、纬度等自然因素的影响,很多风、光与负荷功率波动特性在一定程度上具有很大的相似性,需要提取出具有代表性的出力曲线的问题。该方法弥补了在优化调度层面进行年/月电量优化计算时计算量过大的缺陷,以及现有的风、光与负荷场景分析方法中时序仿真法存在计算效率低的问题,典型日法由于不能体现风、光与负荷的年、月、日出力特征,计算结果过于保守的问题。本方法兼顾计算效率和数据变化特性,为新能源发电系统的年/月优化调度提供了有效的指导,促进了风、光不确定性电源的消纳。The method described in the present invention takes into account the problems of too many time sections and too much data when the annual/monthly power optimization calculation is performed at the optimal scheduling level, and also takes into account that the wind, light and load in the same area are affected by terrain and latitude. Due to the influence of other natural factors, many wind, light and load power fluctuation characteristics have great similarity to a certain extent, and it is necessary to extract a representative output curve. This method makes up for the problem of excessive calculation amount in the annual/monthly power optimization calculation at the optimal scheduling level, and the problem of low calculation efficiency of the time series simulation method in the existing wind, light and load scene analysis methods. It cannot reflect the year, month, and sun force characteristics of wind, light and load, and the calculation results are too conservative. The method takes into account the characteristics of calculation efficiency and data change, provides effective guidance for the annual/monthly optimal scheduling of new energy power generation systems, and promotes the consumption of wind and light uncertain power sources.
附图说明Description of drawings
本发明有如下附图:The present invention has the following accompanying drawings:
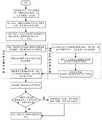
图1为本发明一种考虑时空相关性的多维时序数据的聚合方法流程示意图。FIG. 1 is a schematic flowchart of a method for aggregating multi-dimensional time series data considering spatiotemporal correlation according to the present invention.
具体实施方式Detailed ways
以下结合附图1对本发明作进一步详细说明。The present invention will be further described in detail below in conjunction with FIG. 1 .
一种考虑时空相关性的多维时序数据的聚合方法,包括如下步骤:A method for aggregation of multidimensional time series data considering spatiotemporal correlation, comprising the following steps:
S1、分别获取同时期长度为m的风电、光伏与负荷中长期历史功率序列,对各序列进行极值归一化处理得到长度为m的风电中长期功率时间序列、光伏中长期功率时间序列、负荷中长期功率时间序列;S1. Obtain the mid- and long-term historical power series of wind power, photovoltaic and load at the same period of length m respectively, and perform extreme value normalization on each sequence to obtain the mid- and long-term power time series of wind power, photovoltaic mid- and long-term power time series, Long-term power time series of loads;
其中,长度为m的风电中长期功率时间序列表示为:Among them, the medium and long-term power time series of wind power with length m is expressed as:


长度为m的光伏中长期功率时间序列表示为:The PV medium and long-term power time series with length m is expressed as:


长度为m的负荷中长期功率时间序列表示为:The medium and long-term power time series of a load of length m is expressed as:


然后对归一化处理后的风电、光伏与负荷的中长期功率时间序列分别进行日场景分割获得相同数量的:Then, the normalized medium and long-term power time series of wind power, photovoltaic and load are divided into daily scenes to obtain the same number of:
风电日场景
其中

光伏日场景
其中

负荷日场景
其中

风电日场景SCwind、光伏日场景SCpv、负荷日场景SCload中所包含的日场景元素通过近邻传播聚类算法分别被分配到风电日场景集


其中,


其中


其中

其中nwi、npi与nli是由近邻传播聚类算法通过计算获得的值;Among them, nwi , npi and nli are the values obtained by the nearest neighbor propagation clustering algorithm;
S2、在步骤S1的基础上,将采用近邻传播聚类算法获得的风电日场景、光伏日场景与负荷日场景的聚类结果作为状态量,得到风电、光伏与负荷的随机状态模型,由马尔可夫蒙特卡洛过程来表示,马尔可夫蒙特卡洛过程的高阶状态转移概率表示为:S2. On the basis of step S1, the clustering results of the wind power daily scene, photovoltaic daily scene and load daily scene obtained by using the neighbor propagation clustering algorithm are used as the state quantity, and the random state model of wind power, photovoltaic and load is obtained. The high-order state transition probability of the Markov Monte Carlo process is expressed as:


式中n表示马尔可夫聚合状态矩阵中的第n列状态且n∈[1,N],where n represents the state of the nth column in the Markov aggregation state matrix and n∈[1,N],


通过统计历史数据获得马尔可夫蒙特卡洛过程的状态转移概率矩阵:Obtain the state transition probability matrix of the Markov Monte Carlo process from statistical historical data:


S3、马尔科夫决策过程由五部分组成(S,A,{PSA},γ,R),S3, the Markov decision process consists of five parts (S, A, {PSA }, γ, R),
S是由聚类结果

第n步的状态集表示为:The state set of the nth step is expressed as:

A表示动作集,由聚类结果中各日场景集内所包含的日场景元素组成


第n步的动作集可以表示为:The action set of the nth step can be expressed as:

{PSA}表示状态转移概率,表示为:{PSA } represents the state transition probability, which is expressed as:

γ∈[0,1)表示阻尼系数,表示随着时间的推移回报率的折扣,按照经验值一般可以选择γ=0.5;γ∈[0, 1) represents the damping coefficient, which represents the discount of the rate of return over time. Generally, γ=0.5 can be selected according to the empirical value;
R代表误差函数:R stands for error function:


S4、定义值函数


利用贝尔曼等式求解

S5、将所有初始状态S0分别代入
S6、运用马尔可夫蒙特卡洛方法,通过Gibbs抽样生成由风电、光伏与负荷组成的3×N阶的马尔可夫聚合状态矩阵:S6. Use the Markov Monte Carlo method to generate a 3×N-order Markov aggregation state matrix composed of wind power, photovoltaics and loads through Gibbs sampling:

其中
S7、将马尔可夫状态矩阵内的每一组状态向量与最优策略的映射相匹配,得到日场景矩阵
其中


S8、判断日场景矩阵每行相邻的日场景间的首尾连接处差值是否大于中长期功率时间序列的一阶差分最大值,如果大于,则对首尾连接处进行小波滤波处理,直到差值小于一阶差分最大值,如果小于或等于,直接对日场景首尾相连,最后生成三条由N个日场景构成的聚合序列。S8. Determine whether the difference between the head and tail connections between adjacent daily scenes in each row of the daily scene matrix is greater than the maximum value of the first-order difference of the medium and long-term power time series. It is less than the maximum value of the first-order difference, and if it is less than or equal to, the daily scenes are directly connected end to end, and finally three aggregate sequences consisting of N daily scenes are generated.
以上所述,仅是本发明的较佳实例而已,并非对本发明作任何形式上的限制,本领域技术人员利用上述揭示的技术内容做出些许简单修改、等同变化或装饰,均落在本发明的保护范围内。The above are only preferred examples of the present invention, and are not intended to limit the present invention in any form. Those skilled in the art make some simple modifications, equivalent changes or decorations using the technical contents disclosed above, all of which fall within the present invention. within the scope of protection.
本说明书中未作详细描述的内容属于本领域专业技术人员公知的现有技术。Contents not described in detail in this specification belong to the prior art known to those skilled in the art.
Claims (3)


Priority Applications (1)
| Application Number | Priority Date | Filing Date | Title |
|---|---|---|---|
| CN201910932946.4ACN110909911B (en) | 2019-09-29 | 2019-09-29 | Aggregation method of multidimensional time series data considering space-time correlation |
Applications Claiming Priority (1)
| Application Number | Priority Date | Filing Date | Title |
|---|---|---|---|
| CN201910932946.4ACN110909911B (en) | 2019-09-29 | 2019-09-29 | Aggregation method of multidimensional time series data considering space-time correlation |
Publications (2)
| Publication Number | Publication Date |
|---|---|
| CN110909911A CN110909911A (en) | 2020-03-24 |
| CN110909911Btrue CN110909911B (en) | 2022-05-20 |
Family
ID=69815220
Family Applications (1)
| Application Number | Title | Priority Date | Filing Date |
|---|---|---|---|
| CN201910932946.4AActiveCN110909911B (en) | 2019-09-29 | 2019-09-29 | Aggregation method of multidimensional time series data considering space-time correlation |
Country Status (1)
| Country | Link |
|---|---|
| CN (1) | CN110909911B (en) |
Families Citing this family (9)
| Publication number | Priority date | Publication date | Assignee | Title |
|---|---|---|---|---|
| CN111523230B (en)* | 2020-04-22 | 2023-05-26 | 国网能源研究院有限公司 | Self-adaptive clustering method for wind-light load composite typical scene |
| CN112149346B (en)* | 2020-09-07 | 2024-04-26 | 华中科技大学 | A wind farm equivalent modeling method, device, electronic device and storage medium |
| CN113077166B (en)* | 2021-04-16 | 2024-06-28 | 国网吉林省电力有限公司 | Community energy storage scheduling method based on Markov decision process |
| CN113128063B (en)* | 2021-04-27 | 2024-08-16 | 国网北京市电力公司 | A typical load scenario generation method and system for ice and snow sports venues |
| CN113128064B (en)* | 2021-04-27 | 2023-10-24 | 国网北京市电力公司 | Thermoelectric data aggregation method, system, device and storage medium for simulation |
| CN113343491A (en)* | 2021-06-30 | 2021-09-03 | 东南大学 | Random scene analysis method considering time sequence autocorrelation and cross correlation |
| CN113807019A (en)* | 2021-09-24 | 2021-12-17 | 清华大学 | MCMC wind power simulation method based on improved scene classification and de-coarse-graining |
| CN114358656A (en)* | 2022-02-25 | 2022-04-15 | 华北电力大学 | Method and system for extracting typical scenarios of new energy output considering space-time correlation |
| CN117370825B (en)* | 2023-10-11 | 2024-06-21 | 国网经济技术研究院有限公司 | Long-term scene generation method and system based on attention conditional generative adversarial network |
Citations (2)
| Publication number | Priority date | Publication date | Assignee | Title |
|---|---|---|---|---|
| CN109524993A (en)* | 2018-12-19 | 2019-03-26 | 中国农业大学 | The typical week power output scene generating method of wind-powered electricity generation photovoltaic for Mid-long Term Optimized Scheduling |
| CN109783841A (en)* | 2018-11-28 | 2019-05-21 | 河海大学 | A kind of photovoltaic power output time series analogy method based on more scene state transfer matrixes and conditional probability sampling |
Family Cites Families (1)
| Publication number | Priority date | Publication date | Assignee | Title |
|---|---|---|---|---|
| US20090228516A1 (en)* | 2008-03-10 | 2009-09-10 | The Hong Kong Polytechnic University | Harmful algae indexing (HaiDex) method |
- 2019
- 2019-09-29CNCN201910932946.4Apatent/CN110909911B/enactiveActive
Patent Citations (2)
| Publication number | Priority date | Publication date | Assignee | Title |
|---|---|---|---|---|
| CN109783841A (en)* | 2018-11-28 | 2019-05-21 | 河海大学 | A kind of photovoltaic power output time series analogy method based on more scene state transfer matrixes and conditional probability sampling |
| CN109524993A (en)* | 2018-12-19 | 2019-03-26 | 中国农业大学 | The typical week power output scene generating method of wind-powered electricity generation photovoltaic for Mid-long Term Optimized Scheduling |
Non-Patent Citations (2)
| Title |
|---|
| Quantifying parameter uncertainty in a coral reef model using Metropolis-Coupled Markov Chain Monte Carlo;Clancy,D 等;《ECOLOGICAL MODELLING》;20100524;第221卷(第10期);全文* |
| 考虑气象因素的短期光伏出力预测的奇异谱分析方法;黎静华 等;《电力自动化设备》;20180504;全文* |
Also Published As
| Publication number | Publication date |
|---|---|
| CN110909911A (en) | 2020-03-24 |
Similar Documents
| Publication | Publication Date | Title |
|---|---|---|
| CN110909911B (en) | Aggregation method of multidimensional time series data considering space-time correlation | |
| CN107301472B (en) | Distributed photovoltaic planning method based on scene analysis method and voltage regulation strategy | |
| CN106529814B (en) | A distributed photovoltaic ultra-short-term forecast method based on Adaboost clustering and Markov chain | |
| CN109524993A (en) | The typical week power output scene generating method of wind-powered electricity generation photovoltaic for Mid-long Term Optimized Scheduling | |
| CN105741193A (en) | Multi-target distribution network reconstruction method considering distributed generation and load uncertainty | |
| CN108075471B (en) | Multi-objective constraint optimization grid dispatch strategy based on stochastic power output forecasting | |
| CN111092451B (en) | Photovoltaic consumption early warning method based on power distribution network grid | |
| CN113270898A (en) | Distributed photovoltaic optimization configuration method based on two-stage planning | |
| CN107679687A (en) | A kind of photovoltaic output modeling method and Generation System Reliability appraisal procedure | |
| Jin et al. | Wind and photovoltaic power time series data aggregation method based on an ensemble clustering and Markov chain | |
| Liao et al. | Two-layer optimization configuration method for distributed photovoltaic and energy storage systems based on IDEC-K clustering | |
| CN110011358B (en) | Distribution network load state adjustment controller | |
| CN117132132A (en) | Photovoltaic power generation power prediction method based on meteorological data | |
| CN110084430A (en) | A method of considering space-time characterisation design distributed photovoltaic power output prediction model | |
| CN112052996B (en) | Small hydropower station cluster power prediction method based on convolutional neural network technology | |
| CN119988925A (en) | A method, medium and system for generating extreme weather scenes based on CGAN algorithm | |
| CN117592255A (en) | Wind-light output sequence modeling method considering space-time correlation | |
| CN117574197A (en) | Data-driven photovoltaic power plant cluster division method | |
| CN108321840A (en) | The grid-connected logout selection method contributed based on photo-voltaic power generation station fining | |
| CN117060407B (en) | A wind power cluster power prediction method and system based on similar day classification | |
| CN105914752A (en) | Pilot node selection method based on clustering by fast search and density peaks | |
| CN109149644B (en) | An online strategy matching and collaborative optimization method for optical storage integration based on big data analysis | |
| CN117748444A (en) | Operation simulation method of power distribution system | |
| Shi et al. | Short-term photovoltaic power forecast based on long short-term memory network | |
| CN108233373B (en) | A Probabilistic Harmonic Analysis Method for Distributed Photovoltaic Access to Distribution Network Considering Weather Scenarios |
Legal Events
| Date | Code | Title | Description |
|---|---|---|---|
| PB01 | Publication | ||
| PB01 | Publication | ||
| SE01 | Entry into force of request for substantive examination | ||
| SE01 | Entry into force of request for substantive examination | ||
| GR01 | Patent grant | ||
| GR01 | Patent grant |