CN110807531A - Maintenance Strategy of Photovoltaic Power Plant Based on Component-System Hierarchical Optimization - Google Patents
Maintenance Strategy of Photovoltaic Power Plant Based on Component-System Hierarchical OptimizationDownload PDFInfo
- Publication number
- CN110807531A CN110807531ACN201810801842.5ACN201810801842ACN110807531ACN 110807531 ACN110807531 ACN 110807531ACN 201810801842 ACN201810801842 ACN 201810801842ACN 110807531 ACN110807531 ACN 110807531A
- Authority
- CN
- China
- Prior art keywords
- maintenance
- cost
- formula
- time
- state
- Prior art date
- Legal status (The legal status is an assumption and is not a legal conclusion. Google has not performed a legal analysis and makes no representation as to the accuracy of the status listed.)
- Granted
Links
Images


Classifications
- G—PHYSICS
- G06—COMPUTING OR CALCULATING; COUNTING
- G06Q—INFORMATION AND COMMUNICATION TECHNOLOGY [ICT] SPECIALLY ADAPTED FOR ADMINISTRATIVE, COMMERCIAL, FINANCIAL, MANAGERIAL OR SUPERVISORY PURPOSES; SYSTEMS OR METHODS SPECIALLY ADAPTED FOR ADMINISTRATIVE, COMMERCIAL, FINANCIAL, MANAGERIAL OR SUPERVISORY PURPOSES, NOT OTHERWISE PROVIDED FOR
- G06Q10/00—Administration; Management
- G06Q10/20—Administration of product repair or maintenance
- G—PHYSICS
- G06—COMPUTING OR CALCULATING; COUNTING
- G06Q—INFORMATION AND COMMUNICATION TECHNOLOGY [ICT] SPECIALLY ADAPTED FOR ADMINISTRATIVE, COMMERCIAL, FINANCIAL, MANAGERIAL OR SUPERVISORY PURPOSES; SYSTEMS OR METHODS SPECIALLY ADAPTED FOR ADMINISTRATIVE, COMMERCIAL, FINANCIAL, MANAGERIAL OR SUPERVISORY PURPOSES, NOT OTHERWISE PROVIDED FOR
- G06Q50/00—Information and communication technology [ICT] specially adapted for implementation of business processes of specific business sectors, e.g. utilities or tourism
- G06Q50/06—Energy or water supply
- Y—GENERAL TAGGING OF NEW TECHNOLOGICAL DEVELOPMENTS; GENERAL TAGGING OF CROSS-SECTIONAL TECHNOLOGIES SPANNING OVER SEVERAL SECTIONS OF THE IPC; TECHNICAL SUBJECTS COVERED BY FORMER USPC CROSS-REFERENCE ART COLLECTIONS [XRACs] AND DIGESTS
- Y02—TECHNOLOGIES OR APPLICATIONS FOR MITIGATION OR ADAPTATION AGAINST CLIMATE CHANGE
- Y02E—REDUCTION OF GREENHOUSE GAS [GHG] EMISSIONS, RELATED TO ENERGY GENERATION, TRANSMISSION OR DISTRIBUTION
- Y02E40/00—Technologies for an efficient electrical power generation, transmission or distribution
- Y02E40/70—Smart grids as climate change mitigation technology in the energy generation sector
- Y—GENERAL TAGGING OF NEW TECHNOLOGICAL DEVELOPMENTS; GENERAL TAGGING OF CROSS-SECTIONAL TECHNOLOGIES SPANNING OVER SEVERAL SECTIONS OF THE IPC; TECHNICAL SUBJECTS COVERED BY FORMER USPC CROSS-REFERENCE ART COLLECTIONS [XRACs] AND DIGESTS
- Y04—INFORMATION OR COMMUNICATION TECHNOLOGIES HAVING AN IMPACT ON OTHER TECHNOLOGY AREAS
- Y04S—SYSTEMS INTEGRATING TECHNOLOGIES RELATED TO POWER NETWORK OPERATION, COMMUNICATION OR INFORMATION TECHNOLOGIES FOR IMPROVING THE ELECTRICAL POWER GENERATION, TRANSMISSION, DISTRIBUTION, MANAGEMENT OR USAGE, i.e. SMART GRIDS
- Y04S10/00—Systems supporting electrical power generation, transmission or distribution
- Y04S10/50—Systems or methods supporting the power network operation or management, involving a certain degree of interaction with the load-side end user applications
Landscapes
- Business, Economics & Management (AREA)
- Engineering & Computer Science (AREA)
- Human Resources & Organizations (AREA)
- Economics (AREA)
- Physics & Mathematics (AREA)
- General Business, Economics & Management (AREA)
- Health & Medical Sciences (AREA)
- Theoretical Computer Science (AREA)
- Strategic Management (AREA)
- Tourism & Hospitality (AREA)
- General Physics & Mathematics (AREA)
- Marketing (AREA)
- Entrepreneurship & Innovation (AREA)
- Quality & Reliability (AREA)
- Operations Research (AREA)
- Public Health (AREA)
- Water Supply & Treatment (AREA)
- General Health & Medical Sciences (AREA)
- Primary Health Care (AREA)
- Supply And Distribution Of Alternating Current (AREA)
Abstract
Translated fromChinese
Description
Translated fromChinese技术领域technical field
本发明涉及光伏电站的维护策略分析,具体是根据光伏电站各个元件故障率进行状态预测,再对维护费用进行优化,从而经济合理的安排光伏电站的维修计划。The invention relates to the maintenance strategy analysis of the photovoltaic power station. Specifically, the state prediction is carried out according to the failure rate of each element of the photovoltaic power station, and then the maintenance cost is optimized, so as to arrange the maintenance plan of the photovoltaic power station economically and reasonably.
背景技术Background technique
太阳能作为一种可再生能源,越来越受到重视,光伏发电的装机容量在逐年递增。但是光伏发电也存在明显的缺陷和不足,比如随机性和不稳定性,加之光伏电站运行条件恶劣,使得光伏电站各元件故障频发。所以,为光伏电站安排经济合理的维护策略有很大的研究价值。As a renewable energy, solar energy has been paid more and more attention, and the installed capacity of photovoltaic power generation is increasing year by year. However, photovoltaic power generation also has obvious defects and deficiencies, such as randomness and instability, coupled with the poor operating conditions of photovoltaic power plants, which cause frequent failures of various components of photovoltaic power plants. Therefore, it is of great research value to arrange economical and reasonable maintenance strategies for photovoltaic power plants.
光伏电站的维修策略主要包含事后维修和预防性维修两种方式:事后维修是指当系统或元件发生故障后再进行维修的方式,其目的是恢复系统或部件原有的功能属性,但是事后维修会造成元件或系统故障停机,降低系统的可靠性;预防性维修是指当系统或部件已经工作较长时间,在预定的时间进行维修,防止元件发生故障,避免停机损失,但是预防性维修存在过修或欠修的情况,导致维修费用昂贵。国内外研究学者对多元件系统的维修原理进行了大量研究。其中,赵洪山等人在中国电机工程学报,2016,36(3):701-708.“考虑不完全维修的风电机组状态-机会维修策略”提出了状态-机会维修策略,根据元件的可靠度函数,确定机会维修和状态维修的阈值,从而合理安排元件是否共同维修,节省维修成本;刘璐洁等人在中国电机工程学报,2016,36(21):5732-5740.“基于可靠性和维修优先级的海上风电机组预防性维护策略优化”中,将维护的等待时间进行分类,考虑维护等待时间对元件和风电机组可靠性更新的影响,以维护期单位成本最低为准则优化运维策略;苏永新等在电工技术学报,2015,30(22):190-198.“海上风电场疲劳分布与有功功率统一控制”中提出了研究了考虑随机故障的机会维修,通过优化系统各部件预防性维修役龄和机会维修役龄,使系统的维修费用最少。以上分析方法维修时间的确定一般都是基于元件运行状态,分析元件可靠性以确定是否进行状态维修或机会维修,在此基础上才考虑优化维修策略的总费用。这种方法确定的维修时间可以保证元件的可靠性,但不一定是每个元件最经济的维护方案。The maintenance strategy of photovoltaic power plants mainly includes two ways: post-event maintenance and preventive maintenance: post-event maintenance refers to the maintenance method after the system or component fails. The purpose is to restore the original functional properties of the system or component, but the post-event maintenance It will cause the failure of components or systems and reduce the reliability of the system; preventive maintenance means that when the system or components have been working for a long time, maintenance is carried out at a predetermined time to prevent component failure and avoid downtime losses, but preventive maintenance exists. Over-repair or under-repair, resulting in expensive repair costs. Domestic and foreign researchers have done a lot of research on the maintenance principles of multi-component systems. Among them, Zhao Hongshan et al. in Chinese Journal of Electrical Engineering, 2016, 36(3): 701-708. "Condition-opportunity maintenance strategy for wind turbines considering incomplete maintenance" proposed a state-opportunity maintenance strategy, according to the reliability of components function to determine the thresholds of opportunistic maintenance and condition maintenance, so as to reasonably arrange whether components are repaired together and save maintenance costs; Liu Lujie et al. in Chinese Journal of Electrical Engineering, 2016, 36(21): 5732-5740. "Based on reliability and maintenance priority In “Optimization of Preventive Maintenance Strategy for Offshore Wind Turbines at the Advanced Level”, the maintenance waiting time is classified, the influence of maintenance waiting time on the reliability update of components and wind turbines is considered, and the operation and maintenance strategy is optimized based on the minimum unit cost during the maintenance period; Su Yongxin et al. in the Journal of Electrotechnical Technology, 2015, 30(22): 190-198. "Fatigue distribution and active power unified control of offshore wind farms" proposed and studied opportunistic maintenance considering random faults, and by optimizing the preventive maintenance service of each component of the system. age and opportunity maintenance service age to minimize system maintenance costs. The maintenance time of the above analysis methods is generally determined based on the operating status of the components, and the reliability of the components is analyzed to determine whether to perform condition maintenance or opportunity maintenance. On this basis, the total cost of the optimized maintenance strategy is considered. The repair time determined by this method can guarantee the reliability of the component, but it is not necessarily the most economical maintenance plan for each component.
发明内容SUMMARY OF THE INVENTION
本发明的目的针对现有技术的不足,提出了一种基于元件-系统分级优化的光伏电站维护策略分析方法,以解决上述背景技术中提出的问题。The purpose of the present invention is to propose a maintenance strategy analysis method for photovoltaic power plants based on component-system hierarchical optimization in view of the deficiencies of the prior art, so as to solve the problems raised in the above background technology.
本发明采用下述技术方案:The present invention adopts following technical scheme:
一种基于元件-系统分级优化的光伏电站维护策略分析方法,包括以下步骤:A photovoltaic power station maintenance strategy analysis method based on component-system hierarchical optimization, comprising the following steps:
步骤1:利用平均无故障工作时间MTBF(Mean time between failure)可以计算出光伏电站各个元件的故障率λ,计算式如式(1)所示。Step 1: Using the mean time between failure (MTBF), the failure rate λ of each component of the photovoltaic power station can be calculated, and the calculation formula is shown in formula (1).

步骤2:光伏电站中直流汇流箱、逆变器、箱式三绕组变压器均视为两状态元件,状态集合由故障停运和正常运行两种状态组成。在状态1下,元件正常运行,完成预设功能,状态0情况下,元件发生故障导致停运,状态集合S={1,0},对应的状态信息ηi分别为100%和0%。Step 2: The DC combiner box, inverter, and box-type three-winding transformer in the photovoltaic power station are all regarded as two-state elements, and the state set consists of two states: fault shutdown and normal operation. In
根据式(1)计算得到的元件故障率λ,获得两状态元件状态转移矩阵P如式(2)所示:According to the element failure rate λ calculated by Equation (1), the state transition matrix P of the two-state element is obtained as shown in Equation (2):

步骤3:光伏组件也属于两状态元件,但是光伏阵列由多个光伏组件串并联组成,某一个光伏组件的故障不会导致整个光伏阵列停运,因此需要对光伏阵列进行多状态划分。m×n的子阵列由n个组串并联而成,每个组串由m个组件串联组成。根据式(1)计算光伏组件故障率为λ,则每个组串的故障率λs如式(3)所示。子阵列的状态集有n+1个元素,S={si(i=n,n-1,…,1,0)},对应的状态信息ηi表达式如式(4)所示,i为正常工作组串个数。Step 3: Photovoltaic modules are also two-state elements, but the photovoltaic array is composed of multiple photovoltaic modules in series and parallel. The failure of one photovoltaic module will not cause the entire photovoltaic array to be shut down. Therefore, it is necessary to divide the photovoltaic array into multiple states. The m×n sub-array is formed by n groups of strings in parallel, and each group string is formed by m components in series. Calculate the failure rate λ of photovoltaic modules according to formula (1), then the failure rateλs of each string is shown in formula (3). The state set of the sub-array has n+1 elements, S={si (i =n, n-1, . i is the number of normal working group strings.
λs=m·λ (3)λs = m·λ (3)
ηi=i·Ps/Pa×100% (4)ηi =i·Ps /Pa ×100% (4)
根据光伏阵列状态转移图确定阵列的状态转移矩阵P,则光伏阵列状态转移矩阵各元素如式(5)所示:The state transition matrix P of the array is determined according to the state transition diagram of the photovoltaic array, and the elements of the state transition matrix of the photovoltaic array are shown in formula (5):
步骤4:基于马尔科夫过程,结合状态转移概率矩阵,建立光伏电站各元件状态预测模型:Step 4: Based on the Markov process, combined with the state transition probability matrix, establish a state prediction model for each component of the photovoltaic power station:
π(k)=π(k-1)P=π(0)Pk=π(i)Pk-i (6)π(k)=π(k-1)P=π(0)Pk =π(i)Pki (6)
式中,π(0)为初始状态概率分布,π(i)为iΔt时刻状态概率分布,P为状态转移矩阵。In the formula, π(0) is the initial state probability distribution, π(i) is the state probability distribution at time iΔt, and P is the state transition matrix.
步骤5:元件的平均维修成本分为三部分,平均直接维修费用Cm(t)、平均停机损失Ci(t)和故障风险损失Cr(t),计算式分别为式(7)-(9)。Step 5: The average maintenance cost of components is divided into three parts, the average direct maintenance cost Cm (t), the average downtime loss Ci (t) and the failure risk loss Cr (t), the calculation formulas are equation (7)- (9).
式中,cm表示维修的直接成本,包含物流、人工等费用;tmnt表示上一次维修时间。In the formula, cm represents the direct cost of maintenance, including logistics, labor and other costs;tmnt represents the last maintenance time.

式中,ci表示维修时元件的停机损失。In the formula, ci represents the downtime loss of components during maintenance.

式中,πj(t)表示元件在t时刻处于状态的j概率;Γ为子阵列的平均一天发电量,kWh;v为电价;l表示元件状态个数;mj(t|Θj)表示t时刻元件处于状态j的功率损失率;In the formula, πj (t) represents the j probability that the element is in the state at time t; Γ is the average daily power generation of the sub-array, kWh; v is the electricity price; l represents the number of element states; mj (t|Θj ) Represents the power loss rate of the element in state j at time t;
步骤6:cm和ci均为固定值,所以Cm(t)和Ci(t)是随维修时间间隔的增加而减小的,但是随着时间的推移,元件故障停运的风险会逐渐增大,所以Cr(t)是随时间增加的,根据式(10)确定最优维护动作时间t*和最低平均费用C*;Step 6: Both cm and ci are fixed values, so Cm (t) and Ci (t) decrease as the maintenance interval increases, but over time, the risk of component failure outages will gradually increase, so Cr (t) increases with time, according to formula (10) to determine the optimal maintenance action time t* and the minimum average cost C* ;

步骤7:除最优维护时间外,其他可选择的接近最优的维护时间也需要确定,为系统级维护策略的优化提供选择。接近最优维修时间可以通过排除搜索空间中的最优时间来求取,如式(11)所示,确定每个元件的维修策略集合A*,A*={a1*,a2*,…}={(t1*,C1*),(t2*,C2*),…},其中(tj*,Cj*)表示维护策略集合中第j个策略的维护时间和平均维护费用;Step 7: In addition to the optimal maintenance time, other optional near-optimal maintenance times also need to be determined to provide options for the optimization of system-level maintenance strategies. The near-optimal maintenance time can be obtained by excluding the optimal time in the search space, as shown in equation (11), to determine the maintenance strategy set A* for each component, A* ={a1* , a2* , …}={(t1* , C1* ), (t2* , C2* ), …}, where (tj* , Cj* ) represents the maintenance time of the jth policy in the maintenance policy set and average maintenance cost;

步骤8:对于N个元件构成的系统,通过元件级维护策略优化分别确定每个元件所对应的策略集合Ak*={a1,k*,a2,k*,…}={(t1,k*,C1,k*),(t2,k*,C2,k*),...},k表示第k个元件,k=1,2,...,N。元件单独维修时,系统总的维修费用c0如式(12)所示:Step 8: For a system composed of N elements, determine the strategy set Ak* = {a1, k* , a2, k* , ...} = {(t1,k* ,C1,k* ),(t2,k* ,C2,k* ),...}, k denotes the kth element, k=1,2,...,N. When the components are repaired individually, the total maintenance cost c0 of the system is shown in formula (12):

式中ck表示第k个元件选择维修策略xk时的维修费用;cmk表示第k个元件的直接维修费用;cik表示第k个元件的维修停机损失。In the formula,ck represents the maintenance cost when the kth component chooses the maintenance strategyxk ;cmk represents the direct maintenance cost of the kth component;cik represents the maintenance downtime loss of the kth component.
步骤9:为了方便计算元件共同维修节省成本,将元件的直接维修费用cm分成两部分,如式(13)所示:Step 9: In order to conveniently calculate the cost savings of common maintenance of components, the direct maintenance cost cm of components isdivided into two parts, as shown in formula (13):
cm=cm1+cm2 (13)cm =cm1 +cm2 (13)
式中,cm1表示固定成本;cm2表示非技术维修人员的人工费用,元件共同维修时可以节省的支出费用。因此,共同维修节省的直接维修费用cEOS如式(14)所示:In the formula, cm1 represents the fixed cost; cm2 represents the labor cost of non-technical maintenance personnel, and the expenses that can be saved when the components are repaired together. Therefore, the direct maintenance cost cEOS saved by joint maintenance is shown in formula (14):

式中,X表示系统维修策略;n(Xt)表示策略X中在t时刻共同维修的元件个数。In the formula, X represents the system maintenance strategy; n(Xt ) represents the number of components to be jointly maintained at time t in the strategy X.
用ci2表示在某一时刻元件共同维修时重复的停机损失,根据式(15)确定,则共同维修节省的总停机损失cDT如式(16)所示。Ci2 is used to represent the repeated downtime loss when the components are repaired together at a certain time. According to the formula (15), the total downtime loss cDT saved by the joint repair is shown in the formula (16).

式中,Xt为t时刻共同维修元件的组合,元件数为n(Xt);cik(Xt)表示Xt中第k个元件的停机损失。In the formula, Xt is the combination of common maintenance components at time t, and the number of components is n(Xt ); cik (Xt ) represents the shutdown loss of the kth component in Xt .

系统中元件共同维修除了会节省维修费用和停机损失外,还可能会产生额外的功率损失,因此,需要在成本中引入额外损失变量。为了便于计算多个元件共同维修引发的额外损失费用,根据元件之间的结构特征将系统中的元件分为v个组别,分别为g1,g2,...,gv,额外损失cLF表达式为式(17):In addition to saving maintenance costs and downtime losses, the common maintenance of components in the system may also generate additional power losses. Therefore, additional loss variables need to be introduced into the cost. In order to facilitate the calculation of the additional loss cost caused by the common maintenance of multiple components, the components in the system are divided into v groups according to the structural characteristics between the components, which are respectively g1 , g2 , ..., gv , the additional loss cLF expression is formula (17):

式中,χt(X)表示维修策略X中在t时刻共同维修会产生额外损失的集合;fLF表示共同维修产生的损失函数。In the formula, χt (X) represents the set of additional losses caused by joint maintenance at time t in the maintenance strategy X; fLF represents the loss function caused by joint maintenance.
步骤10:综合以上分析,得到系统级维修策略X总成本cSL表达式如式(18)所示:Step 10: Based on the above analysis, the system-level maintenance strategy X total cost cSL expression is obtained as shown in formula (18):
cSL(X)=c0(X)-cEOS(X)-cDT(X)+cLF(X) (18)cSL (X)=c0 (X)-cEOS (X)-cDT (X)+cLF (X) (18)
步骤11:根据式(10)确定了元件最优维修时间t*和最低平均费用C*,则在系统级优化阶段选择A*中其他非最优的维修时间对应的平均费用的增量Ct如式(19)所示:Step 11: According to the formula (10), the optimal maintenance time t* and the minimum average cost C* of the component are determined, then in the system-level optimization stage, the increment Ct of the average cost corresponding to other non-optimal maintenance time in A* is selected As shown in formula (19):
根据步骤9成本分析,元件共同维修节省的成本及产生的额外损失分别为,cEOS、cDT和cLF,因此系统中元件同时维修导致的平均减额费用Csim如式(20)所示:According to the cost analysis in step 9, the cost saved and the additional losses generated by the joint maintenance of components are cEOS , cDT and cLF respectively. Therefore, the average derating cost Csim caused by the simultaneous maintenance of components in the system is shown in equation (20) :

步骤12:通过比较共同维修带来的成本优势与选择非最优维护时间引起的费用增额,确定光伏电站中元件共同维修时间阈值,确定电站最优维护策略。Step 12: Determine the common maintenance time threshold of components in the photovoltaic power station and determine the optimal maintenance strategy of the power station by comparing the cost advantage brought by the common maintenance and the cost increase caused by selecting a non-optimal maintenance time.
本发明与现有技术相比的优点在于:The advantages of the present invention compared with the prior art are:
1.本发明能够在保证可靠性的前提下得到元件的最经济维护时间,不同于状态维修仅仅根据元件可靠性确定维修时间,从而有效的避免过修或欠修。1. The present invention can obtain the most economical maintenance time of the components under the premise of ensuring reliability, which is different from the condition maintenance which only determines the maintenance time according to the reliability of the components, thereby effectively avoiding over-repair or under-repair.
2.本发明在对各个元件维护时间进行优化的基础上再对光伏电站总的维护费用进行优化,在元件级和系统级均进行经济性分析,从而获得最优的维护策略。2. The present invention optimizes the total maintenance cost of the photovoltaic power station on the basis of optimizing the maintenance time of each component, and performs economic analysis at the component level and the system level, thereby obtaining the optimal maintenance strategy.
附图说明Description of drawings
图1是本发明的流程图;Fig. 1 is the flow chart of the present invention;
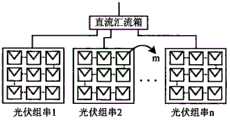
图2是光伏电站电气结构图;Figure 2 is the electrical structure diagram of the photovoltaic power station;
图3是光伏阵列电气结构图;Figure 3 is an electrical structure diagram of a photovoltaic array;
图4是光伏阵列状态转移图;Figure 4 is a state transition diagram of a photovoltaic array;
图5是平均直接维修费用Cm(t)、平均停机损失Ci(t)和故障风险损失Cr(t)变化趋势图。Figure 5 is a trend diagram of the average direct maintenance cost Cm (t), the average downtime loss Ci (t) and the failure risk loss Cr (t).
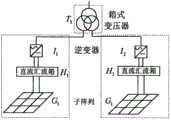
图6是发电单元电气结构图Figure 6 is a diagram of the electrical structure of the power generation unit
具体实施方式Detailed ways
一种基于元件-系统分级优化的光伏电站维护策略分析方法,流程图如图1所示,包括以下步骤:A method for analyzing the maintenance strategy of photovoltaic power plants based on component-system hierarchical optimization, the flow chart is shown in Figure 1, including the following steps:
步骤1:光伏电站电气结构如图2所示,在对光伏电站各个元件进行状态预测时,只考虑了光伏组件,直流汇流箱、逆变器、箱式三绕组变压器4种主要元件。根据美国桑迪亚实验室提供的数据,利用平均无故障工作时间MTBF(Mean time between failure)可以计算出光伏电站各个元件的故障率λ,计算式如式(1)所示,数据及结果如表1所示。Step 1: The electrical structure of the photovoltaic power station is shown in Figure 2. When predicting the state of each component of the photovoltaic power station, only four main components, the photovoltaic module, the DC combiner box, the inverter, and the box-type three-winding transformer, are considered. According to the data provided by Sandia Laboratories in the United States, the failure rate λ of each component of the photovoltaic power station can be calculated by using the mean time between failure (MTBF), the calculation formula is shown in formula (1), and the data and results are as follows shown in Table 1.

表1 元件平均故障时间和故障修复时间Table 1 Component mean time to failure and failure repair time
Table1 MTBF and MTTR of componentsTable1 MTBF and MTTR of components

步骤2:光伏电站中直流汇流箱、逆变器、箱式三绕组变压器均视为两状态元件,状态集合由故障停运和正常运行两种状态组成。在状态1下,元件正常运行,完成预设功能,状态0情况下,元件发生故障导致停运,状态集合S={1,0},对应的状态信息ηi分别为100%和0%。Step 2: The DC combiner box, inverter, and box-type three-winding transformer in the photovoltaic power station are all regarded as two-state elements, and the state set consists of two states: fault shutdown and normal operation. In
根据式(1)计算得到的元件故障率λ,获得两状态元件状态转移矩阵P如式(2)所示:According to the element failure rate λ calculated by Equation (1), the state transition matrix P of the two-state element is obtained as shown in Equation (2):

步骤3:光伏组件也属于两状态元件,但是光伏阵列由多个光伏组件串并联组成,某一个光伏组件的故障不会导致整个光伏阵列停运,因此需要对光伏阵列进行多状态划分。子阵列结构图如图3所示,m×n的子阵列由n个组串并联而成,每个组串由m个组件串联组成。根据式(1)计算光伏组件故障率为λ,则每个组串的故障率λs如式(3)所示。子阵列的状态集有n+1个元素,S={si(i=n,n-1,…,1,0)},对应的状态信息ηi表达式如式(4)所示,i为正常工作组串个数。Step 3: Photovoltaic modules are also two-state elements, but the photovoltaic array is composed of multiple photovoltaic modules in series and parallel. The failure of one photovoltaic module will not cause the entire photovoltaic array to be shut down. Therefore, it is necessary to divide the photovoltaic array into multiple states. The sub-array structure diagram is shown in Figure 3. The m×n sub-array is formed by n groups of strings in parallel, and each group string is composed of m components in series. Calculate the failure rate λ of photovoltaic modules according to formula (1), then the failure rateλs of each string is shown in formula (3). The state set of the sub-array has n+1 elements, S={si (i =n, n-1, . i is the number of normal working group strings.
λs=m·λ (3)λs = m·λ (3)
ηi=i·Ps/Pa×100% (4)ηi =i·Ps /Pa ×100% (4)
子阵列的状态转移图如图4所示,根据光伏阵列状态转移图确定阵列的状态转移矩阵P,则光伏阵列状态转移矩阵各元素如式(5)所示:The state transition diagram of the sub-array is shown in Figure 4. According to the state transition diagram of the photovoltaic array, the state transition matrix P of the array is determined, and then the elements of the photovoltaic array state transition matrix are shown in formula (5):

步骤4:基于马尔科夫过程,结合状态转移概率矩阵,建立光伏电站各元件状态预测模型:Step 4: Based on the Markov process, combined with the state transition probability matrix, establish a state prediction model for each component of the photovoltaic power station:
π(k)=π(k-1)P=π(0)Pk=π(i)Pk-i (6)π(k)=π(k-1)P=π(0)Pk =π(i)Pki (6)
式中,π(0)为初始状态概率分布,π(i)为iΔt时刻状态概率分布,P为状态转移矩阵。In the formula, π(0) is the initial state probability distribution, π(i) is the state probability distribution at time iΔt, and P is the state transition matrix.
步骤5:元件的平均维修成本分为三部分,平均直接维修费用Cm(t)、平均停机损失Ci(t)和故障风险损失Cr(t),计算式分别为式(7)-(9)。Step 5: The average maintenance cost of components is divided into three parts, the average direct maintenance cost Cm (t), the average downtime loss Ci (t) and the failure risk loss Cr (t), the calculation formulas are equation (7)- (9).

式中,cm表示维修的直接成本,包含物流、人工等费用;tmnt表示上一次维修时间。In the formula, cm represents the direct cost of maintenance, including logistics, labor and other costs;tmnt represents the last maintenance time.

式中,ci表示维修时元件的停机损失。In the formula, ci represents the downtime loss of components during maintenance.

式中,πj(t)表示元件在t时刻处于状态的j概率;Γ为子阵列的平均一天发电量,kWh;v为电价;l表示元件状态个数;mj(t|Θj)表示t时刻元件处于状态j的功率损失率;In the formula, πj (t) represents the j probability that the element is in the state at time t; Γ is the average daily power generation of the sub-array, kWh; v is the electricity price; l represents the number of element states; mj (t|Θj ) Represents the power loss rate of the element in state j at time t;
步骤6:cm和ci均为固定值,所以Cm(t)和Ci(t)是随维修时间间隔的增加而减小的,但是随着时间的推移,元件故障停运的风险会逐渐增大,所以Cr(t)是随时间增加的,Cm(t)、Ci(t)和Cr(t)变化趋势如图5所示,根据式(10)确定最优维护动作时间t*和最低平均费用C*;Step 6: Both cm and ci are fixed values, so Cm (t) and Ci (t) decrease as the maintenance interval increases, but over time, the risk of component failure outages will gradually increase, so Cr (t) increases with time, and the trends of Cm (t), Ci (t) and Cr (t) are shown in Figure 5. According to formula (10) to determine the optimal Maintenance action time t* and minimum average cost C* ;
步骤7:除最优维护时间外,其他可选择的接近最优的维护时间也需要确定,为系统级维护策略的优化提供选择。接近最优维修时间可以通过排除搜索空间中的最优时间来求取,如式(11)所示,确定每个元件的维修策略集合A*,A*={a1*,a2*,…}={(t1*,C1*),(t2*,C2*),…},其中(tj*,Cj*)表示维护策略集合中第j个策略的维护时间和平均维护费用;Step 7: In addition to the optimal maintenance time, other optional near-optimal maintenance times also need to be determined to provide options for the optimization of system-level maintenance strategies. The near-optimal maintenance time can be obtained by excluding the optimal time in the search space, as shown in equation (11), to determine the maintenance strategy set A* for each component, A* ={a1* , a2* , …}={(t1* , C1* ), (t2* , C2* ), …}, where (tj* , Cj* ) represents the maintenance time of the jth policy in the maintenance policy set and average maintenance cost;

步骤8:对于N个元件构成的系统,通过元件级维护策略优化分别确定每个元件所对应的策略集合Ak*={a1,k*,a2,k*,…}={(ti,k*,C1,k*),(t2,k*,C2,k*),...},k表示第k个元件,k=1,2,...,N。元件单独维修时,系统总的维修费用c0如式(12)所示:Step 8: For a system composed of N elements, determine the strategy set Ak* = {a1, k* , a2, k* , ...} = {(ti, k* , C1, k* ), (t2, k* , C2, k* ),...}, k denotes the kth element, k=1, 2,...,N. When the components are repaired individually, the total maintenance cost c0 of the system is shown in formula (12):

式中ck表示第k个元件选择维修策略xk时的维修费用;cmk表示第k个元件的直接维修费用;cik表示第k个元件的维修停机损失。In the formula,ck represents the maintenance cost when the kth component chooses the maintenance strategyxk ;cmk represents the direct maintenance cost of the kth component;cik represents the maintenance downtime loss of the kth component.
步骤9:为了方便计算元件共同维修节省成本,将元件的直接维修费用cm分成两部分,如式(13)所示:Step 9: In order to conveniently calculate the cost savings of common maintenance of components, the direct maintenance cost cm of components isdivided into two parts, as shown in formula (13):
cm=cm1+cm2 (13)cm =cm1 +cm2 (13)
式中,cm1表示固定成本;cm2表示非技术维修人员的人工费用,元件共同维修时可以节省的支出费用。因此,共同维修节省的直接维修费用cEOS如式(14)所示:In the formula, cm1 represents the fixed cost; cm2 represents the labor cost of non-technical maintenance personnel, and the expenses that can be saved when the components are repaired together. Therefore, the direct maintenance cost cEOS saved by joint maintenance is shown in formula (14):

式中,X表示系统维修策略;n(Xt)表示策略X中在t时刻共同维修的元件个数。In the formula, X represents the system maintenance strategy; n(Xt ) represents the number of components to be jointly maintained at time t in the strategy X.
用ci2表示在某一时刻元件共同维修时重复的停机损失,根据式(15)确定,则共同维修节省的总停机损失cDT如式(16)所示。Ci2 is used to represent the repeated downtime loss when the components are repaired together at a certain time. According to the formula (15), the total downtime loss cDT saved by the joint repair is shown in the formula (16).

式中,Xt为t时刻共同维修元件的组合,元件数为n(Xt);cik(Xt)表示Xt中第k个元件的停机损失。In the formula, Xt is the combination of common maintenance components at time t, and the number of components is n(Xt ); cik (Xt ) represents the shutdown loss of the kth component in Xt .

系统中元件共同维修除了会节省维修费用和停机损失外,还可能会产生额外的功率损失,因此,需要在成本中引入额外损失变量。为了便于计算多个元件共同维修引发的额外损失费用,根据元件之间的结构特征将系统中的元件分为v个组别,分别为g1,g2,...,gv,发电单元分组如图6所示,额外损失cLF表达式为式(17):In addition to saving maintenance costs and downtime losses, the common maintenance of components in the system may also generate additional power losses. Therefore, additional loss variables need to be introduced into the cost. In order to facilitate the calculation of the additional loss cost caused by the common maintenance of multiple components, the components in the system are divided into v groups according to the structural characteristics between the components, namely g1 , g2 , ..., gv , the power generation units The grouping is shown in Figure 6, and the additional loss cLF is expressed as formula (17):

式中,χt(X)表示维修策略X中在t时刻共同维修会产生额外损失的集合;fLF表示共同维修产生的损失函数。In the formula, χt (X) represents the set of additional losses caused by joint maintenance at time t in the maintenance strategy X; fLF represents the loss function caused by joint maintenance.
步骤10:综合以上分析,得到系统级维修策略X总成本cSL表达式如式(18)所示:Step 10: Based on the above analysis, the system-level maintenance strategy X total cost cSL expression is obtained as shown in formula (18):
cSL(X)=c0(X)-cEOS(X)-cDT(X)+cLF(X) (18)cSL (X)=c0 (X)-cEOS (X)-cDT (X)+cLF (X) (18)
步骤11:根据式(10)确定了元件最优维修时间t*和最低平均费用C*,则在系统级优化阶段选择A*中其他非最优的维修时间对应的平均费用的增量Ct如式(19)所示:Step 11: According to the formula (10), the optimal maintenance time t* and the minimum average cost C* of the component are determined, then in the system-level optimization stage, the increment Ct of the average cost corresponding to other non-optimal maintenance time in A* is selected As shown in formula (19):

根据步骤9成本分析,元件共同维修节省的成本及产生的额外损失分别为,cEOS、cDT和cLF,因此系统中元件同时维修导致的平均减额费用Csim如式(20)所示:According to the cost analysis in step 9, the cost saved and the additional losses generated by the joint maintenance of components are cEOS , cDT and cLF respectively. Therefore, the average derating cost Csim caused by the simultaneous maintenance of components in the system is shown in equation (20) :
步骤12:通过比较共同维修带来的成本优势Csim与选择非最优维护时间引起的费用增额Ct,确定光伏电站中元件共同维修时间阈值,确定电站最优维护策略,计算最优维修策略节省的维修费用与停机时间。Step 12: Determine the common maintenance time threshold of components in the photovoltaic power station by comparing the cost advantage Csim brought by common maintenance and the cost increase Ct caused by selecting non-optimal maintenance time, determine the optimal maintenance strategy of the power station, and calculate the optimal maintenance Maintenance costs and downtime saved by the strategy.
Claims (1)


Priority Applications (1)
| Application Number | Priority Date | Filing Date | Title |
|---|---|---|---|
| CN201810801842.5ACN110807531B (en) | 2018-07-20 | 2018-07-20 | Photovoltaic power station maintenance strategy based on element-system hierarchical optimization |
Applications Claiming Priority (1)
| Application Number | Priority Date | Filing Date | Title |
|---|---|---|---|
| CN201810801842.5ACN110807531B (en) | 2018-07-20 | 2018-07-20 | Photovoltaic power station maintenance strategy based on element-system hierarchical optimization |
Publications (2)
| Publication Number | Publication Date |
|---|---|
| CN110807531Atrue CN110807531A (en) | 2020-02-18 |
| CN110807531B CN110807531B (en) | 2022-11-18 |
Family
ID=69486687
Family Applications (1)
| Application Number | Title | Priority Date | Filing Date |
|---|---|---|---|
| CN201810801842.5AActiveCN110807531B (en) | 2018-07-20 | 2018-07-20 | Photovoltaic power station maintenance strategy based on element-system hierarchical optimization |
Country Status (1)
| Country | Link |
|---|---|
| CN (1) | CN110807531B (en) |
Cited By (2)
| Publication number | Priority date | Publication date | Assignee | Title |
|---|---|---|---|---|
| CN113887990A (en)* | 2021-10-15 | 2022-01-04 | 中国南方电网有限责任公司超高压输电公司柳州局 | Decision-making optimization method for electrical equipment maintenance |
| CN114065953A (en)* | 2020-07-31 | 2022-02-18 | 中国电力科学研究院有限公司 | A method and system for making decisions on operation and maintenance of photovoltaic power plants |
Citations (4)
| Publication number | Priority date | Publication date | Assignee | Title |
|---|---|---|---|---|
| US20150094967A1 (en)* | 2013-09-27 | 2015-04-02 | Hitachi, Ltd. | Failure diagnosis method and failure diagnosis system for photovoltaic system |
| CN106849151A (en)* | 2015-12-03 | 2017-06-13 | 甘肃省电力公司风电技术中心 | A kind of photovoltaic plant accesses power network point voltage flicker assessment detection method |
| CN107256448A (en)* | 2017-05-18 | 2017-10-17 | 东南大学 | One kind fusion photovoltaic plant component-level and system-level methods of risk assessment |
| CN108122049A (en)* | 2017-12-21 | 2018-06-05 | 郓城金河热电有限责任公司 | Photovoltaic array operation and maintenance method based on the analysis of photovoltaic module failure rate |
- 2018
- 2018-07-20CNCN201810801842.5Apatent/CN110807531B/enactiveActive
Patent Citations (4)
| Publication number | Priority date | Publication date | Assignee | Title |
|---|---|---|---|---|
| US20150094967A1 (en)* | 2013-09-27 | 2015-04-02 | Hitachi, Ltd. | Failure diagnosis method and failure diagnosis system for photovoltaic system |
| CN106849151A (en)* | 2015-12-03 | 2017-06-13 | 甘肃省电力公司风电技术中心 | A kind of photovoltaic plant accesses power network point voltage flicker assessment detection method |
| CN107256448A (en)* | 2017-05-18 | 2017-10-17 | 东南大学 | One kind fusion photovoltaic plant component-level and system-level methods of risk assessment |
| CN108122049A (en)* | 2017-12-21 | 2018-06-05 | 郓城金河热电有限责任公司 | Photovoltaic array operation and maintenance method based on the analysis of photovoltaic module failure rate |
Cited By (3)
| Publication number | Priority date | Publication date | Assignee | Title |
|---|---|---|---|---|
| CN114065953A (en)* | 2020-07-31 | 2022-02-18 | 中国电力科学研究院有限公司 | A method and system for making decisions on operation and maintenance of photovoltaic power plants |
| CN113887990A (en)* | 2021-10-15 | 2022-01-04 | 中国南方电网有限责任公司超高压输电公司柳州局 | Decision-making optimization method for electrical equipment maintenance |
| CN113887990B (en)* | 2021-10-15 | 2025-08-05 | 中国南方电网有限责任公司超高压输电公司柳州局 | Optimization method for electrical equipment maintenance decision-making |
Also Published As
| Publication number | Publication date |
|---|---|
| CN110807531B (en) | 2022-11-18 |
Similar Documents
| Publication | Publication Date | Title |
|---|---|---|
| Zhang et al. | Reliability analysis of power systems integrated with high-penetration of power converters | |
| CN110224393B (en) | New energy consumption assessment method based on minimum load shedding model | |
| Moradi-Shahrbabak et al. | Economical design of utility-scale photovoltaic power plants with optimum availability | |
| CN105356492A (en) | Energy management simulation system and method suitable for micro-grid | |
| CN113131515B (en) | Smart microgrid AI fault detection and network optimization and reconstruction system and method | |
| CN113657619B (en) | Identification of key elasticity improvement components and fault recovery methods considering fault cascading | |
| CN109934437B (en) | Power distribution network power outage risk assessment method and system | |
| CN109615125B (en) | Multi-region random production simulation method considering extra-high voltage peak regulation and application | |
| CN115293372A (en) | Fault diagnosis method for photovoltaic strings based on multi-dimensional and multi-parameter numerical analysis | |
| CN115719967B (en) | A method for optimizing the configuration of energy storage devices in active distribution networks for improving power supply reliability | |
| Wang et al. | A multi-objective approach to determine time series aggregation strategies for optimal design of multi-energy systems | |
| CN114329857A (en) | Distributed power supply planning method based on improved whale algorithm | |
| CN117937531A (en) | A method, system, device and medium for long-term capacity optimization of electric hydrogen reversible microgrid | |
| CN110807531B (en) | Photovoltaic power station maintenance strategy based on element-system hierarchical optimization | |
| CN110994697B (en) | Optimal operation control method and system of AC-DC distribution network with photovoltaic-storage complex | |
| Chen et al. | Reliability-based model for incomplete preventive replacement maintenance of photovoltaic power systems | |
| CN108448628A (en) | Method and system for optimal allocation of distributed renewable energy in AC/DC hybrid system | |
| Chen et al. | Opportunistic maintenance strategies for PV power systems considering the structural correlation | |
| CN114595929A (en) | Method, device and system for generating scenario of typical operation mode of power system | |
| CN119154309A (en) | Power distribution network elastic lifting and rush-repair personnel scheduling combined optimization scheduling method and system | |
| CN110768306B (en) | Power supply capacity configuration method for improving emergency capacity of micro-grid in bottom-protected power grid | |
| CN117791703A (en) | Active power distribution network fault recovery method based on graph calculation | |
| CN113972891B (en) | A photovoltaic power generation system | |
| Meenatchi et al. | AI Powered Renewable Load Sharing: A Sustainable Alternative to Fossil Fuel-Based System for Efficiency and Low Emissions | |
| Ali | Solar Energy Forecasting Techniques Based on Machine Learning: Survey |
Legal Events
| Date | Code | Title | Description |
|---|---|---|---|
| PB01 | Publication | ||
| PB01 | Publication | ||
| SE01 | Entry into force of request for substantive examination | ||
| SE01 | Entry into force of request for substantive examination | ||
| GR01 | Patent grant | ||
| GR01 | Patent grant |