CN110309985B - Method and system for forecasting crop yield - Google Patents
Method and system for forecasting crop yieldDownload PDFInfo
- Publication number
- CN110309985B CN110309985BCN201910618693.3ACN201910618693ACN110309985BCN 110309985 BCN110309985 BCN 110309985BCN 201910618693 ACN201910618693 ACN 201910618693ACN 110309985 BCN110309985 BCN 110309985B
- Authority
- CN
- China
- Prior art keywords
- yield
- model
- comprehensive
- evi
- data
- Prior art date
- Legal status (The legal status is an assumption and is not a legal conclusion. Google has not performed a legal analysis and makes no representation as to the accuracy of the status listed.)
- Active
Links
Images


Classifications
- G—PHYSICS
- G06—COMPUTING OR CALCULATING; COUNTING
- G06Q—INFORMATION AND COMMUNICATION TECHNOLOGY [ICT] SPECIALLY ADAPTED FOR ADMINISTRATIVE, COMMERCIAL, FINANCIAL, MANAGERIAL OR SUPERVISORY PURPOSES; SYSTEMS OR METHODS SPECIALLY ADAPTED FOR ADMINISTRATIVE, COMMERCIAL, FINANCIAL, MANAGERIAL OR SUPERVISORY PURPOSES, NOT OTHERWISE PROVIDED FOR
- G06Q10/00—Administration; Management
- G06Q10/04—Forecasting or optimisation specially adapted for administrative or management purposes, e.g. linear programming or "cutting stock problem"
- G—PHYSICS
- G06—COMPUTING OR CALCULATING; COUNTING
- G06Q—INFORMATION AND COMMUNICATION TECHNOLOGY [ICT] SPECIALLY ADAPTED FOR ADMINISTRATIVE, COMMERCIAL, FINANCIAL, MANAGERIAL OR SUPERVISORY PURPOSES; SYSTEMS OR METHODS SPECIALLY ADAPTED FOR ADMINISTRATIVE, COMMERCIAL, FINANCIAL, MANAGERIAL OR SUPERVISORY PURPOSES, NOT OTHERWISE PROVIDED FOR
- G06Q50/00—Information and communication technology [ICT] specially adapted for implementation of business processes of specific business sectors, e.g. utilities or tourism
- G06Q50/02—Agriculture; Fishing; Forestry; Mining
- Y—GENERAL TAGGING OF NEW TECHNOLOGICAL DEVELOPMENTS; GENERAL TAGGING OF CROSS-SECTIONAL TECHNOLOGIES SPANNING OVER SEVERAL SECTIONS OF THE IPC; TECHNICAL SUBJECTS COVERED BY FORMER USPC CROSS-REFERENCE ART COLLECTIONS [XRACs] AND DIGESTS
- Y02—TECHNOLOGIES OR APPLICATIONS FOR MITIGATION OR ADAPTATION AGAINST CLIMATE CHANGE
- Y02A—TECHNOLOGIES FOR ADAPTATION TO CLIMATE CHANGE
- Y02A90/00—Technologies having an indirect contribution to adaptation to climate change
- Y02A90/10—Information and communication technologies [ICT] supporting adaptation to climate change, e.g. for weather forecasting or climate simulation
Landscapes
- Business, Economics & Management (AREA)
- Engineering & Computer Science (AREA)
- Strategic Management (AREA)
- Human Resources & Organizations (AREA)
- Economics (AREA)
- Theoretical Computer Science (AREA)
- Marketing (AREA)
- General Physics & Mathematics (AREA)
- General Business, Economics & Management (AREA)
- Physics & Mathematics (AREA)
- Tourism & Hospitality (AREA)
- Animal Husbandry (AREA)
- Life Sciences & Earth Sciences (AREA)
- Agronomy & Crop Science (AREA)
- Mining & Mineral Resources (AREA)
- General Health & Medical Sciences (AREA)
- Marine Sciences & Fisheries (AREA)
- Health & Medical Sciences (AREA)
- Primary Health Care (AREA)
- Development Economics (AREA)
- Game Theory and Decision Science (AREA)
- Entrepreneurship & Innovation (AREA)
- Operations Research (AREA)
- Quality & Reliability (AREA)
- Management, Administration, Business Operations System, And Electronic Commerce (AREA)
Abstract
Translated fromChinese
Description
Translated fromChinese技术领域technical field
本发明涉及农作物管理领域,特别涉及一种农作物产量预测方法及系统。The invention relates to the field of crop management, in particular to a crop yield prediction method and system.
背景技术Background technique
小麦是世界三大主要粮食作物之一,其产量直接关系到各国的粮食安全,因此,对小麦生长环境、过程的监测、管理一直以来是各国学者关注的焦点问题,有效的产量估算则是各国政府决策管理、资源调控甚至粮食贸易的重要参考依据。Wheat is one of the three major food crops in the world, and its output is directly related to the food security of various countries. Therefore, the monitoring and management of the growing environment and process of wheat has always been the focus of scholars from all over the world. It is an important reference for government decision-making management, resource regulation and even grain trade.
目前,小麦的估产方式主要有农学估产、农业气象估产、遥感估产和混合估产四种方式。At present, wheat yield estimation methods mainly include agronomic yield estimation, agro-meteorological yield estimation, remote sensing yield estimation and mixed yield estimation.
农学估产是通过模拟不同作物品种生长过程中水分、土壤、气候等影响因子,构建作物生长的模拟模型,即作物模型,通过作物模型估算作物产量,常见的作物模型有WOFOST模型、CASA模型等。作物模型充分考虑了作物本身的生理特征和外界环境的胁迫因素,能够揭示作物生长过程和产量形成的复杂机理,是一种理想的估产模型,在实际研究中也能获得较好的估产结果。但是,由于作物模型的复杂性,在大面积、复杂生产环境的应用中,往往无法满足其对大量的调优参数的获取要求,使得该类模型难以全面推广应用。Agronomic yield estimation is to build a simulation model of crop growth by simulating the influence factors such as water, soil, and climate in the growth process of different crop varieties, that is, crop model, and estimate crop yield through crop model. Common crop models include WOFOST model, CASA model, etc. The crop model fully considers the physiological characteristics of the crop itself and the stress factors of the external environment, and can reveal the complex mechanism of the crop growth process and yield formation. It is an ideal yield estimation model and can also obtain better yield estimation results in practical research. However, due to the complexity of crop models, in the application of large-scale and complex production environments, it is often unable to meet the requirements for obtaining a large number of tuning parameters, making it difficult to fully popularize and apply this type of model.
农业气象估产主要是利用影响作物生长发育的气象数据与产量的统计关系,结合反映生产力变化的趋势产量构建气象估产模型进行估产,是典型的经验半经验模型。气象估产模型的本质是以趋势产量为基础,引入易于获取的气象数据构建。模型简单易用,数据可获取性强,已有研究表明其具有一定的估产精度,是目前气象、农业、保险等行业普遍采用的常规估产方式。然而,由于气象估产模型只考虑了气象因子对估产周期内作物产量的影响,却忽略人类活动、自然灾害等随机因素的影响,使得模型在异常年份的估产往往偏离实际产量较大。另外,也有研究表明气象要素仅能解释产量变化的1/3,甚至更少,因此需要引入额外的辅助信息来提高气象估产模型精度。Agricultural meteorological yield estimation is mainly based on the statistical relationship between meteorological data and yield that affect the growth and development of crops, combined with the trend yield reflecting productivity changes to construct a meteorological yield estimation model for yield estimation, which is a typical empirical semi-empirical model. The essence of the meteorological yield estimation model is based on the trend yield, and is constructed by introducing easy-to-obtain meteorological data. The model is simple and easy to use, and the data is highly available. Studies have shown that it has a certain yield estimation accuracy, and is currently a conventional yield estimation method commonly used in meteorology, agriculture, insurance and other industries. However, because the meteorological yield estimation model only considers the impact of meteorological factors on crop yield during the yield estimation period, but ignores the influence of random factors such as human activities and natural disasters, so that the estimated yield of the model in abnormal years often deviates greatly from the actual yield. In addition, some studies have shown that meteorological factors can only explain 1/3 of the yield change, or even less, so additional auxiliary information needs to be introduced to improve the accuracy of the meteorological yield estimation model.
遥感估产则是利用现代空间信息技术中高时空尺度的对地探测能力,以遥感反演的反映作物长势状态的植被指数与产量之间的统计关系,建立遥感植被指数模型实现产量估算。由于遥感反演的作物植被指数能够反映作物在各种环境下的生长状态,且具有覆盖范围广、周期性强等特点,植被指数获取及模型的实现过程也较为简单,因此,在大范围作物估产中得到了广泛应用。但是,因为遥感对地观测能力本身的缺陷,使得遥感估产存在局限,即当遥感反演的植被指数无法进一步反应作物的生长状态时,模型的估产能力就会下降。例如,周磊、Wang Quan的研究表明,当作物叶面积指数(LAI)达到4.0时,其归一化植被指数(NDVI)出现饱和,基于NDVI的估产模型就无法进一步反映植被的生长状况。此外遥感数据的不确定性也使模型不稳定,例如,云、云阴影、噪声以及遥感数据的滞后性等使得遥感数据不能准确反映作物的真实生长状态,影响估产精度。Remote sensing yield estimation is to establish a remote sensing vegetation index model to achieve yield estimation based on the statistical relationship between the vegetation index and yield, which reflects the growing state of crops, based on the high spatial and temporal scale of ground detection capabilities of modern spatial information technology. Since the crop vegetation index retrieved by remote sensing can reflect the growth state of crops in various environments, and has the characteristics of wide coverage and strong periodicity, the process of obtaining the vegetation index and realizing the model is also relatively simple. It has been widely used in production estimation. However, due to the shortcomings of the remote sensing capability of earth observation itself, the remote sensing yield estimation has limitations, that is, when the vegetation index retrieved by remote sensing cannot further reflect the growth status of crops, the model's yield estimation capability will decline. For example, the research of Zhou Lei and Wang Quan shows that when the leaf area index (LAI) of crops reaches 4.0, its normalized vegetation index (NDVI) is saturated, and the yield estimation model based on NDVI cannot further reflect the growth status of vegetation. In addition, the uncertainty of remote sensing data also makes the model unstable. For example, clouds, cloud shadows, noise, and the hysteresis of remote sensing data make remote sensing data unable to accurately reflect the true growth state of crops, which affects the accuracy of yield estimation.
综上所述,农学估产模型因其苛刻的应用条件而难以推广,气象估产模型、遥感估产模型因为在精度和稳定性上存在较大的不确定性而难以常规应用,而已有研究表明,在应用气象估产时,引入遥感反演的光谱信息来补充气象要素提供信息的不足可提高估产的精度。因此,近年来,使用多种数据、多种模型相耦合的方法构建估产模型成为热点。例如,王恺宁等组合冬小麦灌浆期四种不同植被指数建立模型,弥补单植被指数的缺陷以提高遥感估产的精度。Umer Saeed等使用随机森林方法结合气象数据、MODIS NDVI数据建立巴基斯坦Punjab省冬小麦预测模型。Manjunath、李付琴等[33]把遥感光谱信息和气象条件结合建立统一的模型,比单纯的遥感模型和气象模型都要优越,说明外界环境对产量的影响很大,在进行遥感估产时不能忽视气象条件的影响。这些模型简单易行,也取得较好的结果,却忽略了历史趋势对产量的影响,且气象因子仅选取几个相关性较高的时期,无法全面反映冬小麦全生育期内气象要素的变化对产量的影响。To sum up, the agricultural yield estimation model is difficult to promote due to its harsh application conditions, and the meteorological yield estimation model and the remote sensing yield estimation model are difficult to be routinely applied due to the large uncertainty in accuracy and stability. When applying meteorological yield estimation, introducing spectral information retrieved from remote sensing to supplement the lack of information provided by meteorological elements can improve yield estimation accuracy. Therefore, in recent years, the use of multiple data and multiple model coupling methods to construct production estimation models has become a hot topic. For example, Wang Kaining et al. established a model by combining four different vegetation indices during the grain filling period of winter wheat to make up for the defects of a single vegetation index to improve the accuracy of remote sensing yield estimation. Umer Saeed et al. used the random forest method combined with meteorological data and MODIS NDVI data to establish a winter wheat prediction model in Punjab province, Pakistan. Manjunath, Li Fuqin et al.[33] combined remote sensing spectral information and meteorological conditions to establish a unified model, which is superior to the simple remote sensing model and meteorological model, indicating that the external environment has a great impact on yield, and meteorology cannot be ignored when remote sensing yield estimation. the effect of conditions. These models are simple and easy to implement and achieve good results, but they ignore the impact of historical trends on yield, and meteorological factors only select a few periods with high correlation, which cannot fully reflect the impact of changes in meteorological factors during the whole growth period of winter wheat on the yield. impact on yield.
发明内容SUMMARY OF THE INVENTION
本发明的目的是提供一种农作物产量预测方法及系统,以从更全面的角度实现冬小麦全生育期内的产量估算,提高冬小麦的估产精度;本发明的预测系统和方法不仅限于对冬小麦的产量的预测,还可以实现其它农作物产量的预测。The object of the present invention is to provide a crop yield prediction method and system, so as to realize the yield estimation during the whole growth period of winter wheat from a more comprehensive perspective, and improve the yield estimation accuracy of winter wheat; the prediction system and method of the present invention are not limited to the output of winter wheat. Prediction of other crops can also be achieved.
为实现上述目的,本发明提供了如下方案:For achieving the above object, the present invention provides the following scheme:
本发明提供一种农作物产量预测方法,所述预测方法包括如下步骤:The present invention provides a crop yield prediction method, which comprises the following steps:
建立基于趋势产量模型、综合气候指数模型和生长关键期EVI指数的包含未知系数的综合估产模型;Establish a comprehensive yield estimation model with unknown coefficients based on the trend yield model, the comprehensive climate index model and the EVI index of the critical growth period;
获取估产区域的历史数据,所述历史数据包括作物历史产量数据、作物历史空间分布数据、作物历史EVI数据和历史气象数据;Obtain historical data of the estimated yield area, the historical data includes historical crop yield data, historical crop spatial distribution data, historical crop EVI data and historical meteorological data;
利用所述历史数据求解包含未知系数的综合估产模型中的未知系数,得到综合估产模型;Use the historical data to solve the unknown coefficients in the comprehensive production estimation model including the unknown coefficients, and obtain the comprehensive production estimation model;
获取目标估产年份的气象数据和EVI数据;Obtain meteorological data and EVI data for the target estimated yield year;
将所述气象数据、所述EVI数据输入所述综合估产模型,预测目标估产年份的产量。The meteorological data and the EVI data are input into the comprehensive yield estimation model to predict the yield in the target estimated yield year.
可选的,所述建立基于趋势产量模型、综合气候指数模型和生长关键期EVI指数的包含未知系数的综合估产模型,具体包括:Optionally, the establishment of a comprehensive yield estimation model containing unknown coefficients based on a trend yield model, a comprehensive climate index model and an EVI index of a critical growth period, specifically includes:
建立趋势产量模型;Build trend yield models;
建立综合气候指数模型;Build a comprehensive climate index model;
根据所述趋势产量模型和所述综合气候指数模型,建立基于趋势产量模型、综合气候指数模型和生长关键期EVI指数的包含未知系数的综合估产模型。According to the trend yield model and the comprehensive climate index model, a comprehensive yield estimation model including unknown coefficients based on the trend yield model, the comprehensive climate index model and the growth critical period EVI index is established.
可选的,所述建立趋势产量模型,具体包括:Optionally, the establishment of a trend yield model specifically includes:
构建表示年份X与年份X对应的趋势产量Yt关系的三次多项式:Yt=α*X3+β*X2+γ*X+φ,其中,α为三次项系数、β为二次项系数、γ为一次项系数和φ为常数项;Construct a cubic polynomial representing the relationship between year X and the trend yield Yt corresponding to year X: Yt =α*X3 +β*X2 +γ*X+φ, where α is the cubic coefficient and β is the quadratic term coefficient, γ is a linear term coefficient and φ is a constant term;
根据所述作物历史产量数据采用滑动平均法获得历史年份对应的历史趋势产量数据;According to the historical crop yield data, the historical trend yield data corresponding to the historical year is obtained by adopting the moving average method;
根据历史年份对应的历史趋势产量数据,求解所述三次多项式中的三次项系数α、二次项系数β、一次项系数γ和常数项φ,得到趋势产量模型。According to the historical trend yield data corresponding to the historical years, solve the cubic term coefficient α, quadratic term coefficient β, linear term coefficient γ and constant term φ in the cubic polynomial to obtain a trend yield model.
可选的,所述建立综合气候指数模型,具体包括:Optionally, the establishment of a comprehensive climate index model specifically includes:
建立农作物的综合气候指数模型:
其中,M表示农作物的综合气候指数,n表示生育期数;F(ci)表示第i个生育期的综合气候指数,F(ci)=wp*F(pi)+wt*F(ti)+ws*F(si),其中,wp,wt,ws分别是降水、温度、日照适宜度指数的权重系数;F(pi),F(ti),F(si)分别为第i个生育期降水、温度、日照适宜度指数;wi表示第i个生育期的权重系数,
可选的,所述根据所述趋势产量模型和所述综合气候指数模型,建立基于趋势产量模型、综合气候指数模型和生长关键期EVI指数的包含未知系数的综合估产模型,具体包括:Optionally, according to the trend yield model and the comprehensive climate index model, establish a comprehensive yield estimation model containing unknown coefficients based on the trend yield model, the comprehensive climate index model and the growth critical period EVI index, specifically including:
根据所述趋势产量模型和所述综合气候指数模型,建立基于趋势产量模型、综合气候指数模型和生长关键期EVI指数的包含未知系数的综合估产模型:Y=f(Yt,M,EVIm)=aYt+bM+cEVIm+d,Y为估测单产;Yt为趋势产量;M为综合气候指数;EVIm为生长关键期EVI指数;a,b,c和d分别为第一系数项、第二系数项、第三系数项和第四系数项。According to the trend yield model and the comprehensive climate index model, a comprehensive yield estimation model containing unknown coefficients based on the trend yield model, the comprehensive climate index model and the EVI index of the critical growth period is established: Y=f(Yt ,M,EVIm )=aYt +bM+cEVIm +d, Y is the estimated yield; Yt is the trend yield; M is the comprehensive climate index; EVIm is the EVI index in the critical growth period; a, b, c and d are the first coefficient term, second coefficient term, third coefficient term, and fourth coefficient term.
一种农作物产量预测系统,所述预测系统包括:A crop yield forecasting system, the forecasting system comprising:
包含未知系数的综合估产模型建立模块,用于建立趋势产量模型、综合气候指数模型和生长关键期EVI指数的包含未知系数的综合估产模型;A comprehensive yield estimation model building module including unknown coefficients is used to build a trend yield model, a comprehensive climate index model and a comprehensive yield estimation model with unknown coefficients for the EVI index in the critical growth period;
历史数据获取模块,用于获取估产区域的历史数据,所述历史数据包括作物历史产量数据、作物历史空间分布数据、作物历史EVI数据和历史气象数据;The historical data acquisition module is used to acquire historical data of the estimated yield area, and the historical data includes historical crop yield data, historical crop spatial distribution data, historical crop EVI data and historical meteorological data;
未知系数求解模块,用于利用所述历史数据求解包含未知系数的综合估产模型中的未知系数,得到综合估产模型;The unknown coefficient solving module is used to solve the unknown coefficients in the comprehensive production estimation model including the unknown coefficients by using the historical data to obtain the comprehensive production estimation model;
目标估产年份数据获取模块,用于获取目标估产年份的气象数据和EVI数据;The data acquisition module of the target production year is used to obtain the meteorological data and EVI data of the target production year;
产量预测模块,用于将所述气象数据、所述EVI数据输入所述综合估产模型,预测目标估产年份的产量。The output forecasting module is used for inputting the meteorological data and the EVI data into the comprehensive production estimation model to predict the production in the target estimated production year.
可选的,所述包含未知系数的综合估产模型建立模块包括:Optionally, the comprehensive production estimation model building module including unknown coefficients includes:
趋势产量模型建立子模块,用于建立趋势产量模型;The trend production model establishment sub-module is used to establish the trend production model;
综合气候指数模型建立子模块,用于建立综合气候指数模型;A sub-module for building a comprehensive climate index model, which is used to build a comprehensive climate index model;
包含未知系数的综合估产模型建立子模块,用于根据所述趋势产量模型和所述综合气候指数模型,建立基于趋势产量模型、综合气候指数模型和生长关键期EVI指数的包含未知系数的综合估产模型。A sub-module for establishing a comprehensive yield estimation model containing unknown coefficients, for establishing a comprehensive yield estimation model containing unknown coefficients based on the trend yield model, the comprehensive climate index model and the EVI index of the critical growth period according to the trend yield model and the comprehensive climate index model Model.
可选的,所述趋势产量模型建立子模块,具体包括:Optionally, the trend yield model establishment sub-module specifically includes:
三次多项式构建单元,用于构建表示年份X与年份X对应的趋势产量Yt关系的三次多项式:Yt=α*X3+β*X2+γ*X+φ,其中,α为三次项系数、β为二次项系数、γ为一次项系数和φ为常数项;The cubic polynomial building unit is used to construct a cubic polynomial representing the relationship between year X and the trend yield Yt corresponding to year X: Yt =α*X3 +β*X2 +γ*X+φ, where α is the cubic term coefficient, β is a quadratic term coefficient, γ is a linear term coefficient and φ is a constant term;
历史产量数据分析单元,用于根据所述作物历史产量数据采用滑动平均法获得历史年份对应的历史趋势产量数据;A historical yield data analysis unit, used for obtaining historical trend yield data corresponding to historical years by adopting a moving average method according to the historical crop yield data;
三次多项式系数求解单元,用于根据历史年份对应的历史趋势产量数据,求解所述三次多项式中的三次项系数α、二次项系数β、一次项系数γ和常数项φ,得到趋势产量模型。The cubic polynomial coefficient solving unit is used for solving the cubic term coefficient α, quadratic term coefficient β, linear term coefficient γ and constant term φ in the cubic polynomial according to the historical trend yield data corresponding to the historical years to obtain the trend yield model.
可选的,所述综合气候指数模型建立子模块,具体包括:Optionally, the comprehensive climate index model establishment sub-module specifically includes:
综合气候指数模型建立单元,用于建立农作物的综合气候指数模型:
其中,M表示农作物的综合气候指数,n表示生育期数;F(ci)表示第i个生育期的综合气候指数,F(ci)=wp*F(pi)+wt*F(ti)+ws*F(si),其中,wp,wt,ws分别是降水、温度、日照适宜度指数的权重系数;F(pi),F(ti),F(si)分别为第i个生育期降水、温度、日照适宜度指数;wi表示第i个生育期的权重系数,
可选的,所述包含未知系数的综合估产模型建立子模块,具体包括:Optionally, the sub-module for establishing a comprehensive yield estimation model including unknown coefficients specifically includes:
包含未知系数的综合估产模型建立单元,用于根据所述趋势产量模型和所述综合气候指数模型,建立基于趋势产量模型、综合气候指数模型和生长关键期EVI指数的包含未知系数的综合估产模型:Y=f(Yt,M,EVIm)=aYt+bM+cEVIm+d,Y为估测单产;Yt为趋势产量;M为气候指数;EVIm为生长关键期EVI指数;a,b,c和d分别为第一系数项、第二系数项、第三系数项和第四系数项。A comprehensive yield estimation model establishment unit including unknown coefficients, used for establishing a comprehensive yield estimation model including unknown coefficients based on the trend yield model, the comprehensive climate index model and the EVI index of the critical growth period according to the trend yield model and the comprehensive climate index model : Y=f(Yt ,M,EVIm )=aYt +bM+cEVIm +d, Y is the estimated yield; Yt is the trend yield; M is the climate index; EVIm is the EVI index of the critical growth period; a, b, c and d are the first coefficient term, the second coefficient term, the third coefficient term and the fourth coefficient term, respectively.
根据本发明提供的具体实施例,本发明公开了以下技术效果:According to the specific embodiments provided by the present invention, the present invention discloses the following technical effects:
本发明提供一种农作物产量预测方法,所述预测方法,首先,建立了基于趋势产量模型、综合气候指数模型和生长关键期EVI的包含未知系数的综合估产模型,然后利用所述历史数据求解包含未知系数的综合估产模型中的未知系数,得到综合估产模型;最后,获取目标估产年份的气象数据和EVI数据,并将所述气象数据、所述EVI数据输入所述综合估产模型,预测目标估产年份的产量。本发明构建了基于趋势产量模型、综合气候指数模型和生长关键期EVI指数的综合估产模型,以从更全面的角度实现冬小麦全生育期内的产量估算,提高冬小麦的估产精度,为行业部门进行冬小麦产量的业务化估算提供一种新的、简单易行的参考方案。The present invention provides a method for predicting crop yield. For the prediction method, first, a comprehensive yield estimation model including unknown coefficients based on a trend yield model, a comprehensive climate index model and an EVI in a critical growth period is established, and then the historical data is used to solve the The unknown coefficients in the comprehensive production estimation model of the unknown coefficients are used to obtain a comprehensive production estimation model; finally, the meteorological data and EVI data of the target production year are obtained, and the meteorological data and the EVI data are input into the comprehensive production estimation model to predict the target production estimation. year's output. The present invention constructs a comprehensive yield estimation model based on a trend yield model, a comprehensive climate index model and an EVI index in a critical growth period, so as to realize the yield estimation of winter wheat in the whole growth period from a more comprehensive perspective, improve the yield estimation accuracy of winter wheat, and carry out the estimation for the industry sector. Operational estimation of winter wheat yield provides a new and easy reference scheme.
附图说明Description of drawings
为了更清楚地说明本发明实施例或现有技术中的技术方案,下面将对实施例中所需要使用的附图作简单地介绍,显而易见地,下面描述中的附图仅仅是本发明的一些实施例,对于本领域普通技术人员来讲,在不付出创造性劳动性的前提下,还可以根据这些附图获得其他的附图。In order to more clearly illustrate the embodiments of the present invention or the technical solutions in the prior art, the accompanying drawings required in the embodiments will be briefly introduced below. Obviously, the drawings in the following description are only some of the present invention. In the embodiments, for those of ordinary skill in the art, other drawings can also be obtained according to these drawings without creative labor.
图1为本发明提供的农作物产量预测方法的流程图;Fig. 1 is the flow chart of the crop yield prediction method provided by the invention;
图2为本发明提供的求解包含未知系数的综合估产模型中的未知系数的原理图;2 is a schematic diagram of solving the unknown coefficients in the comprehensive production estimation model comprising the unknown coefficients provided by the present invention;
图3为本发明提供的农作物产量预测系统的结构图;Fig. 3 is the structural diagram of the crop yield prediction system provided by the present invention;
图4为本发明提供的实验研究区(估产区)的概况图;Fig. 4 is the general map of the experimental research area (estimated production area) provided by the present invention;
图5为本发明提供的不同模型的的预测结果对比图;Fig. 5 is the prediction result comparison diagram of different models provided by the present invention;
图6为本发明提供的不同模型的拟合精度对比图;Fig. 6 is the fitting precision comparison diagram of different models provided by the present invention;
图7为本发明提供的波动产量异常值分布图;Fig. 7 is the abnormal value distribution diagram of fluctuating yield provided by the present invention;
图8为本发明提供的不同模型的异常年份预测结果对比图。FIG. 8 is a comparison diagram of the abnormal year prediction results of different models provided by the present invention.
具体实施方式Detailed ways
本发明的目的是提供一种农作物产量预测方法及系统,以从更全面的角度实现冬小麦全生育期内的产量估算,提高冬小麦的估产精度。The purpose of the present invention is to provide a crop yield prediction method and system, so as to realize the yield estimation during the whole growth period of winter wheat from a more comprehensive perspective, and improve the yield estimation accuracy of winter wheat.
为使本发明的上述目的、特征和优点能够更加明显易懂,下面结合附图和具体实施方式对发明作进一步详细的说明。In order to make the above objects, features and advantages of the present invention more clearly understood, the invention will be described in further detail below with reference to the accompanying drawings and specific embodiments.
本研究考虑作物最终产量受气候条件、土壤属性、作物种子遗传、田间管理以及政策导向因素等多方面综合影响,使用相对简单的统计方法,综合考虑社会因素、自然因素与冬小麦产量的关系,以趋势模型结果作为产量变化基础,引入气候指数和遥感反演的增强型植被指数(Enhanced Vegetation Index,EVI)分别反映气候变化和环境综合变化对产量造成的胁迫,构建由趋势产量、气候指数以及EVI耦合的估产模型,以期从更全面的角度实现冬小麦全生育期内的产量估算,提高冬小麦的估产精度,为行业部门进行冬小麦产量的业务化估算提供一种新的、简单易行的参考方案,具体包括:This study considers that the final crop yield is affected by climatic conditions, soil properties, crop seed genetics, field management, and policy-oriented factors, and uses a relatively simple statistical method to comprehensively consider the relationship between social factors, natural factors and winter wheat yield. The trend model results are used as the basis for yield changes, and the climate index and the enhanced vegetation index (EVI) retrieved from remote sensing are introduced to reflect the stress on yield caused by climate change and comprehensive environmental changes, respectively. The coupled yield estimation model aims to realize the yield estimation of winter wheat in the whole growth period from a more comprehensive perspective, improve the estimation accuracy of winter wheat yield, and provide a new, simple and feasible reference scheme for the industrial sector to conduct operational estimation of winter wheat yield. Specifically include:
如图1所示本发明提供一种农作物产量预测方法,所述预测方法包括如下步骤:As shown in Figure 1, the present invention provides a method for predicting crop yield, and the method for predicting comprises the following steps:
步骤101,建立基于趋势产量模型、综合气候指数模型和生长关键期EVI指数的包含未知系数的综合估产模型;
具体包括:Specifically include:
建立趋势产量模型;构建表示年份X与年份X对应的趋势产量Yt关系的三次多项式:Yt=α*X3+β*X2+γ*X+φ,其中,α为三次项系数、β为二次项系数、γ为一次项系数和φ为常数项;根据所述作物历史产量数据采用滑动平均法获得历史年份对应的历史趋势产量数据;根据历史年份对应的历史趋势产量数据,求解所述三次多项式中的三次项系数α、二次项系数β、一次项系数γ和常数项φ,得到趋势产量模型。Build a trend yield model; build a cubic polynomial representing the relationship between year X and the trend yield Yt corresponding to year X: Yt =α*X3 +β*X2 +γ*X+φ, where α is the cubic term coefficient, β is a quadratic term coefficient, γ is a linear term coefficient and φ is a constant term; according to the historical crop yield data, the historical trend yield data corresponding to the historical year is obtained by using the moving average method; according to the historical trend yield data corresponding to the historical year, solve The cubic term coefficient α, the quadratic term coefficient β, the linear term coefficient γ and the constant term φ in the cubic polynomial are used to obtain a trend yield model.
建立综合气候指数模型:建立农作物的综合气候指数模型:

建立包含未知系数的综合估产模型:根据所述趋势产量模型、综合气候指数模型和生长关键期EVI,建立包含未知系数的综合估产模型:Y=f(Yt,M,EVIm)=aYt+bM+cEVIm+d,Y为估测单产;Yt为趋势产量;M为综合气候指数;EVIm为生长关键期EVI;a,b,c和d分别为第一系数项、第二系数项、第三系数项和第四系数项。Establish a comprehensive yield estimation model including unknown coefficients: According to the trend yield model, the comprehensive climate index model and the growth critical period EVI, establish a comprehensive yield estimation model with unknown coefficients: Y=f(Yt ,M,EVIm )=aYt +bM+cEVIm +d, Y is the estimated yield; Yt is the trend yield; M is the comprehensive climate index; EVIm is the EVI in the critical growth period; a, b, c and d are the first coefficient term, the second coefficient term, third coefficient term and fourth coefficient term.
步骤102,获取估产区域的历史数据,所述历史数据包括作物历史产量数据、作物历史空间分布数据、作物历史EVI数据和历史气象数据;
步骤103,利用所述历史数据求解包含未知系数的综合估产模型中的未知系数,得到综合估产模型。
以冬小麦为例,如图2所示,具体包括:Taking winter wheat as an example, as shown in Figure 2, it includes:
1)根据作物历史产量数据,确定包含未知系数的综合估产模型的趋势产量模型的值。1) According to the crop historical yield data, determine the value of the trend yield model including the comprehensive yield estimation model with unknown coefficients.
2)利用公式Yf=Y-Yt,将趋势产量模型输出的历史趋势产量Yt与历史实际产量的差,作为历史波动产量Yf;2) Using the formula Yf =YYt , the difference between the historical trend yield Yt output by the trend yield model and the historical actual yield is taken as the historical fluctuating yield Yf ;
根据历史年份的历史气象数据确定每个生育期的综合气候指数:F(ci)=wp*F(pi)+wt*F(ti)+ws*F(si),According to the historical meteorological data of historical years, the comprehensive climate index of each growth period is determined: F(ci )=wp *F(pi )+wt *F(ti )+ws *F(s i),
其中,
式中:F(pi)为i生育期降水适宜度,pi为i生育期内总降水量,pai为相应生育期内多年降水量平均值。In the formula: F(pi) is the suitability of precipitation in the growth periodi , pi is the total precipitation in the growth periodi, and p aiis the average precipitation in the corresponding growth period for many years.


式中:j为日序;F(tij)为第i个生长期的第j日温度适宜度;tj为第j日的日平均温度;til,tih,tio为冬小麦第i个生长发育所需要的最低、最高和最适温度,其值见表1。当温度适宜度计算值为负值时,则赋值为0,Ji表示第i个生长期的天数。In the formula: j is the day sequence; F(tij ) is the temperature suitability on the jth day of the ith growing period;tj is the daily average temperature on the jth day; til , tih , tio are the ith winter wheat The minimum, maximum and optimum temperatures required for individual growth and development are shown in Table 1. When the calculated value of temperature suitability is negative, it is assigned as 0, and Ji represents the number of days in the ith growing period.

式中F(si)为i生育期日照适宜度,si为i生育期内总日照时数,S为i生育期内总日照时数的多年平均值。In the formula, F(si ) is the sunshine suitability of the i growth period, si is the total sunshine hours in the i growth period, and S is the multi-year average of the total sunshine hours in the i growth period.
表1冬小麦各生育期最低tl、最高th、最适温度to(单位摄氏度/℃)Table 1 The lowest tl , the highest thh , and the optimal temperature to in each growth period of winter wheat (unit degrees Celsius/℃)


根据冬小麦发育阶段内各生长期的综合气候指数与波动产量之间的相关系数来确定各生育期综合气候指数的权重系数,
将每个生育期的综合气候指数和各生育期综合气候指数的权重系数,代入包含未知系数的综合估产模型的综合气候指数模型,计算综合气候指数值。The comprehensive climate index of each growth period and the weight coefficient of the comprehensive climate index of each growth period are substituted into the comprehensive climate index model of the comprehensive yield estimation model containing unknown coefficients, and the comprehensive climate index value is calculated.
3)首先基于历史冬小麦空间分布数据、作物历史EVI数据提取估产区冬小麦各生长期的EVI指数,并取得其空间均值:

其次通过相关性分析选用估产区与最终产量相关性最高时期的EVI均值作为生长关键期EVI指数。Secondly, through the correlation analysis, the EVI average value of the period with the highest correlation between the estimated production area and the final yield was selected as the EVI index in the critical period of growth.
4)并将作物历史产量数据代入包含未知系数的综合估产模型的综合气候指数模型。4) Substitute the crop historical yield data into a comprehensive climate index model that includes a comprehensive yield estimation model with unknown coefficients.
获得多组历史数据,采用步骤1)-4)方式建立方程组,通过求解方程组求解系数。Obtain multiple sets of historical data, use steps 1)-4) to establish equations, and solve the coefficients by solving the equations.
步骤104,获取目标估产年份的气象数据和EVI数据;
步骤105,将所述气象数据、所述EVI数据输入所述综合估产模型,预测目标估产年份的产量。Step 105: Input the meteorological data and the EVI data into the comprehensive yield estimation model to predict the yield in the target estimated yield year.
如图3所示,本发明还提供了一种农作物产量预测系统,所述预测系统包括:As shown in Figure 3, the present invention also provides a crop yield prediction system, the prediction system includes:
包含未知系数的综合估产模型建立模块301,用于建立基于趋势产量模型、综合气候指数模型和生长关键期EVI指数的包含未知系数的综合估产模型;A comprehensive yield estimation
历史数据获取模块302,用于获取估产区域的历史数据,所述历史数据包括作物历史产量数据、作物历史空间分布数据、作物历史EVI数据和历史气象数据;The historical
未知系数求解模块303,用于利用所述历史数据求解包含未知系数的综合估产模型中的未知系数,得到综合估产模型;The unknown
目标估产年份数据获取模块304,用于获取目标估产年份的气象数据和EVI数据;the target estimated yield year
产量预测模块305,用于将所述气象数据、所述EVI数据输入所述综合估产模型,预测目标估产年份的产量。The
所述包含未知系数的综合估产模型建立模块301包括:The comprehensive production estimation
趋势产量模型建立子模块,用于建立趋势产量模型;The trend production model establishment sub-module is used to establish the trend production model;
综合气候指数模型建立子模块,用于建立综合气候指数模型;A sub-module for building a comprehensive climate index model, which is used to build a comprehensive climate index model;
包含未知系数的综合估产模型建立子模块,用于根据所述趋势产量模型和所述综合气候指数模型,建立基于趋势产量模型、综合气候指数模型和生长关键期EVI指数的包含未知系数的综合估产模型。A sub-module for establishing a comprehensive yield estimation model containing unknown coefficients, for establishing a comprehensive yield estimation model containing unknown coefficients based on the trend yield model, the comprehensive climate index model and the EVI index of the critical growth period according to the trend yield model and the comprehensive climate index model Model.
其中,所述趋势产量模型建立子模块,具体包括:三次多项式构建单元,用于构建表示年份X与年份X对应的趋势产量Yt关系的三次多项式:Yt=α*X3+β*X2+γ*X+φ,其中,α为三次项系数、β为二次项系数、γ为一次项系数和φ为常数项;历史产量数据分析单元,用于根据所述作物历史产量数据采用滑动平均法获得历史年份对应的历史趋势产量数据;三次多项式系数求解单元,用于根据历史年份对应的历史趋势产量数据,求解所述三次多项式中的三次项系数α、二次项系数β、一次项系数γ和常数项φ,得到趋势产量模型。Wherein, the trend yield model establishment sub-module specifically includes: a cubic polynomial building unit for constructing a cubic polynomial representing the relationship between the year X and the trend yield Yt corresponding to the year X: Yt =α*X3 +β*X2 +γ*X+φ, where α is a cubic term coefficient, β is a quadratic term coefficient, γ is a linear term coefficient, and φ is a constant term; The moving average method obtains the historical trend yield data corresponding to the historical year; the cubic polynomial coefficient solving unit is used to solve the cubic term coefficient α, quadratic term coefficient β, primary term yield data in the cubic polynomial according to the historical trend yield data corresponding to the historical year term coefficient γ and constant term φ, the trend yield model is obtained.
所述综合气候指数模型建立子模块,具体包括:综合气候指数模型建立单元,用于建立农作物的综合气候指数模型:

所述包含未知系数的综合估产模型建立子模块,具体包括:包含未知系数的综合估产模型建立单元,用于根据所述趋势产量模型和所述综合气候指数模型,建立基于趋势产量模型、综合气候指数模型和生长关键期EVI指数的包含未知系数的综合估产模型:Y=f(Yt,M,EVIm)=aYt+bM+cEVIm+d,Y为估测单产;Yt为趋势产量模型;M为气候指数模型;EVIm为生长关键期EVI指数;a,b,c和d分别为第一系数项、第二系数项、第三系数项和第四系数项。The sub-module for establishing a comprehensive yield estimation model including unknown coefficients specifically includes: a unit for establishing a comprehensive yield estimation model including unknown coefficients, which is used to establish a trend yield model based on the trend yield model and the comprehensive climate index model according to the trend yield model and the comprehensive climate index model. The exponential model and the comprehensive yield estimation model of the EVI index in the critical growth period including unknown coefficients: Y=f(Yt ,M,EVIm )=aYt +bM+cEVIm +d, Y is the estimated yield; Yt is the trend yield model; M is the climate index model; EVIm is the EVI index of the critical growth period; a, b, c and d are the first coefficient term, the second coefficient term, the third coefficient term and the fourth coefficient term, respectively.
为了验证本发明的预测方法及系统的有效性,本发明还提供了一种验证方法。In order to verify the validity of the prediction method and system of the present invention, the present invention also provides a verification method.
所示本发明选取中国河北省11个县作为验证研究区(目标估产区)。如图4所示,河北省(113.85E-119.81E,36.1N-42.58N),位于太行山东侧、华北平原北部,有坝上高原、燕山和太行山山地和河北平原三大地貌,地形复杂多样,属于温带大陆性季风气候,是中国北方适宜冬小麦生长的主产区,其物候期一般在10月中上旬至次年6月中下旬,主要发育期如表2所示。11个县的冬小麦种植环境如表3所示,本发明选取的11个县代表不同地形、不同管理水平下冬小麦的生长发育状况且气象观测条件较好以确保气象数据的准确性。In the present invention shown, 11 counties in Hebei Province, China were selected as verification research areas (target estimated production areas). As shown in Figure 4, Hebei Province (113.85E-119.81E, 36.1N-42.58N) is located on the east side of Taihang Mountain and in the northern part of the North China Plain. , belongs to the temperate continental monsoon climate, and is the main producing area suitable for winter wheat growth in northern China. The planting environment of winter wheat in 11 counties is shown in Table 3. The 11 counties selected in the present invention represent the growth and development status of winter wheat under different terrains and different management levels, and the meteorological observation conditions are better to ensure the accuracy of meteorological data.
表2冬小麦发育期Table 2 Development period of winter wheat
表3研究区冬小麦种植环境Table 3 Winter wheat planting environment in the study area

本发明所使用数据如表2所示,遥感数据为2001年至2016年16年冬小麦生育期内16天合成的MOD13Q1 EVI产品数据,空间分辨率为250m,并对EVI进行SG滤波处理,以消除云、气溶胶等噪声的影响。并基于冬小麦空间分布数据提取出对应的EVI,筛选出EVI纯净像元。The data used in the present invention is shown in Table 2. The remote sensing data is the MOD13Q1 EVI product data synthesized in 16 days during the 16-year winter wheat growth period from 2001 to 2016, and the spatial resolution is 250m. The influence of noise such as clouds and aerosols. And based on the spatial distribution data of winter wheat, the corresponding EVI was extracted, and the EVI pure pixels were screened.
气象数据从气象数据共享中心获取,包括2001年至2016年11个气象站点,如图4所示,冬小麦生育期内的最高温度、最低温度、平均温度、降水量、以及日照时数。Meteorological data were obtained from the Meteorological Data Sharing Center, including 11 meteorological stations from 2001 to 2016. As shown in Figure 4, the maximum temperature, minimum temperature, average temperature, precipitation, and sunshine hours during the winter wheat growing period.
产量数据为河北省统计年鉴2001年至2016年县级产量数据,包括种植面积和产量,通过种植面积和县级总产计算各县的单位产量(kg/ha)如表4所示。The yield data is the county-level yield data of Hebei Statistical Yearbook from 2001 to 2016, including planting area and yield. The unit yield (kg/ha) of each county is calculated based on planting area and county-level total output, as shown in Table 4.
表4统计单产(kg/ha)Table 4 Statistical Yield (kg/ha)


首先,利用趋势产量模型,对河北省11个县2001-2016年的冬小麦单产数据使用5年直线滑动平均分离趋势产量如表5所示,其次,利用历史数据求解三次多项式的系数建立关于时间的趋势模型,结果如表6。First, using the trend yield model, the 5-year linear moving average separation trend yield was used for the winter wheat yield data of 11 counties in Hebei Province from 2001 to 2016. Trend model, the results are shown in Table 6.
表5趋势产量(kg/ha)Table 5 Trend yield (kg/ha)


表6趋势产量模型Table 6 Trend Yield Model
Yt为趋势产量,单位:kg/ha,x表示年份,如计算2016年趋势单产,则x=2016。Yt is the trend yield, unit: kg/ha, x indicates the year, if the trend yield in 2016 is calculated, then x=2016.
首先以公式Yf=Y-Yt得到11个县的波动产量,如表7所示。First, the fluctuating yields of 11 counties are obtained with the formula Yf =YYt , as shown in Table 7.
表7波动产量(kg/ha)Table 7 Fluctuation yield (kg/ha)
其次,获取各生育期的总降水量、每日平均温度、个生育期内总日照时数,计算得到各生育期降水、温度、日照适宜度指数F(pi),F(ti),F(si),采用通径分析法计算同一生育期内这三者分别对波动产量的直接影响,即直接效应,并将直接效应归一化后作为该生育期内降水、温度、日照适宜度的权重。结果如表8所示。Secondly, obtain the total precipitation, daily average temperature, and total sunshine hours in each growth period, and calculate the precipitation, temperature, and sunshine suitability indices F(pi) and F(t i) in each growth period, F(si ), the path analysis method was used to calculate the direct effects of the three on the fluctuating yield in the same growth period, that is, the direct effects, and the direct effects were normalized as the appropriate precipitation, temperature, and sunshine in the growth period. degree weight. The results are shown in Table 8.
表8不同生长期的适宜度指数Table 8 Suitability indices of different growth stages


然后,基于公式F(ci)=wp*F(pi)+wt*F(ti)+ws*F(si)求取各区县的不同生育期F(ci),并与波动产量求取相关系数Ri,结果如表9所示,最后根据公式
表9各县各生育期气候指数与波动产量相关性RiTable 9 The correlation Ri between the climate index and fluctuating yield in each growth period of each county
*表示通过置信度0.05的显著性水平检验,**表示通过置信度0.01的显著性水平检验。* means passing the significance level test with a confidence level of 0.05, ** means passing the significance level test with a confidence level of 0.01.
表10各生育期F(ci)的权重WiTable 10 Weight Wi of each growth period F(ci)


最后即可通过公式

表11选取的EVI时期及相关性Table 11 Selected EVI Periods and Correlations
*表示通过置信度0.05的显著性水平检验,**表示通过置信度0.01的显著性水平检验。* means passing the significance level test with a confidence level of 0.05, ** means passing the significance level test with a confidence level of 0.01.
使用2001~2016年的统计产量与趋势产量、气候指数、关键期EVI,通过多元回归的方法确定本研究设计的耦合估产模型参数,结果如表12所示。Using the statistical yield and trend yield, climate index, and critical period EVI from 2001 to 2016, the parameters of the coupled yield estimation model designed in this study were determined by the method of multiple regression. The results are shown in Table 12.
表12耦合估产模型Table 12 Coupling production estimation model

**表示模型通过置信度0.01的显著性水平检验,R2adj代表调节R2,Yt为趋势模型产量,M为气候指数,EVI为最佳估产期EVI。** indicates that the model passes the significance level test with a confidence level of 0.01, R2adj represents adjustment R2 , Yt is the trend model yield, M is the climate index, and EVI is the best estimated yield period EVI.
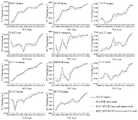
研究比较11个研究县的不同模型预测结果与统计值,如图5所示,深色实线为统计值,浅色实线是仅使用趋势构建模型的预测结果,深色虚线是使用趋势、气候指数构建模型的预测结果,浅色虚线是使用趋势、气候指数、EVI构建模型的预测结果。结果表明在相邻年份产量变化相对平稳的地区如南宫市、霸州市,三种模型预测值与统计值相差不大,这是由于田间管理、品种改良等人工影响使得气候变化对产量的影响很小且并未发生异常天气或灾害情况,因此仅使用趋势构建模型(以下称趋势模型)就可以得到很好的结果,但是对于气候变化或其他因素导致产量突然降低或升高的年份,趋势模型存在严重的高估或低估现象如固安县、饶阳县、乐亭县等县。以趋势、气候指数构建的模型(以下称趋势气候模型)和本研究模型(以下称趋势气候EVI模型)虽然也存在高估和低估现象,却有效的改善了这种状况,这是因为趋势气候模型在趋势模型的基础上考虑了气候变化对产量丰欠的影响,而趋势气候EVI模型则在趋势气候模型基础上加入了其他因素的影响。因此趋势气候EVI模型在受病虫害、干热风等其他因素影响的年份预测结果要优于趋势气候模型,如黄骅市、徐水县因灾害产量突然降低的年份。The study compares the prediction results and statistical values of different models in the 11 study counties, as shown in Figure 5, the dark solid line is the statistical value, the light solid line is the prediction result of the model constructed using only the trend, and the dark dotted line is the use trend, The prediction results of the model constructed by climate index, the light dashed line is the prediction result of the model constructed using trend, climate index, and EVI. The results show that in areas with relatively stable yield changes in adjacent years, such as Nangong City and Bazhou City, the predicted values of the three models are not much different from the statistical values. This is due to the artificial influence of field management, variety improvement, etc. Very small and no unusual weather or disaster conditions have occurred, so modeling using only trends (hereafter referred to as trend models) can give good results, but for years where climate change or other factors cause a sudden decrease or increase in yield, the trend The model has serious overestimation or underestimation, such as Gu'an County, Raoyang County, Leting County and other counties. Although the model constructed by trend and climate index (hereinafter referred to as the trend climate model) and the model in this study (hereinafter referred to as the trend climate EVI model) also have overestimation and underestimation, they have effectively improved this situation, because the trend climate Based on the trend model, the model considers the impact of climate change on yield abundance, while the trend climate EVI model adds other factors to the trend climate model. Therefore, the prediction results of the trend climate EVI model are better than those of the trend climate model in years affected by other factors such as pests and diseases, dry and hot winds, such as the years when the yield of Huanghua City and Xushui County suddenly decreased due to disasters.
判定系数(R2)可以用来评价模型的拟合优度但会随自变量增加而变大,而调整的判定系数(R2adj)同时考虑了样本量与模型中自变量的个数,不会随模型中自变量个数的增加而接近1。均方根误差(RMSE)通过计算预测值与观测值之间的偏差来估算模型的精度,其值越小模型越好。The coefficient of determination (R2 ) can be used to evaluate the goodness of fit of the model, but it will increase with the increase of independent variables. The adjusted coefficient of determination (R2adj ) takes into account both the sample size and the number of independent variables in the model. does not approach 1 as the number of independent variables in the model increases. The root mean square error (RMSE) estimates the accuracy of the model by calculating the deviation between the predicted value and the observed value, and the smaller the value, the better the model.
因此实验比较各模型的R2adj和RMSE来评价各模型的拟合精度,结果如图6所示。表明使用趋势构建的模型虽然具有一定的预测效果,但是在不同地区表现却相差很大,该模型在南宫市R2adj达到0.95以上,在黄骅市、徐水县却不到0.7,RMSE变化区间在50~589kg/ha,说明使用趋势构建的模型在应用时不稳定,鲁棒性较差。趋势气候模型和趋势气候EVI模型的R2adj最低分别是0.845和0.838,最高都是0.993,RMSE变化区间分别为24.4~342.1kg/ha和22.1~237.1kg/ha,表明在模型中加入气候指数不仅提高了模型的拟合优度还降低了RMSE,R2adj从0.7提高到0.845,RMSE从589kg/ha降低到342.1kg/ha,有效地提高了估产模型的稳定性和鲁棒性。而加入了EVI的模型虽然在各县的RMSE要低于趋势气候模型,但其R2adj除黄骅市外未有显著提升,如饶阳县、乐亭县。这是由于黄骅市遭受干热风影响,而气候指数仅考虑了温度、光照、降水对产量的影响,没有考虑干热风的因素,这些因素对产量的影响却在EVI信息上表现出来,因此趋势气候EVI模型的R2adj在黄骅市最高,说明趋势气候EVI模型在异常年份要优于趋势气候模型。Therefore, the R2adj and RMSE of each model were compared in the experiment to evaluate the fitting accuracy of each model. The results are shown in Figure 6. It shows that although the model constructed by using the trend has a certain prediction effect, the performance in different regions is very different. The R2adj of the model is above 0.95 in Nangong City, but less than 0.7 in Huanghua City and Xushui County. The RMSE changes in the range Between 50 and 589 kg/ha, it means that the model constructed using the trend is unstable in application and has poor robustness. The lowest R2adj of the trend climate model and the trend climate EVI model are 0.845 and 0.838, respectively, and the highest are 0.993. The RMSE variation ranges are 24.4-342.1kg/ha and 22.1-237.1kg/ha, respectively, indicating that the climate index is added to the model. It not only improves the goodness of fit of the model but also reduces the RMSE. The R2adj is increased from 0.7 to 0.845, and the RMSE is reduced from 589kg/ha to 342.1kg/ha, which effectively improves the stability and robustness of the yield estimation model. Although the RMSE of the model with EVI is lower than that of the trend climate model, its R2adj has not been significantly improved except for Huanghua City, such as Raoyang County and Leting County. This is because Huanghua City is affected by hot and dry wind, and the climate index only considers the influence of temperature, light and precipitation on yield, and does not consider the factors of hot and dry wind. The influence of these factors on yield is shown in the EVI information, so the trend climate The R2adj of the EVI model is the highest in Huanghua City, indicating that the trend climate EVI model is better than the trend climate model in abnormal years.
为了进一步比较模型在异常年份的预测结果,实验使用箱式图选出各县波动产量异常的值,如图7所示,并比较模型在这些异常年份的预测结果与统计值,如图8所示。如图8所示的结果表明趋势模型在异常年份拟合优度仅达到0.855,而其他两个模型精度均在0.95以上,优于趋势模型,其中趋势气候EVI模型预测结果与统计值拟合优度最高,达到了0.98,比趋势气候模型高0.02。趋势气候EVI模型的RMSE为226kg/ha,比趋势气候模型的RMSE低140kg/ha,比趋势模型的RMSE低近500kg/ha,其拟合直线斜率和截距也是最小的,分别为0.974和114,优于趋势气候模型拟合直线斜率0.956和181,说明趋势气候EVI耦合的模型预测结果更接近于统计值。In order to further compare the prediction results of the model in abnormal years, the experiment uses box plots to select abnormal values of fluctuating yield in each county, as shown in Figure 7, and compares the prediction results and statistical values of the model in these abnormal years, as shown in Figure 8 Show. The results shown in Figure 8 show that the goodness of fit of the trend model in abnormal years only reaches 0.855, while the accuracy of the other two models is above 0.95, which is better than the trend model. The prediction results of the trend climate EVI model fit the statistical values well The highest degree was 0.98, which was 0.02 higher than the trend climate model. The RMSE of the trend climate EVI model is 226kg/ha, which is 140kg/ha lower than that of the trend climate model and nearly 500kg/ha lower than the RMSE of the trend climate model. The slope and intercept of the fitted line are also the smallest, which are 0.974 and 114 , which is better than the trend climate model fitting straight line slopes of 0.956 and 181, indicating that the model prediction result of the trend climate EVI coupling is closer to the statistical value.
总体上,三种模型在各县表现效果排序为趋势气候EVI模型>>趋势气候模型>>趋势模型,反映出趋势气候EVI模型预测结果更接近于实测的统计值,特别是对于异常年份产量的预测。但是对于非异常年份的预测,相比于趋势气候模型,趋势气候EVI模型预测效果提升很小,而模型的拟合优度甚至略有降低,可能是由于MODIS数据混合像元的影响,EVI不能准确反映作物生长状态。In general, the three models in each county are ranked as trend climate EVI model >> trend climate model >> trend model, reflecting that the predicted results of the trend climate EVI model are closer to the measured statistical values, especially for abnormal year yields. predict. However, for the prediction of non-anomaly years, compared with the trend climate model, the prediction effect of the trend climate EVI model is very small, and the goodness of fit of the model is even slightly reduced, which may be due to the influence of the mixed pixels of the MODIS data, and the EVI cannot Accurately reflect the state of crop growth.
本研究提出的趋势、气候指数、EVI耦合模型综合考虑了不同模型的特点,趋势模型可以稳定反应冬小麦单产在时间尺度上的变化,却很难体现出气候或其他因素造成的单产波动,而气候指数和EVI可以表达空间尺度上气候状况和冬小麦生长状态变化引起的单产波动。与已有的研究方法相比,本模型考虑了更多的影响因素,相比于传统的趋势模型,本模型可以反映出气候变化或其他因素导致的单产变化,而同时使用气候和光谱信息表达单产的变化更加准确,相比于遥感模型和气象模型,本模型能更好的反映出单产变化的整体趋势。因此本模型在各县都能得到不错的结果,可用于大范围区域的产量估算。The trend, climate index, and EVI coupling model proposed in this study comprehensively considers the characteristics of different models. The trend model can stably reflect the change of winter wheat yield on a time scale, but it is difficult to reflect the fluctuation of yield caused by climate or other factors. The index and EVI can express the yield fluctuations caused by changes in climate conditions and winter wheat growth states on a spatial scale. Compared with the existing research methods, this model considers more influencing factors. Compared with the traditional trend model, this model can reflect the changes in yield caused by climate change or other factors, while using climate and spectral information to express The change of unit yield is more accurate. Compared with remote sensing model and meteorological model, this model can better reflect the overall trend of unit yield change. Therefore, this model can get good results in all counties and can be used for yield estimation in a large area.
为了验证模型的可用性,本研究以2017年统计产量为真值,将趋势模型、趋势气候模型、趋势气候EVI模型预测结果进行对比,结果见表13。由于缺少2017年丰润区单产数据,本研究未做2017年丰润区的验证。In order to verify the availability of the model, this study took the statistical yield in 2017 as the true value, and compared the prediction results of the trend model, the trend climate model, and the trend climate EVI model. The results are shown in Table 13. Due to the lack of yield data in Fengrun District in 2017, this study did not verify the 2017 Fengrun District.
表中三种模型在10个验证区域的精度均达到0.9以上,得到了非常好的效果。其中,趋势模型在徐水区精度最高(精度0.999),由于该区的水域面积大、水资源丰富,耕地基本都是水浇地(占耕地的90%),气象因素中的降水的多或少对该地区冬小麦的生长发育影响很小,而降水量的多少可能会导致模型估算结果偏高或偏低。因此,仅使用趋势模型就能得到很好的估算精度,其他两种加入气候指数、EVI反而会因为自身精度的问题不能准确表达这些因素的影响从而造成模型精度降低。但趋势模型在其他区域低于其他两种模型,特别是在遵化市(精度0.922)、黄骅市(精度0.942)、乐亭县(精度0.946)明显偏低,这是由于其他地区缺水干旱,灌溉水源不足导致降水等因素对冬小麦的生长发育影响很大,其产量会随气象因素的变化而出现大幅波动。而引入气候指数的趋势气候模型弥补了趋势模型的缺点,使模型估产精度得到提升,其中在遵化县提升最大,为5个百分点,说明了模型中加入气候指数的重要性。而引入EVI的耦合模型使得其中5个县在趋势气候模型精度的基础上又得到了提升,其中在黄骅市提升最大,为2.5个百分点,这是由于黄骅市农作物主要是“靠天收”,降水量对冬小麦影响较大,受盐碱地等自然资源的限制且易受干热风、冻害、虫害等灾害影响。乐亭县所处的自然资源条件与黄骅市相似,同样也是盐碱地,受干旱影响严重,耦合模型在该县表现也较好,说明了趋势气候模型中加入EVI构建模型可以弥补趋势模型、气候指数无法估算受病虫害等其他非气象因素对冬小麦发育状况影响的不足。邢台县、霸州市、固安县、遵化市、南宫市、泊头市、饶阳县主要是受降水等气象因素影响,受其他灾害性因素影响较小,因此,在对于这些地区,趋势气候模型与耦合模型表现相似,并无太大差别,其中在饶阳县和遵化市精度相差最大均为0.005,而这两个模型精度在这些地区均高于趋势模型。The accuracy of the three models in the table is above 0.9 in 10 validation areas, and very good results are obtained. Among them, the trend model has the highest accuracy in the Xushui area (accuracy 0.999). Due to the large water area and abundant water resources in this area, the cultivated land is basically irrigated land (accounting for 90% of the cultivated land). Less rainfall has little effect on the growth and development of winter wheat in the region, and the amount of precipitation may lead to higher or lower estimation results of the model. Therefore, only the trend model can be used to obtain good estimation accuracy. The other two types of climate indices and EVI can not accurately express the influence of these factors due to their own accuracy problems, resulting in reduced model accuracy. However, the trend model is lower than the other two models in other areas, especially in Zunhua City (accuracy 0.922), Huanghua City (accuracy 0.942), and Laoting County (accuracy 0.946), which is obviously lower due to lack of water and drought in other areas , the lack of irrigation water causes precipitation and other factors to have a great impact on the growth and development of winter wheat, and its yield will fluctuate greatly with the changes of meteorological factors. The trend climate model with the introduction of climate index makes up for the shortcomings of the trend model and improves the model's yield estimation accuracy. Among them, Zunhua County has the largest increase of 5 percentage points, which shows the importance of adding climate index to the model. The introduction of the coupled model of EVI has improved the accuracy of the trend climate model in 5 counties. Among them, Huanghua City has improved the most by 2.5 percentage points. This is because the crops in Huanghua City are mainly harvested from the sky. Precipitation has a greater impact on winter wheat, which is limited by natural resources such as saline-alkali land, and is easily affected by hot and dry wind, frost damage, insect pests and other disasters. The natural resource conditions of Leting County are similar to Huanghua City, and it is also saline-alkali land, which is seriously affected by drought. The coupled model performs well in this county, which shows that adding EVI to the trend climate model to build a model can make up for the trend model and climate index. The insufficiency of other non-meteorological factors such as pests and diseases on the development of winter wheat cannot be estimated. Xingtai County, Bazhou City, Gu'an County, Zunhua City, Nangong City, Botou City, and Raoyang County are mainly affected by meteorological factors such as precipitation, and are less affected by other catastrophic factors. The performance of the climate model and the coupled model is similar, and there is not much difference. The difference between the accuracy of Raoyang County and Zunhua City is 0.005, and the accuracy of the two models is higher than that of the trend model in these areas.
表13冬小麦不同估产模型预测结果Table 13 Prediction results of different yield estimation models for winter wheat
1为真实值(kg/ha);2为趋势气候EVI模型结果(kg/ha);3为趋势模型结果(kg/ha);4为趋势气候模型结果(kg/ha);2*为趋势气候EVI模型精度;3*为趋势模型精度;4*为趋势气候模型精度。1 is the true value (kg/ha); 2 is the trend climate EVI model result (kg/ha); 3 is the trend model result (kg/ha); 4 is the trend climate model result (kg/ha); 2* is the trend Climate EVI model accuracy; 3* is the trend model accuracy; 4* is the trend climate model accuracy.
根据本发明提供的具体实施例,本发明公开了以下技术效果:According to the specific embodiments provided by the present invention, the present invention discloses the following technical effects:
本发明提供一种农作物产量预测方法及系统,本发明的趋势、气候指数、EVI耦合的估产模型在县级尺度上取得较高的精度,充分考虑了时空尺度上冬小麦单产变化及影响因素,比仅使用趋势构建的模型更加稳定,特别是在产量异常年份的模型结果优于其他没有使用遥感的两种模型,对冬小麦估产具有一定的指导意义。The present invention provides a method and system for predicting crop yield. The yield estimation model coupled with trend, climate index and EVI of the present invention achieves high precision on the county scale, and fully considers the variation and influencing factors of winter wheat yield on the temporal and spatial scales. The model constructed using only the trend was more stable, especially in the years with abnormal yield, the results of the model were better than those of the other two models without remote sensing, which had certain guiding significance for the estimation of winter wheat yield.
本说明书中各个实施例采用递进的方式描述,每个实施例重点说明的都是与其他实施例的不同之处,各个实施例之间相同相似部分互相参见即可。The various embodiments in this specification are described in a progressive manner, and each embodiment focuses on the differences from other embodiments, and the same and similar parts between the various embodiments can be referred to each other.
本文中应用了具体个例对发明的原理及实施方式进行了阐述,以上实施例的说明只是用于帮助理解本发明的方法及其核心思想,所描述的实施例仅仅是本发明的一部分实施例,而不是全部的实施例,基于本发明中的实施例,本领域普通技术人员在没有做出创造性劳动前提下所获得的所有其他实施例,都属于本发明保护的范围。The principles and implementations of the invention are described herein by using specific examples. The descriptions of the above embodiments are only used to help understand the method and the core idea of the present invention, and the described embodiments are only a part of the embodiments of the present invention. , rather than all the embodiments. Based on the embodiments of the present invention, all other embodiments obtained by those of ordinary skill in the art without creative work shall fall within the protection scope of the present invention.
Claims (6)
Translated fromChinese


Priority Applications (1)
| Application Number | Priority Date | Filing Date | Title |
|---|---|---|---|
| CN201910618693.3ACN110309985B (en) | 2019-07-10 | 2019-07-10 | Method and system for forecasting crop yield |
Applications Claiming Priority (1)
| Application Number | Priority Date | Filing Date | Title |
|---|---|---|---|
| CN201910618693.3ACN110309985B (en) | 2019-07-10 | 2019-07-10 | Method and system for forecasting crop yield |
Publications (2)
| Publication Number | Publication Date |
|---|---|
| CN110309985A CN110309985A (en) | 2019-10-08 |
| CN110309985Btrue CN110309985B (en) | 2022-05-03 |
Family
ID=68079797
Family Applications (1)
| Application Number | Title | Priority Date | Filing Date |
|---|---|---|---|
| CN201910618693.3AActiveCN110309985B (en) | 2019-07-10 | 2019-07-10 | Method and system for forecasting crop yield |
Country Status (1)
| Country | Link |
|---|---|
| CN (1) | CN110309985B (en) |
Families Citing this family (27)
| Publication number | Priority date | Publication date | Assignee | Title |
|---|---|---|---|---|
| CN111062526B (en)* | 2019-12-09 | 2022-03-08 | 北京师范大学 | A method and system for forecasting yield per unit of winter wheat |
| CN111191543A (en)* | 2019-12-20 | 2020-05-22 | 湖南城市学院 | Rape yield estimation method |
| CN111260241B (en)* | 2020-01-23 | 2021-02-02 | 北京师范大学 | Design method of index type agricultural insurance product and product thereof |
| CN111612236A (en)* | 2020-05-14 | 2020-09-01 | 中电工业互联网有限公司 | Insect situation real-time analysis and prediction method, system and storage medium |
| CN111639803A (en)* | 2020-05-29 | 2020-09-08 | 福州市规划设计研究院 | Prediction method applied to future vegetation index of area under climate change scene |
| CN111797835B (en)* | 2020-06-01 | 2024-02-09 | 深圳市识农智能科技有限公司 | Disorder identification method, disorder identification device and terminal equipment |
| CN112183428A (en)* | 2020-10-09 | 2021-01-05 | 浙江大学中原研究院 | Wheat planting area segmentation and yield prediction method |
| CN112785036A (en)* | 2020-12-31 | 2021-05-11 | 航天信息股份有限公司 | Method and system for predicting yield based on key growth period of crops |
| CN112712208A (en)* | 2020-12-31 | 2021-04-27 | 航天信息股份有限公司 | Method and system for predicting yield of rice in key growth period |
| CN112840977A (en)* | 2020-12-31 | 2021-05-28 | 航天信息股份有限公司 | Method and system for predicting wheat yield based on key growth period of wheat |
| CN112884196A (en)* | 2020-12-31 | 2021-06-01 | 航天信息股份有限公司 | Corn yield prediction method and system based on corn key growth period |
| CN112990692B (en)* | 2021-03-11 | 2023-05-30 | 中国水利水电科学研究院 | Winter wheat yield estimation method based on multiparameter coupling in sub-fertility stage |
| CN113255999B (en)* | 2021-05-25 | 2024-04-12 | 中国农业科学院农业信息研究所 | Crop yield evaluation method, device, equipment and medium based on multiple models |
| CN113222294B (en)* | 2021-06-07 | 2023-09-26 | 中国农业科学院农业信息研究所 | A method and system for predicting yield per soybean input |
| CN113657781A (en)* | 2021-08-23 | 2021-11-16 | 北京师范大学 | Wheat yield estimation method and system suitable for extreme climate conditions |
| CN114118679B (en)* | 2021-10-14 | 2022-09-16 | 农业农村部规划设计研究院 | Crop yield per unit and growth evaluation method based on time sequence remote sensing data |
| CN113935542A (en)* | 2021-11-01 | 2022-01-14 | 北京飞花科技有限公司 | Method for predicting cotton yield per unit based on climate suitability |
| CN114037336A (en)* | 2021-11-22 | 2022-02-11 | 薛晓萍 | A method and system for evaluating climate quality of characteristic crops |
| EP4457742A1 (en)* | 2021-12-31 | 2024-11-06 | Basf Corporation | Field-scale crop phenology model for computing plant development stages |
| CN114529091A (en)* | 2022-02-22 | 2022-05-24 | 山东省农业科学院 | Crop yield prediction system fusing meteorological data |
| CN114331753B (en)* | 2022-03-04 | 2022-06-14 | 阿里巴巴达摩院(杭州)科技有限公司 | Intelligent farm affair method and device and control equipment |
| CN115545311A (en)* | 2022-10-11 | 2022-12-30 | 中国科学院西北生态环境资源研究院 | A crop yield estimation method, device, storage medium and electronic equipment |
| CN115564596A (en)* | 2022-10-12 | 2023-01-03 | 扬州市气象局 | A reference index acquisition method, device, electronic equipment and computer-readable storage medium based on artificial intelligence analysis |
| CN116821816B (en)* | 2023-05-17 | 2024-05-28 | 河南农业大学 | A dry hot wind prediction method based on weighted random forest |
| CN117634225B (en)* | 2024-01-24 | 2024-04-30 | 中国农业科学院农业资源与农业区划研究所 | Oil crop yield simulation parameter adjustment method and system based on crop growth general model and curve fitting method |
| CN118485321B (en)* | 2024-07-16 | 2024-09-27 | 江苏省气候中心 | Transformer winter wheat yield prediction method combined with weather suitability |
| CN119378737B (en)* | 2024-10-10 | 2025-05-02 | 北京师范大学 | Method, device and equipment for processing influence of meteorological event on crop unit production |
Family Cites Families (4)
| Publication number | Priority date | Publication date | Assignee | Title |
|---|---|---|---|---|
| CN108154193B (en)* | 2018-01-16 | 2021-10-08 | 黄河水利委员会黄河水利科学研究院 | A downscaling method for long-term precipitation data |
| CN108898499B (en)* | 2018-05-31 | 2021-08-31 | 河南省气象科学研究所 | Winter wheat dry and hot air insurance weather index calculation method |
| CN108921351A (en)* | 2018-07-06 | 2018-11-30 | 北京兴农丰华科技有限公司 | Crop production forecast method based on trend yield and Meteorological Output |
| CN109359862B (en)* | 2018-10-17 | 2020-09-18 | 北京师范大学 | A method and system for real-time yield estimation of food crops |
- 2019
- 2019-07-10CNCN201910618693.3Apatent/CN110309985B/enactiveActive
Also Published As
| Publication number | Publication date |
|---|---|
| CN110309985A (en) | 2019-10-08 |
Similar Documents
| Publication | Publication Date | Title |
|---|---|---|
| CN110309985B (en) | Method and system for forecasting crop yield | |
| CN116665073A (en) | Corn yield remote sensing estimation method based on multi-source data | |
| Aggarwal et al. | Analyzing the limitations set by climatic factors, genotype, and water and nitrogen availability on productivity of wheat II. Climatically potential yields and management strategies | |
| CN110909933B (en) | Agricultural drought rapid diagnosis and evaluation method coupling crop model and machine learning language | |
| CN111044516B (en) | A method for remote sensing estimation of chlorophyll content in rice | |
| CN105184445A (en) | Calculation method of average corn loss ratio of many years under corn drought meteorological disasters | |
| CN113673490B (en) | A method and system for remote sensing estimation of crop physiological parameters with phenological stage adaptation | |
| CN107423850B (en) | Regional corn maturity prediction method based on time series LAI curve integral area | |
| CN106018284B (en) | A kind of crop growing state quantitative remote sensing monitoring method and system | |
| CN118153802A (en) | Method and device for predicting key phenological period of wheat by coupling remote sensing with multiple environmental factors | |
| CN112380497B (en) | Straw coefficient estimation method and system for regional corn | |
| CN116415704A (en) | Regional precision irrigation method and system based on multi-data fusion and assimilation | |
| CN112651108A (en) | Method for decoupling influences of meteorological elements and vegetation dynamics on hydrological elements | |
| CN117745004A (en) | A corn nitrogen fertilizer recommendation method and system based on nitrogen nutrition diagnosis during the whole growth period | |
| WO2023245399A1 (en) | Rice production potential simulation method based on land system and climate change coupling | |
| CN118095645A (en) | Unmanned agricultural precise planting intelligent control method | |
| CN112352523B (en) | Tea garden water and fertilizer irrigation control method and system based on intelligent decision | |
| CN118606695A (en) | Construction and application of a maize aboveground biomass prediction model based on stem-leaf separation strategy | |
| CN117494441A (en) | Coupling modeling method for rice canopy radiation model and crop growth model | |
| CN108537679A (en) | The regional scale crop emergence date evaluation method that remote sensing is merged with crop modeling | |
| CN113762768B (en) | Dynamic Risk Assessment Method of Agricultural Drought Based on Weather Generator and Crop Model | |
| Liu et al. | Winter wheat maturity date prediction using MODIS/ECMWF data: Accuracy evaluation and spatiotemporal variation analysis | |
| CN117744898B (en) | Construction method of annual prediction model of yield of field grain crops | |
| Tsujimoto et al. | Estimation of planting date in paddy fields by time-series MODIS data for basin-scale rice production modeling | |
| CN109359862B (en) | A method and system for real-time yield estimation of food crops |
Legal Events
| Date | Code | Title | Description |
|---|---|---|---|
| PB01 | Publication | ||
| PB01 | Publication | ||
| SE01 | Entry into force of request for substantive examination | ||
| SE01 | Entry into force of request for substantive examination | ||
| GR01 | Patent grant | ||
| GR01 | Patent grant |