CN110309781B - House damage remote sensing identification method based on multi-scale spectrum texture self-adaptive fusion - Google Patents
House damage remote sensing identification method based on multi-scale spectrum texture self-adaptive fusionDownload PDFInfo
- Publication number
- CN110309781B CN110309781BCN201910585703.8ACN201910585703ACN110309781BCN 110309781 BCN110309781 BCN 110309781BCN 201910585703 ACN201910585703 ACN 201910585703ACN 110309781 BCN110309781 BCN 110309781B
- Authority
- CN
- China
- Prior art keywords
- image
- texture
- house
- value
- scale
- Prior art date
- Legal status (The legal status is an assumption and is not a legal conclusion. Google has not performed a legal analysis and makes no representation as to the accuracy of the status listed.)
- Active
Links
Images


Classifications
- G—PHYSICS
- G06—COMPUTING OR CALCULATING; COUNTING
- G06V—IMAGE OR VIDEO RECOGNITION OR UNDERSTANDING
- G06V10/00—Arrangements for image or video recognition or understanding
- G06V10/20—Image preprocessing
- G06V10/26—Segmentation of patterns in the image field; Cutting or merging of image elements to establish the pattern region, e.g. clustering-based techniques; Detection of occlusion
- G06V10/267—Segmentation of patterns in the image field; Cutting or merging of image elements to establish the pattern region, e.g. clustering-based techniques; Detection of occlusion by performing operations on regions, e.g. growing, shrinking or watersheds
- G—PHYSICS
- G06—COMPUTING OR CALCULATING; COUNTING
- G06V—IMAGE OR VIDEO RECOGNITION OR UNDERSTANDING
- G06V20/00—Scenes; Scene-specific elements
- G06V20/10—Terrestrial scenes
- G06V20/176—Urban or other man-made structures
Landscapes
- Engineering & Computer Science (AREA)
- Physics & Mathematics (AREA)
- General Physics & Mathematics (AREA)
- Multimedia (AREA)
- Theoretical Computer Science (AREA)
- Image Processing (AREA)
- Image Analysis (AREA)
Abstract
Translated fromChinese
Description
Translated fromChinese技术领域technical field
本发明涉及遥感监测技术领域。具体地说是基于多尺度光谱纹理自适应融合的房屋损毁遥感识别方法。The invention relates to the technical field of remote sensing monitoring. Specifically, it is a remote sensing recognition method of house damage based on multi-scale spectral texture adaptive fusion.
背景技术Background technique
近年来专家学者对灾后建筑物信息的提取进行了大量研究工作,,基于高分辨率遥感数据的完好房屋信息能够被精确提取出来。但是,在灾害研究领域,灾后损毁房屋建筑物信息的提取对灾后应急救援和灾损评估工作起到至关重要的作用,一直是灾害研究的热点问题。考虑到遥感数据的不确定性因素和灾害场景的复杂性等问题,构建灾后房屋建筑物定量分析模型,利用高分辨率遥感影像上准确提取房屋建筑物损毁信息,成为了防灾减灾工作中一项重要的研究内容。In recent years, experts and scholars have carried out a lot of research on the extraction of post-disaster building information, and the intact housing information based on high-resolution remote sensing data can be accurately extracted. However, in the field of disaster research, the extraction of post-disaster damaged buildings and buildings information plays a vital role in post-disaster emergency rescue and disaster damage assessment, and has always been a hot issue in disaster research. Considering the uncertainties of remote sensing data and the complexity of disaster scenarios, building a post-disaster house and building quantitative analysis model and using high-resolution remote sensing images to accurately extract house and building damage information has become an important part of disaster prevention and mitigation work. important research content.
发明内容SUMMARY OF THE INVENTION
为此,本发明所要解决的技术问题在于一种强化纹理特征、快速、准确提取房屋损毁信息的基于多尺度光谱纹理自适应融合的房屋损毁遥感识别方法。Therefore, the technical problem to be solved by the present invention lies in a method for remote sensing recognition of house damage based on adaptive fusion of multi-scale spectral textures, which strengthens texture features and extracts house damage information quickly and accurately.
为解决上述技术问题,本发明提供如下技术方案:In order to solve the above-mentioned technical problems, the present invention provides the following technical solutions:
基于多尺度光谱纹理自适应融合的房屋损毁遥感识别方法,包括如下步骤:The remote sensing recognition method of house damage based on multi-scale spectral texture adaptive fusion includes the following steps:
(1)影像预处理;(1) Image preprocessing;
(2)对影像特征进行光谱增强和纹理增强,然后将增强后的纹理和光谱特征融合;(2) Perform spectral enhancement and texture enhancement on image features, and then fuse the enhanced texture and spectral features;
(3)对融合光谱纹理图像进行面向对象的超像素分割;(3) Object-oriented superpixel segmentation of fused spectral texture images;
(4)震后房屋损毁比值模型的构建。(4) Construction of the damage ratio model of houses after the earthquake.
上述基于多尺度光谱纹理自适应融合的房屋损毁遥感识别方法,在步骤(1),所述影像为多传感器平台震后高分辨率遥感影像,包括卫星影像,机载航空影像和无人机航拍影像3种类型;所述预处理方法包括去燥和对比度增强;In the above-mentioned method for remote sensing recognition of house damage based on adaptive fusion of multi-scale spectral textures, in step (1), the image is a post-earthquake high-resolution remote sensing image of a multi-sensor platform, including satellite images, airborne aerial images and UAV
采用高斯低通滤波器对影像进行去燥预处理;Using Gaussian low-pass filter to de-dry the image;
采用限制对比度自适应直方图均衡化方法CLAHE对影响进行对比度增强去燥预处理。Contrast-enhancing and de-noising preprocessing is performed on the influence using the limited-contrast adaptive histogram equalization method CLAHE.
上述基于多尺度光谱纹理自适应融合的房屋损毁遥感识别方法,在步骤(2)中,所述光谱增强的方法包括:In the above-mentioned method for identifying house damage based on adaptive fusion of multi-scale spectral textures, in step (2), the method for spectral enhancement includes:
(G-1)颜色空间转换:将影像从RGB颜色空间转换到La*b*空间;L为亮度(Luminosity),a*与b*为色调,L的值域为[0,100];(G-1) Color space conversion: Convert the image from RGB color space to La*b* space; L is Luminosity, a* and b* are hue, and the value range of L is [0, 100];
(G-2)多尺度形态学建筑物指数MBI计算:(G-2) Multi-scale morphological building index MBI calculation:
包括如下5个步骤:It includes the following 5 steps:
(a)亮度值计算,如公式(1):(a) Calculation of luminance value, such as formula (1):
b(x)=max0≤k≤K(bandk(x)) (1)b(x)=max0≤k≤K (bandk (x)) (1)
其中,k为光谱波段数目,bandk(x)为第k光谱波段在x像元的亮度值。取最大像元值最为最终的亮度值,b为计算的亮度值图像结果;Among them, k is the number of spectral bands, and bandk (x) is the brightness value of the kth spectral band at pixel x. Take the maximum pixel value as the final brightness value, and b is the calculated brightness value image result;
(b)形态学重构,如公式(2)所示:(b) Morphological reconstruction, as shown in formula (2):

其中,
(c)WTH的方向性:利用线性结构元素,使用平均值来表示WTH的方向性,如公式(3)所示:(c) Directionality of WTH: Using linear structural elements, the average value is used to represent the directionality of WTH, as shown in formula (3):

其中,dir表示线性结构元素的各个方向;由于建筑物各向是同性的,并且在所有的方向中均有较大的顶帽值,因此,建筑物的THR特征值比其他地物的大,THR特征值反映了在结构元素区域内,房屋建筑物与其周围环境的亮度差异,包含了房屋的对比度信息;Among them, dir represents all directions of linear structural elements; since buildings are isotropic and have larger top-hat values in all directions, the THR eigenvalues of buildings are larger than those of other features, The THR eigenvalue reflects the brightness difference between the building and its surrounding environment in the structural element area, and includes the contrast information of the building;
(d)建筑物多尺度分析:采用计算微分形态学剖面导数DMP DifferentialMorphological Profiles进行多尺度分析,如公式(4)所示:(d) Multi-scale analysis of buildings: DMP Differential Morphological Profiles is used for multi-scale analysis, as shown in formula (4):
DMPWTH(d,s)=|WTH(d,(s+Δs))-WTH(d,s)| (4)DMPWTH (d,s)=|WTH(d,(s+Δs))-WTH(d,s)| (4)
其中,d表示结构元素的方向,s表示结构元素的尺度大小,Δs表示尺度的步长;Among them, d represents the direction of the structuring element, s represents the scale of the structuring element, and Δs represents the step size of the scale;
(e)建筑物形态学指数MBI计算,如公式(5)所示:(e) The building morphological index MBI is calculated, as shown in formula (5):
对每个尺度的DMPWTH取平均值即可得到MBI值,MBI值越大,其为建筑物的概率就越大,The MBI value can be obtained by averaging the DMPWTH of each scale. The larger the MBI value, the greater the probability that it is a building.
MBI=mean(DMPWTH) (5)。MBI=mean(DMPWTH ) (5).
上述基于多尺度光谱纹理自适应融合的房屋损毁遥感识别方法,在步骤(2)中,所述纹理增强的方法包括:In the above-mentioned multi-scale spectral texture adaptive fusion based remote sensing recognition method for house damage, in step (2), the texture enhancement method includes:
(W-1)局部纹理LBP特征;(W-1) Local texture LBP features;
改进后的LBP算子在半径为R的圆形邻域中有多个像素点,灰度值的统计方式发生改变,如公式(6)所示:The improved LBP operator has multiple pixels in the circular neighborhood of radius R, and the statistical method of gray value changes, as shown in formula (6):

其中,LBP是原始的LBP值,P是邻域点数量,R是圆形邻域的半径,ROR(LBP,i)函数将LBP的二进制序列循环右移i位;Among them, LBP is the original LBP value, P is the number of neighborhood points, R is the radius of the circular neighborhood, and the ROR(LBP, i) function cyclically shifts the LBP binary sequence to the right by i bits;
(W-2)全局纹理(GLCM)特征:P(i,j),(i,j=1,2,…,L-1)表示灰度共生矩阵,是一个L×L的矩阵,L为灰度级,是影像中包含的不同灰度的个数,具有空间位置关系且灰度分别为i和j的两个像素出现的次数或频率;通过如下5个指标全局建纹理特征;5个指标包括:同质性Homogeneity、对比度Contrast、熵Entropy、角二阶矩Angular Second Moment和相关性Correlation;(W-2) Global texture (GLCM) feature: P(i,j), (i,j=1,2,...,L-1) represents the gray level co-occurrence matrix, which is an L×L matrix, and L is The gray level is the number of different gray levels contained in the image, and the number or frequency of occurrence of two pixels with a spatial position relationship and gray levels i and j respectively; the following five indicators are used to build texture features globally; five Indicators include: Homogeneity, Contrast, Entropy, Angular Second Moment and Correlation;
(a)熵代表影像的无序程度,异质性纹理区域熵值较大,当地物的纹理表现为随机性特点时,熵值最大,纹理排列整齐有序,熵值较小,如公式(7)所示;(a) Entropy represents the degree of disorder of the image. The entropy value of the heterogeneous texture area is large. When the texture of the feature is random, the entropy value is the largest, the texture is neat and orderly, and the entropy value is small, such as formula ( 7) shown;

(b)角二阶矩,是影像同质性的度量,区域内像素值越相似,同质性越高,ASM值越大,如公式(8)所示;(b) Angular second moment, which is a measure of image homogeneity, the more similar the pixel values in the region, the higher the homogeneity, and the larger the ASM value, as shown in formula (8);
ASM=∑i∑j(f(i,j))2 (8)ASM=∑i ∑j (f(i,j))2 (8)
(c)对比度表示邻域内灰度级的差异,影像的局部变化越大,其值越高,如公式(9)所示;(c) Contrast represents the difference of gray levels in the neighborhood, the greater the local change of the image, the higher its value, as shown in formula (9);

(d)相关性是影像灰度线性相关的度量,线性相关的极端情况代表完全的同质性纹理,如公式(10)所示;(d) Correlation is a measure of the linear correlation of image gray levels, and the extreme case of linear correlation represents a completely homogeneous texture, as shown in Equation (10);

(e)同质性,是对图像局部灰度均匀性的度量,图像的局部灰度均匀,同质度较大,反之,图像的灰度分布不均匀,同质度较小,如公式(11)所示;(e) Homogeneity is a measure of the uniformity of the local grayscale of the image. The local grayscale of the image is uniform and the degree of homogeneity is large. On the contrary, the grayscale distribution of the image is not uniform and the degree of homogeneity is small, such as formula ( 11) shown;

并且选择选择5×5移动窗口。And choose Select 5×5 Move Window.
上述基于多尺度光谱纹理自适应融合的房屋损毁遥感识别方法,纹理特征和光谱特征的融合方式主要是采用纹理叠加的方式:对遥感影像全局纹理和局部纹理的6个纹理信息以一定权重叠加到的La*b*颜色空间进行增强,具体方法为:The above-mentioned method for remote sensing recognition of house damage based on multi-scale spectral texture adaptive fusion, the fusion method of texture features and spectral features mainly adopts the method of texture stacking: the six texture information of the global texture and local texture of the remote sensing image are overlapped and added to the remote sensing image with a certain weight. The La*b* color space is enhanced, the specific method is:
将影像第1主成分的空间纹理信息以特定权重增强,然后与La*b*颜色空间影像的第1主成分相加,获取多光谱影像增强后的第1主成分,公式为,如公式(12)所示:The spatial texture information of the first principal component of the image is enhanced with a specific weight, and then added to the first principal component of the La*b* color space image to obtain the enhanced first principal component of the multispectral image. The formula is, such as formula ( 12) shown:

其中,


上述基于多尺度光谱纹理自适应融合的房屋损毁遥感识别方法,在步骤(3)中,利用改进的SLIC超像素生成算法对光谱纹理融合影像进行面向对象的分割,利用尺度集模型并结合分形网演化算法(Fractal Net Evolution Approach,FNEA),对生成的超像素进行区域合并,在区域合并的同时进行全局演化分析,依据最小风险贝叶斯决策规则进行基于全局演化分析的尺度集约简,最后再基于局部演化分析进行尺度集约简,进而得到最佳分割尺度。The above-mentioned method for remote sensing recognition of house damage based on multi-scale spectral texture adaptive fusion, in step (3), the improved SLIC superpixel generation algorithm is used to perform object-oriented segmentation on the spectral texture fusion image, using the scale set model combined with the fractal network Evolutionary algorithm (Fractal Net Evolution Approach, FNEA), the generated superpixels are merged into regions, and the global evolution analysis is carried out while the regions are merged. Based on the local evolution analysis, the scale set is reduced, and then the optimal segmentation scale is obtained.
上述基于多尺度光谱纹理自适应融合的房屋损毁遥感识别方法,在步骤(4)中,包括如下:The above-mentioned multi-scale spectral texture adaptive fusion based remote sensing recognition method for house damage, in step (4), includes the following:
(4-1)损毁房屋样本与完好房屋样本多特征核概率密度比较分析;(4-1) Comparative analysis of multi-feature kernel probability density between damaged house samples and intact house samples;
(4-2)分割结果转为与原影像分辨率相同的栅格数据;(4-2) The segmentation result is converted into raster data with the same resolution as the original image;
(4-3)构建面向对象的房屋损毁比值模型OBDRI;(4-3) Build an object-oriented house damage ratio model OBDRI;
(4-4)基于回归树(CART树)的损毁房屋阈值自适应确定和房屋损毁信息提取结果。(4-4) Self-adaptive determination of damaged house threshold and extraction results of house damage information based on regression tree (CART tree).
上述基于多尺度光谱纹理自适应融合的房屋损毁遥感识别方法,在步骤(4-1)中,概率密度函数f的表达如公式(13)所示:In the above-mentioned method for remote sensing recognition of house damage based on adaptive fusion of multi-scale spectral textures, in step (4-1), the expression of the probability density function f is shown in formula (13):

其中,K(.)为核函数,h>0,是一个窗口函数,也被称作带宽,

可以用标准正态分布的密度函数作为K,高斯内核方便的数学性质,也经常使用K(x)=φ(x),φ(x)为标准正态概率密度函数;公式(13)可以简化为公式(14):The density function of the standard normal distribution can be used as K, a convenient mathematical property of the Gaussian kernel, and K(x)=φ(x) is often used, and φ(x) is the standard normal probability density function; Equation (13) can be simplified is formula (14):

得到损毁房屋样本与完好房屋样本的核概率密度比较图,在光谱特征、形状特征中,完好房屋和损毁房屋的样本较难区分;纹理特征中的熵值和角二阶矩2个特征能够很好地将损毁房屋从复杂场景中区分出来;The comparison chart of the kernel probability density of the damaged house sample and the intact house sample is obtained. Among the spectral features and shape features, the samples of the intact house and the damaged house are difficult to distinguish; the entropy value and the second-order moment of the angle in the texture feature can be very easy to distinguish. Distinguish damaged houses well from complex scenes;
地震导致的房屋损毁区域,信息量大,因此熵值也大;相反,其他正常完好房屋的灰度较为均匀,信息量少,熵值也相对小;熵值大小能对完好与损毁房屋进行较好的区分;完好房屋的角二阶矩能量值大,房屋损毁部分由于分布不均匀,纹理粗糙,角二阶矩值小;The damaged area of the house caused by the earthquake has a large amount of information, so the entropy value is also large; on the contrary, the grayscale of other normal and intact houses is relatively uniform, the amount of information is small, and the entropy value is relatively small; the entropy value can compare the intact and damaged houses. Good distinction; the energy value of the second-order moment of the angle of the intact house is large, and the damaged part of the house has a rough texture due to uneven distribution, and the value of the second-order moment of the angle is small;
在步骤(4-2)中,通过房屋样本的分析,得出面向对象的熵值和角二阶矩特征图像,将特征分割结果转为与原始影像相同分辨率的栅格数据,进行多传感器平台遥感影像特征的栅格表达:In step (4-2), through the analysis of the house samples, the object-oriented entropy value and angular second-order moment feature image are obtained, and the feature segmentation result is converted into raster data of the same resolution as the original image, and multi-sensor Raster representation of platform remote sensing image features:
熵值特征图像:灾后大量房屋受到损坏,损毁后存在大量的瓦砾废墟,增加纹理的复杂度;损毁信息比完好房屋、道路要复杂,熵值较大,完好的居民点、道路、水体纹理简单,对应的熵值较小;Entropy feature image: After the disaster, a large number of houses were damaged, and there were a lot of rubble and ruins after the damage, which increased the complexity of the texture; the damage information is more complex than the intact houses and roads, and the entropy value is larger, and the intact settlements, roads, and water bodies have simple textures , the corresponding entropy value is small;
角二阶矩特征图像:损毁部分的纹理粗糙,灰度分布不均匀,能量值较小,呈现出亮度偏黑,而完好的房屋居民点和道路纹理细致,灰度均匀,纹理较细致。Corner second-order moment feature image: The texture of the damaged part is rough, the grayscale distribution is uneven, the energy value is small, and the brightness is dark, while the intact houses and roads have fine texture, uniform grayscale, and fine texture.
上述基于多尺度光谱纹理自适应融合的房屋损毁遥感识别方法,在步骤(4-3)中,通过熵值和角二阶矩值2个纹理测度构建面向对象的房屋损毁比值模型(Object BasedDamage Ratio Index,OBDRI),所述面向对象的房屋损毁比值模型的通过变换熵值和角二阶矩指数相除得到,如公式(15)所示:The above-mentioned house damage remote sensing recognition method based on multi-scale spectral texture adaptive fusion, in step (4-3), an object-oriented house damage ratio model (Object BasedDamage Ratio Index, OBDRI), the object-oriented house damage ratio model is obtained by dividing the transform entropy value and the angular second-order moment index, as shown in formula (15):

通过面向对象的房屋损毁比值模型图像:损毁部分在OBDRI指数图像中呈现较高的值,增加损毁区域与非损毁区域对象块灰度值之间的差异性。Through the image of the object-oriented house damage ratio model: the damaged part presents a higher value in the OBDRI index image, and the difference between the gray value of the damaged area and the non-damaged area of the object block is increased.
上述基于多尺度光谱纹理自适应融合的房屋损毁遥感识别方法,其在步骤(4-4)中,基于回归树(CART树)的损毁房屋阈值自适应确定方法具体包括如下步骤:In the above-mentioned multi-scale spectral texture adaptive fusion-based remote sensing recognition method for house damage, in step (4-4), the method for adaptively determining the threshold value of damaged houses based on a regression tree (CART tree) specifically includes the following steps:
(4-4-1)在灾后影像中,分别选择训练样本和测试样本,将训练样本划分为2部分,熵值特征和角二阶矩特征为测试变量,高分辨率遥感影像中的房屋损毁信息为目标变量;将测试变量和目标变量都导入到回归决策树当中,通过循环分析形成二叉决策树;(4-4-1) In the post-disaster images, select training samples and test samples respectively, divide the training samples into two parts, and use the entropy feature and the second-order moment feature as the test variables. House damage in high-resolution remote sensing images The information is the target variable; both the test variable and the target variable are imported into the regression decision tree, and a binary decision tree is formed through cyclic analysis;
(4-4-2)等树的节点停止生长之后再利用检验样本对回归决策树进行剪枝,得出目标变量的预测精度和错分率;再通过设定合适的阈值对树节点进行限制;(4-4-2) After the nodes of the tree stop growing, use the test sample to prune the regression decision tree to obtain the prediction accuracy and misclassification rate of the target variable; then limit the tree nodes by setting appropriate thresholds ;
根据阈值自适应确定方法,利用CART回归树确定文中卫星样例影像、机载航空影像以及无人机影像的损毁房屋阈值取值;According to the threshold self-adaptive determination method, the CART regression tree is used to determine the threshold value of the damaged house in the satellite sample image, airborne aerial image and UAV image;
房屋损毁信息提取结果:损毁房屋区域在面向对象的房屋损毁比值模型指数图像中呈现出较高的亮度值,且每个对象块之间的差异性明显。The results of house damage information extraction: The damaged house area shows a high brightness value in the object-oriented house damage ratio model index image, and the difference between each object block is obvious.
本发明的技术方案取得了如下有益的技术效果:The technical scheme of the present invention has achieved the following beneficial technical effects:
本申请根据高分辨率影像的特点和房屋损毁信息提取的任务,原创性提出基于多尺度光谱纹理特征自适应融合的房屋损毁模型OBDRI,针对影像特征实施面向对象的分析方法,提取房屋损毁信息,具有一定的优势。According to the characteristics of high-resolution images and the task of extracting house damage information, this application originally proposes a house damage model OBDRI based on adaptive fusion of multi-scale spectral texture features, implements an object-oriented analysis method for image features, and extracts house damage information. has certain advantages.
针对高分辨率影像的特征来实现面向对象分析,融合了光谱特征和纹理特征,进行超像素分割,强化了纹理特征在信息提取中的应用,实现了纹理特征和光谱特征的像素级增强和特征级融合,进而构建震后房屋损毁指数模型。The object-oriented analysis is implemented for the features of high-resolution images, and the spectral features and texture features are combined to perform superpixel segmentation, which strengthens the application of texture features in information extraction, and realizes pixel-level enhancement and features of texture and spectral features Level fusion, and then build a post-earthquake house damage index model.
本申请提出的模型总体精度分别为卫星影像的总体精度为76.7589%、航空影像的总体精度为75.3561%和无人机影像的总体精度为83.2540%,说明算法对多源数据损毁信息提取的适用性。The overall accuracy of the model proposed in this application is 76.7589% for satellite images, 75.3561% for aerial images, and 83.2540% for UAV images, indicating the applicability of the algorithm to multi-source data damage information extraction .
附图说明Description of drawings
图1本发明基于多尺度光谱纹理自适应融合的房屋损毁遥感识别方法的灾后房屋损毁信息提取技术流程图;Fig. 1 is the technical flow chart of post-disaster house damage information extraction based on the multi-scale spectral texture adaptive fusion remote sensing identification method of house damage;
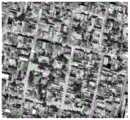
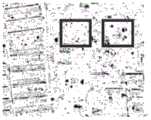
图2玉树地震灾后结古镇部分区域快鸟卫星影像;Figure 2 Quickbird satellite image of some areas in Jiegu Town after the Yushu earthquake;
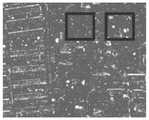
图3海地地震灾后太子港部分区域机载航空影像;Figure 3. Airborne aerial image of part of Port-au-Prince after the Haiti earthquake;
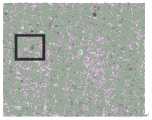
图4玉树地震灾后结古镇部分区域无人机影像;Figure 4. UAV image of part of Jiegu Town after the Yushu earthquake;
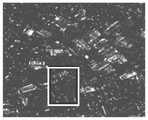
图5a玉树倒塌房屋样例航空影像(均衡前);Figure 5a Aerial image of a collapsed house in Yushu (before equalization);
图5b玉树倒塌房屋样例航空影像的限制对比度自适应直方图均衡化(均衡前);Fig. 5b Contrast-limited adaptive histogram equalization (before equalization) of a sample aerial image of a collapsed house in Yushu;
图5c玉树倒塌房屋样例航空影像(均衡后);Figure 5c Aerial image of a collapsed house in Yushu (after equalization);
图5d玉树倒塌房屋样例航空影像的限制对比度自适应直方图均衡化(均衡后);Fig. 5d Contrast-limited adaptive histogram equalization (after equalization) of a sample aerial image of a collapsed house in Yushu;
图6a RGB颜色空间;Figure 6a RGB color space;
图6b La*b*颜色空间示意图(来源于国际照明委员会);Figure 6b Schematic diagram of La*b* color space (from the International Commission on Illumination);
图7a玉树倒塌房屋样例影像从RGB颜色空间转换到La*b*空间中的RGB颜色空间;Figure 7a The sample image of Yushu collapsed house is converted from RGB color space to RGB color space in La*b* space;
图7b玉树倒塌房屋样例影像从RGB颜色空间转换到La*b*空间中转换为亮度L图;Figure 7b The sample image of Yushu collapsed house is converted from RGB color space to La*b* space and converted to luminance L map;
图7c玉树倒塌房屋样例影像从RGB颜色空间转换到La*b*空间中转换为色调a*图;Figure 7c The sample image of Yushu collapsed house is converted from RGB color space to La*b* space and converted to tone a* map;
图7d玉树倒塌房屋样例影像从RGB颜色空间转换到La*b*空间中转换为色调b*图;Figure 7d The sample image of Yushu collapsed house is converted from RGB color space to La*b* space and converted to tone b* map;
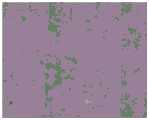
图8多传感器建筑物指数(MBI),其中a表示卫星影像MBI指数,b表示机载航空影像MBI指数,c表示无人机航拍影像MBI指数;Figure 8 Multi-sensor building index (MBI), where a represents the satellite image MBI index, b represents the airborne aerial image MBI index, and c represents the UAV aerial image MBI index;
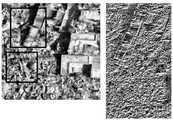
图9a完好房屋与损毁房屋卫星影像LBP全局纹理比较,左侧为卫星影像,右侧为全局纹理图;Figure 9a Comparison of the LBP global texture of satellite images of intact houses and damaged houses, the left is the satellite image, and the right is the global texture map;
图9b完好房屋与损毁房屋机载航空影像LBP全局纹理比较,左侧为机载航空影像,右侧为全局纹理图;Figure 9b Comparison of the LBP global texture of airborne aerial images of intact houses and damaged houses, the left is the airborne aerial image, and the right is the global texture map;
图9c完好房屋与损毁房屋无人机影像LBP全局纹理比较,左侧为无人机影像,右侧为全局纹理图;Figure 9c Comparison of the LBP global texture of the intact house and the damaged house drone image, the left is the drone image, and the right is the global texture map;
图10a-1卫星影像的GLCM纹理:同质性特征;Fig. 10a-1 GLCM texture of satellite image: homogeneity feature;
图10a-2卫星影像的GLCM纹理:对比度特征;Figure 10a-2 GLCM Texture of Satellite Image: Contrast Features;
图10a-3卫星影像的GLCM纹理:熵特征;Figure 10a-3 GLCM textures of satellite imagery: entropy features;
图10a-4卫星影像的GLCM纹理:角二阶矩特征;Figure 10a-4 GLCM texture of satellite image: angular second moment feature;
图10a-5卫星影像的GLCM纹理:相关性特征;Figure 10a-5 GLCM textures of satellite images: correlation features;
图10b-1机载航空影像的GLCM纹理:同质性特征;Figure 10b-1 GLCM texture of airborne aerial imagery: homogeneity features;
图10b-2机载航空影像的GLCM纹理:对比度特征;Figure 10b-2 GLCM texture of airborne aerial imagery: contrast features;
图10b-3机载航空影像的GLCM纹理:熵特征;Figure 10b-3 GLCM texture of airborne aerial imagery: entropy features;
图10b-4机载航空影像的GLCM纹理:角二阶矩特征;Figure 10b-4 GLCM texture of airborne aerial imagery: angular second moment feature;
图10b-5机载航空影像的GLCM纹理:相关性特征;Figure 10b-5 GLCM texture of airborne aerial imagery: correlation features;
图10c-1无人机影像的GLCM纹理:同质性特征;Figure 10c-1 GLCM texture of UAV image: homogeneity feature;
图10c-2无人机影像的GLCM纹理:对比度特征;Figure 10c-2 GLCM texture of UAV image: Contrast feature;
图10c-3无人机影像的GLCM纹理:熵特征;Figure 10c-3 GLCM texture of UAV image: entropy feature;
图10c-4无人机影像的GLCM纹理:角二阶矩特征;Figure 10c-4 GLCM texture of UAV image: angular second moment feature;
图10c-5无人机影像的GLCM纹理:相关性特征;Figure 10c-5 GLCM texture of UAV image: correlation feature;
图11a基于增强纹理和光谱特征融合的超像素多尺度分割结果:快鸟卫星影像分割结果;Figure 11a The multi-scale segmentation result of superpixels based on the fusion of enhanced texture and spectral features: the segmentation result of Kuainiao satellite image;
图11b基于增强纹理和光谱特征融合的超像素多尺度分割结果:机载航空影像分割结果;Figure 11b Multi-scale segmentation results of superpixels based on fusion of enhanced texture and spectral features: segmentation results of airborne aerial images;
图11c基于增强纹理和光谱特征融合的超像素多尺度分割结果:无人机航拍影像分割结果;Figure 11c Multi-scale segmentation results of superpixels based on fusion of enhanced texture and spectral features: segmentation results of UAV aerial images;
图12a损毁房屋样本与完好房屋样本的核概率密度比较:亮度特征;Figure 12a Comparison of Kernel Probability Density of Destroyed House Sample and Intact House Sample: Brightness Features;
图12b损毁房屋样本与完好房屋样本的核概率密度比较:最大差值特征;Figure 12b Comparison of Kernel Probability Density of Destroyed House Sample and Intact House Sample: Maximum Difference Feature;
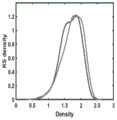
图12c损毁房屋样本与完好房屋样本的核概率密度比较:密度特征;Figure 12c Comparison of Kernel Probability Density of Destroyed House Sample and Intact House Sample: Density Features;
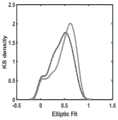
图12d损毁房屋样本与完好房屋样本的核概率密度比较:椭圆度特征;Figure 12d Comparison of Kernel Probability Density of Destroyed House Samples and Intact House Samples: Ellipticity Features;
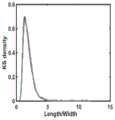
图12e损毁房屋样本与完好房屋样本的核概率密度比较:长度特征;Figure 12e Comparison of Kernel Probability Density of Destroyed House Sample and Intact House Sample: Length Feature;
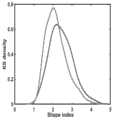
图12f损毁房屋样本与完好房屋样本的核概率密度比较:形状指数特征;Figure 12f Comparison of Kernel Probability Density of Destroyed House Samples and Intact House Samples: Shape Index Features;
图12g损毁房屋样本与完好房屋样本的核概率密度比较:相关性特征;Fig. 12g Comparison of kernel probability density of damaged house samples and intact house samples: correlation characteristics;
图12h损毁房屋样本与完好房屋样本的核概率密度比较:同质性特征;Figure 12h Comparison of Kernel Probability Density of Destroyed House Sample and Intact House Sample: Homogeneity Characteristics;
图12i损毁房屋样本与完好房屋样本的核概率密度比较:异质性特征;Figure 12i Comparison of Kernel Probability Density of Destroyed House Samples and Intact House Samples: Heterogeneity Characteristics;
图12j损毁房屋样本与完好房屋样本的核概率密度比较:对比度特征;Figure 12j Comparison of Kernel Probability Density of Destroyed House Samples and Intact House Samples: Contrast Features;
图12k损毁房屋样本与完好房屋样本的核概率密度比较:角二阶矩特征;Figure 12k Comparison of Kernel Probability Density of Damaged House Samples and Intact House Samples: Angular Second Moment Features;
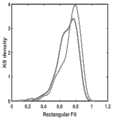
图12l损毁房屋样本与完好房屋样本的核概率密度比较:矩形度特征;Figure 12l Comparison of Kernel Probability Density of Destroyed House Samples and Intact House Samples: Rectangularity Features;
图12m损毁房屋样本与完好房屋样本的核概率密度比较:局部纹理均值特征;Figure 12m Comparison of Kernel Probability Density of Damaged House Samples and Intact House Samples: Local Texture Mean Features;
图12n损毁房屋样本与完好房屋样本的核概率密度比较:局部纹理标准层特征;Figure 12n Comparison of Kernel Probability Density of Damaged House Samples and Intact House Samples: Local Texture Standard Layer Features;
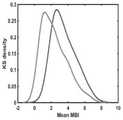
图12o损毁房屋样本与完好房屋样本的核概率密度比较:MBI均值特征;Figure 12o Comparison of the kernel probability density of the damaged house sample and the intact house sample: MBI mean characteristics;
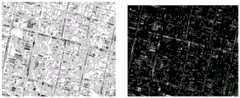
图13a卫星影像面向对象熵值和角二阶矩的栅格表达,左侧为熵值,右侧为角二阶矩;Fig. 13a Grid representation of object-oriented entropy value and angular second-order moment of satellite images, the left side is the entropy value, and the right side is the angular second-order moment;
图13b机载航空影像面向对象熵值和角二阶矩的栅格表达,左侧为熵值,右侧为角二阶矩;Figure 13b The grid representation of the object-oriented entropy value and angular second-order moment of airborne aerial images, the left side is the entropy value, and the right side is the angular second-order moment;
图13c低空委无人机影像面向对象熵值和角二阶矩的栅格表达,左侧为熵值,右侧为角二阶矩;Figure 13c The grid representation of the object-oriented entropy value and angular second-order moment of the low-altitude UAV image, the left side is the entropy value, and the right side is the angular second-order moment;
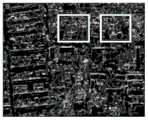
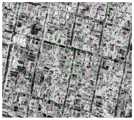
图14a卫星数据OBDRI指数图像;Figure 14a Satellite data OBDRI index image;
图14b机载航空数据OBDRI指数图像;Figure 14b Airborne Aerial Data OBDRI Index Image;
图14c人机数据OBDRI指数图像;Figure 14c Human-machine data OBDRI index image;
图15a卫星数据损毁信息提取结果;(其中红色为提取的损毁区域)Figure 15a The extraction result of satellite data damage information; (red is the extracted damaged area)
图15b对图15a的房屋损毁区域的人工目视解译结果图;(其中蓝色为提取的损毁区域)Fig. 15b is a result of manual visual interpretation of the damaged area of the house in Fig. 15a; (wherein blue is the extracted damaged area)
图15c机载航空数据损毁信息提取结果;(其中红色为提取的损毁区域)Figure 15c The extraction result of airborne aviation data damage information; (red is the extracted damage area)
图15d对图15c的房屋损毁区域的人工目视解译结果图;(其中蓝色为提取的损毁区域)Fig. 15d is the result of manual visual interpretation of the damaged area of the house in Fig. 15c; (wherein blue is the extracted damaged area)
图15e无人机数据的损毁信息提取结果;(其中红色为提取的损毁区域)Figure 15e Extraction results of damage information from UAV data; (red is the extracted damage area)
图15f对图15e的房屋损毁区域的人工目视解译结果图;(其中蓝色为提取的损毁区域)Fig. 15f is the result of manual visual interpretation of the damaged area of the house in Fig. 15e; (wherein blue is the extracted damaged area)
具体实施方式Detailed ways
与中低分辨率遥感影像相比,高分辨率影像中房屋的边界轮廓更加清晰,纹理信息更加突出,色调更加丰富,空间信息也更加明确。本章节主要是利用灾后高分辨率光学遥感影像,研究多尺度光谱纹理特征融合的房屋损毁信息自动提取方法。如图1所示,主要分为3个步骤:首先,对影像的纹理特征像素级增强,光谱特征增强后得到MBI图像;然后,对得到的特征影像进行特征级融合,并对融合的特征影像进行超像素分割;最后,构建震后房屋损毁指数模型。Compared with low- and medium-resolution remote sensing images, the boundary contours of houses in high-resolution images are clearer, the texture information is more prominent, the color tone is richer, and the spatial information is more clear. This chapter mainly uses post-disaster high-resolution optical remote sensing images to study the automatic extraction method of house damage information based on fusion of multi-scale spectral texture features. As shown in Figure 1, it is mainly divided into three steps: first, the texture feature of the image is enhanced at the pixel level, and the spectral feature is enhanced to obtain the MBI image; then, the obtained feature image is fused at the feature level, and the fused feature image Perform superpixel segmentation; finally, build a post-earthquake house damage index model.
详细思路包括:(1)颜色空间转换,RGB转换到Lab颜色空间;(2)对Lab颜色空间进行多尺度局部LBP纹理提取,生成LBP纹理图像;(3)对Lab颜色空间进行全局GLCM纹理提取,生成GLCM纹理图像;(4)多尺度LBP耦合GLCM纹理的图像纹理增强,融合LBP局部纹理模式和GLCM全局纹理模式;(5)对Lab颜色空间计算建筑物指数MBI,生成MBI图像,达到光谱增强的目的;(6)MBI图像和增强纹理进行融合,并进行特征分布统计描述;(好的特征分布统计决定了图像描述能力),用粗糙集方法进行降维。其中,纹理统计描述方法采用纹理相似性度量;(7)基于融合光谱纹理图像进行面向对象的超像素分割;(8)对分割后的超像素对象构建全局能量函数,进行对象块的合并;(9)构建震后房屋损毁指数模型;(10)利用数学形态学算法对结果进行后处理,包括腐蚀、膨胀、求并运算。The detailed ideas include: (1) Color space conversion, RGB to Lab color space; (2) Multi-scale local LBP texture extraction from Lab color space to generate LBP texture images; (3) Global GLCM texture extraction from Lab color space , generate GLCM texture image; (4) Multi-scale LBP coupled GLCM texture image texture enhancement, fuse LBP local texture mode and GLCM global texture mode; (5) Calculate building index MBI in Lab color space, generate MBI image, achieve spectral The purpose of enhancement; (6) MBI images and enhanced textures are fused, and feature distribution statistics are described; (good feature distribution statistics determine the image description ability), and the rough set method is used for dimensionality reduction. Among them, the texture statistic description method adopts texture similarity measure; (7) object-oriented superpixel segmentation is performed based on the fusion spectral texture image; (8) a global energy function is constructed for the segmented superpixel objects, and object blocks are merged; ( 9) Build a post-earthquake house damage index model; (10) Post-process the results using mathematical morphological algorithms, including corrosion, expansion, and summation operations.
一、影像的预处理1. Image preprocessing
基于多传感器平台震后高分辨率遥感影像,包括卫星影像,机载航空影像和无人机航拍影像3种类型,研究区涵盖国际和国内典型地震灾害区域,2010年玉树震后核心区卫星影像和无人机影像,2010年海地太子港地震核心区机载航空影像,具体的影像参数见表1。3种类型的样例影像见图2,图3,图4。其中国外海地机载航空影像数据由世界银行资助,罗彻斯特理工学院影像科学中心(Center for Imaging Science at RochesterInstitute of Technology,RIT)和Imagecat公司2010年1月21日到27日采集的高分辨率航空遥感图像。水平投影为UTM Zone 18N WGS84 Meters,垂直投影为Orthometric(EGM96)。Based on multi-sensor platform post-earthquake high-resolution remote sensing images, including satellite images, airborne aerial images and UAV aerial images, the study area covers typical international and domestic earthquake disaster areas, and satellite images of the core area after the 2010 Yushu earthquake and UAV images, airborne aerial images of the core area of the 2010 Haiti Port-au-Prince earthquake, and the specific image parameters are shown in Table 1. The three types of sample images are shown in Figure 2, Figure 3, and Figure 4. Among them, the airborne aerial image data of Haiti abroad were funded by the World Bank, and the high-resolution data collected by the Center for Imaging Science at Rochester Institute of Technology (RIT) and Imagecat from January 21 to 27, 2010 rate aerial remote sensing imagery. The horizontal projection is UTM Zone 18N WGS84 Meters and the vertical projection is Orthometric (EGM96).
表1多传感器遥感影像概况Table 1 Overview of multi-sensor remote sensing images

所述预处理方法包括去燥和对比度增强;The preprocessing method includes desiccation and contrast enhancement;
采用高斯低通滤波器对影像进行去燥预处理;Using Gaussian low-pass filter to de-dry the image;
采用限制对比度自适应直方图均衡化方法CLAHE对影响进行对比度增强去燥预处理。Contrast-enhancing and de-noising preprocessing is performed on the influence using the limited-contrast adaptive histogram equalization method CLAHE.
影像的预处理包括去燥和对比度增强。高斯低通滤波器(Gaussian Low PassFilter)是一类传递函数为高斯函数的线性平滑滤波器,对于去除服从正态分布(Normaldistribution)的噪声效果较好,可以突出影像中地物的边缘细节信息。本章节利用高斯去燥方法对影像进行去燥预处理。Image preprocessing includes desiccation and contrast enhancement. Gaussian Low Pass Filter is a kind of linear smoothing filter whose transfer function is Gaussian function. This chapter uses the Gaussian de-drying method to de-dry the image.
限制对比度自适应直方图均衡化(Zuiderveld,1994)方法能有效限制区域噪声放大等问题,是通过限制影像的对比度来达到的。邻域周边的对比度是由变换函数斜度控制,斜度与累积直方图之间有一定的比例关系。在计算累积直方图函数之前设定阈值,通过阈值来控制对比度大小。直方图被裁剪的值,也就是所谓的裁剪限幅,取决于直方图的分布,因此也取决于邻域大小取值。对每个小区域使用对比度限幅,从而克服了自适应直方图均衡化方法的过度放大噪声的问题。结合CLAHE方法既能增强影像对比度又能克服噪声过度放大的优点,本申请对样例影像进行对比度增强去燥预处理,得到结果如图5a-图5d所示。图5a和图5b为玉树倒塌房屋样例1航空影像增强前的图;图5c和图5d为玉树倒塌房屋样例1航空影像增强后的图。Contrast-limited adaptive histogram equalization (Zuiderveld, 1994) method can effectively limit the problem of regional noise amplification, which is achieved by limiting the contrast of the image. The contrast around the neighborhood is controlled by the slope of the transformation function, which is proportional to the cumulative histogram. The threshold is set before calculating the cumulative histogram function, and the contrast is controlled by the threshold. The value at which the histogram is clipped, the so-called clipping limit, depends on the distribution of the histogram, and therefore on the size of the neighborhood. Contrast clipping is used for each small region, thus overcoming the problem of over-amplifying noise with adaptive histogram equalization methods. Combined with the advantages of CLAHE method, which can enhance image contrast and overcome excessive noise amplification, this application performs contrast enhancement and de-drying preprocessing on sample images, and the results are shown in Figures 5a-5d. Figures 5a and 5b are the images of Yushu collapsed
二、对影像特征进行光谱增强和纹理增强,然后将增强后的纹理和光谱特征融合;2. Perform spectral enhancement and texture enhancement on image features, and then fuse the enhanced texture and spectral features;
1、光谱增强1. Spectral enhancement
1.1颜色空间转换1.1 Color space conversion
La*b*颜色空间主要是由3个要素组成:L为亮度(Luminosity),a*与b*为色调。L的值域为[0,100],对于地物的纹理特征极为敏感,和RGB颜色空间相比,色域更加宽阔,有效解决色彩分布不均的问题,在颜色特征方面,更加能够模拟人眼看到的特征,从而达到分离提取的目的,特别是对于地物的纹理细节,描述能力更强。通过将影像从RGB颜色空间转换到La*b*空间(图6a和图6b),达到颜色特征增强的目的。图7a-图7d是RGB颜色空间转换到La*b*颜色空间,L通道能够提供非常丰富的纹理信息,且La*b*是非线性的,方便后续图像处理中的颜色空间转换,以及对纹理图像的增强。The La*b* color space is mainly composed of three elements: L is Luminosity, and a* and b* are hue. The value range of L is [0, 100], which is extremely sensitive to the texture features of ground objects. Compared with the RGB color space, the color gamut is wider, which effectively solves the problem of uneven color distribution. The features seen by the eyes can achieve the purpose of separation and extraction, especially for the texture details of the ground objects, the description ability is stronger. By converting the image from RGB color space to La*b* space (Figure 6a and Figure 6b), the purpose of color feature enhancement is achieved. Figures 7a-7d are the conversion of RGB color space to La*b* color space. The L channel can provide very rich texture information, and La*b* is non-linear, which is convenient for color space conversion in subsequent image processing, and for texture image enhancement.
1.2建筑物指数(MBI)计算1.2 Building Index (MBI) Calculation
为了更进一步将损毁房屋信息从复杂的场景中区分出来,以光谱为基础的建筑物指数MBI(Morphology Building Index)被加入进来。MBI指数是以形态学为理论基础的,与房屋建筑物形态特点相符合,对于城市或农村的建成区房屋部分,MBI指数值较高,与植被、道路、裸土等背景有明显的区别。In order to further distinguish the damaged house information from the complex scene, the spectral-based building index MBI (Morphology Building Index) was added. The MBI index is theoretically based on morphology, which is consistent with the morphological characteristics of houses and buildings. For the urban or rural built-up areas, the MBI index has a higher value, which is obviously different from vegetation, roads, bare soil and other backgrounds.
包括如下5个步骤:It includes the following 5 steps:
(a)亮度值计算,如公式(1):(a) Calculation of luminance value, such as formula (1):
b(x)=max0≤k≤K(bandk(x)) (1)b(x)=max0≤k≤K (bandk (x)) (1)
其中,k为光谱波段数目,bandk(x)为第k光谱波段在x像元的亮度值。Among them, k is the number of spectral bands, and bandk (x) is the brightness value of the kth spectral band at pixel x.
取最大像元值最为最终的亮度值,b为计算的亮度值图像结果;Take the maximum pixel value as the final brightness value, and b is the calculated brightness value image result;
(b)形态学重构,如公式(2)所示:(b) Morphological reconstruction, as shown in formula (2):

其中,
(c)WTH的方向性:利用线性结构元素,使用平均值来表示WTH的方向性,如公式(3)所示:(c) Directivity of WTH: Using linear structural elements, the average value is used to represent the directionality of WTH, as shown in formula (3):

其中,dir表示线性结构元素的各个方向;由于建筑物各向是同性的,并且在所有的方向中均有较大的顶帽值,因此,建筑物的THR特征值比其他地物的大,THR特征值反映了在结构元素区域内,房屋建筑物与其周围环境的亮度差异,包含了房屋的对比度信息;Among them, dir represents all directions of linear structural elements; since buildings are isotropic and have larger top-hat values in all directions, the THR eigenvalues of buildings are larger than those of other features, The THR eigenvalue reflects the brightness difference between the building and its surrounding environment in the structural element area, and includes the contrast information of the building;
(d)建筑物多尺度分析:采用计算微分形态学剖面导数DMP(DifferentialMorphological Profiles)进行多尺度分析,如公式(4所示):(d) Multi-scale analysis of buildings: Multi-scale analysis is performed by calculating the differential morphological profile derivative DMP (Differential Morphological Profiles), as shown in formula (4):
DMPWTH(d,s)=|WTH(d,(s+Δs))-WTH(d,s)| (4)DMPWTH (d,s)=|WTH(d,(s+Δs))-WTH(d,s)| (4)
其中,d表示结构元素的方向,s表示结构元素的尺度大小,Δs表示尺度的步长;Among them, d represents the direction of the structuring element, s represents the scale of the structuring element, and Δs represents the step size of the scale;
(e)建筑物形态学指数(MBI)计算,如公式(5)所示:(e) Building Morphology Index (MBI) calculation, as shown in formula (5):
对每个尺度的DMPWTH取平均值即可得到MBI值,MBI值越大,其为建筑物的概率就越大,The MBI value can be obtained by averaging the DMPWTH of each scale. The larger the MBI value, the greater the probability that it is a building.
MBI=mean(DMPWTH) (5)。MBI=mean(DMPWTH ) (5).
从下图8中a-c中可以看出,房屋建筑物部分明显比其他地物要亮,但需要指出的是,在我们计算灾后影像的MBI指数时发现,房屋的损毁部分由于形态学剖面导数较高,导致MBI计算结果中,损毁部分相比其他房屋建筑物,数值更大,亮度更亮。图中除了一些小斑点外,影像中的损毁房屋得到明显增强,而且植被信息得到了有效的抑制。这里的小斑点与房屋建筑物区域相比面积比较小,可以被认为是噪声的影响。经过对卫星影像、机载航空影像以及无人机航拍影像的MBI指数计算,大部分的房屋以及损毁部分都呈现出较高的亮度值,光谱特征得到了有效的增强。As can be seen from a-c in Figure 8 below, the building part of the house is obviously brighter than other ground objects, but it should be pointed out that when we calculated the MBI index of the post-disaster image, we found that the damaged part of the house was due to the relatively high morphological section derivative. If the value is high, the damaged part in the MBI calculation result has a larger value and brighter brightness than other buildings. Except for some small spots in the picture, the damaged houses in the image have been significantly enhanced, and the vegetation information has been effectively suppressed. The small spots here are small compared to the building area and can be considered as the influence of noise. After calculating the MBI index of satellite images, airborne aerial images and UAV aerial images, most of the houses and damaged parts show high brightness values, and the spectral characteristics have been effectively enhanced.
2.纹理增强2. Texture enhancement
2.1.局部纹理(LBP)特征2.1. Local Texture (LBP) Features
LBP(Local Binary Pattern,局部二值模式)是一种用来描述图像局部纹理特征的算子;是一种灰度尺度不变的纹理算子,从局部邻域纹理得来,主要是用中心像素的灰度值作为阈值,与它的邻域相比较得到的二进制码来表述局部纹理特征。LBP (Local Binary Pattern, Local Binary Pattern) is an operator used to describe the local texture features of an image; it is a texture operator with constant gray scale, which is derived from the local neighborhood texture, mainly using the center The gray value of the pixel is used as a threshold, and the binary code obtained by comparing it with its neighborhood expresses the local texture feature.
改进后的LBP算子在半径为R的圆形邻域中有多个像素点,灰度值的统计方式发生改变,如公式(6)所示:The improved LBP operator has multiple pixels in the circular neighborhood of radius R, and the statistical method of gray value changes, as shown in formula (6):

其中,LBP是原始的LBP值,P是邻域点数量,R是圆形邻域的半径,ROR(LBP,i)函数将LBP的二进制序列循环右移i位;Among them, LBP is the original LBP value, P is the number of neighborhood points, R is the radius of the circular neighborhood, and the ROR(LBP,i) function cyclically shifts the binary sequence of LBP to the right by i bits;
在纹理分析方面,LBP算子是最好的纹理描述符之一,图9a-图9c展示了3种传感器影像(a快鸟卫星影像,b机载航空影像,c无人机影像)中完好房屋与损毁房屋的LBP局部纹理比较,从图中可以看出,完好与损毁房屋的纹理差别明显,LBP主要是从影像细节上突出了损毁房屋的局部纹理。In terms of texture analysis, the LBP operator is one of the best texture descriptors. Figures 9a-9c show that the three sensor images (a Kuaishou satellite image, b airborne aerial image, c drone image) are in good condition Comparing the LBP local texture of the house and the damaged house, it can be seen from the figure that the texture of the intact and damaged house is obviously different. LBP mainly highlights the local texture of the damaged house from the image details.
2.2.全局纹理(GLCM)特征2.2. Global Texture (GLCM) Features
灰度共生矩阵(Gray Level Co-occurrence Matrix,GLCM)是计算有限邻域局部范围内像元灰度级出现的频率,不同的纹理和空间位置关系会产生不同的矩阵,矩阵表示影像中地物不同的灰度级关系,以此来区分不同的纹理结构。P(i,j),(i,j=1,2,…,L-1)表示灰度共生矩阵,是一个L×L的矩阵(L为灰度级,是影像中包含的不同灰度的个数),具有空间位置关系且灰度分别为i和j的两个像素出现的次数或频率。Gray Level Co-occurrence Matrix (GLCM) is to calculate the frequency of occurrence of gray levels of pixels in the local range of a limited neighborhood. Different textures and spatial position relationships will generate different matrices. The matrix represents the ground objects in the image. Different gray level relationships are used to distinguish different texture structures. P(i,j), (i,j=1,2,...,L-1) represents the gray level co-occurrence matrix, which is an L×L matrix (L is the gray level, which is the different gray levels contained in the image ), the number or frequency of occurrences of two pixels with spatial position relationship and grayscale i and j respectively.
灰度共生矩阵已经广泛应用于纹理特征的提取,采用各种统计测度提取像素在移动窗口的共生频率,反映邻域范围内的灰度变化和纹理特征。如果邻域范围内灰度值比较平滑,GLCM主对角线像素的值较大,如果邻域范围的灰度值存在随机分布特点,GLCM中所有元素呈现相似频率。GLCM在计算的过程中应该考虑3个方面问题,GLCM测度指标的选择,移动窗口的大小,GLCM计算的基准影像。根据文献调研和多次实验,选择5个代表性的纹理测度,分别为计算影像同质性的指标Homogeneity(HOM)、Angular Second Moment(ASM),计算影像异质性的指标Entropy(ENT)、Dissimilarity(DIS)以及影像元素之间的相关性Correlation(COR)指标。The gray-level co-occurrence matrix has been widely used in the extraction of texture features. Various statistical measures are used to extract the co-occurrence frequency of pixels in the moving window, reflecting the gray-level changes and texture features in the neighborhood. If the gray value in the neighborhood is relatively smooth, the value of the main diagonal pixel of the GLCM is larger. If the gray value in the neighborhood has a random distribution, all elements in the GLCM show similar frequencies. In the calculation process of GLCM, three aspects should be considered: the selection of GLCM metrics, the size of the moving window, and the benchmark image for GLCM calculation. According to literature research and multiple experiments, five representative texture measures were selected, namely Homogeneity (HOM) and Angular Second Moment (ASM) for calculating image homogeneity, Entropy (ENT), Dissimilarity (DIS) and correlation between image elements Correlation (COR) indicators.
(a)熵代表影像的无序程度,异质性纹理区域熵值较大,当地物的纹理表现为随机性特点时,熵值最大,纹理排列整齐有序,熵值较小,如公式(7)所示;(a) Entropy represents the degree of disorder of the image. The entropy value of the heterogeneous texture area is large. When the texture of the feature is random, the entropy value is the largest, the texture is neat and orderly, and the entropy value is small, such as formula ( 7) shown;

(b)角二阶矩,是影像同质性的度量,区域内像素值越相似,同质性越高,ASM值越大,如公式(8)所示;(b) Angular second moment, which is a measure of image homogeneity, the more similar the pixel values in the region, the higher the homogeneity, and the larger the ASM value, as shown in formula (8);
ASM=∑i∑j(f(i,j))2 (8)ASM=∑i ∑j (f(i,j))2 (8)
(c)对比度表示邻域内灰度级的差异,影像的局部变化越大,其值越高,如公式(9)所示;(c) Contrast represents the difference of gray levels in the neighborhood, the greater the local change of the image, the higher its value, as shown in formula (9);

(d)相关性是影像灰度线性相关的度量,线性相关的极端情况代表完全的同质性纹理,如公式(10)所示;(d) Correlation is a measure of the linear correlation of image gray levels, and the extreme case of linear correlation represents a completely homogeneous texture, as shown in Equation (10);

(e)同质性,是对图像局部灰度均匀性的度量,图像的局部灰度均匀,同质度较大,反之,图像的灰度分布不均匀,同质度较小,如公式(11)所示;(e) Homogeneity is a measure of the uniformity of the local grayscale of the image. The local grayscale of the image is uniform and the degree of homogeneity is large. On the contrary, the grayscale distribution of the image is not uniform and the degree of homogeneity is small, such as formula ( 11) shown;

计算了多源遥感数据的全局纹理特征,包括高分辨率卫星影像、航空影像以及无人机影像的同质性、对比度、熵、角二阶矩和相关性等5大纹理指标。由于小的移动窗口能够探测到比较细致的纹理信息,同时也会产生很多斑点噪声,而较大的移动窗口能够检测大尺度的纹理,但会丢失很多地物的细节信息,使边缘很模糊。因此,窗口大小的设置要根据不同来源高分辨率影像中提取地物的目的和地物具体特征来进行具体分析和选择。因此本文比较了3种传感器影像的特征图的窗口效应影响,通过多次实验,发现大于5×5的窗口会有明显的窗口边缘效应,平滑影像细节信息,而更小的窗口又无法突出影像的局部特征,最终选择5×5移动窗口。5种纹理指标使用的是基于多光谱影像的第一主成分,多次实验表明使用主成分信息作为局部纹理的提取效果比使用单个光谱波段要好。纹理指标的计算见图10所示,HOM和ASM表示影像的局部同质性,特征值越大,代表窗口内的同质性越强,从图中可以看出,道路和房屋的特征值较大,植被、小路以及阴影的特征值较小,DIS表示影像的异质性,在影像的边缘处特征值较大,在同质性区域内,影像的亮度值变化较小,因此HOM的特征值较小。此外,通过比较3种数据源的特征图可以发现,随着影像分辨率的提高,房屋建筑物及其损毁信息得到增强,尤其是房屋损毁部分的细节信息明显增强,这主要是因为损毁部分在纹理特征上比较粗糙,在影像上呈现颗粒状,通过在一定范围内邻域测度的计算,使得小范围的局部特征值增大,各项指标的纹理测度得到增强,从而达到了房屋建筑物损毁细节局部纹理特征增强的目的。The global texture features of multi-source remote sensing data were calculated, including five major texture indicators including homogeneity, contrast, entropy, angular second moment and correlation of high-resolution satellite images, aerial images and UAV images. Since a small moving window can detect more detailed texture information, it will also generate a lot of speckle noise, while a larger moving window can detect large-scale textures, but will lose a lot of detail information of ground objects, making the edges very blurred. Therefore, the setting of the window size should be specifically analyzed and selected according to the purpose of extracting features from high-resolution images from different sources and the specific features of the features. Therefore, this paper compares the effect of the window effect of the feature maps of the three sensor images. Through many experiments, it is found that the window larger than 5×5 will have obvious window edge effect, smoothing the image details, while the smaller window cannot highlight the image. The local features of , and finally choose a 5×5 moving window. The five texture indicators use the first principal component based on multispectral images. Several experiments show that the extraction effect of using the principal component information as a local texture is better than using a single spectral band. The calculation of the texture index is shown in Figure 10. HOM and ASM represent the local homogeneity of the image. The larger the eigenvalue, the stronger the homogeneity in the window. It can be seen from the figure that the eigenvalues of roads and houses are relatively Large, the eigenvalues of vegetation, paths and shadows are small, DIS represents the heterogeneity of the image, and the eigenvalues are larger at the edge of the image. value is small. In addition, by comparing the feature maps of the three data sources, it can be found that with the increase of the image resolution, the building and its damage information is enhanced, especially the detailed information of the damaged part of the house is obviously enhanced. This is mainly because the damaged part is in the The texture features are relatively rough, and appear granular in the image. Through the calculation of the neighborhood measurement within a certain range, the local feature value in a small range is increased, and the texture measurement of each index is enhanced, thus achieving damage to buildings and buildings. The purpose of detail local texture feature enhancement.
3.增强后的纹理和光谱特征融合3. Enhanced fusion of texture and spectral features
纹理特征和光谱特征的融合方式主要是采用纹理叠加的方式:对遥感影像全局纹理和局部纹理的6个纹理信息以一定权重叠加到的La*b*颜色空间进行增强,具体方法为:The fusion method of texture feature and spectral feature mainly adopts the method of texture superposition: the six texture information of the global texture and local texture of the remote sensing image is enhanced with a certain weight and added to the La*b* color space. The specific method is as follows:
将影像第1主成分的空间纹理信息以特定权重增强,然后与La*b*颜色空间影像的第1主成分相加,获取多光谱影像增强后的第1主成分,公式为,如公式(12)所示:The spatial texture information of the first principal component of the image is enhanced with a specific weight, and then added to the first principal component of the La*b* color space image to obtain the enhanced first principal component of the multispectral image. The formula is, such as formula ( 12) shown:

其中,


三、融合光谱纹理图像进行面向对象的超像素分割3. Fusion of spectral texture images for object-oriented superpixel segmentation
传统SLIC(Simple Linear Iterative Clustering)算法是通过度量像素颜色以及邻域之间的空间关系,并依据K-means算法将像素点聚类成超像素的过程,与K-means算法相比,SLIC通过限制搜索空间降低了时间复杂度,并控制超像素的大小和紧凑度。然而传统的SLIC超像素分割算法只考虑颜色和空间信息,没有将纹理信息考虑进去。当利用该方法对灾后复杂场景影像进行分割时,尤其当房屋有多处损毁、碎屑遍布时,对象块边缘匹配度较差。针对这一不足,对传统的SLIC算法进行适当改进,结合La*b*颜色信息、空间信息,将全局局部纹理信息加入到超像素分割过程当中。The traditional SLIC (Simple Linear Iterative Clustering) algorithm is a process of clustering pixels into superpixels according to the K-means algorithm by measuring the pixel color and the spatial relationship between the neighborhoods. Restricting the search space reduces the time complexity and controls the size and compactness of superpixels. However, the traditional SLIC superpixel segmentation algorithm only considers color and spatial information, and does not take texture information into account. When this method is used to segment images of complex post-disaster scenes, especially when houses are damaged in many places and debris is scattered, the edge matching of object blocks is poor. In view of this deficiency, the traditional SLIC algorithm is appropriately improved, combined with La*b* color information and spatial information, and the global local texture information is added to the superpixel segmentation process.
利用改进的SLIC超像素生成算法对光谱纹理融合影像进行面向对象的分割,生成分布均匀、紧凑的超像素,在影像分割过程中,兼顾地物对象的光谱特征、空间特征和形状特征,生成光谱同质性以及空间特征和形状特征同质性对象。然后,利用尺度集模型并结合分形网演化算法(Fractal Net Evolution Approach,FNEA),对生成的超像素进行区域合并。超像素块区域合并的基本思想是基于像素从下向上的区域增长的分割算法,对地物光谱信息同质的对象进行合并,合并后的多个像元都赋予同一类别属性,遵循异质性最小原则。在区域合并的同时进行全局演化分析,依据最小风险贝叶斯决策规则进行基于全局演化分析的尺度集约简,最后再基于局部演化分析进行尺度集约简,进而得到最佳分割尺度。The improved SLIC superpixel generation algorithm is used to perform object-oriented segmentation of spectral texture fusion images to generate uniformly distributed and compact superpixels. Homogeneity and spatial features and shape features Homogeneity objects. Then, using the scale set model combined with the Fractal Net Evolution Approach (FNEA), the generated superpixels are merged into regions. The basic idea of superpixel block region merging is based on the segmentation algorithm that the pixels grow from the bottom to the top. The objects with homogeneous spectral information of the ground objects are merged. The merged multiple pixels are assigned the same category attribute and follow the heterogeneity. Minimum principle. The global evolution analysis is carried out while the regions are merged, the scale set reduction based on the global evolution analysis is carried out according to the minimum risk Bayesian decision rule, and finally the scale set reduction based on the local evolution analysis is carried out to obtain the optimal segmentation scale.
图11是基于增强纹理和光谱特征融合的超像素多尺度分割结果,从3种传感器影像的分割结果可以看出,房屋损毁区域的边界与其它地物较好区分开来,特别是对一些损毁的杂乱碎屑,分割的较细,边界清晰,形成数量较多的地物对象块。完好房屋和一些道路等宽阔裸露区域,分割的较为完整,对象块较大,这种不同地物的多尺度分割,利于后续的信息提取。Figure 11 shows the multi-scale segmentation results of superpixels based on the fusion of enhanced texture and spectral features. From the segmentation results of the three sensor images, it can be seen that the boundary of the damaged area of the house is well distinguished from other features, especially for some damaged areas. The cluttered debris is finely divided and the boundary is clear, forming a large number of ground object blocks. In the wide exposed areas such as intact houses and some roads, the segmentation is relatively complete, and the object blocks are large. This multi-scale segmentation of different ground objects is conducive to subsequent information extraction.
四、震后房屋损毁比值模型的构建及提取结果4. Construction and extraction results of post-earthquake housing damage ratio model
通过选择完好房屋和损毁房屋的超像素对象样本,构建多特征核概率密度,对比分析房屋样本的特征,从多特征中寻找识别损毁房屋的精准特征,从而进一步依据具体特征构建震后房屋损毁比值模型。By selecting superpixel object samples of intact houses and damaged houses, constructing multi-feature kernel probability density, comparing and analyzing the characteristics of house samples, and finding accurate features for identifying damaged houses from multiple features, so as to further construct post-earthquake house damage ratios based on specific characteristics. Model.
1.损毁房屋样本与完好房屋样本多特征核概率密度比较分析;1. Comparative analysis of multi-feature kernel probability density between damaged house samples and intact house samples;
概率密度函数f的表达如公式(13)所示:The expression of the probability density function f is shown in formula (13):

其中,K(.)为核函数,h>0,是一个窗口函数,也被称作带宽,

可以用标准正态分布的密度函数作为K,高斯内核方便的数学性质,也经常使用K(x)=φ(x),φ(x)为标准正态概率密度函数;公式(13)可以简化为公式(14):The density function of the standard normal distribution can be used as K, a convenient mathematical property of the Gaussian kernel, and K(x)=φ(x) is often used, and φ(x) is the standard normal probability density function; Equation (13) can be simplified is formula (14):

从图12a-图12o得到损毁房屋样本与完好房屋样本的核概率密度比较图可以看出,在光谱特征、形状特征中,完好房屋和损毁房屋的样本较难区分;纹理特征中的熵值(图12i)和角二阶矩(图12k)2个特征能够很好地将损毁房屋从复杂场景中区分出来;实现房屋损毁信息的精准提取。熵值的大小代表图像中信息含量的多少,熵值越大表示影像中含有的信息量越丰富,或是影像中信息分布越不均匀。地震导致的房屋损毁区域,其信息量较大,因此熵值也较大;相反,其他正常完好房屋的灰度较为均匀,信息量少,熵值也相对较小,因此根据目标区域的熵值大小就能对完好与损毁房屋进行较好的区分。From Figure 12a-Figure 12o, it can be seen that in the spectral features and shape features, the samples of intact houses and damaged houses are more difficult to distinguish; the entropy value in the texture features ( Figure 12i) and angular second-order moment (Figure 12k) two features can well distinguish damaged houses from complex scenes; achieve accurate extraction of house damage information. The size of the entropy value represents the amount of information in the image, and the larger the entropy value is, the richer the amount of information contained in the image, or the more uneven the distribution of information in the image. The damage area of the house caused by the earthquake has a large amount of information, so the entropy value is also large; on the contrary, the grayscale of other normal and intact houses is relatively uniform, the amount of information is small, and the entropy value is relatively small, so according to the entropy value of the target area Size allows a better distinction between intact and damaged homes.
通过统计大量的样例感兴趣区(ROI)熵值得出,当ROI中含有损毁房屋时,熵值较大,当ROI中不含损毁房屋时,分为2种情况,一种为纯道路区域,另一种包含房屋、植被或其他背景信息,纯路面部分的熵值较小,基本上不超过1.8;通过阈值方法可以较好的滤除灰度值均匀的路面等背景信息。By counting a large number of sample regions of interest (ROI) entropy values, when the ROI contains damaged houses, the entropy value is larger, and when the ROI does not contain damaged houses, it is divided into two cases, one is pure road area , the other contains houses, vegetation or other background information, and the entropy value of the pure pavement part is small, basically not exceeding 1.8; the threshold method can better filter out the background information such as pavement with uniform gray value.
地震导致的房屋损毁区域,信息量大,因此熵值也大;相反,其他正常完好房屋的灰度较为均匀,信息量少,熵值也相对小;熵值大小能对完好与损毁房屋进行较好的区分;角二阶矩是图像灰度分布均匀程度和纹理粗细的一个度量,当图像纹理绞细致、灰度分布均匀时,能量值较大,反之,较小。完好房屋的角二阶矩能量值大,房屋损毁部分由于分布不均匀,纹理粗糙,角二阶矩值小;The damaged area of the house caused by the earthquake has a large amount of information, so the entropy value is also large; on the contrary, the grayscale of other normal and intact houses is relatively uniform, the amount of information is small, and the entropy value is relatively small; the entropy value can compare the intact and damaged houses. Good distinction; angular second-order moment is a measure of the uniformity of image grayscale distribution and texture thickness. When the image texture is finely twisted and the grayscale distribution is uniform, the energy value is larger, otherwise, the energy value is smaller. The energy value of the second-order moment of the angle of the intact house is large, and the damaged part of the house has a small value of the second-order moment of the angle due to uneven distribution and rough texture;
2.面向对象的熵值和角二阶矩测度栅格表达2. Object-oriented entropy and angular second-order moment measure grid expression
通过房屋样本的分析,得出面向对象的熵值和角二阶矩特征图像,将特征分割结果转为与原始影像相同分辨率的栅格数据,进行多传感器平台遥感影像特征的栅格表达,如图13所示。与基于像素特征的影像相比,对于存在大量“同谱异质”和“同质异谱”的地物类别,面向对象的特征表达得到有效的改善,对于损毁信息的精准提取具有重要的作用。Through the analysis of the house samples, the object-oriented entropy and angular second-order moment feature images are obtained, and the feature segmentation results are converted into raster data with the same resolution as the original image, and the raster representation of the features of the multi-sensor platform remote sensing image is carried out. As shown in Figure 13. Compared with the image based on pixel features, the object-oriented feature expression is effectively improved for the ground object categories with a large number of "homogeneous and heterogeneous" and "homogeneous spectrum", which plays an important role in the accurate extraction of damage information. .
熵值特征图像:灾后大量房屋受到损坏,损毁后存在大量的瓦砾废墟,增加纹理的复杂度;损毁信息比完好房屋、道路要复杂,熵值较大,完好的居民点、道路、水体纹理简单,对应的熵值较小;Entropy feature image: After the disaster, a large number of houses were damaged, and there were a large number of rubble and ruins after the damage, which increased the complexity of the texture; the damage information is more complex than the intact houses and roads, and the entropy value is larger, and the intact settlements, roads, and water bodies have simple textures , the corresponding entropy value is small;
角二阶矩特征图像:损毁部分的纹理粗糙,灰度分布不均匀,能量值较小,呈现出亮度偏黑,而完好的房屋居民点和道路纹理细致,灰度均匀,纹理较细致。Corner second-order moment feature image: The texture of the damaged part is rough, the grayscale distribution is uneven, the energy value is small, and the brightness is dark, while the intact houses and roads have fine texture, uniform grayscale, and fine texture.
从图13a-图13c可以看出,在卫星影像、机载航空影像以及无人机影像上,损毁的房屋熵值特征具有显著差异,且各有特点。随着影像分辨率的提高,灾后大量倒塌房屋纹理更加清晰,废墟以及碎屑的纹理也更加复杂,熵值特征图像的亮度值增大,损毁废墟碎屑与完好房屋从复杂的场景中更加清晰的区分开来。从熵值特征的基础理论分析也可以发现,影像越清晰,所包含的有用信息越多,熵值代表影像中地物信息量的纹理复杂程度,灾后大量房屋受到损坏,损毁后存在大量的瓦砾等废墟,增加了纹理的复杂度。损毁信息比完好房屋、道路等要复杂的多,熵值较大,而完好的居民点、道路、水体等纹理简单,对应的熵值较小,这与上述损毁样本与完好房屋样本进行统计的结果相印证,熵值特征对于损毁信息和完好信息的区分度较好。从图中的角二阶矩特征值可以看出,损毁部分的纹理粗糙,灰度分布不均匀,能量值较小,呈现出亮度偏黑,而完好的房屋居民点和道路纹理细致,灰度均匀,纹理较细致,这与灾后的损毁废墟形成了强烈的反差,正好可以利用角二阶矩特征将完好房屋和道路进行滤去,有利于简化下一步损毁模型构建的复杂程度。图13a-图13c中3种类型的高分辨率遥感数据角二阶矩特征值均呈现出较小的特点,与灾后样例影像中存在大量的损毁碎屑有关,角二阶矩反映影像中地物的能量特征,值的大小表明地物均匀与规则与否的纹理模式。例如无人机样例影像中,完好的房屋居民点可以通过角二阶矩特征图清晰的表现出来,损毁碎屑废墟亮度值极小。这种特征反差有利于增强损毁信息细节,对损毁信息精确提取。It can be seen from Figures 13a-13c that the entropy characteristics of damaged houses are significantly different in satellite images, airborne aerial images and UAV images, and each has its own characteristics. With the improvement of image resolution, the texture of a large number of collapsed houses after the disaster is clearer, the texture of ruins and debris is also more complex, the brightness value of the entropy feature image increases, and the damaged debris and intact houses are more clear from complex scenes. of distinction. It can also be found from the basic theoretical analysis of entropy characteristics that the clearer the image, the more useful information it contains. The entropy value represents the texture complexity of the ground object information in the image. After the disaster, a large number of houses were damaged, and there were a lot of rubble after the damage. and other ruins, increasing the complexity of the texture. The damage information is much more complex than the intact houses, roads, etc., and the entropy value is large, while the intact settlements, roads, water bodies, etc. have simple textures, and the corresponding entropy values are small. The results confirm that the entropy feature can distinguish the damaged information from the intact information better. From the eigenvalues of the second-order moment of the angle in the figure, it can be seen that the texture of the damaged part is rough, the grayscale distribution is uneven, the energy value is small, and the brightness is dark, while the intact houses and roads have fine texture and grayscale. The texture is uniform and the texture is finer, which forms a strong contrast with the damaged ruins after the disaster. It is just possible to use the angular second-order moment feature to filter out the intact houses and roads, which is conducive to simplifying the complexity of the damage model construction in the next step. The eigenvalues of the three types of high-resolution remote sensing data in Fig. 13a-Fig. 13c all show small angular second moment eigenvalues, which are related to the existence of a large number of damaged debris in the post-disaster sample images. The angular second moment reflects the The energy characteristic of the object, the value of which indicates the uniformity and regularity of the texture pattern of the object. For example, in the UAV sample image, the intact housing settlements can be clearly represented by the angular second-order moment feature map, and the brightness value of the damaged debris and ruins is extremely small. This feature contrast is conducive to enhancing the details of damage information and accurately extracting damage information.
3.面向对象的房屋损毁比值模型构建3. Construction of object-oriented housing damage ratio model
通过对房屋熵值和角二阶矩值分析,为了进一步提取出灾后损毁房屋信息,并且通过上述分析可知,损毁部分熵值明显较大,值大的对象块有很大概率是损毁的房屋废墟碎屑等,而未损坏房屋、道路等的角二阶矩值较大,灾后完好部分明显比其他部分要亮。我们通过2个纹理测度构建了一个新的指数模型,面向对象的房屋损毁比值模型(ObjectBased Damage Ratio Index,OBDRI),该指数通过变换熵值和角二阶矩指数相除得到,如公式(15)所示:Through the analysis of house entropy value and angular second-order moment value, in order to further extract the damaged house information after the disaster, and through the above analysis, it can be seen that the entropy value of the damaged part is obviously larger, and the object block with a large value has a high probability of being damaged house ruins Debris, etc., while undamaged houses, roads, etc. have larger angular second moment values, and the intact parts after the disaster are obviously brighter than other parts. We constructed a new exponential model through two texture measures, the Object-Based Damage Ratio Index (OBDRI), which is obtained by dividing the transform entropy value and the angular second-order moment index, as shown in formula (15). ) as shown:

通过面向对象的房屋损毁比值模型图像,如图14a-图14c所示:损毁房屋部分明显得到了增强,与背景具有较强的区分度,所提取的该指数能够针对多传感器平台将震后房屋损毁信息提取出来。为了使提取结果更加精确和完整,后续我们通过自适应阈值的确定,分离损毁部分。从比值图像中不难看出,损毁部分在OBDRI指数图像中呈现较高的值,大幅增加了损毁区域与非损毁区域对象块灰度值之间的差异性,统计结果表明OBDRI在城镇环境下将损毁区域提取出来效果较为稳定。另外,城市房屋居民点在指数图像中的亮度值较大,这与城市建成区中包含的地物种类较多,不仅有裸土,还有树木和水体等有一定关系。Through the object-oriented house damage ratio model image, as shown in Figure 14a-Figure 14c: the damaged house part is obviously enhanced, and has a strong degree of discrimination with the background. Destruction information is extracted. In order to make the extraction results more accurate and complete, we subsequently separate the damaged parts through the determination of adaptive thresholds. It is not difficult to see from the ratio image that the damaged part has a higher value in the OBDRI index image, which greatly increases the difference between the gray value of the object block in the damaged area and the non-damaged area. The effect of extracting the damaged area is relatively stable. In addition, the brightness value of urban housing settlements in the index image is relatively large, which is related to the variety of ground objects contained in urban built-up areas, including not only bare soil, but also trees and water bodies.
4.基于回归树(CART树)的损毁房屋阈值自适应确定4. Adaptive determination of damaged house threshold based on regression tree (CART tree)
阈值的确定主要通过回归方法得到,首先在对数据集分析的基础上,利用已知的多变量数据构建预测准则,进而根据其它变量值对一个变量进行预测,其中数据集包含了被预测变量数据和相关变量数据。CART回归树采用的是一种二分递归分割技术,将当前样本分成两个子样本集,使得生成的非叶子节点都有两个分支,是一种典型的二叉决策树,主要用于分类或者回归。如果待预测结果是连续型数据,则CART生成回归决策树,这种回归决策树的目的是通过二元决策树来建立一套准确的数据分类器,对新的事例进行预测(目标变量为连续变量)。回归树采用基尼指数来选择最优的切分特征,而且每次通过二分来完成,再以局部分段拟合的形式代替全局拟合,达到提高估计精度的目的。The determination of the threshold is mainly obtained by the regression method. First, on the basis of the analysis of the data set, the known multivariate data is used to construct a prediction criterion, and then a variable is predicted according to the values of other variables. The data set contains the data of the predicted variable. and related variable data. The CART regression tree adopts a binary recursive segmentation technology, which divides the current sample into two sub-sample sets, so that the generated non-leaf nodes have two branches. It is a typical binary decision tree and is mainly used for classification or regression. . If the result to be predicted is continuous data, CART generates a regression decision tree. The purpose of this regression decision tree is to establish a set of accurate data classifiers through a binary decision tree to predict new cases (the target variable is continuous variable). The regression tree uses the Gini index to select the optimal segmentation feature, and it is completed by bisection each time, and then the global fitting is replaced by the local segmental fitting to achieve the purpose of improving the estimation accuracy.
在灾后影像中,分别选择训练样本和测试样本,将训练样本划分为2部分,一部分为测试变量,一部分为目标变量。将测试变量和目标变量都导入到决策树当中,通过循环分析形成二叉决策树。通常情况下,在决策树生成之后,需要采用C4.5/5.0决策树进行修剪,否则容易造成目标的过度拟合。C4.5/5.0决策树是通过指定树的最大层数,叶节点最小样本数,需要调整大量参数才能限制树的过度生长。而本章节采用的CART树区别在于,等树的节点停止生长之后再利用检验样本对决策树进行剪枝,得出目标变量的预测精度和错分率。再通过设定合适的阈值对树节点进行限制。CART树模型简单,易于理解,能够自动选择特征,自动确定阈值,使用递归分区方法对训练记录进行分组,在每个节点处选择合适的预测变量,决策树的每个节点处都采用二元分割方式,其中高分辨率遥感影像中的房屋损毁信息即对应目标变量。对于地物多类别的最佳测试变量(分类特征)和分割阈值(特征阈值)的选择,CART决策树主要使用基尼系数,这也是其一大优势所在,损毁精度得到了保证。其中基尼系数的定义如下:In the post-disaster images, the training samples and the test samples are selected respectively, and the training samples are divided into two parts, one part is the test variable and the other part is the target variable. Import both test variables and target variables into the decision tree, and form a binary decision tree through loop analysis. Usually, after the decision tree is generated, it is necessary to use the C4.5/5.0 decision tree for pruning, otherwise it is easy to cause overfitting of the target. The C4.5/5.0 decision tree is to limit the overgrowth of the tree by specifying the maximum number of layers of the tree and the minimum number of samples of leaf nodes. A large number of parameters need to be adjusted. The difference between the CART tree used in this chapter is that after the nodes of the tree stop growing, the test sample is used to prune the decision tree to obtain the prediction accuracy and misclassification rate of the target variable. The tree nodes are then restricted by setting appropriate thresholds. The CART tree model is simple and easy to understand, with the ability to automatically select features, automatically determine thresholds, use recursive partitioning methods to group training records, select appropriate predictors at each node, and use binary partitioning at each node of the decision tree method, in which the house damage information in the high-resolution remote sensing image corresponds to the target variable. For the selection of the best test variables (classification features) and segmentation thresholds (feature thresholds) for multiple categories of ground objects, the CART decision tree mainly uses the Gini coefficient, which is also one of its major advantages, and the damage accuracy is guaranteed. The Gini coefficient is defined as follows:


其中,p(j/h)表示从训练样本集中随机抽取的某一个样本,当特征值为h时,该样本属于第j类的概率;nj(h)表示训练样本中特征值为h时,该样本属于第j类的样本个数;n(h)表示训练样本中特征值为h时的所有样本个数。Among them, p(j/h) represents a sample randomly selected from the training sample set, when the feature value is h, the probability that the sample belongs to the jth class; nj (h) represents when the feature value in the training sample is h , the number of samples belonging to the jth class; n(h) represents the number of all samples in the training sample when the feature value is h.
根据阈值自适应确定方法,利用CART回归树确定文中卫星样例影像、机载航空影像以及无人机影像的损毁房屋阈值取值。According to the threshold self-adaptive determination method, the CART regression tree is used to determine the damaged house threshold values of the satellite sample images, airborne aerial images and UAV images in this paper.
5.房屋损毁信息提取结果5. Results of house damage information extraction
图15是基于高分辨率多源遥感数据的灾后房屋损毁信息提取结果,图中红色部分表示提取的损毁区域。结合实验数据的原始图像我们发现,大部分损毁房屋区域在指数图像中都呈现出较高的亮度值,且每个对象块之间的差异性明显。图15c中的机载航空数据房屋建筑物是最难提取的,因为大部分的损毁房屋信息与周围道路都呈现相似的光谱信息,如果不是辅助数学形态学的纹理,即使肉眼也很难辨别房屋建筑物与复杂背景地物之间的差异。从图中提取结果可以看出,本章节提出的方法提取的房屋损毁信息成功保留了其块状和细节特征,对卫星影像提取的结果夹杂着一些道路及其周边的空地信息(图15a),这主要是由于一些本属于阴影的像元在多尺度分割中被错分到房屋区域对象块当中,或是一些损毁房屋小斑块被漏分到背景地物当中。因此会对后期模型提取房屋损毁信息产生一定的影响。在图15e无人机影像损毁信息提取结果中,除了几栋完好的房屋保存较为完整,且边界清晰,影像中其他大部分区域均倒塌,变为废墟,有一些面积较小的未受损建筑物夹杂在废墟中间,在图中表现为斑块较小的区域。为了客观分析房屋损毁信息的提取效果,我们根据原始影像对损毁部分进行人工目视勾画,勾画时主要考虑到完整性,对面积较小的琐碎部分存在一定的遗漏。对比提取效果可以发现,大块的损毁部分均较好的提取出,很多面积小的废墟或碎屑也被较好的提取出来,有效剔除了一些复杂的植被、道路、裸地等背景地物。Figure 15 is the extraction result of post-disaster house damage information based on high-resolution multi-source remote sensing data. The red part in the figure represents the extracted damaged area. Combined with the original images of the experimental data, we found that most of the damaged house areas show high brightness values in the index image, and the differences between each object block are obvious. The airborne aerial data houses and buildings in Figure 15c are the most difficult to extract, because most of the damaged house information presents similar spectral information to the surrounding roads. If it is not for the texture of auxiliary mathematical morphology, it is difficult to distinguish the houses even with the naked eye. Differences between buildings and complex background figures. From the extraction results in the figure, it can be seen that the house damage information extracted by the method proposed in this chapter successfully retains its blocky and detailed characteristics, and the results extracted from the satellite image are mixed with some road and surrounding open space information (Figure 15a). This is mainly because some pixels that belong to the shadow are wrongly classified into the object blocks of the house area in the multi-scale segmentation, or some small patches of damaged houses are missed into the background objects. Therefore, it will have a certain impact on the later model extraction of house damage information. In Figure 15e, in the extraction results of the damage information of the drone image, except for a few intact houses that are relatively well preserved and have clear boundaries, most of the other areas in the image have collapsed and become ruins, and there are some small undamaged buildings. Objects are interspersed in the ruins, which are shown as areas with smaller plaques in the picture. In order to objectively analyze the extraction effect of house damage information, we manually delineated the damaged part according to the original image, and the completeness was mainly considered during the delineation, and there were certain omissions for the trivial part with a small area. Comparing the extraction results, it can be found that the large damaged parts are well extracted, and many small ruins or debris are also well extracted, effectively eliminating some complex vegetation, roads, bare ground and other background features .
综上所述,本章节提出的新模型可以很好的将大部分灾后房屋损毁信息提取出来,对于房屋分布比较规则的城镇街区,提取的方法对道路和裸地更为敏感,在检测过程中大量被错分为房屋建筑物的对象块被剔除,为高分辨率影像提取灾后房屋损毁信息提供了一种新的方法思路。To sum up, the new model proposed in this chapter can extract most of the post-disaster house damage information very well. For urban blocks with relatively regular house distribution, the extraction method is more sensitive to roads and bare land. A large number of object blocks that were mistakenly classified as houses and buildings were eliminated, which provided a new method idea for extracting post-disaster house damage information from high-resolution images.
6.损毁提取结果精度分析6. Accuracy analysis of damage extraction results
为了对提出的新模型进行深入的评估,我们对每景影像的提取结果与地面真实情况进行了统计分析,分别计算了Kappa系数、总体精度(OA)、漏分误差(OE)和错分误差(CE)以及房屋面积的倒塌率,来衡量本章新模型提取结果的鲁棒性。从表2中可以看出,实验数据的Kappa系数都到达0.5,且总体精度都达到了70%以上,在提取损毁信息的过程中,漏分误差较低,错分误差较高,这主要是因为影像是先通过面向对象的分割,再进行分类提取,当遇到损毁房屋或完好房屋与周边地物之间有相似的光谱和纹理信息时,难以对这些小的对象块进行正确的分割。对于本章节模型而言,房屋特有特征应该被更多考虑进来,从而能够使得房屋损毁信息提取更加精准。同时,通过房屋损毁的面积计算出房屋损毁率,卫星影像中,绝大部分房屋倒塌损毁,损毁率达81.25%;在海地地震的机载航空影像中,街区中房屋倒塌较为分散,房屋损毁率为43.65%;对于文中无人机样例影像,大部分房屋损毁严重,损毁率为75.80%,根据区域房屋损毁率情况,为灾后救援和评估提供有效的指导。In order to conduct an in-depth evaluation of the proposed new model, we perform a statistical analysis of the extraction results of each scene image and the ground truth, and calculate the Kappa coefficient, overall accuracy (OA), omission error (OE) and misclassification error, respectively. (CE) and the collapse rate of the house area to measure the robustness of the extraction results of the new model in this chapter. It can be seen from Table 2 that the Kappa coefficients of the experimental data all reach 0.5, and the overall accuracy has reached more than 70%. In the process of extracting damage information, the error of missing classification is low, and the error of misclassification is high, which is mainly due to Because the image is firstly segmented by object-oriented, and then classified and extracted, it is difficult to correctly segment these small object blocks when encountering similar spectral and texture information between damaged houses or intact houses and surrounding objects. For the model in this chapter, the house-specific features should be taken into account more accurately, so that the house damage information can be extracted more accurately. At the same time, the damage rate of houses was calculated based on the area of the damaged houses. In the satellite images, most of the houses were collapsed and damaged, with a damage rate of 81.25%; in the airborne aerial images of the Haiti earthquake, the collapsed houses in the blocks were scattered, and the damage rate of the houses was 81.25%. 43.65%; for the UAV sample images in the text, most of the houses are seriously damaged, and the damage rate is 75.80%. According to the regional house damage rate, it provides effective guidance for post-disaster rescue and assessment.
表2房屋损毁信息提取结果分析Table 2 Analysis of house damage information extraction results
小结:summary:
前人对灾后信息提取做了一定的探索,但由于受到影像分辨率、光谱特征不可分以及地物存在大量混合像元等局限,在提取精度和效率上不高。本本申请根据高分辨率影像的特点和房屋损毁信息提取的任务,原创性提出基于多尺度光谱纹理特征自适应融合的房屋损毁模型OBDRI,针对影像特征实施面向对象的分析方法,快速提取房屋损毁信息,具有一定的优势。The predecessors have made some explorations on post-disaster information extraction, but due to the limitations of image resolution, inseparable spectral features, and the existence of a large number of mixed pixels in ground objects, the extraction accuracy and efficiency are not high. According to the characteristics of high-resolution images and the task of extracting house damage information, this application originally proposes a house damage model OBDRI based on adaptive fusion of multi-scale spectral texture features, and implements an object-oriented analysis method for image features to quickly extract house damage information. , has certain advantages.
针对高分辨率影像的特征来实现面向对象分析,融合了光谱特征和纹理特征,进行超像素分割,强化了纹理特征在信息提取中的应用,实现了纹理特征和光谱特征的像素级增强和特征级融合,进而构建震后房屋损毁指数模型。The object-oriented analysis is implemented for the features of high-resolution images, and the spectral features and texture features are combined to perform superpixel segmentation, which strengthens the application of texture features in information extraction, and realizes pixel-level enhancement and features of texture features and spectral features. Level fusion, and then build a post-earthquake house damage index model.
根据面向对象的分析思想,文中改进了SLIC超像素生成算法,对特征图像进行分割,生成均匀紧凑的超像素,然后利用尺度集模型并结合分形网演化算法(FNEA),进行区域合并,并进行全局演化分析,最后依据最小风险贝叶斯决策规则进行尺度集约简,选择地物最佳尺度,合理构建层次结构。According to the object-oriented analysis idea, the SLIC superpixel generation algorithm is improved, and the feature image is segmented to generate uniform and compact superpixels. The global evolution analysis is carried out, and finally the scale is reduced according to the minimum risk Bayesian decision rule, and the optimal scale of the ground objects is selected, and the hierarchical structure is reasonably constructed.
文中将筛选出的熵值和角二阶矩特征图像转化为与原始影像相同分辨率的栅格数据,与基于像素特征的影像相比,进行了栅格表达的特征图像,在大量“同谱异质”和“同质异谱”的地物类别识别上,能够对面向对象的特征表达起到有效的改善。In this paper, the screened entropy and angular second-order moment feature images are converted into raster data with the same resolution as the original image. It can effectively improve the object-oriented feature expression in the recognition of ground object categories of "heterogeneous" and "homogeneous and heterogeneous".
为了验证文中提出的OBDRI房屋损毁模型的效果,我们用3幅高分辨率卫星影像(玉树震后)、机载航空影像(海地震后)以及无人机影像(玉树震后),进行详细的算法分析和测试。验证用的参考影像是由人工对损毁区域边界进行目视勾画,结果显示,本文提出的模型总体精度分别为76.7589%、75.3561%和83.2540%,说明算法对多源数据损毁信息提取的适用性。In order to verify the effect of the OBDRI house damage model proposed in this paper, we used 3 high-resolution satellite images (after the Yushu earthquake), airborne aerial images (after the Hai earthquake) and UAV images (after the Yushu earthquake) to conduct detailed Algorithm analysis and testing. The reference image used for verification is manually delineated the boundary of the damaged area. The results show that the overall accuracy of the model proposed in this paper is 76.7589%, 75.3561% and 83.2540%, respectively, indicating the applicability of the algorithm to multi-source data damage information extraction.
显然,上述实施例仅仅是为清楚地说明所作的举例,而并非对实施方式的限定。对于所属领域的普通技术人员来说,在上述说明的基础上还可以做出其它不同形式的变化或变动。这里无需也无法对所有的实施方式予以穷举。而由此所引伸出的显而易见的变化或变动仍处于本专利申请权利要求的保护范围之中。Obviously, the above-mentioned embodiments are only examples for clear description, and are not intended to limit the implementation manner. For those of ordinary skill in the art, changes or modifications in other different forms can also be made on the basis of the above description. There is no need and cannot be exhaustive of all implementations here. However, the obvious changes or changes derived from this are still within the protection scope of the claims of this patent application.
Claims (4)
Translated fromChinese


Priority Applications (1)
| Application Number | Priority Date | Filing Date | Title |
|---|---|---|---|
| CN201910585703.8ACN110309781B (en) | 2019-07-01 | 2019-07-01 | House damage remote sensing identification method based on multi-scale spectrum texture self-adaptive fusion |
Applications Claiming Priority (1)
| Application Number | Priority Date | Filing Date | Title |
|---|---|---|---|
| CN201910585703.8ACN110309781B (en) | 2019-07-01 | 2019-07-01 | House damage remote sensing identification method based on multi-scale spectrum texture self-adaptive fusion |
Publications (2)
| Publication Number | Publication Date |
|---|---|
| CN110309781A CN110309781A (en) | 2019-10-08 |
| CN110309781Btrue CN110309781B (en) | 2021-03-02 |
Family
ID=68079624
Family Applications (1)
| Application Number | Title | Priority Date | Filing Date |
|---|---|---|---|
| CN201910585703.8AActiveCN110309781B (en) | 2019-07-01 | 2019-07-01 | House damage remote sensing identification method based on multi-scale spectrum texture self-adaptive fusion |
Country Status (1)
| Country | Link |
|---|---|
| CN (1) | CN110309781B (en) |
Families Citing this family (13)
| Publication number | Priority date | Publication date | Assignee | Title |
|---|---|---|---|---|
| CN111339948B (en)* | 2020-02-25 | 2022-02-01 | 武汉大学 | Automatic identification method for newly-added buildings of high-resolution remote sensing images |
| CN111626965B (en)* | 2020-06-04 | 2021-03-16 | 成都星时代宇航科技有限公司 | Remote sensing image processing method, device, electronic equipment and storage medium |
| CN111798383B (en)* | 2020-06-09 | 2022-06-14 | 武汉大学 | An Enhancement Method for High Resolution Night Light Image |
| CN114547763B (en)* | 2020-11-27 | 2024-10-22 | 北京理工大学 | Aircraft command control computer system |
| CN112837254B (en)* | 2021-02-25 | 2024-06-11 | 普联技术有限公司 | Image fusion method and device, terminal equipment and storage medium |
| CN113240689A (en)* | 2021-06-01 | 2021-08-10 | 安徽建筑大学 | Method for rapidly extracting flood disaster area |
| CN113436090A (en)* | 2021-06-16 | 2021-09-24 | 中国电子科技集团公司第五十四研究所 | Remote sensing image spectrum and texture feature fusion extraction method |
| CN114359756B (en)* | 2022-01-06 | 2025-02-11 | 中国科学院空天信息创新研究院 | A rapid and intelligent detection method for damaged houses using remote sensing images from UAVs after an earthquake |
| CN114842262A (en)* | 2022-05-10 | 2022-08-02 | 中国南方电网有限责任公司超高压输电公司检修试验中心 | Laser point cloud ground object automatic identification method fusing line channel orthographic images |
| CN114782846B (en)* | 2022-06-20 | 2022-11-08 | 绵阳天仪空间科技有限公司 | Post-disaster rescue guiding system and method |
| CN117252789B (en)* | 2023-11-10 | 2024-02-02 | 中国科学院空天信息创新研究院 | Shadow reconstruction method and device for high-resolution remote sensing image and electronic equipment |
| CN117392500B (en)* | 2023-12-12 | 2024-04-23 | 国网天津市电力公司信息通信公司 | Remote sensing image characteristic enhancement method and system for trees and crops |
| CN119478842B (en)* | 2025-01-15 | 2025-08-05 | 绵阳师范学院 | A plant specimen classification system and method integrating multi-scale directional texture features |
Citations (2)
| Publication number | Priority date | Publication date | Assignee | Title |
|---|---|---|---|---|
| CN105513060A (en)* | 2015-11-30 | 2016-04-20 | 中国人民解放军海军航空工程学院 | Visual perception enlightening high-resolution remote-sensing image segmentation method |
| CN107330875A (en)* | 2017-05-31 | 2017-11-07 | 河海大学 | Based on the forward and reverse heterogeneous water body surrounding enviroment change detecting method of remote sensing images |
Family Cites Families (2)
| Publication number | Priority date | Publication date | Assignee | Title |
|---|---|---|---|---|
| CN102005022A (en)* | 2010-10-19 | 2011-04-06 | 中国科学院遥感应用研究所 | Method for comprehensively evaluating casualty loss of link disaster by remote sensing |
| CN109408965B (en)* | 2018-10-26 | 2023-04-28 | 中国地震局地球物理研究所 | House vibration damage matrix curvonic analysis system and method based on earthquake vibration parameters |
- 2019
- 2019-07-01CNCN201910585703.8Apatent/CN110309781B/enactiveActive
Patent Citations (2)
| Publication number | Priority date | Publication date | Assignee | Title |
|---|---|---|---|---|
| CN105513060A (en)* | 2015-11-30 | 2016-04-20 | 中国人民解放军海军航空工程学院 | Visual perception enlightening high-resolution remote-sensing image segmentation method |
| CN107330875A (en)* | 2017-05-31 | 2017-11-07 | 河海大学 | Based on the forward and reverse heterogeneous water body surrounding enviroment change detecting method of remote sensing images |
Non-Patent Citations (3)
| Title |
|---|
| Feature Selection Method Based on High-Resolution Remote Sensing Images and the Effect of Sensitive Features on Classification Accuracy;Yi Zhou 等;《MDPI》;20180622;第1-16页* |
| 不同特征融合的震后损毁建筑物识别研究;李强 等;《地震研究》;20160731;第39卷(第3期);第486-493页* |
| 利用灰度共生矩阵纹理特征识别空心村损毁建筑物的方法;谢嘉丽 等;《测绘通报》;20171231(第12期);全文* |
Also Published As
| Publication number | Publication date |
|---|---|
| CN110309781A (en) | 2019-10-08 |
Similar Documents
| Publication | Publication Date | Title |
|---|---|---|
| CN110309781B (en) | House damage remote sensing identification method based on multi-scale spectrum texture self-adaptive fusion | |
| CN103632363B (en) | Object level high-resolution remote sensing image change detecting method based on Multiscale Fusion | |
| CN103559500B (en) | A kind of multi-spectral remote sensing image terrain classification method based on spectrum Yu textural characteristics | |
| Huang et al. | A multidirectional and multiscale morphological index for automatic building extraction from multispectral GeoEye-1 imagery | |
| CN107330875B (en) | A detection method for environmental changes around water bodies based on forward and reverse heterogeneity of remote sensing images | |
| CN107392968B (en) | Image saliency detection method fused with color contrast map and color space distribution map | |
| CN108805057B (en) | SAR image reservoir area detection method based on joint significance analysis | |
| CN107341813B (en) | SAR Image Segmentation Method Based on Structural Learning and Sketch Feature Inference Network | |
| CN105335966A (en) | Multi-scale remote-sensing image segmentation method based on local homogeneity index | |
| WO2018076138A1 (en) | Target detection method and apparatus based on large-scale high-resolution hyper-spectral image | |
| CN115690086A (en) | Object-based high-resolution remote sensing image change detection method and system | |
| Huang et al. | A top-down strategy for buildings extraction from complex urban scenes using airborne LiDAR point clouds | |
| CN110147795A (en) | A kind of adaptive non local fuzzy C-means clustering SAR image partitioning algorithm | |
| CN105427313B (en) | SAR image segmentation method based on deconvolution network and adaptive inference network | |
| CN107977660A (en) | Region of interest area detecting method based on background priori and foreground node | |
| CN109409389B (en) | A multi-feature fusion object-oriented change detection method | |
| CN103839267A (en) | Building extracting method based on morphological building indexes | |
| CN111340761B (en) | Remote sensing image change detection method based on fractal attribute and decision fusion | |
| CN109886146A (en) | Remote sensing intelligent collection method and equipment for flood disaster information based on machine vision detection | |
| CN115147746B (en) | Saline-alkali geological identification method based on unmanned aerial vehicle remote sensing image | |
| CN107992856B (en) | High-resolution remote sensing building shadow detection method in urban scene | |
| CN107292328A (en) | The remote sensing image shadow Detection extracting method and system of multiple dimensioned multiple features fusion | |
| CN113628234A (en) | A saliency polarimetric SAR image change detection method based on comprehensive neighborhood information | |
| CN115019163A (en) | Identification method of urban elements based on multi-source big data | |
| CN110310263B (en) | A method for detecting residential areas in SAR images based on saliency analysis and background priors |
Legal Events
| Date | Code | Title | Description |
|---|---|---|---|
| PB01 | Publication | ||
| PB01 | Publication | ||
| SE01 | Entry into force of request for substantive examination | ||
| SE01 | Entry into force of request for substantive examination | ||
| TA01 | Transfer of patent application right | Effective date of registration:20210205 Address after:No. 9 Dengzhuang South Road, Haidian District, Beijing 100094 Applicant after:Aerospace Information Research Institute,Chinese Academy of Sciences Address before:100101 Beijing Chaoyang District Andingmen Datun Road No. 20 North Applicant before:Institute of Remote Sensing and Digital Earth, Chinese Academy of Sciences | |
| TA01 | Transfer of patent application right | ||
| GR01 | Patent grant | ||
| GR01 | Patent grant |