CN110084771B - A multi-algorithm optimization fusion method for dual-modal infrared image segmentation based on set-valued mapping - Google Patents
A multi-algorithm optimization fusion method for dual-modal infrared image segmentation based on set-valued mappingDownload PDFInfo
- Publication number
- CN110084771B CN110084771BCN201910178779.9ACN201910178779ACN110084771BCN 110084771 BCN110084771 BCN 110084771BCN 201910178779 ACN201910178779 ACN 201910178779ACN 110084771 BCN110084771 BCN 110084771B
- Authority
- CN
- China
- Prior art keywords
- fusion
- image
- feature
- block
- algorithm
- Prior art date
- Legal status (The legal status is an assumption and is not a legal conclusion. Google has not performed a legal analysis and makes no representation as to the accuracy of the status listed.)
- Active
Links
Images


Classifications
- G—PHYSICS
- G06—COMPUTING OR CALCULATING; COUNTING
- G06T—IMAGE DATA PROCESSING OR GENERATION, IN GENERAL
- G06T3/00—Geometric image transformations in the plane of the image
- G06T3/40—Scaling of whole images or parts thereof, e.g. expanding or contracting
- G06T3/4038—Image mosaicing, e.g. composing plane images from plane sub-images
- G—PHYSICS
- G06—COMPUTING OR CALCULATING; COUNTING
- G06T—IMAGE DATA PROCESSING OR GENERATION, IN GENERAL
- G06T5/00—Image enhancement or restoration
- G06T5/50—Image enhancement or restoration using two or more images, e.g. averaging or subtraction
- G—PHYSICS
- G06—COMPUTING OR CALCULATING; COUNTING
- G06T—IMAGE DATA PROCESSING OR GENERATION, IN GENERAL
- G06T2207/00—Indexing scheme for image analysis or image enhancement
- G06T2207/10—Image acquisition modality
- G06T2207/10048—Infrared image
- G—PHYSICS
- G06—COMPUTING OR CALCULATING; COUNTING
- G06T—IMAGE DATA PROCESSING OR GENERATION, IN GENERAL
- G06T2207/00—Indexing scheme for image analysis or image enhancement
- G06T2207/20—Special algorithmic details
- G06T2207/20212—Image combination
- G06T2207/20221—Image fusion; Image merging
Landscapes
- Physics & Mathematics (AREA)
- General Physics & Mathematics (AREA)
- Engineering & Computer Science (AREA)
- Theoretical Computer Science (AREA)
- Image Processing (AREA)
- Image Analysis (AREA)
Abstract
Description
Translated fromChinese技术领域technical field
本发明属于图像融合领域,具体为一种基于集值映射的双模态红外图像分块多算法优化融合方法。The invention belongs to the field of image fusion, in particular to a multi-algorithm optimization fusion method for bimodal infrared images based on set-valued mapping.
背景技术Background technique
红外光强与偏振双模态图像因其图像信息丰富的互补性而具有巨大的融合价值。为了实现二者高质量的融合,众多的融合算法被提出,但不同的融合算法具有不同的优势和不足,因此单一算法的融合无法达到高性能的融合目标。为此,多算法优化融合成为高质量双模态红外图像融合得以实现的有效途径,其不仅克服了单算法的局限同时兼并了多算法的优势,在双模态红外图像融合领域具有重要的研究意义和巨大的应用潜力。Infrared light intensity and polarization dual-modality images have great fusion value due to their rich complementarity of image information. In order to achieve high-quality fusion of the two, many fusion algorithms have been proposed, but different fusion algorithms have different advantages and disadvantages, so the fusion of a single algorithm cannot achieve high-performance fusion goals. Therefore, multi-algorithm optimization fusion has become an effective way to achieve high-quality dual-modal infrared image fusion. It not only overcomes the limitations of a single algorithm, but also combines the advantages of multiple algorithms. It has important research in the field of dual-modal infrared image fusion. significance and huge application potential.
当前,针对双模态红外图像融合,由于单算法对融合质量的提升能力有限,多算法的协同越来越受到重视。如有研究人员提出利用非下采样剪切波和非下采样轮廓波的嵌接组合来丰富融合图像的细节信息;关于图像对比度,有学者指出将顶帽变换与支持度变换相结合以增强融合图像的对比度。但其融合实施对象都是整幅图像,虽然有多种算法的协同,但其本质却是结合多种算法形成一种综合的融合策略并将其作用于全图。这种全图无差别融合尽管能在一定程度上提升全图的平均融合效果,但并未实现以融合针对性为前提的全局优化融合。这极大制约了双模态红外图像的融合质量,进一步影响了其工程应用。At present, for dual-modal infrared image fusion, due to the limited ability of a single algorithm to improve the fusion quality, the collaboration of multiple algorithms has been paid more and more attention. For example, some researchers proposed to use the embedded combination of non-subsampled shearlet and non-subsampled contourlet to enrich the details of the fusion image; about image contrast, some scholars pointed out that the top hat transformation and support transformation should be combined to enhance fusion. Contrast of the image. However, the fusion implementation object is the whole image. Although there are multiple algorithms, its essence is to combine multiple algorithms to form a comprehensive fusion strategy and apply it to the whole image. Although this kind of indiscriminate fusion of the whole image can improve the average fusion effect of the whole image to a certain extent, it does not realize the global optimization fusion based on the premise of fusion pertinence. This greatly restricts the fusion quality of dual-modal infrared images, and further affects its engineering applications.
为了提高融合针对性,从而解决无法全局最优的问题,相关学者提出建立差异特征集与融合算法集间的集值映射,并依据图像的差异特征对照建立的映射关系为融合选择最佳算法,以此提升融合针对性,进而提升融合效果。但现有的集值映射融合存在以下问题:一、利用全图总体差异特征选择算法,本质上进行的是无差别融合,实际中总体差异特征与局部差异特征往往并不相同,这直接导致根据总体差异特征选择的融合算法虽然能在一定程度上提升全图平均融合效果,但并未实现全局最优化融合,甚至致使图像局部融合失效;同时,利用归一化取大原则确定的显著差异特征不能反映真实的差异信息,其所驱动选择的融合算法缺乏与真实待融合信息间的对应性。二、构建集值映射过程中,所构建的融合有效度函数在部分情形下无法给出准确的评价结果;多场景取平均的统计处理方法是隐性的承认不同场景对于映射关系的反映具有同等效力,而事实上差异特征在不同场景中的重要性各异,因此统计平均无法反映不同场景对映射关系的支持度。In order to improve the pertinence of fusion and solve the problem that the global optimization cannot be achieved, relevant scholars propose to establish a set-valued mapping between the difference feature set and the fusion algorithm set, and select the best algorithm for fusion according to the mapping relationship established by the difference features of the image. In this way, the fusion pertinence is improved, and the fusion effect is further improved. However, the existing set-valued mapping fusion has the following problems: 1. The overall difference feature selection algorithm of the whole image is used to perform indiscriminate fusion in essence. In practice, the overall difference feature and the local difference feature are often different, which directly leads to Although the fusion algorithm of the overall difference feature selection can improve the average fusion effect of the whole image to a certain extent, it does not achieve global optimal fusion, and even causes the local fusion of the image to fail; at the same time, the significant difference features determined by the principle of normalization are used It cannot reflect the real difference information, and the fusion algorithm selected by it lacks the correspondence with the real information to be fused. 2. In the process of constructing set-valued mapping, the constructed fusion validity function cannot give accurate evaluation results in some cases; the statistical processing method of averaging across multiple scenes implicitly admits that different scenes reflect the mapping relationship equally In fact, the importance of different features in different scenarios is different, so the statistical average cannot reflect the support for the mapping relationship in different scenarios.
发明内容SUMMARY OF THE INVENTION
本发明目的在于针对双模态红外图像融合中,现有多算法融合缺乏针对性导致的无差别融合不能实现全图最优化融合甚至融合失效的问题,提出一种基于集值映射的双模态红外图像分块多算法优化融合方法。解决了双模态红外图像融合过程中,由于源图像差异特征的随机性导致融合算法难以动态调整以及同一融合策略难以做到全局最优的问题。The purpose of the invention is to solve the problem that the indiscriminate fusion of the existing multi-algorithm fusion cannot realize the optimal fusion of the whole image or even the fusion fails due to the lack of pertinence in the dual-modal infrared image fusion, and proposes a dual-modality based on set-valued mapping. A multi-algorithm optimization fusion method for infrared image segmentation. In the process of dual-modal infrared image fusion, it is difficult to dynamically adjust the fusion algorithm due to the randomness of the difference characteristics of the source images, and the same fusion strategy is difficult to achieve global optimality.
本发明的方法包括如下具体步骤:The method of the present invention comprises the following specific steps:
S1:源图像确定:选取多组红外光强与偏振场景图作为研究对象;S1: Source image determination: Select multiple sets of infrared light intensity and polarization scene maps as the research object;
S2:构建差异特征集:对比S1中场景图的图像特点以及结合双模态红外光强与偏振图像的成像机理,确定双模态红外图像的差异特征类型,进一步选取能量(EN)、信息熵(IE)、平滑度(EV)、Tamura对比度(TC)、边缘强度(EI)和平均梯度(AG)六个描述差异信息的特征构建差异特征集;S2: Constructing the difference feature set: Compare the image characteristics of the scene graph in S1 and the imaging mechanism combining the dual-modal infrared light intensity and polarization image to determine the difference feature type of the dual-modal infrared image, and further select the energy (EN), information entropy (IE), Smoothness (EV), Tamura Contrast (TC), Edge Intensity (EI) and Average Gradient (AG) six features that describe the difference information to construct a difference feature set;
S3:图像分块与各块显著差异特征的确定:采用几何分块将图像等分,根据差异特征集的组成元素,提取图像各分块的六个差异特征并归一化各差异特征的幅值,结合条件取大规则确定各分块的显著差异特征;S3: Determination of significant difference features between image blocks and each block: Geometric blocks are used to divide the image into equal parts. According to the constituent elements of the difference feature set, six difference features of each block of the image are extracted and the amplitude of each difference feature is normalized. value, combined with the conditions to take the big rule to determine the significant difference characteristics of each block;
S4:构建融合算法集:选取融合算法构建融合算法集;S4: Construct a fusion algorithm set: select a fusion algorithm to construct a fusion algorithm set;
S5:建立集值映射关系:构建反映算法对特征融合性能的融合有效度函数,结合S1中的场景图,分别建立每组图像的各个差异特征与融合算法间的融合有效度分布关系,最终对多组场景的分布结果进行加权统计以获得差异特征与最优融合算法的映射关系;S5: Establish a set-valued mapping relationship: construct a fusion validity function that reflects the feature fusion performance of the algorithm, and combine the scene graph in S1 to establish the fusion validity distribution relationship between each difference feature of each group of images and the fusion algorithm, and finally Perform weighted statistics on the distribution results of multiple sets of scenes to obtain the mapping relationship between the difference features and the optimal fusion algorithm;
S6:分块融合:利用S3中已确定的图像各分块的显著差异特征,结合S5中建立的映射关系,为各分块选取最佳融合算法并进行图像融合,以获得各块的融合图像,将获得的各融合图块按照原来的组合顺序拼接为一幅完整的融合图像,并作相应的拼接处理。S6: Block fusion: Using the significant difference characteristics of each block of the image determined in S3, combined with the mapping relationship established in S5, select the best fusion algorithm for each block and perform image fusion to obtain the fused image of each block. , splicing the obtained fused image blocks into a complete fused image according to the original combination order, and perform corresponding splicing processing.
上述的一种基于集值映射的双模态红外图像分块多算法优化融合方法,S3图像分块与各块显著差异特征的确定中具体步骤如下:In the above-mentioned set-valued mapping-based dual-modal infrared image segmentation and multi-algorithm optimization and fusion method, the specific steps in determining the S3 image segmentation and the significant difference features of each block are as follows:
S31:利用公式(7)对每块图像的各个差异特征值进行归一化,(7)式中Dif代表差异特征;K=1,2,3...M是图块编号;n=1,2,3...6是差异特征编号;I和P代表红外光强与偏振图像;wI和wP是权重因子,其形式如式(8),S31: Use formula (7) to normalize each difference feature value of each image block, where Dif represents the difference feature in formula (7); K=1, 2, 3...M is the block number; n=1 , 2, 3...6 is the difference feature number; I and P represent the infrared light intensity and polarization image; wI and wP are the weighting factors, whose form is as in formula (8),


S32:利用式(9)的条件取大规则确定各个图块的最显著差异特征,S32: Use the condition of formula (9) to take the big rule to determine the most significant difference feature of each block,

(9)式中的MD代表显著差异特征;sum代表6个差异特征归一化后的和,式(9)的含义是当能量差异特征占总差异特征的比例大于等于T时,该图块的最显著差异特征为EN,否则最显著差异特征为不包括EN在内的其他具有最大值的差异特征。MD in the formula (9) represents the significant difference feature; sum represents the normalized sum of the six difference features. The meaning of the formula (9) is that when the ratio of the energy difference feature to the total difference feature is greater than or equal to T, the block The most significant difference feature of is EN, otherwise the most significant difference feature is the other difference feature with the maximum value excluding EN.
上述的一种基于集值映射的双模态红外图像分块多算法优化融合方法,S5建立集值映射关系具体步骤如下:For the above-mentioned dual-modal infrared image segmentation and multi-algorithm optimization and fusion method based on set-valued mapping, the specific steps in S5 to establish a set-valued mapping relationship are as follows:
S5l:对各场景的红外光强与偏振图像分别进行分块处理,以获取更多的小样本块;S5l: Perform block processing on the infrared light intensity and polarization images of each scene to obtain more small sample blocks;
S52:对各场景每组源图像,利用所选取的融合算法分别融合,这样每组图像得到不同的融合图像,然后对每幅融合图像进行分块处理;S52: For each group of source images of each scene, use the selected fusion algorithm to fuse respectively, so that each group of images obtains different fused images, and then perform block processing on each fused image;
S53:分别计算每组源图像及其相应融合图像对应样本块的6个差异特征的特征值,为了定量描述融合算法对某一特征融合效果的好坏,构建单特征融合有效度公式(10)进行融合有效度度量,S53: Calculate the eigenvalues of the six different features of the corresponding sample blocks of each group of source images and their corresponding fused images respectively. In order to quantitatively describe the fusion effect of the fusion algorithm on a certain feature, construct a single-feature fusion effectiveness formula (10) To measure the fusion effectiveness,
QF,B(n)=wI,B(n)(DifF,B(n)-DifI,B(n))+wP,B(n)(DifF,B(n)-DifP,B(n)) (10)QF,B (n)=wI,B (n)(DifF,B (n)-DifI,B (n))+wP,B (n)(DifF,B (n)-DifP, B (n)) (10)
式中Q代表融合有效度;Dif代表差异特征;F=1,2,3...L为融合算法编号;I和P分别代表红外光强与偏振图像;B=1,2,3...E为样本块编号;n=1,2,3...6为差异特征编号;wI,B(n)和wP,B(n)分别为红外光强与偏振图像对应样本块的权重因子,该值为两块图像同一特征值的归一化系数,数学表达如式(11),In the formula, Q represents the fusion effectiveness; Dif represents the difference feature; F=1, 2, 3...L is the fusion algorithm number; I and P represent the infrared light intensity and polarization image respectively; B=1, 2, 3... .E is the sample block number; n=1, 2, 3...6 is the difference feature number; wI, B (n) and wP, B (n) are the infrared light intensity and the polarization image corresponding to the sample block respectively Weight factor, this value is the normalization coefficient of the same eigenvalue of two images, the mathematical expression is as formula (11),

于是每块样本块的每个特征都有L个融合有效度分别对应于L种融合算法,选取融合有效度值最大(及其±1%偏差)所对应的融合算法作为该样本块该特征的最有效融合算法,以此类推统计E个样本块每个特征所对应的最优融合算法出现的频次,最后除以总块数E从而求得每个特征最优融合算法出现的概率Pd,n,F,d为场景编号;Therefore, each feature of each sample block has L fusion validity degrees corresponding to L fusion algorithms, and the fusion algorithm corresponding to the maximum fusion validity value (and its ±1% deviation) is selected as the feature of the sample block. The most effective fusion algorithm, and so on, count the frequency of the optimal fusion algorithm corresponding to each feature of the E sample blocks, and finally divide it by the total number of blocks E to obtain the probability Pd of the optimal fusion algorithm for each feature, n, F , d are scene numbers;
S54:以上各场景统计结果总体上有相似的趋势,但因场景的不同存在个别差异,为了克服这种单一场景统计存在的矛盾性和片面性,对H种典型场景统计的各个特征所对应的最优融合算法出现的概率利用式(12)进行加权统计,从而给出每种特征在不同场景中最优融合算法的综合统计结果,S54: The statistical results of the above scenarios have a similar trend in general, but there are individual differences due to different scenarios. In order to overcome the contradiction and one-sidedness of the single-scenario statistics, the statistical results of the H types of typical scenarios correspond to the most The probability of occurrence of the optimal fusion algorithm is weighted by formula (12), so as to give the comprehensive statistical results of the optimal fusion algorithm for each feature in different scenarios,

式中H为总场景数;w′d,n为权重因子,其含义是:同一特征在不同场景中综合强度的归一化因子,将其命名为综合强度比,其定义如式(13),In the formula, H is the total number of scenes; w′d, n is the weight factor, which means: the normalization factor of the comprehensive strength of the same feature in different scenes, which is named the comprehensive strength ratio, which is defined as formula (13) ,

式中Dif′d,n为第d组图像第n个差异特征光强图像与偏振图像的综合强度,如式(14)In the formula, Dif′d, n is the comprehensive intensity of the nth differential characteristic light intensity image and the polarization image of the d-th group of images, as shown in formula (14)
Dif′d,n=wI,d,nDifI,d,n+w″P,d,nDifP,d,n (14)式(15)给出了归一化系数w″I,d,n和w″P,d,n的具体形式,Dif'd,n =wI,d,n DifI,d,n +w″P,d,n DifP,d,n (14) Equation (15) gives the normalization coefficient w″I, d, n and w"P, d, n concrete forms,

S55:利用H组场景的总体统计结果,选取每种特征所对应的最佳结果出现概率最大的算法作为其最佳融合算法,以此建立差异特征与最佳融合算法间的映射关系。S55: Using the overall statistical results of the H groups of scenes, select the algorithm with the highest probability of occurrence of the best result corresponding to each feature as its best fusion algorithm, so as to establish a mapping relationship between the difference features and the best fusion algorithm.
本发明与现有技术相比具有以下优点:Compared with the prior art, the present invention has the following advantages:
1.本发明引入分块针对性优化融合的思想,解决了无差别融合带来的局部融合效果差甚至无效,进而导致全局无法最优的问题。1. The present invention introduces the idea of block-targeted optimization and fusion, and solves the problem that the local fusion effect caused by indiscriminate fusion is poor or even ineffective, which in turn leads to the problem that the global cannot be optimized.
2.本发明通过构建更为通用的融合有效度函数和采用更加合理的多场景统计方法,克服了现有集值映射关系不稳定的问题。2. The present invention overcomes the problem that the existing set-valued mapping relationship is unstable by constructing a more general fusion validity function and adopting a more reasonable multi-scene statistical method.
附图说明Description of drawings
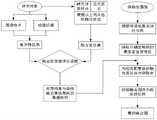
图1为本发明的流程图。FIG. 1 is a flow chart of the present invention.
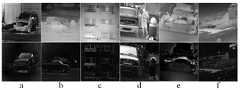
图2为研究对象多场景图,其中:图2(a)~(f)分别对应于六种场景且第一行为红外光强图片,第二行为红外偏振图片。Figure 2 is a multi-scene diagram of the research object, in which: Figures 2(a)-(f) correspond to six scenes respectively, and the first row is an infrared light intensity picture, and the second row is an infrared polarization picture.
图3为实验验证图。Figure 3 is an experimental verification diagram.
图4为分块结果图。Figure 4 is a block result diagram.
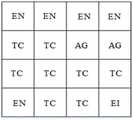
图5为各块显著差异特征图。Figure 5 is a feature map of significant differences in each block.
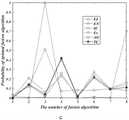
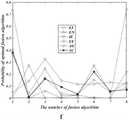
图6为各场景融合有效度统计分布图;其中:图6(a)~图6(f)分别对应于六种场景不同算法对特征的融合有效度分布,图中横坐标1-CVT,2-DTCWT,3-DWT,4-LP,5-NSCT,6-NSST,7-SWT,8-WPT。Figure 6 is a statistical distribution diagram of the fusion effectiveness of each scene; in which: Figures 6(a) to 6(f) correspond to the fusion effectiveness distribution of different algorithms in six scenarios respectively, and the abscissas in the figure are 1-CVT, 2 - DTCWT, 3-DWT, 4-LP, 5-NSCT, 6-NSST, 7-SWT, 8-WPT.
图7为多场景融合有效度综合统计分布图。Figure 7 is a comprehensive statistical distribution diagram of the effectiveness of multi-scenario fusion.
图8为差异特征与最佳融合算法映射关系图。FIG. 8 is a diagram showing the mapping relationship between the difference feature and the optimal fusion algorithm.
图9为各块配置算法图。FIG. 9 is a diagram of the configuration algorithm of each block.
图10为融合结果图;其中:图10(a)为各融合图块拼接后的效果图;图10(b)为经过拼接边缘处理和各块亮度调整后的效果图。Fig. 10 is a fusion result diagram; in which: Fig. 10(a) is the effect diagram after splicing each fusion block; Fig. 10(b) is the effect diagram after splicing edge processing and brightness adjustment of each block.
图11为实验结果对比图;其中依次为CVT融合结果、DTCWT融合结果;DWT融合结果、LP融合结果、NSCT融合结果、NSST融合结果、SWT融合结果、WPT融合结果、本发明方法融合结果。Figure 11 is a comparison diagram of experimental results; which are CVT fusion results, DTCWT fusion results; DWT fusion results, LP fusion results, NSCT fusion results, NSST fusion results, SWT fusion results, WPT fusion results, and the fusion results of the method of the present invention.
表1为实验结果客观评价数据表。Table 1 is the objective evaluation data table of the experimental results.
具体实施方式Detailed ways
为了更好地理解本发明的技术方案,以下结合附图对本发明的实施方式作进一步描述。In order to better understand the technical solutions of the present invention, the embodiments of the present invention are further described below with reference to the accompanying drawings.
参考附图1,本发明的实现步骤如下:With reference to accompanying drawing 1, the realization steps of the present invention are as follows:
S1:源图像确定。利用实验设备采集和网络下载等多种方式获取多组包含常见目标(如车辆、建筑、人、道路、树木和植被等)的六组双模态红外光强与偏振场景图,如附图2。S1: Source image determination. Using multiple methods such as experimental equipment acquisition and network download, multiple sets of six sets of dual-modal infrared light intensity and polarization scene maps containing common targets (such as vehicles, buildings, people, roads, trees and vegetation, etc.) are obtained, as shown in Figure 2. .
S2:构建差异特征集。对比S1中各场景图的图像特点以及结合双模态红外光强与偏振图像的成像机理,确定双模态红外图像的差异特征类型即亮度、纹理和边缘。通过比较最终选取EN、IE、EV、TC、EI和AG六个描述差异信息的特征构建差异特征集。S2: Build a differential feature set. By comparing the image characteristics of each scene graph in S1 and the imaging mechanism combining dual-modal infrared light intensity and polarization image, the different feature types of dual-modal infrared images, namely brightness, texture and edge, are determined. By comparing and finally selecting EN, IE, EV, TC, EI and AG, six features describing the difference information are constructed to construct a difference feature set.
具体步骤如下:Specific steps are as follows:
S21:构建表征亮度差异的特征,分别为EN如式(1)和IE如式(2),式(1)中M,N为图像的大小,I(i,j)代表位置为第i行、第j列像素点的灰度值;式(2)中L为图像总的灰度级,p(I)表示图像中像素灰度值为I的概率。S21: Construct features that characterize the difference in brightness, which are EN as in formula (1) and IE as in formula (2), where M and N in formula (1) are the size of the image, and I(i, j) represents the position of the i-th row , the gray value of the pixel point in the jth column; in formula (2), L is the total gray level of the image, and p(I) represents the probability that the gray value of the pixel in the image is I.


S22:构建表征纹理差异的特征,分别为EV如式(3)和TC如式(4),式(3)中σ为图像灰度值的标准差;式(4)中的α为图像灰度分布的峰度。S22: Construct features representing texture differences, which are EV as in formula (3) and TC as in formula (4), where σ in formula (3) is the standard deviation of the image gray value; α in formula (4) is the image gray value The kurtosis of the degree distribution.


S23:构建表征边缘差异的特征,分别为EI如式(5)和AG如式(6),式(5)中的BE为经Canny算子边缘检测后的二值化边缘图,对其求和可以得到边缘点数以此反映边缘强度;式(6)中M,N为待计算图像大小,I(i,j)表示位于第i行、第j列的像素点的灰度值。S23: Construct features representing edge differences, which are EI as in formula (5) and AG as in formula (6). BE in formula (5) is the binarized edge map after edge detection by the Canny operator. and the number of edge points can be obtained to reflect the edge strength; in formula (6), M, N are the size of the image to be calculated, and I(i, j) represents the gray value of the pixel located in the i-th row and the j-th column.


S3:图像分块与各块显著差异特征的确定。以附图3为实验验证图,本发明采用几何分块将图像等分为16块(如附图4),实际应用中可以根据融合意图或应用需求对图像进行针对性分块。根据差异特征集的组成元素,提取各块的六个差异特征。由于各差异特征的量纲不同所以无法进行直接比较,因此先归一化各差异特征的幅值。另外由于亮度差异是由成像硬件差异所致,因此在不做修正的情况下,绝大多数图块的显著差异特征都将是差异能量特征,为此制定了条件取大规则用于确定各块的显著差异特征(如附图5)。S3: Determination of image blocks and significant difference features of each block. Taking FIG. 3 as the experimental verification diagram, the present invention adopts geometrical block to divide the image into 16 equal blocks (as shown in FIG. 4 ). According to the constituent elements of the differential feature set, six differential features of each block are extracted. Since the dimensions of each differential feature are different, direct comparison cannot be made, so the amplitude of each differential feature is normalized first. In addition, since the difference in brightness is caused by the difference in imaging hardware, the significant difference feature of most of the blocks will be the difference energy feature without correction. For this reason, a conditional selection rule is formulated to determine each block. significant differences (as shown in Figure 5).
具体步骤如下:Specific steps are as follows:
S31:利用公式(7)对每块图像的各个差异特征值进行归一化,(7)式中Dif代表差异特征;K=1,2,3...16是图块编号;n=1,2,3...6是差异特征编号;I和P代表红外光强与偏振图像;wI和wP是权重因子,其形式如式(8)。S31: Use formula (7) to normalize each difference feature value of each image, where Dif represents the difference feature in formula (7); K=1, 2, 3...16 is the block number; n=1 , 2, 3...6 are difference feature numbers; I and P represent infrared light intensity and polarization images; wI and wP are weighting factors, whose form is as in formula (8).


S32:利用式(9)的条件取大规则确定各个图块的最显著差异特征,结果如附图5。S32: Determine the most significant difference feature of each block by using the conditional rule of formula (9), and the result is shown in FIG. 5 .

(8)式中的MD代表显著差异特征;sum代表6个差异特征归一化后的和。式(9)的含义是当能量差异特征占总差异特征的比例大于等于T时,该图块的最显著差异特征为EN,否则最显著差异特征为不包括EN在内的其他具有最大值的差异特征,经对比实验发现当T=0.4时,提取的显著差异特征准确度最高。MD in the formula (8) represents the significant difference feature; sum represents the normalized sum of the six difference features. The meaning of formula (9) is that when the ratio of energy difference features to the total difference features is greater than or equal to T, the most significant difference feature of the block is EN, otherwise the most significant difference feature is other excluding EN with the largest value. Differential features, the comparison experiment found that when T=0.4, the extracted significant difference features had the highest accuracy.
S4:构建融合算法集。选取常用且性能得到广泛认可的融合算法构建融合算法集。鉴于多尺度分解在图像融合方面的优异表现,本发明选取CVT、DTCWT、DWT、LP、NSCT、NSST、SWT和WPT八种常用的融合算法构建融合算法集(融合算法集元素可以根据需要增删)。需要注意的是融合算法的融合参数对融合结果具有一定的影响,为此为每一种算法针对双模态红外图像融合配置最佳的融合参数。S4: Construct a fusion algorithm set. A fusion algorithm set that is commonly used and whose performance has been widely recognized is selected to construct a fusion algorithm set. In view of the excellent performance of multi-scale decomposition in image fusion, the present invention selects eight commonly used fusion algorithms of CVT, DTCWT, DWT, LP, NSCT, NSST, SWT and WPT to construct a fusion algorithm set (the elements of the fusion algorithm set can be added or deleted as needed) . It should be noted that the fusion parameters of the fusion algorithm have a certain influence on the fusion results. Therefore, the optimal fusion parameters are configured for each algorithm for dual-modal infrared image fusion.
S5:建立集值映射关系。构建反映算法对特征融合性能的融合有效度函数,结合S1中的场景图,分别建立每组图像的各个差异特征与融合算法间的融合有效度分布关系(如附图6),最终对多组场景的分布结果进行加权统计以获得差异特征与最优融合算法的映射关系。S5: Establish a set-valued mapping relationship. Construct a fusion effectiveness function that reflects the feature fusion performance of the algorithm, and combine the scene graph in S1 to establish the fusion effectiveness distribution relationship between each difference feature of each group of images and the fusion algorithm (as shown in Figure 6), and finally to many The distribution results of the group scenes are weighted and counted to obtain the mapping relationship between the difference features and the optimal fusion algorithm.
具体步骤如下:Specific steps are as follows:
S51:对六个场景的红外光强与偏振图像分别进行分块处理,以获取更多的小样本块。需要注意的是样本块如果选择过小则无法有效提取特征,反之则会有复合特征的存在。为此本发明选择样本块的大小为24×24,样本块的获得是通过24×24的窗口在源图像上滑动获取,滑动原则为从图像左上角开始按行遍历,水平和垂直步长都为8像素直至图像右下角,这样每组源图像就得到900个样本块。S51: Perform block processing on the infrared light intensity and polarization images of the six scenes respectively to obtain more small sample blocks. It should be noted that if the sample block is too small, the features cannot be effectively extracted, otherwise there will be composite features. For this reason, the present invention selects the size of the sample block to be 24×24, and the sample block is obtained by sliding on the source image through a 24×24 window. 8 pixels up to the bottom right corner of the image, so that each set of source images gets a block of 900 samples.
S52:对每组源图像,利用所选取的8种融合算法分别融合,这样每组图像得到8幅融合图像,然后对每幅融合图像利用S51的方法进行分块处理,同样可以得到900个样本快。S52: For each group of source images, use the selected 8 fusion algorithms to fuse them separately, so that each group of images obtains 8 fusion images, and then uses the method of S51 to perform block processing on each fusion image, and 900 images can also be obtained. Sample fast.
S53:分别计算每组源图像及其相应8幅融合图像对应样本块的6个差异特征的特征值。为了定量描述融合算法对某一特征融合效果的好坏,构建单特征融合有效度公式(10)进行融合有效度度量。S53: Calculate the eigenvalues of the 6 difference features of the corresponding sample blocks of each group of source images and their corresponding 8 fused images respectively. In order to quantitatively describe the fusion effect of a fusion algorithm on a certain feature, a single-feature fusion effectiveness formula (10) is constructed to measure the fusion effectiveness.
QF,B(n)=wI,B(n)(DifF,B(n)-DifI,B(n))+wP,B(n)(DifF,B(n)-DifP,B(n)) (10)QF,B (n)=wI,B (n)(DifF,B (n)-DifI,B (n))+wP,B (n)(DifF,B (n)-DifP, B (n)) (10)
式中Q代表融合有效度;Dif代表差异特征;F=1,2,3...8为融合算法编号;I和P分别代表红外光强与偏振图像;B=1,2,3,...900为样本块编号;n=1,2,3...6为差异特征编号;wI,B(n)和wP,B(n)分别为红外光强与偏振图像对应样本块的权重因子,该值为两块图像同一特征值的归一化系数,数学表达如式(11)。In the formula, Q represents the fusion effectiveness; Dif represents the difference feature; F=1, 2, 3...8 is the fusion algorithm number; I and P represent the infrared light intensity and polarization image respectively; B=1, 2, 3, . ..900 is the sample block number; n=1, 2, 3...6 is the difference feature number; wI, B (n) and wP, B (n) are the corresponding sample blocks of infrared light intensity and polarization image, respectively The weight factor is the normalization coefficient of the same feature value of the two images, and the mathematical expression is as formula (11).

于是每块样本的每个特征都有8个评价值分别对应于F=1,2,3...8八种算法,选取评价值值最大(及其±1%偏差内)所对应的融合算法作为该样本块该特征的最有效融合算法,以此类推统计900个样本块每个特征所对应的最优融合算法出现的频次,最后除以总块数900从而求得每个特征最优融合算法出现的概率Pd,n,F(d为场景编号,n为差异特征编号,F为融合算法编号),本发明将该概率定义为融合有效度,其不同场景的结果如附图6。Therefore, each feature of each block of samples has 8 evaluation values corresponding to eight algorithms of F=1, 2, 3...8, and the fusion corresponding to the largest evaluation value (and its ±1% deviation) is selected. The algorithm is used as the most effective fusion algorithm for this feature of the sample block. By analogy, the frequency of the optimal fusion algorithm corresponding to each feature of the 900 sample blocks is counted, and finally divided by the total number of blocks 900 to obtain the optimal fusion algorithm for each feature. The probability Pd, n, F of fusion algorithm occurrence (d is the scene number, n is the difference feature number, F is the fusion algorithm number), the present invention defines this probability as fusion effectiveness, and the results of its different scenes are as shown in Figure 6 .
S54:以上六组场景统计结果总体上有相似的趋势,但因场景的不同存在个别差异,为了克服这种单一场景统计存在的矛盾性和片面性,对六种典型场景统计的各个特征所对应的最优融合算法出现的概率利用式(12)进行加权统计,从而给出每种特征在不同场景中最优融合算法的综合统计结果(如附图7)。S54: The statistical results of the above six groups of scenes have a similar trend in general, but there are individual differences due to different scenes. In order to overcome the contradiction and one-sidedness of this single scene statistics The probability of occurrence of the optimal fusion algorithm is weighted by formula (12), thereby giving the comprehensive statistical results of the optimal fusion algorithm for each feature in different scenarios (as shown in Figure 7).

式中w′d,n为权重因子,其含义是:同一特征在不同场景中综合强度的归一化因子,这里将其命名为综合强度比,其定义如式(13)。In the formula, w′d, n is the weight factor, its meaning is: the normalization factor of the comprehensive strength of the same feature in different scenes, here it is named as the comprehensive strength ratio, and its definition is as formula (13).

式中Dif′d,n为第d组图像第n个差异特征光强图像与偏振图像的综合强度,如式(14)In the formula, Dif′d, n is the comprehensive intensity of the nth differential characteristic light intensity image and the polarization image of the d-th group of images, as shown in formula (14)
Dif′d,n=w″I,d,nDifI,d,n+w″P,d,nDifP,d,n (14)式(15)给出了归一化系数w″I,d,n和w″P,d,n的具体形式。Dif'd, n = w"I, d, n DifI, d, n + w"P, d, n DifP, d, n (14) Equation (15) gives the normalization coefficient w"I , d, n and w"P, d, n of the specific form.

S55:利用六组场景的总体统计结果,选取每种特征所对应的最佳结果出现概率最大的算法作为其最佳融合算法,以此建立差异特征与最佳融合算法间的映射关系(如附图8)。S55: Using the overall statistical results of the six groups of scenarios, select the algorithm with the highest probability of occurrence of the best result corresponding to each feature as its best fusion algorithm, so as to establish the mapping relationship between the difference features and the best fusion algorithm (see appendix). Figure 8).
说明:附图5各块的显著差异特征由S3的式(9)确定;根据附图7的六个场景总体融合有效度分布,可以确定附图8的差异特征与最优融合算法间的映射关系;附图9的各块算法配置由各块的显著差异特征(见附图5)及差异特征与最优算法间的映射关系(见图8)共同确定。Explanation: The significant difference feature of each block of Fig. 5 is determined by the formula (9) of S3; According to the overall fusion effectiveness distribution of the six scenes of Fig. 7, the mapping between the difference feature of Fig. 8 and the optimal fusion algorithm can be determined The algorithm configuration of each block in FIG. 9 is jointly determined by the significant difference feature of each block (see FIG. 5 ) and the mapping relationship between the difference feature and the optimal algorithm (see FIG. 8 ).
S6:分块融合。利用S3中所确定的各块的显著差异特征和S5中建立的映射关系为各图块选取最佳融合算法(选取结果如附图9),并进行图像融合,以获得各块的融合图像,并进行后续拼接处理。S6: Block fusion. Use the significant difference feature of each block determined in S3 and the mapping relationship established in S5 to select the best fusion algorithm for each block (the selection result is shown in Figure 9), and perform image fusion to obtain the fusion image of each block, and perform subsequent splicing processing.
具体步骤如下:Specific steps are as follows:
S61:根据各块的显著差异特征配合映射关系,选择融合算法并对各块进行融合。S61: Select a fusion algorithm and fuse each block according to the significant difference feature of each block and the mapping relationship.
S62:将获得的各融合图块按照原来的组合顺序拼接为一幅完整的融合图像(结果如附图10(a))。S62: splicing the obtained fused image blocks into a complete fused image according to the original combination sequence (the result is shown in Fig. 10(a)).
S63:对于拼接边缘用3×3的均值滤波器进行平滑,以去除拼接痕迹。计算出16块图像的平均亮度,并以此为基准计算出每块图像相对于该基准的缩放比例,然后利用该比例对每块图像进行线性灰度缩放,从而使各块亮度处于同一水平,最终处理后结果如附图10(b)所示。S63: Smooth the spliced edges with a 3×3 mean filter to remove splicing traces. Calculate the average brightness of 16 images, and use this as a benchmark to calculate the scaling ratio of each image relative to the benchmark, and then use this ratio to perform linear grayscale scaling on each image, so that the brightness of each block is at the same level, The result after the final treatment is shown in Fig. 10(b).
本发明的实施例中,实验图像为红外光强与偏振图像如附图3,从附图11的实验结果可以看出本发明所得结果具有直观上更好的视觉效果,尤其是图中以矩形框标出的部分相对于其他方法具有更高的清晰度和对比度,同时目标更加突出。另外附表1给出了一组客观评价指标的评价结果,从中发现7个指标中本发明的融合结果有5个表现最优,其中标准差(STD)和空间频率(RCF)两个指标的评价结果远远高于其他方法。但对于QAB/F和Q0两个指标本发明评价结果并非最好,但即便如此本发明的结果与最佳结果之间的差距非常之小。说明本发明的方法能够有效提高双模态红外图像的融合质量,提高融合精度,同时基于集值映射的方法能够满足场景动态变化而动态选择最优融合算法的需求,因此足以满足大部分双模态红外图像的融合、识别处理和跟踪的需要。In the embodiment of the present invention, the experimental images are infrared light intensity and polarization images, as shown in Figure 3. From the experimental results of Figure 11, it can be seen that the results obtained in the present invention have better visual effects, especially the rectangular shape in the figure. The boxed parts have higher sharpness and contrast than other methods, while the target is more prominent. In addition, the attached table 1 gives the evaluation results of a set of objective evaluation indicators, from which it is found that 5 of the 7 indicators have the best performance of the fusion results of the present invention, among which the standard deviation (STD) and the spatial frequency (RCF) are the two indicators. The evaluation results are much higher than other methods. However, the evaluation results of the present invention are not the best for the two indicators QAB/F and Q0 , but even so, the gap between the results of the present invention and the best results is very small. It is shown that the method of the present invention can effectively improve the fusion quality of dual-mode infrared images and improve the fusion accuracy, and at the same time, the method based on set-valued mapping can meet the needs of dynamic changes in the scene and dynamically select the optimal fusion algorithm, so it is sufficient to meet most dual-mode infrared images. The needs of fusion, recognition processing and tracking of state-of-the-art infrared images.
表1Table 1

Claims (2)
Translated fromChinese


Priority Applications (1)
| Application Number | Priority Date | Filing Date | Title |
|---|---|---|---|
| CN201910178779.9ACN110084771B (en) | 2019-03-11 | 2019-03-11 | A multi-algorithm optimization fusion method for dual-modal infrared image segmentation based on set-valued mapping |
Applications Claiming Priority (1)
| Application Number | Priority Date | Filing Date | Title |
|---|---|---|---|
| CN201910178779.9ACN110084771B (en) | 2019-03-11 | 2019-03-11 | A multi-algorithm optimization fusion method for dual-modal infrared image segmentation based on set-valued mapping |
Publications (2)
| Publication Number | Publication Date |
|---|---|
| CN110084771A CN110084771A (en) | 2019-08-02 |
| CN110084771Btrue CN110084771B (en) | 2022-07-05 |
Family
ID=67412375
Family Applications (1)
| Application Number | Title | Priority Date | Filing Date |
|---|---|---|---|
| CN201910178779.9AActiveCN110084771B (en) | 2019-03-11 | 2019-03-11 | A multi-algorithm optimization fusion method for dual-modal infrared image segmentation based on set-valued mapping |
Country Status (1)
| Country | Link |
|---|---|
| CN (1) | CN110084771B (en) |
Families Citing this family (3)
| Publication number | Priority date | Publication date | Assignee | Title |
|---|---|---|---|---|
| CN111445464B (en)* | 2020-03-31 | 2022-04-19 | 中北大学 | A Construction Method of Differential Feature Frequency Distribution Based on Nonparametric Estimation |
| CN112149623B (en)* | 2020-10-16 | 2023-09-08 | 中国电子科技集团公司第三研究所 | Self-adaptive multi-sensor information fusion system, method and storage medium |
| CN114998175B (en)* | 2022-06-16 | 2023-09-05 | 洛阳热感科技有限公司 | Image fusion method and device based on regional edge intensity |
Citations (6)
| Publication number | Priority date | Publication date | Assignee | Title |
|---|---|---|---|---|
| CN105279747A (en)* | 2015-11-25 | 2016-01-27 | 中北大学 | Infrared polarization and light intensity image fusing method guided by multi-feature objective function |
| CN106846288A (en)* | 2017-01-17 | 2017-06-13 | 中北大学 | A kind of many algorithm fusion methods of bimodal infrared image difference characteristic Index |
| CN107633495A (en)* | 2017-08-02 | 2018-01-26 | 中北大学 | A kind of infrared polarization based on complementary relationship and the more embedded fusion methods of algorithm 2D VMD of intensity image |
| CN107909112A (en)* | 2017-11-27 | 2018-04-13 | 中北大学 | The fusion method that a kind of infrared light intensity is combined with polarization image multiclass argument |
| CN109035188A (en)* | 2018-07-16 | 2018-12-18 | 西北工业大学 | A kind of intelligent image fusion method based on target signature driving |
| CN109377468A (en)* | 2018-10-09 | 2019-02-22 | 湖南源信光电科技股份有限公司 | The pseudo-colours fusion method of infra-red radiation and polarization image based on multiple features |
Family Cites Families (2)
| Publication number | Priority date | Publication date | Assignee | Title |
|---|---|---|---|---|
| US8866920B2 (en)* | 2008-05-20 | 2014-10-21 | Pelican Imaging Corporation | Capturing and processing of images using monolithic camera array with heterogeneous imagers |
| US10742894B2 (en)* | 2017-08-11 | 2020-08-11 | Ut-Battelle, Llc | Optical array for high-quality imaging in harsh environments |
- 2019
- 2019-03-11CNCN201910178779.9Apatent/CN110084771B/enactiveActive
Patent Citations (6)
| Publication number | Priority date | Publication date | Assignee | Title |
|---|---|---|---|---|
| CN105279747A (en)* | 2015-11-25 | 2016-01-27 | 中北大学 | Infrared polarization and light intensity image fusing method guided by multi-feature objective function |
| CN106846288A (en)* | 2017-01-17 | 2017-06-13 | 中北大学 | A kind of many algorithm fusion methods of bimodal infrared image difference characteristic Index |
| CN107633495A (en)* | 2017-08-02 | 2018-01-26 | 中北大学 | A kind of infrared polarization based on complementary relationship and the more embedded fusion methods of algorithm 2D VMD of intensity image |
| CN107909112A (en)* | 2017-11-27 | 2018-04-13 | 中北大学 | The fusion method that a kind of infrared light intensity is combined with polarization image multiclass argument |
| CN109035188A (en)* | 2018-07-16 | 2018-12-18 | 西北工业大学 | A kind of intelligent image fusion method based on target signature driving |
| CN109377468A (en)* | 2018-10-09 | 2019-02-22 | 湖南源信光电科技股份有限公司 | The pseudo-colours fusion method of infra-red radiation and polarization image based on multiple features |
Non-Patent Citations (5)
| Title |
|---|
| Fusion of infrared polarization and intensity images using support value transform and fuzzy combination rules;Fengbao Yang 等;《Infrared Physics & Technology》;20130930;235-243* |
| Infrared and visible image fusion with convolutional neural networks;Yu Liu 等;《International Journal of Wavelets》;20171107;1-20* |
| The algorithm of image fusion for infrared polarization based on Contourlet transform and Teager operator;Guo Ruidong 等;《SPIEDigitalLibrary.org/conference-proceedings-of-spie》;20151105;1-9* |
| 一种双模态红外图像的集值映射融合方法;牛涛 等;《光电工程》;20150415;第42卷(第4期);75-80* |
| 红外光强与偏振图像融合的多算法嵌接组合研究;董安冉;《万方数据库》;20170829;1-86* |
Also Published As
| Publication number | Publication date |
|---|---|
| CN110084771A (en) | 2019-08-02 |
Similar Documents
| Publication | Publication Date | Title |
|---|---|---|
| CN103530847B (en) | A kind of infrared image enhancing method | |
| CN108830818B (en) | Rapid multi-focus image fusion method | |
| CN102169576B (en) | Quantified evaluation method of image mosaic algorithms | |
| CN111709902A (en) | Infrared and visible light image fusion method based on self-attention mechanism | |
| CN105744256B (en) | Based on the significant objective evaluation method for quality of stereo images of collection of illustrative plates vision | |
| CN110084782B (en) | Full-reference image quality evaluation method based on image significance detection | |
| CN110084771B (en) | A multi-algorithm optimization fusion method for dual-modal infrared image segmentation based on set-valued mapping | |
| CN108399611A (en) | Multi-focus image fusing method based on gradient regularisation | |
| CN106530244B (en) | A kind of image enchancing method | |
| CN105761214A (en) | Remote sensing image fusion method based on contourlet transform and guided filter | |
| CN114639002A (en) | Infrared and visible light image fusion method based on multi-mode characteristics | |
| Xing et al. | A multi-scale contrast-based image quality assessment model for multi-exposure image fusion | |
| CN109859157B (en) | Full-reference image quality evaluation method based on visual attention characteristics | |
| CN112288668A (en) | Infrared and visible light image fusion method based on depth unsupervised dense convolution network | |
| CN107506795A (en) | A kind of local gray level histogram feature towards images match describes sub- method for building up and image matching method | |
| CN114612709B (en) | Multi-scale object detection method guided by image pyramid features | |
| CN111178503A (en) | Mobile terminal-oriented decentralized target detection model training method and system | |
| CN103208125B (en) | The vision significance algorithm of color and motion global contrast in video frame images | |
| Feng et al. | Low-light image enhancement algorithm based on an atmospheric physical model | |
| CN104835142B (en) | A kind of vehicle queue length detection method based on textural characteristics | |
| Vishwakarma et al. | A novel approach for face recognition using DCT coefficients re-scaling for illumination normalization | |
| CN112102217B (en) | Method and system for quickly fusing visible light image and infrared image | |
| Woldamanuel | Grayscale image enhancement using water cycle algorithm | |
| CN112734683A (en) | Multi-scale SAR and infrared image fusion method based on target enhancement | |
| CN109215003A (en) | A kind of image interfusion method and device |
Legal Events
| Date | Code | Title | Description |
|---|---|---|---|
| PB01 | Publication | ||
| PB01 | Publication | ||
| SE01 | Entry into force of request for substantive examination | ||
| SE01 | Entry into force of request for substantive examination | ||
| GR01 | Patent grant | ||
| GR01 | Patent grant |