CN110032988B - Real-time Noise Reduction Enhancement Method for Ultraviolet Raman Spectroscopy System - Google Patents
Real-time Noise Reduction Enhancement Method for Ultraviolet Raman Spectroscopy SystemDownload PDFInfo
- Publication number
- CN110032988B CN110032988BCN201910327330.4ACN201910327330ACN110032988BCN 110032988 BCN110032988 BCN 110032988BCN 201910327330 ACN201910327330 ACN 201910327330ACN 110032988 BCN110032988 BCN 110032988B
- Authority
- CN
- China
- Prior art keywords
- raman
- area
- trough
- noise
- peak
- Prior art date
- Legal status (The legal status is an assumption and is not a legal conclusion. Google has not performed a legal analysis and makes no representation as to the accuracy of the status listed.)
- Active
Links
Images


Classifications
- G—PHYSICS
- G06—COMPUTING OR CALCULATING; COUNTING
- G06F—ELECTRIC DIGITAL DATA PROCESSING
- G06F2218/00—Aspects of pattern recognition specially adapted for signal processing
- G06F2218/02—Preprocessing
- G06F2218/04—Denoising
- G—PHYSICS
- G06—COMPUTING OR CALCULATING; COUNTING
- G06F—ELECTRIC DIGITAL DATA PROCESSING
- G06F2218/00—Aspects of pattern recognition specially adapted for signal processing
- G06F2218/08—Feature extraction
- G—PHYSICS
- G06—COMPUTING OR CALCULATING; COUNTING
- G06F—ELECTRIC DIGITAL DATA PROCESSING
- G06F2218/00—Aspects of pattern recognition specially adapted for signal processing
- G06F2218/12—Classification; Matching
Landscapes
- Investigating, Analyzing Materials By Fluorescence Or Luminescence (AREA)
Abstract
Translated fromChinese
Description
Translated fromChinese技术领域technical field
本发明涉及一种紫外拉曼光谱系统降噪增强方法,尤其涉及一种针对实时紫外拉曼信号的光谱随机噪声减小、提高信噪比从而增强拉曼峰值信号的方法,属于光谱探测和光谱处理技术以及信号处理领域。The invention relates to a noise reduction and enhancement method for an ultraviolet Raman spectroscopy system, in particular to a method for reducing the spectral random noise of a real-time ultraviolet Raman signal and improving the signal-to-noise ratio to enhance the Raman peak signal, which belongs to spectral detection and spectroscopy. processing technology and signal processing.
背景技术Background technique
拉曼光谱学是一种基于激光与物质相互作用的非弹性光散射(即入射激光的能量/频率发生改变)的无损伤光谱探测方法。通过测量被测分子体系特定的拉曼光谱(即拉曼指纹图谱),可以对样品进行快速、简单、可重复的非接触无损检测和定量分析,所需时间短,样品用量小,测量结果准确等特点。但是拉曼光谱探测的灵敏度较低(瑞利散射线的强度只有入射光强度的10-3,拉曼光谱强度大约只有瑞利线的10-3),特别是对于一些小型、便携或者简易的紫外拉曼光谱探测系统,其由于激光功率不高、激光不够稳定、非制冷CCD噪声太大等因素,探测结果噪声影响较大,拉曼信号信噪比低。Raman spectroscopy is a non-destructive spectral detection method based on inelastic light scattering (ie, the energy/frequency of the incident laser light is changed) based on the interaction of laser light with matter. By measuring the specific Raman spectrum (i.e. Raman fingerprint) of the molecular system to be tested, fast, simple and repeatable non-contact non-destructive testing and quantitative analysis of the sample can be carried out with short time required, small sample consumption and accurate measurement results. Features. However, the sensitivity of Raman spectrum detection is low (the intensity of the Rayleigh scattering line is only 10-3 of the incident light intensity, and the intensity of the Raman spectrum is only about 10-3 of the Rayleigh line), especially for some small, portable or simple Ultraviolet Raman spectroscopy detection system, due to factors such as low laser power, insufficient laser stability, and too much noise of uncooled CCD, the noise of the detection result is greatly affected, and the signal-to-noise ratio of the Raman signal is low.
一些传统的信号处理办法,可以去除一些随机噪声,但是针对拉曼光谱来说并不一定非常理想,因为很多微弱的拉曼峰不管是从幅值还是波形上,跟噪声都很接近。所以在去除随机噪声的过程中,也会丢掉很多微弱拉曼信号,信噪比并没有提高太多。所以一些在时间域上的新型去除随机噪声的方法被提出来,可以保留一些具有不随时间变化的一定波形的微弱信号,如t-x-y上的预测滤波方法和贝叶斯预测滤波算法等。Some traditional signal processing methods can remove some random noise, but it is not necessarily ideal for Raman spectroscopy, because many weak Raman peaks are very close to noise in terms of amplitude and waveform. Therefore, in the process of removing random noise, many weak Raman signals are also lost, and the signal-to-noise ratio is not much improved. Therefore, some new methods for removing random noise in the time domain are proposed, which can retain some weak signals with certain waveforms that do not change with time, such as the predictive filtering method on t-x-y and the Bayesian predictive filtering algorithm.
由于拉曼系统通常一次性只对单个样品进行检测,而单个样品产生的拉曼信号除了幅值变化外,拉曼特征峰位固定,而噪声具有随机性。这样在实时采集一个样品的样品的光谱图像时,可以通过统计随时间不变化的峰位,来区分随时间不停变化的噪声信号,滤除这些噪声信号,感兴趣的有效拉曼信号得以凸显。同时利用时间域上的滤除噪声方法也是非常有效的,沿t轴将x轴上的光谱进行纵向拓展,所述的t轴为时间轴,所述的x轴为波长或拉曼位移轴,从而实现在t-x上2D构建光谱,然后对构建的光谱图像,选用具有保边特性的平滑滤波方法,可以有效保留信号,滤除时间随机的噪声,从而提高拉曼光谱结果的信噪比。Since the Raman system usually detects only a single sample at a time, the Raman signal generated by a single sample has a fixed Raman characteristic peak position except for the amplitude change, and the noise is random. In this way, when the spectral image of a sample is collected in real time, the noise signals that change with time can be distinguished by counting the peak positions that do not change with time, and these noise signals can be filtered out, and the effective Raman signal of interest can be highlighted. . At the same time, the noise filtering method in the time domain is also very effective. The spectrum on the x-axis is longitudinally expanded along the t-axis, where the t-axis is the time axis, and the x-axis is the wavelength or Raman displacement axis. In this way, a 2D spectrum can be constructed on t-x, and then a smooth filtering method with edge-preserving characteristics is selected for the constructed spectral image, which can effectively retain the signal and filter out random noise in time, thereby improving the signal-to-noise ratio of the Raman spectrum results.
综上所述,通过将拉曼探测信号在时间域上拓展后,进行的统计分类和针对t-x光谱图像的2D滤波方法,是滤除拉曼光谱的随机噪声,优化拉曼光谱和解决小型、便携或者简易的紫外拉曼光谱探测系统拉曼信号信噪比低和拉曼特征信号不分明的有效方法。To sum up, by expanding the Raman detection signal in the time domain, the statistical classification and the 2D filtering method for the t-x spectral image are to filter out the random noise of the Raman spectrum, optimize the Raman spectrum and solve the problems of small, Portable or simple ultraviolet Raman spectroscopy detection system is an effective method for low Raman signal-to-noise ratio and indistinct Raman characteristic signals.
发明内容SUMMARY OF THE INVENTION
本发明公开的紫外拉曼光谱系统实时降噪增强方法要解决的技术问题是:降低实时拉曼光谱的随机噪声,增强拉曼特征峰值,实现对拉曼信噪比低的拉曼光谱探测系统所获取的实时光谱的优化。所述拉曼信噪比低的拉曼光谱探测系统特别指小型、便携或者简易的紫外拉曼光谱探测系统。The technical problems to be solved by the real-time noise reduction and enhancement method of the ultraviolet Raman spectroscopy system disclosed in the present invention are: reducing the random noise of the real-time Raman spectroscopy, enhancing the Raman characteristic peaks, and realizing a Raman spectroscopy detection system with a low Raman signal-to-noise ratio Optimization of acquired real-time spectra. The Raman spectroscopy detection system with a low Raman signal-to-noise ratio particularly refers to a small, portable or simple ultraviolet Raman spectroscopy detection system.
本发明的目的是通过下述技术方案实现的。The purpose of the present invention is achieved through the following technical solutions.
本发明公开的紫外拉曼光谱系统实时降噪增强方法,实时采集紫外拉曼信号,对采集拉曼信号数据进行统计,进而预测拉曼信号有效峰值,所述有效峰值包括有效低谷和顶峰。将采集的每一帧拉曼光谱均进行处理,针对每一帧拉曼光谱,通过获得的有效低谷将每一帧拉曼光谱光谱切分为各块区域,分别判断切分的各块区域属性,所述区域属性指噪声区域属性或有效拉曼信号区域属性,对噪声区域进行滤波,然后,将拉曼信号区域和滤波后的噪声区域进行拼合。之后,将处理后的N+1帧光谱沿时间轴拼接成2D图像,通过迭代的双边滤波方法,对该2D图像进行滤波,滤波后沿时间轴将N+1光谱进行叠加并归一化,获得降噪处理的拉曼光谱。The real-time noise reduction and enhancement method for an ultraviolet Raman spectroscopy system disclosed in the invention collects ultraviolet Raman signals in real time, collects statistics on the collected Raman signal data, and then predicts the effective peaks of the Raman signals, and the effective peaks include effective troughs and peaks. Each frame of Raman spectrum collected is processed, and for each frame of Raman spectrum, each frame of Raman spectrum is divided into blocks according to the obtained effective trough, and the attributes of each block are judged separately. , the area attribute refers to the noise area attribute or the effective Raman signal area attribute, filter the noise area, and then combine the Raman signal area and the filtered noise area. After that, the processed N+1 frames of spectra are spliced into a 2D image along the time axis, and the 2D image is filtered through an iterative bilateral filtering method. After filtering, the N+1 spectra are superimposed and normalized along the time axis. Obtain the denoised Raman spectrum.
本发明公开的紫外拉曼光谱系统实时降噪增强方法,包括如下步骤:The real-time noise reduction enhancement method for an ultraviolet Raman spectroscopy system disclosed in the present invention includes the following steps:
步骤一:实时采集紫外拉曼信号,对采集拉曼信号数据进行统计,进而预测拉曼信号有效峰值,所述有效峰值包括有效低谷和顶峰。Step 1: collect the ultraviolet Raman signal in real time, perform statistics on the collected Raman signal data, and then predict the effective peak value of the Raman signal, and the effective peak value includes an effective trough and a peak.
由前端拉曼探测系统中的光谱仪中实时获取紫外拉曼信号,将实时获取拉曼信号传输至信号缓存区,所述信号缓存区用于保持存取N+1帧光谱,每获取一帧新的光谱,并删除第前N+1帧光谱数据,完成拉曼信号数据获取。对N+1帧图像进行低谷和顶峰统计,列出低谷网表和顶峰网表。预设统计分类容许区间步长,将整个光谱沿x轴分为M个容许区间,所述的x轴为波长轴或拉曼位移轴,当N帧光谱的顶峰网表在每个容许区间内都有顶峰且在区间左或右端的斜率的绝对值大于预设阈值Kmax,即有N帧光谱均满足下式条件,The ultraviolet Raman signal is acquired in real time from the spectrometer in the front-end Raman detection system, and the real-time acquired Raman signal is transmitted to the signal buffer area. The signal buffer area is used to keep access to N+1 frames of spectra. and delete the first N+1 frames of spectral data to complete the acquisition of Raman signal data. Perform trough and peak statistics on N+1 frame images, and list the trough netlist and peak netlist. The preset statistical classification tolerance interval step size divides the entire spectrum into M tolerance intervals along the x-axis, where the x-axis is the wavelength axis or the Raman shift axis. When the peak netlist of N frames of spectra is within each tolerance interval There are peaks and the absolute value of the slope at the left or right end of the interval is greater than the preset threshold Kmax , that is, there are N frames of spectra that meet the following conditions:
容许区间内存在f'(xm)>Kmax&&f'(xm+1)≤0,m∈Cm,m=1,2,…,MWithin the allowable interval, f'(xm )>Kmax &&f'(xm+1 )≤0,m∈Cm , m=1,2,...,M
所述预设阈值Kmax等于随机噪声能导致的最大斜率绝对值,则标记为有效顶峰,所述有效顶峰为强度高的拉曼峰,记录其位置。The preset threshold Kmax is equal to the absolute value of the maximum slope that can be caused by random noise, and is marked as an effective peak. The effective peak is a Raman peak with high intensity, and its position is recorded.
而对于N+1帧光谱的低谷网表,低谷点的判断条件由下式给出,For the trough netlist of the N+1 frame spectrum, the judgment condition of the trough point is given by the following formula,
容许区间内存在f'(xm)≤0&&f'(xm+1)≥0,m∈Cm,m=1,2,…,MWithin the allowable interval f'(xm )≤0&&f'(xm+1 )≥0,m∈Cm , m=1,2,...,M
然后,通过如下方法预测出真实光谱低谷点,共分下述三种情况预测出真实光谱低谷点:情况一、在一个容许区间步长内,小于等于(N+1)/2帧光谱存在低谷点,则不是有效低谷;情况二、在一个容许区间步长内,大于等于N帧光谱存在低谷点,则为有效低谷,根据平均值或者权重均值标定此有效低谷位置并记录;情况三、在一个容许区间步长内,大于(N+1)/2而小于N帧光谱存在低谷点的情况,所述情况有可能是因为低强度峰值受噪声影响形成的,通过预设预测条件判断是否为有效低谷。通过上述三种情况预测出真实光谱低谷点,进而获得出低谷网表。通过统计的低谷网表和顶峰网表预测拉曼信号各有效峰值位置。Then, the real spectral trough points are predicted by the following methods, and the real spectral trough points are predicted in the following three cases:
步骤一所述的用于判断是否为有效低谷的预设预测条件具体判断方法如下:观测该低谷值左右相近的容许区间步长区域内,是否存在顶峰网表中记录的强度高的拉曼峰,若存在即是有效低谷,记录进低谷网表,若不存在,则将N+1帧光谱进行叠加,叠加光谱若在该容许区间步长内存在低谷,则为有效低谷,记录进低谷网表。The specific judging method of the preset prediction condition for judging whether it is an effective trough described in
步骤一所述统计分类容许区间步长优选为3。The step size of the statistical classification tolerance interval in
步骤二:针对每一帧拉曼光谱,通过步骤一获得的有效低谷将每一帧拉曼光谱光谱切分为各块区域,分别判断切分的各块区域属性,所述区域属性指噪声区域属性或有效拉曼信号区域属性,对噪声区域进行滤波,然后,将拉曼信号区域和滤波后的噪声区进行拼合。Step 2: For each frame of Raman spectrum, divide each frame of Raman spectrum into blocks according to the effective trough obtained in
通过步骤一预测出的每一帧拉曼光谱的低谷网表,将步骤一获取的每一帧拉曼光谱切分为各块区域,对每个区域进行属性判断,分别确定各块区域属性,即分别确定各块区域是噪声区域,还是有效拉曼信号区域。对于单个区域,判断标准有两个:第一种判断标准为:当区域内存在步骤一中获得的顶峰网表中记录的强度高的拉曼峰,则确定为有效拉曼信号区域;第二种判断标准为:选取步骤一中的p个容许区间长度为步长,进行最小二乘法平滑,再判断该区域内平滑后数据的标准差与平均值的比值,若标准差与平均值的比值大于预设阈值,则确定为有效拉曼信号区域,否则,则为噪声区域。所述的预设阈值为所有区域取步骤一中的p个容许区间长度为步长,进行最小二乘法平滑后标准差与平均值的比值的平均值的二分之一。第一种判断标准用于检测出强峰区域;第二种判断标准用于针对弱峰进行判断。According to the trough netlist of each frame of Raman spectrum predicted in
确定各块区域属性后对噪声区域进行大幅度平滑滤波,过滤掉噪声区域的噪声,记录所有判断为噪声属性区域的波长或拉曼位移位置信息。然后,将有效拉曼信号区域和滤波后的噪声区域进行拼合。After determining the attributes of each block area, perform a large-scale smoothing filter on the noise area, filter out the noise in the noise area, and record all wavelength or Raman shift position information determined as the noise attribute area. Then, the effective Raman signal area and the filtered noise area are flattened.
步骤二中所述p个容许区间中p数量优选为3。The number of p in the p tolerance intervals described in step 2 is preferably 3.
第二种判断标准的原理是,弱峰的拉曼宽度大于采样宽度,而噪声宽度为采样宽度,根据弱峰平均宽度预估步长进行最小二乘滤波,最小二乘滤波将噪声平滑为近似直线区域,而弱峰能够有效保留,平滑后近似直线区域标准与平均值的比值会明显小于弱峰区域的标准差与平均值的比值,之后通过计算该区域的标准差与平均值比值大小从而判断出是噪声区域还是有效拉曼信号区域。The principle of the second criterion is that the Raman width of the weak peak is greater than the sampling width, and the noise width is the sampling width. The least squares filter is performed according to the estimated step size of the average width of the weak peak, and the least squares filter smoothes the noise to an approximate value. Straight line area, and weak peaks can be effectively retained. After smoothing, the ratio of the standard to the average value of the approximate straight line area will be significantly smaller than the ratio of the standard deviation to the average value of the weak peak area. Determine whether it is a noise region or an effective Raman signal region.
步骤三、将步骤一采集的每一帧拉曼光谱均进行步骤二的处理,将步骤二处理后的N+1帧光谱沿时间轴拼接成2D图像,通过迭代的双边滤波方法,对该2D图像进行滤波,滤波后沿时间轴将N+1光谱进行叠加并归一化,获得降噪处理的拉曼光谱。Step 3: Perform the processing of step 2 on each frame of the Raman spectrum collected in
由于步骤二处理后的光谱依然存在两点比较大的问题:第一点是,步骤二中判断出的有效拉曼信号区域未被处理过,所以依然含有噪声;第二点是,由步骤二中处理后的噪声区域和未处理的有效拉曼信号区域重新拼合而成的一帧完整光谱,光谱会非常不连续,不均匀,不平滑。Since the spectrum processed in step 2 still has two major problems: the first point is that the effective Raman signal region determined in step 2 has not been processed, so it still contains noise; A complete spectrum formed by recombining the processed noise area and the unprocessed effective Raman signal area, the spectrum will be very discontinuous, non-uniform and non-smooth.
光谱在t-x上的2D构建和滤波原理是把光谱在时间上展开成t-x图像,由于噪声在时间轴上存在随机性,而有效拉曼信号在时间轴上峰位恒定。所以对t-x图像进行平滑滤波,不仅能够在常规的x轴上,即波长或拉曼位移轴上,滤除部分噪声使曲线平滑,让重新合成的光谱变得均匀和连续,而且能够在t轴上,即时间轴上,滤除随时间变化的噪声,能够减少步骤二中未处理的有效拉曼信号区域的噪声而不影响拉曼信号特征峰峰值本身。The principle of 2D construction and filtering of the spectrum on t-x is to expand the spectrum into a t-x image in time. Due to the randomness of noise on the time axis, the peak position of the effective Raman signal is constant on the time axis. Therefore, smoothing the t-x image can not only filter out part of the noise on the conventional x-axis, that is, on the wavelength or Raman displacement axis, to smooth the curve and make the resynthesized spectrum uniform and continuous, but also on the t-axis. On the time axis, filtering out the noise that changes with time can reduce the noise in the unprocessed effective Raman signal area in step 2 without affecting the characteristic peak-to-peak value of the Raman signal itself.
将步骤一采集的每一帧拉曼光谱均进行步骤二的处理,将步骤二处理后的N+1帧光谱沿时间轴拼接成2D图像,此时x轴为波长或拉曼位移轴,t轴为时间轴,z轴为拉曼强度。通过迭代的双边滤波方法,对该2D图像进行滤波,滤波后,沿时间轴将N+1光谱进行叠加并归一化,获得降噪处理的拉曼光谱,此时的光谱信噪比获得了极大的提升,拉曼有效峰值得到增强。Each frame of Raman spectrum collected in
所述的双边滤波方法的原理为:滤波算法中,目标点上的像素值通常是由其所在位置上的周围的一个小局部邻居像素的值所决定。在2D高斯滤波中的具体实现即对周围的预定范围内的像素值分别赋以不同的高斯权重值,并在加权平均后得到当前点的最终结果。而所述的高斯权重因子是利用两个像素之间的空间距离关系来生成。其公式化的描述一般如下所述:The principle of the bilateral filtering method is as follows: in the filtering algorithm, the pixel value on the target point is usually determined by the value of a small local neighbor pixel around its location. The specific implementation in the 2D Gaussian filtering is to assign different Gaussian weight values to the pixel values in the surrounding predetermined range, and obtain the final result of the current point after the weighted average. The Gaussian weight factor is generated by using the spatial distance relationship between two pixels. Its formulaic description is generally as follows:


其中的c即为基于空间距离的高斯权重,而kd(x)用来对结果进行单位化。where c is the Gaussian weight based on the spatial distance, and kd (x) is used to normalize the result.
高斯滤波在低通滤波算法中只考虑像素间的空间位置上的关系,因此滤波的结果会丢失边缘的信息,所述的边缘信息就是随时间峰位稳定的有效拉曼信号。而双边滤波就是在高斯滤波中加入了另外的一个权重分部来解决所述问题。双边滤波中对于边缘的保持通过下述表达式来实现:Gaussian filtering only considers the spatial relationship between pixels in the low-pass filtering algorithm, so the result of filtering will lose edge information, which is an effective Raman signal that is stable with time peaks. The bilateral filter is to add another weight division to the Gaussian filter to solve the problem. The preservation of edges in bilateral filtering is achieved by the following expressions:


其中的s为基于像素间相似程度的高斯权重,kr(x)同样用来对结果进行单位化。对两者进行结合即得到基于空间距离、相似程度综合考量的双边滤波:where s is a Gaussian weight based on the similarity between pixels, and kr (x) is also used to normalize the result. Combining the two can obtain bilateral filtering based on comprehensive consideration of spatial distance and similarity:


上式中的单位化分部k(x)综合了两种高斯权重于一起而得到,其中的c与s计算详细描述如下:The unitized subdivision k(x) in the above formula is obtained by combining two Gaussian weights, and the calculation of c and s is described in detail as follows:

且有d(ξ,x)=d(ξ-x)=‖ξ-x‖And there is d(ξ,x)=d(ξ-x)=‖ξ-x‖

且有σ(φ,f)=σ(φ-f)=‖φ-f‖And there is σ(φ,f)=σ(φ-f)=‖φ-f‖
上述给出的表达式均是在空间上的无限积分,而在像素化的图像中需要对其进行离散化。距离超过预定程度的像素实际上对当前的目标像素影响很小,能够忽略的。限定局部子区域后的离散化公式就可以简化为如下形式:The expressions given above are all infinite integrals in space, which need to be discretized in pixelated images. Pixels whose distance exceeds a predetermined level actually have little effect on the current target pixel and can be ignored. The discretization formula after defining the local subregion can be simplified to the following form:

所述的迭代的双边滤波方法的操作步骤为:(1)设定双边滤波函数空间域sigma因子sigma_s,所述的空间区域指t-x区域,即时间与波长或拉曼位移构成的2D区域,所述的空间域sigma因子选取应尽量包含更多帧光谱,但需要小于拉曼特征峰值宽度;(2)设定双边滤波函数像素范围域sigma因子sigma_r,所述的像素范围区域指每帧光谱上各波长或拉曼强度处的拉曼强度范围,每次返回设定sigma_r,sigma_r均会减半或者减去预设步长,直到小于所设的最小量Smin,则保持sigma_r=Smin不变,sigma_r初始值选取,根据步骤二获得的所有噪声区域的标准差的一半和除以所有噪声区域平均值和的结果,保留两位小数后获得;(3)对构建的2D图像进行双边滤波;(4)根据步骤二中记录的噪声区域的位置信息,计算滤波后图像各噪声区域的标准差和平均值比值大小,若该比值大于预设的阈值,则返回(2)。(5)获得最终滤波后迭代结果。The operation steps of the iterative bilateral filtering method are: (1) setting the bilateral filtering function spatial domain sigma factor sigma_s, the spatial region refers to the t-x region, that is, the 2D region formed by time and wavelength or Raman displacement, so The selection of the spatial domain sigma factor should include as many frames of spectra as possible, but it needs to be smaller than the Raman characteristic peak width; (2) Set the bilateral filter function pixel range domain sigma factor sigma_r, and the pixel range area refers to the spectrum on each frame. The Raman intensity range at each wavelength or Raman intensity, each time you return to set sigma_r, sigma_r will be halved or subtracted by the preset step size until it is less than the set minimum amount Smin, then keep sigma_r=Smin unchanged, The initial value of sigma_r is selected, according to the result of dividing the half sum of the standard deviation of all noise regions obtained in step 2 by the average sum of all noise regions, and obtains after retaining two decimal places; (3) Perform bilateral filtering on the constructed 2D image; ( 4) Calculate the ratio of the standard deviation and the average value of each noise region in the filtered image according to the position information of the noise region recorded in step 2, and return to (2) if the ratio is greater than the preset threshold. (5) Obtain the final filtered iterative result.
所述的双边滤波方法的优势在于,实现在有效保留随时间峰位稳定的有效拉曼信号的基础上,大幅减小随时间随机变化的噪声大小。且通过调节sigma_r参数大小,能够很好地设置权重,通过迭代,提高单次平滑精度,不会像一次性平滑那样在平滑掉噪声时模糊有效拉曼信号。The advantage of the bilateral filtering method is that on the basis of effectively retaining the effective Raman signal whose peak position is stable over time, the size of the noise that changes randomly over time is greatly reduced. And by adjusting the size of the sigma_r parameter, the weight can be set well, and through iteration, the single-shot smoothing accuracy can be improved, and the effective Raman signal will not be blurred when the noise is smoothed like one-time smoothing.
有益效果:Beneficial effects:
1、本发明公开的紫外拉曼光谱系统实时降噪增强方法,根据紫外拉曼信号和随机噪声的物理特性,采用统计分类、2D构建和迭代双边滤波方法,相比于普通的光谱叠加或者平滑方法,能够更有效地减少拉曼光谱随机噪声,大幅提高信噪比。1. The real-time noise reduction enhancement method of the ultraviolet Raman spectroscopy system disclosed in the present invention adopts statistical classification, 2D construction and iterative bilateral filtering methods according to the physical characteristics of the ultraviolet Raman signal and random noise, compared with ordinary spectral superposition or smoothing This method can more effectively reduce the random noise of Raman spectrum and greatly improve the signal-to-noise ratio.
2、本发明公开的紫外拉曼光谱系统实时降噪增强方法,基于统计的有效低谷和顶峰将光谱分割后分类平滑方法,通过分析随机噪声的物理特性,有效的预测判断有效低谷和顶峰,并将光谱分割后进行有效地分类,并单独对噪声区域进行大幅度平滑,相比普通平滑方法,该方法能够保留波峰,平滑时波峰不受无关噪声牵连影响,并快速预处理掉大部分的随机噪声,统计的噪声区域和有效拉曼信号区域也可以提供良好的随机噪声统计特性和信号统计特性,为后续算法的预设参数或阈值提供参考。2. The real-time noise reduction and enhancement method of the ultraviolet Raman spectroscopy system disclosed in the present invention is a method of classifying and smoothing the spectrum based on the effective troughs and peaks of statistics, and by analyzing the physical characteristics of random noise, it can effectively predict and judge the effective troughs and peaks, and After the spectrum is divided, it can be effectively classified, and the noise region can be greatly smoothed separately. Compared with the ordinary smoothing method, this method can retain the peaks. When smoothing, the peaks are not affected by irrelevant noise, and most of the random noises are quickly preprocessed. Noise, statistical noise region and effective Raman signal region can also provide good random noise statistical properties and signal statistical properties, providing reference for the preset parameters or thresholds of subsequent algorithms.
3、现有的拉曼光谱降噪方法,主要集中于空间域的滤波方法,本发明公开的紫外拉曼光谱系统实时降噪增强方法,将光谱随时间进行构建成2D图像的方法,由于有效拉曼信号随时间变化峰位稳定,在时间轴上形成明显边缘直线,而噪声随时间随机变化,在时间轴上形成随机噪点,时间轴上引入了更多的物理特征更利于滤波分析。3. The existing Raman spectrum noise reduction method mainly focuses on the filtering method in the spatial domain. The real-time noise reduction and enhancement method of the ultraviolet Raman spectrum system disclosed in the present invention, the method of constructing the spectrum into a 2D image over time, due to the effective The peak position of the Raman signal is stable over time, forming an obvious edge straight line on the time axis, while the noise changes randomly with time, forming random noise points on the time axis. The introduction of more physical features on the time axis is more conducive to filtering analysis.
4、本发明公开的紫外拉曼光谱系统实时降噪增强方法,基于自适应迭代的双边滤波方法,利用双边滤波算法的保边特性,不仅在2D构建的拉曼光谱图像中,去除构不成边缘的噪点,保留构成边缘的拉曼特征峰信号,而且双边滤波能够设置很小的高斯加权因子,通过迭代方法,能够保证滤波精度,不会出现一次性滤除太多使得降噪光谱结果出现失真的情况。4. The real-time noise reduction and enhancement method for an ultraviolet Raman spectroscopy system disclosed in the present invention, based on an adaptive iterative bilateral filtering method, utilizes the edge-preserving characteristics of the bilateral filtering algorithm, not only in the Raman spectral image constructed in 2D, but also removes the edges that do not constitute It retains the Raman characteristic peak signal that constitutes the edge, and the bilateral filtering can set a small Gaussian weighting factor. Through the iterative method, the filtering accuracy can be guaranteed, and there will not be too much filtering at one time to distort the noise reduction spectral results. Case.
附图说明Description of drawings
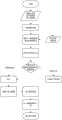
图1为本发明的紫外拉曼光谱系统实时降噪增强方法总流程示意图。FIG. 1 is a schematic diagram of the overall flow of the real-time noise reduction enhancement method of the ultraviolet Raman spectroscopy system of the present invention.
图2为本发明的步骤一流程示意图。FIG. 2 is a schematic flow chart of
图3为本发明的步骤二流程示意图。FIG. 3 is a schematic flow chart of step 2 of the present invention.
图4为本发明的步骤三流程示意图,其中图4a为2D光谱图像构建示意图,图4b为迭代的双边滤波方法处理流程示意图。FIG. 4 is a schematic flowchart of step 3 of the present invention, wherein FIG. 4a is a schematic diagram of a 2D spectral image construction, and FIG. 4b is a schematic diagram of a processing flowchart of an iterative bilateral filtering method.
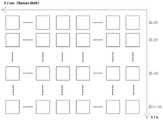
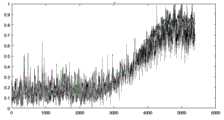
图5为本发明的对海洛因紫外拉曼光谱处理结果实例示意图,其中图5a为未处理的一帧拉曼光谱原图,图5b为暂存的待处理的10帧拉曼光谱原图,图5c为处理后拉曼光谱结果。5 is a schematic diagram of an example of the result of processing the ultraviolet Raman spectrum of heroin according to the present invention, wherein FIG. 5a is an unprocessed original Raman spectrum image of one frame, and FIG. 5b is a temporarily stored original image of 10 frames of Raman spectrum to be processed. 5c is the Raman spectrum result after processing.
图6为本发明的对其他样品紫外拉曼光谱处理结果实例示意图,其中图6a为未处理的一帧对乙酰氨基酚片拉曼光谱的原图,图6b为处理后的对乙酰氨基酚片拉曼光谱结果,图6c为未处理的一帧头孢克肟分散片拉曼光谱的原图,图6d为处理后的头孢克肟分散片拉曼光谱结果。6 is a schematic diagram of an example of UV Raman spectroscopy processing results for other samples according to the present invention, wherein FIG. 6a is the original image of the Raman spectrum of one frame of untreated acetaminophen tablets, and FIG. 6b is the processed acetaminophen tablets Raman spectrum results, Fig. 6c is the original picture of the Raman spectrum of a frame of untreated cefixime dispersible tablets, and Fig. 6d is the Raman spectrum results of the treated cefixime dispersible tablets.
具体实施方式Detailed ways
为了更好的说明本发明的目的和优点,下面结合附图和实例对发明内容做进一步说明。In order to better illustrate the purpose and advantages of the present invention, the content of the invention will be further described below with reference to the accompanying drawings and examples.
实施例1:Example 1:
现利用实验室自研便携式266nm激光激发拉曼光谱系统,对海洛因Heroin样品进行拉曼检测,采集积分时间为2秒,选取N=9,即保持电脑在接收一帧新光谱时,暂存有前9帧光谱,x轴为拉曼位移,样品稳定放置6秒后开始进行紫外拉曼光谱系统实时降噪增强处理,紫外拉曼光谱系统实时降噪增强处理流程如图1所示。Now we use the laboratory self-developed portable 266nm laser excitation Raman spectroscopy system to conduct Raman detection on the heroin sample. The acquisition and integration time is 2 seconds, and N=9 is selected, that is, when the computer receives a new frame of spectrum, it temporarily stores the In the first 9 frames of spectra, the x-axis is the Raman shift. After the sample is stably placed for 6 seconds, the real-time noise reduction enhancement processing of the ultraviolet Raman spectroscopy system begins. The real-time noise reduction enhancement processing process of the ultraviolet Raman spectroscopy system is shown in Figure 1.
本实施例公开的紫外拉曼光谱系统实时降噪增强方法,具体实现步骤如下:The real-time noise reduction enhancement method for an ultraviolet Raman spectroscopy system disclosed in this embodiment, the specific implementation steps are as follows:
步骤一:如图2所示,实时采集海洛因样品紫外拉曼信号,对采集拉曼信号数据进行统计,进而预测拉曼信号有效峰值,所述有效峰值包括有效低谷和顶峰。Step 1: As shown in FIG. 2 , collect the ultraviolet Raman signal of the heroin sample in real time, conduct statistics on the collected Raman signal data, and then predict the effective peak value of the Raman signal, and the effective peak value includes effective trough and peak.
由前端拉曼探测系统中的光谱仪中实时获取海洛因样品紫外拉曼信号,通过USB通信将实时获取拉曼信号传输至电脑信号缓存区,所述信号缓存区用于保持存取10帧光谱,每获取一帧新的光谱,会删除第前10帧光谱数据,完成拉曼信号数据获取。对这10帧图像进行低谷和顶峰统计,列出低谷网表和顶峰网表。预设统计分类容许区间步长为3,若9帧光谱的顶峰网表在步长为3的区间内都有顶峰且在区间左或右端的斜率的绝对值大于240,则标记为有效顶峰,所述有效顶峰为强度高的拉曼峰,记录其位置。而对于10帧光谱的低谷网表,通过如下方法预测出真实光谱低谷点,共分下述三种情况预测出真实光谱低谷点:情况一、小于等于5帧光谱在步长3内有低谷,则不是有效低谷;情况二、大于等于9帧光谱在一个步长3内有低谷,则为有效低谷,记录该低谷的拉曼位移位置;情况三、大于5而小于9帧光谱在一个步长3内有低谷的情况,观测该低谷值左右相近步长为3区域内,是否存在顶峰网表中记录的强度高的拉曼峰,若存在即是有效低谷,记录进低谷网表,若不存在,则将10帧光谱进行叠加,叠加光谱若在该3区间内存在低谷,则为有效低谷,记录进低谷网表,通过上述三种情况预测出真实光谱低谷点,进而获得出低谷网表。通过统计的低谷网表和顶峰网表预测拉曼信号各有效峰值位置。The ultraviolet Raman signal of the heroin sample is acquired in real time from the spectrometer in the front-end Raman detection system, and the real-time acquired Raman signal is transmitted to the computer signal buffer area through USB communication. Acquiring a new frame of spectrum will delete the first 10 frames of spectral data to complete the acquisition of Raman signal data. Perform trough and peak statistics on these 10 frames of images, and list the trough and peak netlists. The default statistical classification allowable interval step size is 3. If the peak netlist of 9 frames of spectra has peaks in the interval with step size 3 and the absolute value of the slope at the left or right end of the interval is greater than 240, it will be marked as a valid peak. The effective peak is a Raman peak with high intensity, and its position is recorded. For the trough netlist of 10 frames of spectra, the real spectral trough points are predicted by the following methods, and the real spectral trough points are predicted in the following three cases:
步骤二:如图3所示,针对每一帧拉曼光谱,通过步骤一获得的有效低谷将每一帧拉曼光谱光谱切分为各块区域,分别判断切分的各块区域属性,对噪声区域进行滤波,然后,将拉曼信号区域和滤波后的噪声区进行拼合。所述区域属性指噪声区域属性或有效拉曼信号区域属性。Step 2: As shown in Figure 3, for each frame of Raman spectrum, the effective trough obtained in
通过步骤一预测出的每一帧拉曼光谱的低谷网表,将步骤一获取的每一帧拉曼光谱切分为各块区域,对每个区域进行属性判断,分别确定各块区域属性,即分别确定各块区域是噪声区域,还是有效拉曼信号区域。对于单个区域,判断标准有两个:第一种判断标准为:当区域内存在步骤一中获得的顶峰网表中记录的强度高的拉曼峰,则确定为有效拉曼信号区域;第二种判断标准为:选取长度9为步长,进行最小二乘法估计平滑,再判断该区域内平滑后数据的标准差和平均值的比值,若标准差和平均值的比值大于0.05,则确定为有效拉曼信号区域,否则,则为噪声区域。According to the trough netlist of each frame of Raman spectrum predicted in
确定各块区域属性后对噪声区域进行步长为20的最小二乘平滑滤波,过滤掉噪声区域的噪声,记录所有噪声属性区域的拉曼位移位置信息。然后,将有效拉曼信号区域和滤波后的噪声区域进行拼合。After determining the attributes of each block area, the least squares smoothing filter with a step size of 20 is performed on the noise area to filter out the noise in the noise area, and the Raman displacement position information of all noise attribute areas is recorded. Then, the effective Raman signal area and the filtered noise area are flattened.
步骤三、如图4a所示,将步骤一采集的每一帧拉曼光谱均进行步骤二的处理,将步骤二处理后的10帧光谱,沿时间轴,拼接成2D图像,通过如图4b所示的迭代的双边滤波方法,对该2D图像进行滤波,滤波后,沿时间轴,将10光谱进行叠加并归一化,获得降噪处理的拉曼光谱。Step 3: As shown in Figure 4a, each frame of Raman spectrum collected in
将步骤一采集的每一帧拉曼光谱均进行步骤二的处理,将步骤二处理后的10帧光谱,沿时间轴,拼接成2D图像,此时x轴为波长或拉曼位移轴,t轴为时间轴,z轴为拉曼强度。通过迭代的双边滤波方法,对该2D图像进行滤波。Each frame of Raman spectrum collected in
如图4b所示,所述的迭代的双边滤波方法的操作步骤为:(1)设定双边滤波函数空间域sigma因子sigma_s=9;(2)设定双边滤波函数像素范围域sigma因子sigma_r,sigma_r初始值选取为0.08,每次返回设定sigma_r,sigma_r均会减半,直到小于0.02,则保持sigma_r=0.02不变,即Smin选取0.02;(3)对构建的2D图像进行双边滤波;(4)根据步骤二中记录的噪声区域的位置信息,计算滤波后图像各噪声区域标准差和平均值比值大小,若该比值大于0.0113,则返回(2)。(5)获得最终滤波后迭代结果。As shown in Figure 4b, the operation steps of the iterative bilateral filtering method are: (1) setting the bilateral filtering function spatial domain sigma factor sigma_s=9; (2) setting the bilateral filtering function pixel range domain sigma factor sigma_r, The initial value of sigma_r is selected as 0.08. Each time the sigma_r is returned to the setting, sigma_r will be halved until it is less than 0.02, then keep sigma_r=0.02 unchanged, that is, Smin is selected as 0.02; (3) Perform bilateral filtering on the constructed 2D image; ( 4) Calculate the ratio of the standard deviation and average value of each noise region in the filtered image according to the position information of the noise region recorded in step 2, and return to (2) if the ratio is greater than 0.0113. (5) Obtain the final filtered iterative result.
滤波后,沿时间轴,将10帧光谱进行叠加并归一化,获得降噪处理的拉曼光谱,此时的光谱信噪比获得极大的提升,拉曼有效峰值得到增强。After filtering, along the time axis, 10 frames of spectra are superimposed and normalized to obtain a Raman spectrum with noise reduction processing. At this time, the spectral signal-to-noise ratio is greatly improved, and the Raman effective peak is enhanced.
图5a,展示了未处理的一帧海洛因拉曼光谱原图,图5b,展示了暂存的待处理的10帧海洛因拉曼光谱原图,图5c,展示了经过本专利的紫外拉曼光谱系统实时降噪增强方法处理后的海洛因的拉曼光谱结果。Figure 5a shows the original unprocessed Raman spectrum of one frame of heroin, Figure 5b shows the original 10 frames of heroin Raman spectra temporarily stored to be processed, and Figure 5c shows the ultraviolet Raman spectrum obtained by the patent Raman spectral results of heroin processed by the system's real-time noise reduction enhancement method.
实施例2:Example 2:
利用本专利的紫外拉曼光谱系统实时降噪增强方法分别在对对乙酰氨基酚片和头孢克肟分散片的实时紫外拉曼检测信号进行处理,实时紫外拉曼信号的采集方法和条件与实施例1一致。本专利的紫外拉曼光谱系统实时降噪增强方法实施在对乙酰氨基酚片时,步骤一选取的区间左端的斜率绝对值阈值为50,步骤二中标准差和平均值的比值的阈值为0.02,步骤三中sigma_r的初始化值选取0.04,Smin选取为0.01,滤波后图像各噪声区域标准差和平均值的比值阈值为0.005。本专利的紫外拉曼光谱系统实时降噪增强方法实施在头孢克肟分散片时,步骤一选取的区间左端的斜率绝对值阈值为50,步骤二中标准差和平均值的比值的阈值为0.05,步骤三中sigma_r的初始化值选取0.08,Smin选取为0.01,滤波后图像各噪声区域标准差和平均值的比值阈值为0.012。The real-time noise reduction enhancement method of the ultraviolet Raman spectroscopy system of this patent is used to process the real-time ultraviolet Raman detection signals of paracetamol tablets and cefixime dispersible tablets, respectively. The acquisition method, conditions and implementation of real-time ultraviolet Raman signals Example 1 is the same. When the real-time noise reduction enhancement method of the ultraviolet Raman spectroscopy system of this patent is implemented in acetaminophen tablets, the absolute value threshold of the slope at the left end of the interval selected in
图6a,展示了未处理的一帧对乙酰氨基酚片拉曼光谱的原图,图6b,展示了处理后的对乙酰氨基酚片拉曼光谱结果;图6c,展示了未处理的一帧头孢克肟分散片拉曼光谱的原图,图6d,展示了处理后的头孢克肟分散片拉曼光谱结果。Figure 6a, shows the original Raman spectrum of an untreated frame of acetaminophen tablet, Figure 6b, shows the Raman spectrum of a treated acetaminophen tablet; Figure 6c, shows an untreated frame The original image of the Raman spectrum of cefixime dispersible tablets, Figure 6d, shows the Raman spectrum results of cefixime dispersible tablets after treatment.
以上所述的具体描述,对发明的目的、技术方案和有益效果进行了进一步详细说明,所应理解的是,以上所述仅为本发明的具体实施例而已,并不用于限定本发明的保护范围,凡在本发明的精神和原则之内,所做的任何修改、等同替换、改进等,均应包含在本发明的保护范围之内。The above-mentioned specific descriptions further describe the purpose, technical solutions and beneficial effects of the present invention in detail. It should be understood that the above-mentioned descriptions are only specific embodiments of the present invention, and are not intended to limit the protection of the present invention. Any modification, equivalent replacement, improvement, etc. made within the spirit and principle of the present invention shall be included within the protection scope of the present invention.
Claims (7)
Translated fromChinesePriority Applications (1)
| Application Number | Priority Date | Filing Date | Title |
|---|---|---|---|
| CN201910327330.4ACN110032988B (en) | 2019-04-23 | 2019-04-23 | Real-time Noise Reduction Enhancement Method for Ultraviolet Raman Spectroscopy System |
Applications Claiming Priority (1)
| Application Number | Priority Date | Filing Date | Title |
|---|---|---|---|
| CN201910327330.4ACN110032988B (en) | 2019-04-23 | 2019-04-23 | Real-time Noise Reduction Enhancement Method for Ultraviolet Raman Spectroscopy System |
Publications (2)
| Publication Number | Publication Date |
|---|---|
| CN110032988A CN110032988A (en) | 2019-07-19 |
| CN110032988Btrue CN110032988B (en) | 2020-11-13 |
Family
ID=67239786
Family Applications (1)
| Application Number | Title | Priority Date | Filing Date |
|---|---|---|---|
| CN201910327330.4AActiveCN110032988B (en) | 2019-04-23 | 2019-04-23 | Real-time Noise Reduction Enhancement Method for Ultraviolet Raman Spectroscopy System |
Country Status (1)
| Country | Link |
|---|---|
| CN (1) | CN110032988B (en) |
Families Citing this family (5)
| Publication number | Priority date | Publication date | Assignee | Title |
|---|---|---|---|---|
| CN112485361A (en)* | 2020-11-16 | 2021-03-12 | 武汉月成技术有限公司 | Chromatographic signal low-delay filtering method for gas chromatographic analyzer |
| CN112666084A (en)* | 2021-01-04 | 2021-04-16 | 国网山西省电力公司电力科学研究院 | SF based on Raman spectrum6Noise reduction method for decomposition characteristic component detection |
| CN114113035B (en)* | 2021-11-18 | 2024-02-02 | 北京理工大学 | Identification method of transgenic soybean oil |
| CN117056671B (en)* | 2023-08-14 | 2024-07-05 | 上海如海光电科技有限公司 | EMD-based Raman spectrum noise reduction method |
| CN117938285B (en)* | 2024-03-14 | 2024-05-28 | 深圳百沃彰世科技有限公司 | Simulation debugging method and system based on mobile communication equipment |
Citations (3)
| Publication number | Priority date | Publication date | Assignee | Title |
|---|---|---|---|---|
| CN101036038A (en)* | 2004-06-30 | 2007-09-12 | 化学影像公司 | Multimodal method for identifying hazardous agents |
| CN105300954A (en)* | 2015-09-02 | 2016-02-03 | 中南大学 | Method for Raman spectrum characterization of heterogeneous foam layer minerals in antimony ore flotation |
| CN107818298A (en)* | 2017-09-27 | 2018-03-20 | 厦门大学 | General Raman spectral characteristics extracting method for machine learning material recognition |
Family Cites Families (4)
| Publication number | Priority date | Publication date | Assignee | Title |
|---|---|---|---|---|
| US8486565B2 (en)* | 2007-03-28 | 2013-07-16 | Asahi Kasei Chemicals Corporation | Electrode, and lithium ion secondary battery, electric double layer capacitor and fuel cell using the same |
| US8570507B1 (en)* | 2012-09-06 | 2013-10-29 | Bruker Optics, Inc. | Method and apparatus for acquiring Raman spectra without background interferences |
| CN105138826A (en)* | 2015-08-10 | 2015-12-09 | 厦门大学 | Raman signal reconstruction method under strong noise background |
| WO2019084817A1 (en)* | 2017-10-31 | 2019-05-09 | 深圳达闼科技控股有限公司 | Method and device for determining focus deviation, storage medium and electronic apparatus |
- 2019
- 2019-04-23CNCN201910327330.4Apatent/CN110032988B/enactiveActive
Patent Citations (3)
| Publication number | Priority date | Publication date | Assignee | Title |
|---|---|---|---|---|
| CN101036038A (en)* | 2004-06-30 | 2007-09-12 | 化学影像公司 | Multimodal method for identifying hazardous agents |
| CN105300954A (en)* | 2015-09-02 | 2016-02-03 | 中南大学 | Method for Raman spectrum characterization of heterogeneous foam layer minerals in antimony ore flotation |
| CN107818298A (en)* | 2017-09-27 | 2018-03-20 | 厦门大学 | General Raman spectral characteristics extracting method for machine learning material recognition |
Also Published As
| Publication number | Publication date |
|---|---|
| CN110032988A (en) | 2019-07-19 |
Similar Documents
| Publication | Publication Date | Title |
|---|---|---|
| CN110032988B (en) | Real-time Noise Reduction Enhancement Method for Ultraviolet Raman Spectroscopy System | |
| CN109993155B (en) | Feature Peak Extraction Method for UV Raman Spectroscopy with Low Signal-to-Noise Ratio | |
| Yiyang | The design of glass crack detection system based on image preprocessing technology | |
| Shen et al. | An effective thin cloud removal procedure for visible remote sensing images | |
| CN105518455B (en) | Peak detection method | |
| Peregrina-Barreto et al. | Automatic grain size determination in microstructures using image processing | |
| Lu et al. | Robust and efficient saliency modeling from image co-occurrence histograms | |
| CN110632092A (en) | Detection method of pollution distribution characteristics on insulator surface based on hyperspectral technology | |
| Wang et al. | Multi‐modal image fusion based on saliency guided in NSCT domain | |
| Zhang et al. | Infrared maritime small target detection based on edge and local intensity features | |
| CN108805835A (en) | Based on the SAR image bilateral filtering method for blocking statistical nature | |
| CN116958036A (en) | Method for inspecting pollution state of insulator by unmanned aerial vehicle based on hyperspectral technology | |
| CN117629967A (en) | Quick soil layer pollution detection method based on spectral analysis | |
| Peng | Automatic Denoising and Unmixing in Hyperspectral image processing | |
| Nguyen et al. | A novel automatic concrete surface crack identification using isotropic undecimated wavelet transform | |
| CN118195973B (en) | Aeroengine appearance detection method and system | |
| CN108932491B (en) | Cosmic ray identification and removal method using five-point cubic smoothing method | |
| Wang et al. | Adaptive single image defogging based on sky segmentation | |
| CN108564054A (en) | A kind of accurate oil spilling detection method based on CFAR | |
| CN100458847C (en) | Digital image edge information extracting method | |
| Guan et al. | A new metric for latent fingerprint image preprocessing | |
| AKINTOYE et al. | COMPOSITE MEDIAN WIENER FILTER BASED TECHNIQUE FOR IMAGE ENHANCEMENT. | |
| CN106600565B (en) | A kind of method and device for rejecting spectrum picture noise spot | |
| Lu et al. | Research on the segmentation method of surface defects of galvanised sheet under complex texture background | |
| Gong et al. | Non-local and nonlinear background suppression method controlled by multi-scale clutter metric |
Legal Events
| Date | Code | Title | Description |
|---|---|---|---|
| PB01 | Publication | ||
| PB01 | Publication | ||
| SE01 | Entry into force of request for substantive examination | ||
| SE01 | Entry into force of request for substantive examination | ||
| GR01 | Patent grant | ||
| GR01 | Patent grant |