CN109409350B - A wavelength selection method based on PCA modeling feedback load weighting - Google Patents
A wavelength selection method based on PCA modeling feedback load weightingDownload PDFInfo
- Publication number
- CN109409350B CN109409350BCN201811236512.2ACN201811236512ACN109409350BCN 109409350 BCN109409350 BCN 109409350BCN 201811236512 ACN201811236512 ACN 201811236512ACN 109409350 BCN109409350 BCN 109409350B
- Authority
- CN
- China
- Prior art keywords
- load
- matrix
- wavelength
- spectral
- modeling
- Prior art date
- Legal status (The legal status is an assumption and is not a legal conclusion. Google has not performed a legal analysis and makes no representation as to the accuracy of the status listed.)
- Active
Links
Images


Classifications
- G—PHYSICS
- G06—COMPUTING OR CALCULATING; COUNTING
- G06V—IMAGE OR VIDEO RECOGNITION OR UNDERSTANDING
- G06V10/00—Arrangements for image or video recognition or understanding
- G06V10/10—Image acquisition
- G06V10/12—Details of acquisition arrangements; Constructional details thereof
- G06V10/14—Optical characteristics of the device performing the acquisition or on the illumination arrangements
- G06V10/143—Sensing or illuminating at different wavelengths
- G—PHYSICS
- G06—COMPUTING OR CALCULATING; COUNTING
- G06F—ELECTRIC DIGITAL DATA PROCESSING
- G06F18/00—Pattern recognition
- G06F18/20—Analysing
- G06F18/21—Design or setup of recognition systems or techniques; Extraction of features in feature space; Blind source separation
- G06F18/213—Feature extraction, e.g. by transforming the feature space; Summarisation; Mappings, e.g. subspace methods
- G06F18/2135—Feature extraction, e.g. by transforming the feature space; Summarisation; Mappings, e.g. subspace methods based on approximation criteria, e.g. principal component analysis
- G—PHYSICS
- G06—COMPUTING OR CALCULATING; COUNTING
- G06F—ELECTRIC DIGITAL DATA PROCESSING
- G06F18/00—Pattern recognition
- G06F18/20—Analysing
- G06F18/21—Design or setup of recognition systems or techniques; Extraction of features in feature space; Blind source separation
- G06F18/214—Generating training patterns; Bootstrap methods, e.g. bagging or boosting
- Y—GENERAL TAGGING OF NEW TECHNOLOGICAL DEVELOPMENTS; GENERAL TAGGING OF CROSS-SECTIONAL TECHNOLOGIES SPANNING OVER SEVERAL SECTIONS OF THE IPC; TECHNICAL SUBJECTS COVERED BY FORMER USPC CROSS-REFERENCE ART COLLECTIONS [XRACs] AND DIGESTS
- Y02—TECHNOLOGIES OR APPLICATIONS FOR MITIGATION OR ADAPTATION AGAINST CLIMATE CHANGE
- Y02T—CLIMATE CHANGE MITIGATION TECHNOLOGIES RELATED TO TRANSPORTATION
- Y02T10/00—Road transport of goods or passengers
- Y02T10/10—Internal combustion engine [ICE] based vehicles
- Y02T10/40—Engine management systems
Landscapes
- Engineering & Computer Science (AREA)
- Theoretical Computer Science (AREA)
- Data Mining & Analysis (AREA)
- Physics & Mathematics (AREA)
- Computer Vision & Pattern Recognition (AREA)
- General Physics & Mathematics (AREA)
- Bioinformatics & Cheminformatics (AREA)
- Bioinformatics & Computational Biology (AREA)
- Evolutionary Biology (AREA)
- Evolutionary Computation (AREA)
- Artificial Intelligence (AREA)
- General Engineering & Computer Science (AREA)
- Life Sciences & Earth Sciences (AREA)
- Multimedia (AREA)
- Investigating Or Analysing Materials By Optical Means (AREA)
Abstract
Translated fromChinese
Description
Translated fromChinese技术领域technical field
本发明涉及近红外、红外光谱分析中的建模优化领域,具体涉及建模过程中的一种基于主成分分析(PCA)建模反馈式载荷加权的波长选择方法。The invention relates to the field of modeling optimization in near-infrared and infrared spectrum analysis, in particular to a wavelength selection method based on principal component analysis (PCA) modeling feedback load weighting in the modeling process.
背景技术Background technique
光谱分析是利用不同频率的光测量物质的光谱响应数据,并通过定性或定量方法来确定待测对象中的化学成分及其含量信息的一种现代化快速检测技术。红外光介于可见光与远红外光之间,可分为近红外(NIR)、中红外(简称红外,MIR)两个常用技术谱段。近年来随着大数据科学、计算机技术和化学计量学的发展,NIR/MIR分析技术以其分析速度快、效率高、成本低、非破坏性、可实时在线分析、多成分同时检测等特点,在食品、农业、环境、生物医学等众多领域得到广泛的应用。光谱分析的一般过程分为样本划分、数据预处理、波长特征筛选、建模预测、模型检验五个阶段。研究学者们已经在数据预处理、波长特征筛选、建模预测这几个阶段做了很多研究工作。Spectral analysis is a modern rapid detection technology that uses light of different frequencies to measure the spectral response data of substances, and uses qualitative or quantitative methods to determine the chemical composition and content information in the object to be tested. Infrared light is between visible light and far-infrared light, and can be divided into two common technical spectrum bands: near-infrared (NIR) and mid-infrared (referred to as infrared, MIR). In recent years, with the development of big data science, computer technology and chemometrics, NIR/MIR analysis technology has the characteristics of fast analysis speed, high efficiency, low cost, non-destructive, real-time online analysis, and simultaneous detection of multiple components. It has been widely used in many fields such as food, agriculture, environment, and biomedicine. The general process of spectral analysis is divided into five stages: sample division, data preprocessing, wavelength feature screening, modeling prediction, and model checking. Researchers have done a lot of research work in the stages of data preprocessing, wavelength feature screening, and modeling prediction.
然而,近年来,研制基于连续长波段的通用型光谱检测仪器的技术已经趋于成熟,但是连续波段通用型光谱仪的体积庞大、价格昂贵、不便于携带,现阶段主要应用于实验室检测,不利于推广应用。此外,对于不同对象都不作区分地进行全谱扫描,由于波长变量个数众多、光谱响应信号重叠严重、单目标对应的光谱吸收峰不能突显,不能快速有效地实现实时在线检测。因此,为了在某一领域中实现多目标同时快速检测,有必要研发便携式的小型专用光谱仪,这其中涉及的关键技术是如何快速有效地选取具有高信噪比的光谱波长变量(信息变量)进行组合建模优化。但已有研究多为对波长变量进行空间变换后筛选出对应的特征变量,并不是对原始波长变量的筛选;如果能够利用比较简单的算法过程能够实现对光谱数据原始波长变量进行筛选,将是光谱分析的计量方法研究中的一项突破。However, in recent years, the technology of developing general-purpose spectral detection instruments based on continuous long-wavelength bands has become mature. However, continuous-wavelength general-purpose spectrometers are bulky, expensive, and inconvenient to carry. At this stage, they are mainly used in laboratory testing. To promote the application. In addition, full-spectrum scanning is performed for different objects without distinction. Due to the large number of wavelength variables, the serious overlap of spectral response signals, and the inability to highlight the spectral absorption peak corresponding to a single target, real-time online detection cannot be quickly and effectively achieved. Therefore, in order to realize the simultaneous and rapid detection of multiple targets in a certain field, it is necessary to develop a small portable spectrometer. The key technology involved is how to quickly and effectively select the spectral wavelength variable (information variable) with high signal-to-noise ratio for Combinatorial modeling optimization. However, most of the existing researches are to screen out the corresponding characteristic variables after spatial transformation of the wavelength variables, not the screening of the original wavelength variables. A breakthrough in the study of metrological methods for spectroscopic analysis.
由于近红外、红外光谱的响应数据通常不具备明显的单目标吸收峰,光谱共线性问题一直是影响长波段光谱数据建模精度的技术障碍。常用的消除共线性的计量学算法有主成分分析(PCA)和偏最小二乘法(PLS),它们是通过坐标转换的方式将原始波长变量投影到一个新的坐标空间,使得在新的坐标中的成分变量两两之间具有最大的差异;其中PLS的算法步骤也采用了PCA算法的思想。基于此,本发明提出一种基于PCA建模反馈式载荷加权的波长选择方法(简称载荷加权波长选择方法,LWVS方法);该方法可以实现单独利用PCA算法,结合简易计量学线性建模方法,即可在原始光谱的序列数据中选择信息波长变量,并非选择空间变换后的特征变量;利用模型优化系数反馈作为各个载荷变量的组合系数,以衡量各个原始波长变量在新坐标成分变量中的贡献程度,进而实现在光谱分析的波长特征筛选阶段完成对原始波长信息变量的选择。Since the response data of near-infrared and infrared spectra usually do not have obvious single-target absorption peaks, the problem of spectral collinearity has always been a technical obstacle that affects the modeling accuracy of long-band spectral data. Commonly used metrology algorithms to eliminate collinearity are Principal Component Analysis (PCA) and Partial Least Squares (PLS), which project the original wavelength variable into a new coordinate space by coordinate transformation, so that in the new coordinate There is the largest difference between the component variables of PLS; the algorithm steps of PLS also adopt the idea of PCA algorithm. Based on this, the present invention proposes a wavelength selection method based on PCA modeling feedback load weighting (referred to as load weighted wavelength selection method, LWVS method); this method can realize the use of PCA algorithm alone, combined with simple metrology linear modeling method, The information wavelength variable can be selected in the sequence data of the original spectrum, not the characteristic variable after spatial transformation; the model optimization coefficient feedback is used as the combination coefficient of each load variable to measure the contribution of each original wavelength variable in the new coordinate component variable degree, and then realize the selection of the original wavelength information variable in the wavelength feature screening stage of spectral analysis.
发明内容SUMMARY OF THE INVENTION
本发明是为近红外、红外光谱定性/定量分析技术提供一种基于PCA建模反馈式载荷加权的波长选择方法(LWVS)。该方法是只需要对PCA基本算法过程中进行整合和改进,就能在波长特征选择的阶段中完成对光谱数据原始波长的筛选,通过内部自建模的方式选择信息波长。该方法所选波长是为光谱数据原始波长,与空间变换的特征变量具有本质的区别。The invention provides a wavelength selection method (LWVS) based on PCA modeling feedback load weighting for near-infrared and infrared spectrum qualitative/quantitative analysis technology. This method only needs to integrate and improve the basic algorithm process of PCA, and can complete the screening of the original wavelength of the spectral data in the stage of wavelength feature selection, and select the information wavelength by means of internal self-modeling. The wavelength selected by this method is the original wavelength of the spectral data, which is essentially different from the characteristic variable of spatial transformation.
数据准备:利用(近)红外光谱仪器测量光谱数据,设置测量的光谱波段起止位置和光谱分辨率,以确定输出的连续光谱波段共包含p个波长变量;将n个样本逐次放入光谱仪中进行测量,获得光谱响应数据以矩阵的形式保存,称为光谱矩阵Xn×p;此外,利用常规化学方法定性/定量测定相同n个样本的某个目标成分含量,作为光谱分析建模优化的目标数据Yn×1。Data preparation: Use (near) infrared spectroscopy to measure spectral data, set the starting and ending positions of the measured spectral bands and spectral resolution to determine that the output continuous spectral bands contain p wavelength variables in total; put n samples into the spectrometer one by one for Measure, obtain the spectral response data and save it in the form of a matrix, called spectral matrix Xn×p ; in addition, use conventional chemical methods to qualitatively/quantitatively determine the content of a certain target component in the same n samples, as the target of spectral analysis modeling optimization Data Yn×1 .
本发明LWVS方法的具体步骤为:The concrete steps of the LWVS method of the present invention are:
步骤一,提取载荷向量。根据PCA算法原理,首先计算光谱矩阵Xn×p是协方差矩阵(或相关系数矩阵),记为MXp×p,进一步计算确定MX矩阵的特征值集合LVp×1和特征向量集合LOADp×p,即满足The first step is to extract the load vector. According to the principle of the PCA algorithm, first calculate the spectral matrix Xn×p is the covariance matrix (or correlation coefficient matrix), denoted as MXp×p , and further calculate and determine the eigenvalue set LVp×1 of the MX matrix and the eigenvector set LOADp ×p , that is, to satisfy

其中,
步骤二,载荷向量排序。将向量LV中的数值和矩阵LOAD中的列向量按照LV的数值从大到小排序,则LOAD的列向量(载荷向量)两两之间具有最大差异(协方差)。The second step is to sort the load vector. The values in the vector LV and the column vectors in the matrix LOAD are sorted according to the values of LV from large to small, and the column vectors (loading vectors) of LOAD have the largest difference (covariance) in pairs.
步骤三,计算得分向量。根据PCA原理,将光谱矩阵X进行标准化变换后计算得分矩阵Fn×p;标准化的方法有多种,如归一变换、变异系数变换、正态标准化等,可以选择其中一种方法,经过标准化变换后的光谱矩阵Xstand,进而可计算得到F,Step 3: Calculate the score vector. According to the PCA principle, the spectrum matrix X is standardized and transformed to calculate the score matrix Fn×p ; there are many standardized methods, such as normalization transformation, coefficient of variation transformation, normal standardization, etc., one of the methods can be selected, after standardization The transformed spectral matrix Xstand , and then F can be calculated,

可以验证,每个得分向量Fi的方差值与对应每个特征值LV(i)相等,即It can be verified that the variance value of each score vector Fi is equal to the corresponding eigenvalue LV(i), that is
var(Fi)=LV(i),i=1,2…p,var(Fi )=LV(i), i=1,2...p,
其中,Fi=(F1i,F2i…Fni)′。Wherein, Fi =(F1i , F2i . . . Fni )'.
步骤四,确定主成分数量。计算每个主成分变量的方差贡献率CR(i),每个主成分变量的方差所占全部主成分变量方差总和的比例即为该主成分变量的贡献率,即Step 4: Determine the number of principal components. Calculate the variance contribution rate CR(i) of each principal component variable, and the proportion of the variance of each principal component variable to the sum of the variances of all principal component variables is the contribution rate of the principal component variable, namely

按照LV数值从大到小的顺序,选取累积贡献率足够大的前面t个主成分变量F1,F2…Ft组合成为PCA算法的得分矩阵

步骤五,优化模型系数。利用主成分得分矩阵
步骤六,获取波长权重。将光谱建模优化获得的判别系数/回归系数coefft×1反馈作用于PCA的载荷矩阵

即可根据波长变量的权重值选择对于模型贡献较大的波长集合。That is, the wavelength set that contributes more to the model can be selected according to the weight value of the wavelength variable.
与现有技术相比,本发明的LWVS方法的优势在于,基于经典的PCA算法的特征值分解原理,仅在波长特征选择的阶段中,通过自建模型进行训练和优化调试,将建模系数反馈式地传输给载荷向量进行加权组合,完成对每一个原始波长变量加以信息度的衡量,进而选择有效的具有较高信噪比的信息波长集合;反馈式加权组合方法使得单独利用PCA算法就能够完成对光谱数据原始波长的优选,为后期进行建模预测、模型检验提供数据筛选方法;该方法能够大大减少建模波长数量,降低模型复杂度,缩短运算时间,可操作性强,能够为光谱分析模型的变量筛选优化过程提高效率。筛选得到的波长组合可以结合利用简单的LDA或MLR方法完成定性/定量分析,所得模型预测效果和连续长波段所建模型的性能指标相近,可以胜任待测对象的近红外/红外光谱快速检测,为小型专用的(近)红外光谱仪器的研发、生产和推广应用提供了算法理论基础和技术支持。Compared with the prior art, the advantage of the LWVS method of the present invention is that, based on the eigenvalue decomposition principle of the classical PCA algorithm, only in the stage of wavelength feature selection, training and optimization and debugging are carried out through self-built models, and the modeling coefficients are Feedback is transmitted to the load vector for weighted combination, and the information degree of each original wavelength variable is measured, and then an effective information wavelength set with higher signal-to-noise ratio is selected; the feedback weighted combination method makes the PCA algorithm alone. It can complete the optimization of the original wavelength of the spectral data, and provide a data screening method for modeling prediction and model verification in the later stage; this method can greatly reduce the number of modeling wavelengths, reduce the complexity of the model, shorten the calculation time, and has strong operability. The variable screening optimization process of the spectral analysis model improves efficiency. The wavelength combinations obtained by screening can be combined with simple LDA or MLR methods to complete qualitative/quantitative analysis. The prediction effect of the obtained model is similar to the performance indicators of the model built with continuous long wavelength bands, which can be competent for the rapid detection of near-infrared/infrared spectrum of the object to be measured. The theoretical basis and technical support of the algorithm are provided for the research, development, production and popularization and application of small and dedicated (near) infrared spectroscopy instruments.
本发明的LWVS方法针对近红外、红外光谱分析领域而提出,同时可以应用于远红外、紫外等不同频段的光谱分析过程,并有望推广至高光谱图像分析领域。已经在土壤总氮的FT-NIR定量分析、咖啡因的NIR判别分析中得到验证。The LWVS method of the present invention is proposed for the field of near-infrared and infrared spectral analysis, and can be applied to the spectral analysis process of different frequency bands such as far-infrared and ultraviolet, and is expected to be extended to the field of hyperspectral image analysis. It has been verified in FT-NIR quantitative analysis of soil total nitrogen and NIR discriminant analysis of caffeine.
附图说明Description of drawings
图1为本发明的LWVS的算法流程示意图。FIG. 1 is a schematic flowchart of an algorithm of LWVS of the present invention.
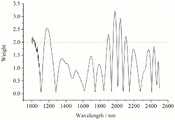
图2为本发明实施例1中LWVS方法应用于咖啡样本咖啡因的NIR判别分析中得到的每个原始光谱波长变量的信息权重分布及波长选择方案图示。FIG. 2 is a diagram illustrating the information weight distribution and wavelength selection scheme of each original spectral wavelength variable obtained in the NIR discriminant analysis of caffeine in coffee samples by applying the LWVS method in Example 1 of the present invention.
图3为本发明实施例2中LWVS方法应用于土壤样本总氮含量的FT-NIR定量分析中得到的每个原始光谱波长变量的信息权重分布及波长选择方案图示。FIG. 3 is a diagram illustrating the information weight distribution and wavelength selection scheme of each original spectral wavelength variable obtained in the FT-NIR quantitative analysis of the total nitrogen content of soil samples using the LWVS method in Example 2 of the present invention.
具体实施方式Detailed ways
以下将利用两个实施例对本发明予以进一步的说明,但并不因此而限制本发明。The present invention will be further described below by using two embodiments, but the present invention is not limited thereby.
实施例1:Example 1:
咖啡样本咖啡因成分的NIR光谱定性判别。共有174个粉末状咖啡固体样品,其中116个样本包含咖啡因,58个样本不包含咖啡因,光谱测量设置的连续长波段区域是1000-2500(nm),相邻波长间隔2nm,每个样本测得共有750个波长变量的光谱值;光谱建模采用留一交叉检验的模式,利用本发明的LWVS方法选择具有较高信噪比的信息波长集合,结合LDA方法进行进一步的建模判别,构建混淆矩阵来量化衡量判别准确率。Qualitative NIR spectral discrimination of caffeine components in coffee samples. There are a total of 174 powdered coffee solid samples, of which 116 samples contain caffeine and 58 samples do not contain caffeine. The continuous long-band region of the spectral measurement setting is 1000-2500 (nm), and the adjacent wavelengths are separated by 2 nm. Each sample A total of 750 spectral values of wavelength variables are measured; the spectral modeling adopts the mode of leave-one-out cross-checking, and the LWVS method of the present invention is used to select the information wavelength set with higher signal-to-noise ratio, and the LDA method is used for further modeling and discrimination, Construct a confusion matrix to quantitatively measure the discriminant accuracy.
具体步骤为:步骤一,计算光谱矩阵X174×750的协方差矩阵MX750×750,并计算MX矩阵的特征值LV750×1和特征向量集合LOAD750×750,确定载荷矩阵。步骤二,根据750个特征值的数值按照从大到小排序将载荷向量从新排序。步骤三,本实施例中使用归一化方法将光谱矩阵X进行标准变换,进而计算得分矩阵F174×750;步骤四,计算每个主成分变量的方差贡献率CR(i),根据数据情况,只计算i=1,2…20的主成分贡献率,进而选取累积贡献率达到99.95%的13个主成分变量组合成为PCA算法的得分矩阵


实施例2:Example 2:
土壤样本总氮含量的FT-NIR光谱定量分析。共有135个粉末状固体土壤样品,总氮含量范围是0.056-0.289(wt%),光谱测量设置的连续长波段区域是9800-4200(cm-1),光谱分辨率为8cm-1,每个样本测得共有1410个波长变量的光谱值;光谱建模采用留一交叉检验的模式,利用本发明的LWVS方法选择具有较高信噪比的信息波长集合,结合MLR方法进行进一步的建模预测,使用均方根偏差(RMSE)来量化衡量建模预测效果。Quantitative analysis of total nitrogen content in soil samples by FT-NIR spectroscopy. There are a total of 135 powdered solid soil samples, the total nitrogen content range is 0.056-0.289 (wt%), the continuous long-band region of the spectral measurement setting is 9800-4200 (cm-1 ), the spectral resolution is 8 cm-1 , each Spectral values of a total of 1410 wavelength variables are measured in the sample; the spectral modeling adopts the leave-one-out cross-check mode, and the LWVS method of the present invention is used to select the information wavelength set with higher signal-to-noise ratio, and the MLR method is used for further modeling prediction. , using the root mean square deviation (RMSE) to quantify the prediction effect of modeling.
具体步骤为:步骤一,计算光谱矩阵X135×1410的协方差矩阵MX1410×1410,并计算MX矩阵的特征值LV1410×1和特征向量集合LOAD1410×1410,确定载荷矩阵。步骤二,根据1410个特征值的数值按照从大到小排序将载荷向量从新排序。步骤三,本实施例中使用归一化方法将光谱矩阵X进行标准变换,进而计算得分矩阵F135×1410;步骤四,计算每个主成分变量的方差贡献率CR(i),根据数据情况,只计算i=1,2…20的主成分贡献率,进而选取累积贡献率达到99.8%的9个主成分变量组合成为PCA算法的得分矩阵


Claims (1)


Priority Applications (1)
| Application Number | Priority Date | Filing Date | Title |
|---|---|---|---|
| CN201811236512.2ACN109409350B (en) | 2018-10-23 | 2018-10-23 | A wavelength selection method based on PCA modeling feedback load weighting |
Applications Claiming Priority (1)
| Application Number | Priority Date | Filing Date | Title |
|---|---|---|---|
| CN201811236512.2ACN109409350B (en) | 2018-10-23 | 2018-10-23 | A wavelength selection method based on PCA modeling feedback load weighting |
Publications (2)
| Publication Number | Publication Date |
|---|---|
| CN109409350A CN109409350A (en) | 2019-03-01 |
| CN109409350Btrue CN109409350B (en) | 2022-05-31 |
Family
ID=65468909
Family Applications (1)
| Application Number | Title | Priority Date | Filing Date |
|---|---|---|---|
| CN201811236512.2AActiveCN109409350B (en) | 2018-10-23 | 2018-10-23 | A wavelength selection method based on PCA modeling feedback load weighting |
Country Status (1)
| Country | Link |
|---|---|
| CN (1) | CN109409350B (en) |
Families Citing this family (6)
| Publication number | Priority date | Publication date | Assignee | Title |
|---|---|---|---|---|
| CN110006844A (en)* | 2019-05-22 | 2019-07-12 | 安徽大学 | Method and system for feature extraction of near-infrared spectrum based on functional principal component analysis |
| CN111007033B (en)* | 2019-12-09 | 2022-08-30 | 温州大学 | Trace acetylene gas concentration detection method based on spectrum and power spectrum feature fusion |
| CN111999258B (en)* | 2020-07-03 | 2022-06-17 | 桂林理工大学 | A Weighted Modeling Local Optimization Method for Spectral Baseline Correction |
| CN113740277A (en)* | 2021-10-15 | 2021-12-03 | 北方民族大学 | An Environmental Safety Analysis Method Based on Spectral Multicomponent Analysis |
| CN114113035B (en)* | 2021-11-18 | 2024-02-02 | 北京理工大学 | Identification method of transgenic soybean oil |
| CN118940070A (en)* | 2024-07-24 | 2024-11-12 | 成都环境地质与资源开发研究所有限责任公司 | A method for preprocessing field rock and mineral spectral data |
Citations (5)
| Publication number | Priority date | Publication date | Assignee | Title |
|---|---|---|---|---|
| CN101430276A (en)* | 2008-12-15 | 2009-05-13 | 北京航空航天大学 | Wavelength variable optimization method in spectrum analysis |
| CN102854151A (en)* | 2012-10-06 | 2013-01-02 | 桂林理工大学 | Chemometrics method for classifying sample sets in spectrum analysis |
| CN104965973A (en)* | 2015-06-05 | 2015-10-07 | 西北农林科技大学 | Apple molding core multi-factor nondestructive testing judgment model and establishing method thereof |
| CN107271389A (en)* | 2017-06-24 | 2017-10-20 | 桂林理工大学 | A kind of spectral signature variable fast matching method based on index extreme value |
| CN108414472A (en)* | 2018-01-25 | 2018-08-17 | 宜宾学院 | The near-infrared spectrum method of pure wool product identification |
Family Cites Families (5)
| Publication number | Priority date | Publication date | Assignee | Title |
|---|---|---|---|---|
| US5568400A (en)* | 1989-09-01 | 1996-10-22 | Stark; Edward W. | Multiplicative signal correction method and apparatus |
| CN101825567A (en)* | 2010-04-02 | 2010-09-08 | 南开大学 | Screening method for near infrared spectrum wavelength and Raman spectrum wavelength |
| KR102272697B1 (en)* | 2014-07-24 | 2021-07-02 | 삼성전자주식회사 | System and method for spectral ellipsometry measurement and data analyze device and method |
| CN106845051A (en)* | 2015-12-04 | 2017-06-13 | 北京光巨力信息技术有限公司 | A kind of near infrared no-wound blood sugar test wavelength Variable Selection method based on Combinatorial Optimization |
| CN106248617A (en)* | 2016-07-12 | 2016-12-21 | 上海创和亿电子科技发展有限公司 | Based near infrared tobacco tar detection method |
- 2018
- 2018-10-23CNCN201811236512.2Apatent/CN109409350B/enactiveActive
Patent Citations (5)
| Publication number | Priority date | Publication date | Assignee | Title |
|---|---|---|---|---|
| CN101430276A (en)* | 2008-12-15 | 2009-05-13 | 北京航空航天大学 | Wavelength variable optimization method in spectrum analysis |
| CN102854151A (en)* | 2012-10-06 | 2013-01-02 | 桂林理工大学 | Chemometrics method for classifying sample sets in spectrum analysis |
| CN104965973A (en)* | 2015-06-05 | 2015-10-07 | 西北农林科技大学 | Apple molding core multi-factor nondestructive testing judgment model and establishing method thereof |
| CN107271389A (en)* | 2017-06-24 | 2017-10-20 | 桂林理工大学 | A kind of spectral signature variable fast matching method based on index extreme value |
| CN108414472A (en)* | 2018-01-25 | 2018-08-17 | 宜宾学院 | The near-infrared spectrum method of pure wool product identification |
Non-Patent Citations (3)
| Title |
|---|
| Wavenumbers Combination Optimization for NIRS Analysis of Glucose in Human Serum;Jun Xie等;《2010 Symposium on Photonics and Optoelectronics》;20100708;第1-4页* |
| 基于主成分分析的消光法波长选择算法;唐红等;《光电工程》;20100531;第37卷(第5期);第56-62页* |
| 近红外光谱新型建模方法与应用基础研究;张红光;《中国博士学位论文全文数据库 基础科学辑》;20160815(第(2016)08期);A005-32第1.3.2、1.3.5、3.2.1节* |
Also Published As
| Publication number | Publication date |
|---|---|
| CN109409350A (en) | 2019-03-01 |
Similar Documents
| Publication | Publication Date | Title |
|---|---|---|
| CN109409350B (en) | A wavelength selection method based on PCA modeling feedback load weighting | |
| Jin et al. | Comparison of different satellite bands and vegetation indices for estimation of soil organic matter based on simulated spectral configuration | |
| WO2016000088A1 (en) | Hyperspectral waveband extraction method based on optimal index factor-correlation coefficient method | |
| CN102564993B (en) | Method for identifying rice varieties by using Fourier transform infrared spectrum and application of method | |
| CN113008805B (en) | Radix angelicae decoction piece quality prediction method based on hyperspectral imaging depth analysis | |
| CN115436407B (en) | Element content quantitative analysis method combining random forest regression with principal component analysis | |
| CN106951720B (en) | Soil nutrient Model transfer method based on canonical correlation analysis and linear interpolation | |
| CN107247033B (en) | The method of identifying the maturity of Huanghua pear based on the fast decay elimination algorithm and PLSDA | |
| CN104965973B (en) | A multi-factor non-destructive detection discriminant model of apple mold core and its establishment method | |
| CN109376805A (en) | A classification method based on the fingerprint characteristics of liquor base wine | |
| CN108169165B (en) | Maltose mixture quantitative analysis method based on terahertz spectrum and image information fusion | |
| CN105486655A (en) | Rapid detection method for organic matters in soil based on infrared spectroscopic intelligent identification model | |
| CN110503156A (en) | A Multivariate Calibration Feature Wavelength Selection Method Based on Minimum Correlation Coefficient | |
| CN111855608A (en) | A near-infrared non-destructive testing method for apple acidity based on fusion feature wavelength selection algorithm | |
| CN118518625B (en) | Pretreatment method for near-infrared modeling of key nutrition parameters of whole fresh corn plants | |
| Du et al. | Quantitative detection of azodicarbonamide in wheat flour by near-infrared spectroscopy based on two-step feature selection | |
| Liu et al. | Estimation of wheat biomass based on phenological identification and spectral response | |
| CN117874609A (en) | Universal rapid method for rapidly identifying whether natural product is specific production place | |
| CN118706680A (en) | Jet fuel multi-index detection method, system, medium and electronic device | |
| CN111999258B (en) | A Weighted Modeling Local Optimization Method for Spectral Baseline Correction | |
| CN106092893A (en) | A kind of wavelength method for optimizing of spectrum discriminant analysis | |
| Sang et al. | Exploring soil multi-parameter stacking measurement through Raman and NIR dual-spectroscopy | |
| CN114971259A (en) | Method for analyzing quality consistency of formula product by using near infrared spectrum | |
| CN111650130A (en) | A kind of prediction method and prediction system of magnesium content in litchi leaves | |
| CN107179292B (en) | Different near infrared spectrum variable optimization result fusion method and application |
Legal Events
| Date | Code | Title | Description |
|---|---|---|---|
| PB01 | Publication | ||
| PB01 | Publication | ||
| SE01 | Entry into force of request for substantive examination | ||
| SE01 | Entry into force of request for substantive examination | ||
| GR01 | Patent grant | ||
| GR01 | Patent grant |