CN109407652B - Multivariable industrial process fault detection method based on main and auxiliary PCA models - Google Patents
Multivariable industrial process fault detection method based on main and auxiliary PCA modelsDownload PDFInfo
- Publication number
- CN109407652B CN109407652BCN201811503665.9ACN201811503665ACN109407652BCN 109407652 BCN109407652 BCN 109407652BCN 201811503665 ACN201811503665 ACN 201811503665ACN 109407652 BCN109407652 BCN 109407652B
- Authority
- CN
- China
- Prior art keywords
- data set
- formula
- variable
- spe
- fault
- Prior art date
- Legal status (The legal status is an assumption and is not a legal conclusion. Google has not performed a legal analysis and makes no representation as to the accuracy of the status listed.)
- Active
Links
Images


Classifications
- G—PHYSICS
- G05—CONTROLLING; REGULATING
- G05B—CONTROL OR REGULATING SYSTEMS IN GENERAL; FUNCTIONAL ELEMENTS OF SUCH SYSTEMS; MONITORING OR TESTING ARRANGEMENTS FOR SUCH SYSTEMS OR ELEMENTS
- G05B23/00—Testing or monitoring of control systems or parts thereof
- G05B23/02—Electric testing or monitoring
- G05B23/0205—Electric testing or monitoring by means of a monitoring system capable of detecting and responding to faults
- G05B23/0218—Electric testing or monitoring by means of a monitoring system capable of detecting and responding to faults characterised by the fault detection method dealing with either existing or incipient faults
- G05B23/0243—Electric testing or monitoring by means of a monitoring system capable of detecting and responding to faults characterised by the fault detection method dealing with either existing or incipient faults model based detection method, e.g. first-principles knowledge model
- G—PHYSICS
- G05—CONTROLLING; REGULATING
- G05B—CONTROL OR REGULATING SYSTEMS IN GENERAL; FUNCTIONAL ELEMENTS OF SUCH SYSTEMS; MONITORING OR TESTING ARRANGEMENTS FOR SUCH SYSTEMS OR ELEMENTS
- G05B2219/00—Program-control systems
- G05B2219/20—Pc systems
- G05B2219/24—Pc safety
- G05B2219/24065—Real time diagnostics
Landscapes
- Physics & Mathematics (AREA)
- General Physics & Mathematics (AREA)
- Engineering & Computer Science (AREA)
- Automation & Control Theory (AREA)
- Testing And Monitoring For Control Systems (AREA)
Abstract
Translated fromChinese
Description
Translated fromChinese技术领域technical field
本发明属于工业过程故障检测技术领域,涉及一种基于主辅PCA模型(英文:Primary Assisted Principal Component Analysis,简称:PA-PCA)的多变量工业过程故障检测方法。The invention belongs to the technical field of industrial process fault detection, and relates to a multivariable industrial process fault detection method based on a primary and auxiliary PCA model (English: Primary Assisted Principal Component Analysis, PA-PCA for short).
背景技术Background technique
由于现代工业系统日益复杂化,人们对过程安全和产品质量日益重视,故障诊断在工业生产中的地位越来越重要。随着存储技术的发展,大量生产过程数据被采集并记录。因此,基于数据驱动的故障诊断方法得到了广泛应用。经典的故障检测方法包括主元分析(PCA)、独立元分析(ICA)和费舍尔判别分析(FDA)等方法。其中PCA方法近年来成为控制领域研究的热点,并得到了研究者们的广泛应用,但该方法仍然存在一些问题值得进一步研究。传统的PCA方法在进行统计建模时仅仅利用正常数据,忽略了部分已知先验故障信息,造成部分重要信息的遗漏和浪费,从而导致故障检测性能降低。因此,如何有效利用已知先验故障数据挖掘有效信息提高PCA的故障检测性能,已经成为一种具有挑战性的课题。Due to the increasing complexity of modern industrial systems, people pay more and more attention to process safety and product quality, and fault diagnosis plays an increasingly important role in industrial production. With the development of storage technology, a large amount of production process data is collected and recorded. Therefore, data-driven fault diagnosis methods have been widely used. Classical fault detection methods include principal component analysis (PCA), independent component analysis (ICA), and Fisher discriminant analysis (FDA). Among them, the PCA method has become a hot spot in the field of control research in recent years, and has been widely used by researchers, but there are still some problems in this method that deserve further study. The traditional PCA method only uses normal data in statistical modeling, ignoring part of the known prior fault information, resulting in the omission and waste of some important information, resulting in the degradation of fault detection performance. Therefore, how to effectively use the known prior fault data to mine effective information to improve the fault detection performance of PCA has become a challenging topic.
发明内容SUMMARY OF THE INVENTION
本发明针对传统PCA方法存在的无法深入挖掘与故障相关的局部信息导致故障检测性能低等问题,提供一种基于主辅PCA模型的多变量工业过程故障检测方法。该方法能够利用先验故障信息并能够深入挖掘变量局部信息,提高故障检测率,进而改善故障检测结果。The invention provides a multivariable industrial process fault detection method based on the primary and secondary PCA models, aiming at the problems of low fault detection performance caused by the inability to deeply mine local information related to faults in the traditional PCA method. The method can utilize the prior fault information and deeply mine the local information of variables, improve the fault detection rate, and then improve the fault detection results.
为了达到上述目的,本发明提供了一种基于主辅PCA模型的多变量工业过程故障检测方法,含有以下步骤:In order to achieve the above object, the present invention provides a multivariate industrial process fault detection method based on the primary and secondary PCA model, which includes the following steps:
(一)收集历史数据库中的正常数据集X和C类已知故障数据集Fc,c=1,2,...,C作为训练数据集,并使用正常数据集X的均值μ和标准差σ对训练数据集X和Fc进行标准化处理,得到标准化后的训练数据集

(二)对数据集
(三)计算故障数据集相对于正常数据集的相对互信息矩阵ΔRc,c=1,2,...,C;(3) Calculate the relative mutual information matrix ΔRc ,c=1,2,...,C of the fault data set relative to the normal data set;
(四)对相对互信息矩阵ΔRc,基于广义Dice系数对过程变量进行变量分组,获得分组后的数据集
(五)对分组后的数据集建立PCA模型作为辅助监控模型;(5) Establish a PCA model for the grouped data set as an auxiliary monitoring model;
(六)采集测试数据集xnew,利用正常数据集X的均值μ和标准差σ对测试数据集xnew进行标准化处理,得到标准化后的测试数据集
(七)将数据集


(八)整合所有监控结果得到总的监控统计量


进一步的,所述步骤(一)中,利用正常数据集的均值μ和标准差σ通过公式(1)对训练数据集X和Fc进行标准化处理,公式(1)的表达式为:Further, in the step (1), the training data set X and Fc are standardized by formula (1) using the mean μ and standard deviation σ of the normal data set, and the expression of formula (1) is:

训练数据集X和Fc经上述公式(1)标准化处理后即可获得标准化后的训练数据集

进一步的,所述步骤(二)中,对训练数据集

式中,T为数据集

进一步的,步骤(三)中,相对互信息矩阵ΔRc的计算步骤为:Further, in step (3), the calculation steps of the relative mutual information matrix ΔRc are:
通过公式(3)计算数据集


式中,m表示变量个数,Rij表示数据集

相对互信息矩阵ΔRc则表示为:The relative mutual information matrix ΔRc is expressed as:

进一步的,步骤(四)中,进行变量分组的具体步骤为:Further, in step (4), the concrete steps of carrying out variable grouping are:
(1)定义相对互信息向量为:(1) Define the relative mutual information vector as:
ri=[ΔRc,i1,ΔRc,i2,…,ΔRc,im]T (6)ri =[ΔRc,i1 ,ΔRc,i2 ,...,ΔRc,im ]T (6)
用广义Dice系数衡量某一变量与其余变量之间相对互信息相关度的相似性,定义为:The generalized Dice coefficient is used to measure the similarity of relative mutual information correlation between a variable and other variables, which is defined as:

式中,0≤Si,j≤1;In the formula, 0≤Si,j ≤1;
选择使||ri||最大的变量作为第一个变量组并初始化变量组的个数Bc=1;Select the variable that maximizes ||ri || as the first variable group and initialize the number of variable groups Bc =1;
(2)按照变量顺序选择下一个向量rj,其中j≠i且j≤m,并通过公式(8)计算向量rj与已知变量组中各向量相似性的均值,公式(8)表示为::(2) Select the next vector rj according to the variable order, where j≠i and j≤m, and calculate the mean value of the similarity between the vector rj and each vector in the known variable group by formula (8), formula (8) represents for::

式中,b表示第b个变量组,nb表示第b个变量组内变量的个数;In the formula, b represents the b-th variable group, and nb represents the number of variables in the b-th variable group;
(3)确定
(4)重复步骤(2)和步骤(3)直至所有的变量分组完成,即
进一步的,步骤(五)中,对变量分组后的数据集


式中,Tc,b为数据集

进一步的,步骤(六)中,利用正常数据集X的均值μ和标准差σ通过公式(10)对测试数据集xnew进行标准化处理,进行标准化处理,公式(10)的表达式为:Further, in step (6), the test data set xnew is standardized by formula (10) using the mean μ and standard deviation σ of the normal data set X, and the standardization process is performed, and the expression of formula (10) is:

测试数据集xnew经上述公式(10)标准化处理后即可获得标准化后的测试数据集
进一步的,步骤(七)中,通过公式(11)和公式(12)计算数据集


式中,Σ表示主监控模型特征值组成的对角阵;In the formula, Σ represents the diagonal matrix composed of the eigenvalues of the main monitoring model;
通过公式(13)和公式(14)计算数据集


式中,Σc,b表示辅监控模型特征值组成的对角阵,

进一步的,步骤(八)中,采用贝叶斯推理整合所有监控结果,具体步骤为:Further, in step (8), Bayesian reasoning is used to integrate all monitoring results, and the specific steps are:
定义样本

式中,S表示统计量T2、统计量SPE、统计量


式中,Slim表示统计量T2、统计量SPE、统计量


进一步的,步骤(八)中,依据融合后的总监控统计量


与现有技术相比,本发明的有益效果在于:Compared with the prior art, the beneficial effects of the present invention are:
本发明提供的多变量工业过程故障检测方法,计算先验故障和正常数据的相对互信息衡量由于故障的发生所引起变量间相关关系结构变化的差异性,借助广义Dice对变量进行分组,不仅能够充分利用已知先验故障信息,尽可能避免有用故障信息的浪费和遗漏,还能够通过变量分组提取变量的局部信息;在此基础上,分别对包含所有变量的正常数据集建立PCA模型作为主监控模型和在不同变量组的数据集建立PCA子模型作为辅助监控模型,并应用贝叶斯推理整合变量组的信息得到总的监控统计量,根据监控统计量是否超出控制限判断测试数据集是否发生故障,通过融合后的统计量判断是否发生故障,进而改善故障检测结果,提高故障检测率。The multivariable industrial process fault detection method provided by the present invention calculates the relative mutual information of prior fault and normal data to measure the difference of the structural change of the correlation relationship between variables caused by the occurrence of the fault, and groups the variables with the help of generalized Dice, which not only can Make full use of known prior fault information, avoid waste and omission of useful fault information as much as possible, and can also extract local information of variables through variable grouping; on this basis, establish PCA models for normal data sets containing all variables as the main The monitoring model and the PCA sub-model established in the data sets of different variable groups are used as auxiliary monitoring models, and Bayesian inference is used to integrate the information of the variable groups to obtain the total monitoring statistics, and judge whether the test data set is not based on whether the monitoring statistics exceed the control limit. When a fault occurs, it is judged whether a fault has occurred through the fused statistics, thereby improving the fault detection result and improving the fault detection rate.
附图说明Description of drawings
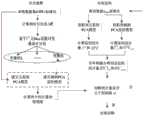
图1为本发明基于主辅PCA模型的多变量工业过程故障检测方法的流程图;Fig. 1 is the flow chart of the multivariate industrial process fault detection method based on the main and auxiliary PCA model of the present invention;
图2为本发明实施例所述CSTR控制系统的结构图;2 is a structural diagram of the CSTR control system according to an embodiment of the present invention;
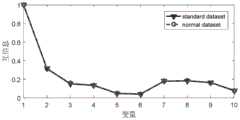
图3a为本发明实施例采用本发明基于主辅PCA模型的多变量工业过程故障检测方法对CSTR控制系统中正常测试数据与标准正常数据的互信息对比图;Fig. 3a is the mutual information comparison diagram of normal test data and standard normal data in the CSTR control system using the multivariate industrial process fault detection method based on the primary and secondary PCA model of the present invention;
图3b为本发明实施例采用本发明基于主辅PCA模型的多变量工业过程故障检测方法对CSTR控制系统中故障1与标准正常数据的互信息对比图;Fig. 3b is the mutual information comparison diagram of
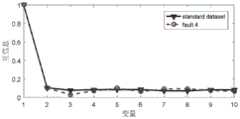
图3c为本发明实施例采用本发明基于主辅PCA模型的多变量工业过程故障检测方法对中故障4与标准正常数据的互信息对比图;Fig. 3c is the mutual information comparison diagram of the
图4a为本发明实施例采用本发明基于主辅PCA模型的多变量工业过程故障检测方法对CSTR控制系统利用故障1的先验故障信息变量分组结果示意图;Fig. 4a is a schematic diagram of the variable grouping result of using the prior fault information of
图4b为本发明实施例本发明基于主辅PCA模型的多变量工业过程故障检测方法对CSTR控制系统利用故障4的先验故障信息变量分组结果示意图;Fig. 4b is a schematic diagram of the variable grouping result of using the prior fault information of
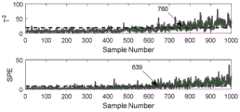
图5a为本发明实施例采用现有PCA方法对CSTR控制系统故障3的监控结果示意图;5a is a schematic diagram of the monitoring result of CSTR
图5b为本发明实施例采用本发明基于主辅PCA模型的多变量工业过程故障检测方法对CSTR控制系统故障3的监控结果示意图;5b is a schematic diagram of the monitoring result of CSTR
图6a为本发明实施例采用现有PCA方法对CSTR控制系统故障6的监控结果示意图;6a is a schematic diagram of the monitoring result of the CSTR
图6b为本发明实施例采用本发明基于主辅PCA模型的多变量工业过程故障检测方法对CSTR控制系统故障6的监控结果示意图。FIG. 6b is a schematic diagram of the monitoring result of the
具体实施方式Detailed ways
下面,通过示例性的实施方式对本发明进行具体描述。然而应当理解,在没有进一步叙述的情况下,一个实施方式中的元件、结构和特征也可以有益地结合到其他实施方式中。Hereinafter, the present invention will be specifically described through exemplary embodiments. It should be understood, however, that elements, structures and features of one embodiment may be beneficially combined in other embodiments without further recitation.
参见图1,本发明揭示了一种基于主辅PCA模型的多变量工业过程故障检测方法,含有以下步骤:Referring to FIG. 1, the present invention discloses a multivariable industrial process fault detection method based on the primary and secondary PCA model, which includes the following steps:
(一)收集历史数据库中的正常数据集X和C类已知故障数据集Fc,c=1,2,...,C作为训练数据集,利用正常数据集的均值μ和标准差σ通过公式(1)对训练数据集X和Fc进行标准化处理,公式(1)的表达式为:(1) Collect the normal data set X in the historical database and the C-type known fault data set Fc , c=1,2,...,C as the training data set, and use the mean value μ and standard deviation σ of the normal data set The training data set X and Fc are standardized by formula (1), and the expression of formula (1) is:

训练数据集X和Fc经上述公式(1)标准化处理后即可获得标准化后的训练数据集

(二)对数据集


式中,T为数据集

(三)计算故障数据集相对于正常数据集的相对互信息矩阵ΔRc,c=1,2,...,C;具体步骤为;(3) Calculate the relative mutual information matrix ΔRc , c=1, 2, . . . , C of the fault data set relative to the normal data set; the specific steps are:
通过公式(3)计算数据集


式中,m表示变量个数,Rij表示数据集

相对互信息矩阵ΔRc则表示为:The relative mutual information matrix ΔRc is expressed as:

由于不同的故障引起变量间的互信息是不同的,故以正常数据集的互信息矩阵R为基准,分别衡量故障数据集的互信息与该基准的差异性,以此可以获得不同的变量分组结果。在相对互信息中,每行代表某一变量与所有变量之间互信息变化的差异性,若两个变量的变化差异性相似,说明由于故障的发生造成变量间相关关系结构的变化是相似的,为此可以将两个变量划分为同一变量组。Since the mutual information between variables caused by different faults is different, the mutual information matrix R of the normal data set is used as the benchmark to measure the difference between the mutual information of the fault data set and the benchmark, so that different variable groups can be obtained. result. In the relative mutual information, each row represents the difference of the mutual information change between a variable and all variables. If the difference of the changes of the two variables is similar, it means that the change of the correlation structure between the variables is similar due to the occurrence of the fault. , the two variables can be divided into the same variable group.
(四)对相对互信息矩阵ΔRc,基于广义Dice系数对过程变量进行变量分组,获得分组后的数据集
进行变量分组的具体步骤为:The specific steps for variable grouping are:
(1)定义相对互信息向量为:(1) Define the relative mutual information vector as:
ri=[ΔRc,i1,ΔRc,i2,…,ΔRc,im]T (6)ri =[ΔRc,i1 ,ΔRc,i2 ,...,ΔRc,im ]T (6)
用广义Dice系数衡量某一变量与其余变量之间相对互信息相关度的相似性,定义为:The generalized Dice coefficient is used to measure the similarity of relative mutual information correlation between a variable and other variables, which is defined as:

式中,0≤Si,j≤1;Si,j值越接近于1两个向量相似度越强,则故障引起变量间相关关系结构的变化相似,两个变量间具有一定的内部关系,两个变量应划分为同一变量组;In the formula, 0≤Si,j ≤1; the closer the value of Si,j is to 1, the stronger the similarity of the two vectors, the change of the correlation structure between the variables caused by the fault is similar, and there is a certain internal relationship between the two variables , the two variables should be divided into the same variable group;
选择使||ri||最大的变量作为第一个变量组并初始化变量组的个数Bc=1;Select the variable that maximizes ||ri || as the first variable group and initialize the number of variable groups Bc =1;
(2)按照变量顺序选择下一个向量rj,其中j≠i且j≤m,并通过公式(8)计算向量rj与已知变量组中各向量相似性的均值,公式(8)表示为::(2) Select the next vector rj according to the variable order, where j≠i and j≤m, and calculate the mean value of the similarity between the vector rj and each vector in the known variable group by formula (8), formula (8) expresses for::

式中,b表示第b个变量组,nb表示第b个变量组内变量的个数;In the formula, b represents the b-th variable group, and nb represents the number of variables in the b-th variable group;
(3)确定
(4)重复步骤(2)和步骤(3)直至所有的变量分组完成,即
本发明考虑到运算的复杂程度,将变量组内个数小于等于2的变量合成一个变量组。通过上述变量分组方法可以有效利用已知先验故障信息,降低了对已知故障信息的浪费量,更能够进一步挖掘变量的局部信息,更加有利于提高故障的检测性能。该步骤中,利用不同的先验故障信息可以得到不同的变量分组结果。The present invention takes into account the complexity of the operation, and combines the variables whose number is less than or equal to 2 in the variable group into a variable group. The above variable grouping method can effectively utilize the known prior fault information, reduce the waste of the known fault information, and further mine the local information of the variables, which is more conducive to improving the fault detection performance. In this step, different variable grouping results can be obtained by using different prior fault information.
(五)对分组后的数据集建立PCA模型作为辅助监控模型;具体为:对变量分组后的数据集


式中,Tc,b为数据集

(六)采集测试数据集xnew,利用正常数据集X的均值μ和标准差σ通过公式(10)对测试数据集xnew进行标准化处理,进行标准化处理,公式(10)的表达式为:(6) Collect the test data set xnew , and use the mean μ and standard deviation σ of the normal data set X to standardize the test data set xnew by formula (10), and carry out standardization processing. The expression of formula (10) is:

测试数据集xnew经上述公式(10)标准化处理后即可获得标准化后的测试数据集
(七)将数据集


式中,Σ表示主监控模型特征值组成的对角阵;In the formula, Σ represents the diagonal matrix composed of the eigenvalues of the main monitoring model;
通过公式(13)和公式(14)计算数据集


式中,Σc,b表示辅监控模型特征值组成的对角阵,

通过核密度估计计算分别统计量T2的控制限


(八)采用贝叶斯推理整合所有监控结果得到总的监控统计量
定义样本

式中,S表示统计量T2、统计量SPE、统计量


式中,Slim表示统计量T2、统计量SPE、统计量


依据融合后的总监控统计量


上述方法中,步骤(一)至(五)为离线建模阶段,步骤(六)至(八)为在线测试阶段。In the above method, steps (1) to (5) are offline modeling stages, and steps (6) to (8) are online testing stages.
本发明上述故障检测方法,一方面利用正常过程数据建立PCA模型,作为主监控模型,另一方面根据正常过程数据与故障数据之间的相对互信息对变量分组,然后针对先验故障信息建立PCA模型,作为辅助监控模型,融合主监控模型和辅助监控模型的结果监视过程变化。能够利用先验故障信息并能够深入挖掘变量局部信息,减少有用故障信息的浪费和遗漏,提高故障检测率,进而改善故障检测结果。The above fault detection method of the present invention, on the one hand, uses the normal process data to establish a PCA model as the main monitoring model; The model, as an auxiliary monitoring model, fuses the results of the primary monitoring model and the auxiliary monitoring model to monitor process changes. A priori fault information can be used and the local variable information can be deeply excavated to reduce the waste and omission of useful fault information, improve the fault detection rate, and then improve the fault detection results.
为了能更清楚地说明本发明上述故障检测方法的有益效果,以下结合实施例对本发明上述故障检测方法做出进一步说明。In order to more clearly illustrate the beneficial effects of the above-mentioned fault detection method of the present invention, the above-mentioned fault detection method of the present invention will be further described below with reference to the embodiments.
实施例:连续搅拌反应釜(简称:CSTR)控制系统,作为一类化学反应器,具有成本低、热交换能力强和产品质量稳定等优势,在工业过程反应中得到广泛应用。在反应过程中,反应物A在反应器中发生一级不可逆的放热反应,同时生成物质B。该CSTR控制系统中测量了10个变量,其中包括4个状态变量和6个输入变量,变量详情见表1。Example: Continuous Stirring Reactor (abbreviation: CSTR) control system, as a type of chemical reactor, has the advantages of low cost, strong heat exchange capacity and stable product quality, and is widely used in industrial process reactions. During the reaction, reactant A undergoes a first-order irreversible exothermic reaction in the reactor, and substance B is simultaneously produced. 10 variables were measured in the CSTR control system, including 4 state variables and 6 input variables. The details of the variables are shown in Table 1.
表1Table 1
在上述CSTR控制系统仿真中,采集了1000个正常数据作为训练集,另生成表2中的6种故障数据,每种故障均包含1000个样本,每种故障均从第161个采样点加入故障。In the above-mentioned CSTR control system simulation, 1000 normal data were collected as the training set, and 6 kinds of fault data in Table 2 were generated. Each fault contains 1000 samples, and each fault is added from the 161st sampling point. .
表2Table 2
采用本发明上述故障检测方法(以下简称:PA-PCA方法)对本实施例所述CSTR控制系统进行故障检测。检测到发生故障后,为评价不同故障检测方法的故障检测性能,通过故障检出率FDR指标对不同方法的故障检测结果对比。故障检出率FDR定义为能够检测出的故障数据个数占总故障数据个数的百分比。很显然,FDR的数值越大,意味着工业过程故障检测方法的故障检测效果越好;反之,工业过程故障检测方法的故障检测效果越差。The above-mentioned fault detection method of the present invention (hereinafter referred to as the PA-PCA method) is used to perform fault detection on the CSTR control system described in this embodiment. After a fault is detected, in order to evaluate the fault detection performance of different fault detection methods, the fault detection results of different methods are compared through the fault detection rate FDR index. The fault detection rate FDR is defined as the percentage of the number of fault data that can be detected to the total number of fault data. Obviously, the larger the value of FDR, the better the fault detection effect of the industrial process fault detection method; on the contrary, the worse the fault detection effect of the industrial process fault detection method.
在本实施例的CSTR控制系统仿真中,采用PCA方法和本发明PA-PCA方法两种方法监控过程的变化。选取故障1(阶跃故障)和故障4(斜坡故障)两种不同类型的信息作为先验故障信息。两种方法中主元个数的选取均根据80%的方差贡献率,变量组划分的阈值γ设置为0.65,99%置信度被用来计算各方法的控制限。以故障3和故障6为例说明故障检测效果。In the simulation of the CSTR control system in this embodiment, the PCA method and the PA-PCA method of the present invention are used to monitor the process changes. Two different types of information, fault 1 (step fault) and fault 4 (slope fault), are selected as prior fault information. The selection of the number of pivots in the two methods is based on the 80% variance contribution rate, the threshold γ for variable group division is set to 0.65, and the 99% confidence level is used to calculate the control limits of each method. Take
图3a给出了正常测试数据与标准正常数据的互信息对比示意图,图3b给出了CSTR控制系统中的故障1与标准正常数据的互信息对比示意图,图3c给出了CSTR控制系统中的故障4与标准正常数据的互信息对比示意图。图3a-3c中均为变量1与其余变量之间的互信息。从图3a可以看出,两组不同正常数据集的互信息基本是重合的,说明在正常工况下,过程数据中变量间的相关关系结构基本没有发生变化。从图3b和图3c可以看出,两种不同故障的互信息和标准正常数据集之间的互信息存在较大差异,说明在异常工况下,过程数据中变量间的相关关系结构发生了变化,这也验证了本发明从先验故障信息考虑的必要性。Figure 3a shows a schematic diagram of the mutual information comparison between normal test data and standard normal data, Figure 3b shows a schematic diagram of the mutual information comparison between
故障3是由催化剂的活性以斜坡的形式发生变化而引起。图4a给出了利用故障1的先验信息变量分组结果示意图,图4b给出了利用故障4的先验信息变量分组结果示意图。从图4a、图4b中可以看出,利用不同的先验故障信息可以得到不同的变量分组结果。PCA方法和本发明PA-PCA方法的故障监控图如图5。根据图5a,PCA方法的T2和SPE统计量分别在第760和第639个采样时刻给出报警信号,两个统计量的故障检出率分别为32.02%和39.88%,故障检出率较低。而图5b中,PA-PCA方法的两个统计量能够比传统PCA方法分别提前285和106个时刻报警,且故障检出率分别为46.43%和58.81%,与传统PCA方法相比,监控性能得到了提高。
故障6是由冷却水温度传感器发生偏差而引起的。两种方法对该故障的监控图如图6a和图6b所示。由图6a可以看出,PCA方法的两个统计量虽然能够在第413和239个采样时刻检测出该故障,但是统计量均在控制线的上下波动,这使得大部分统计量位于控制线下方,故障检出率仅为26.07%和40.6%。相比之下,虽然本发明PA-PCA方法中SPE统计量的监控性能与传统PCA方法基本一致,检测时刻提前了1个,故障检出率为43.45%,但是本发明PA-PCA方法的T2统计量能够在第161个采样时刻及时给出报警信号,比PCA方法的T2统计量提前了252个时刻,且具有较高的故障检出率,故障检出率提到了77.5%,监控性能得到了提升,如图6b。因此,本发明所提的PA-PCA方法能够改善对CSTR控制系统故障6的故障检测性能。
表3给出了PCA方法和本发明PA-PCA方法对于CSTR控制系统6种故障的故障检出率。Table 3 shows the fault detection rate of the PCA method and the PA-PCA method of the present invention for 6 faults of the CSTR control system.
表3table 3

由表3可知,本发明PA-PCA方法对6种故障的监控效果最好,具有最高的平均故障检出率,尤其是对故障3和故障6的监控性能改善更为明显。综合以上分析,本发明PA-PCA方法的故障检测效果要优于传统PCA方法。It can be seen from Table 3 that the PA-PCA method of the present invention has the best monitoring effect on 6 kinds of faults, and has the highest average fault detection rate, especially the monitoring performance of
以上所举实施例仅用为方便举例说明本发明,并非对本发明保护范围的限制,在本发明所述技术方案范畴,所属技术领域的技术人员所作各种简单变形与修饰,均应包含在以上申请专利范围中。The above-mentioned embodiments are only used to illustrate the present invention for convenience, and are not intended to limit the scope of protection of the present invention. Within the scope of the technical solutions described in the present invention, various simple deformations and modifications made by those skilled in the art shall be included in the above descriptions. patent application.
Claims (8)


Priority Applications (1)
| Application Number | Priority Date | Filing Date | Title |
|---|---|---|---|
| CN201811503665.9ACN109407652B (en) | 2018-12-10 | 2018-12-10 | Multivariable industrial process fault detection method based on main and auxiliary PCA models |
Applications Claiming Priority (1)
| Application Number | Priority Date | Filing Date | Title |
|---|---|---|---|
| CN201811503665.9ACN109407652B (en) | 2018-12-10 | 2018-12-10 | Multivariable industrial process fault detection method based on main and auxiliary PCA models |
Publications (2)
| Publication Number | Publication Date |
|---|---|
| CN109407652A CN109407652A (en) | 2019-03-01 |
| CN109407652Btrue CN109407652B (en) | 2020-03-06 |
Family
ID=65458148
Family Applications (1)
| Application Number | Title | Priority Date | Filing Date |
|---|---|---|---|
| CN201811503665.9AActiveCN109407652B (en) | 2018-12-10 | 2018-12-10 | Multivariable industrial process fault detection method based on main and auxiliary PCA models |
Country Status (1)
| Country | Link |
|---|---|
| CN (1) | CN109407652B (en) |
Families Citing this family (13)
| Publication number | Priority date | Publication date | Assignee | Title |
|---|---|---|---|---|
| CN110501986B (en)* | 2019-09-03 | 2021-06-18 | 山东科技大学 | A Quality-Related Process Monitoring Method Based on Weighted Partial Mutual Information |
| CN110942258B (en)* | 2019-12-10 | 2022-02-25 | 山东科技大学 | Performance-driven industrial process anomaly monitoring method |
| CN111126870B (en)* | 2019-12-30 | 2023-10-27 | 华东理工大学 | Sewage treatment process abnormal condition detection method by utilizing integrated principal component analysis |
| CN111382029B (en)* | 2020-03-05 | 2021-09-03 | 清华大学 | Mainboard abnormity diagnosis method and device based on PCA and multidimensional monitoring data |
| CN111752147B (en)* | 2020-05-28 | 2022-04-22 | 山东科技大学 | A multi-condition process monitoring method with continuous learning ability to improve PCA |
| CN111914888B (en)* | 2020-06-13 | 2024-08-16 | 广州美宇装饰设计工程有限公司 | Multi-working condition identification and fault detection integrated chemical process monitoring method |
| CN112180893B (en)* | 2020-09-15 | 2021-07-13 | 郑州轻工业大学 | Construction method of fault-related distributed orthogonal neighborhood preserving embedding model in CSTR process and its fault monitoring method |
| CN112947649B (en)* | 2021-03-19 | 2021-11-23 | 安阳师范学院 | Multivariate process monitoring method based on mutual information matrix projection |
| CN114200914B (en)* | 2021-12-09 | 2025-01-21 | 华东理工大学 | A quality-related early fault detection method based on MW-OCCA |
| CN115291582A (en)* | 2022-02-22 | 2022-11-04 | 江南大学 | Method, device and equipment for monitoring faults in iron-making process |
| CN115423737B (en)* | 2022-04-22 | 2025-07-15 | 中国石油大学(华东) | Wafer image defect detection method based on multi-block principal component analysis network |
| CN119179890A (en)* | 2024-11-26 | 2024-12-24 | 中海油能源发展股份有限公司采油服务分公司 | Gathering pipeline circulation state monitoring method and system based on statistical pattern analysis |
| CN120180109A (en)* | 2025-05-21 | 2025-06-20 | 中国铁道科学研究院集团有限公司电子计算技术研究所 | A railway roadbed deformation risk identification method and device |
Citations (3)
| Publication number | Priority date | Publication date | Assignee | Title |
|---|---|---|---|---|
| WO2015171654A1 (en)* | 2014-05-06 | 2015-11-12 | Kla-Tencor Corporation | Automatic calibration sample selection for die-to-database photomask inspection |
| CN105955219A (en)* | 2016-05-30 | 2016-09-21 | 宁波大学 | Distributed dynamic process fault detection method based on mutual information |
| CN108762228A (en)* | 2018-05-25 | 2018-11-06 | 江南大学 | A kind of multi-state fault monitoring method based on distributed PCA |
- 2018
- 2018-12-10CNCN201811503665.9Apatent/CN109407652B/enactiveActive
Patent Citations (3)
| Publication number | Priority date | Publication date | Assignee | Title |
|---|---|---|---|---|
| WO2015171654A1 (en)* | 2014-05-06 | 2015-11-12 | Kla-Tencor Corporation | Automatic calibration sample selection for die-to-database photomask inspection |
| CN105955219A (en)* | 2016-05-30 | 2016-09-21 | 宁波大学 | Distributed dynamic process fault detection method based on mutual information |
| CN108762228A (en)* | 2018-05-25 | 2018-11-06 | 江南大学 | A kind of multi-state fault monitoring method based on distributed PCA |
Non-Patent Citations (2)
| Title |
|---|
| Distributed plant-wide process monitoring based on PCA with minimal redundancy maximal relevance;Chen Xu 等;《Chemometrics and Intelligent Laboratory Systems》;20171231;第53-63页* |
| 基于双层局部KPCA 的非线性过程微小故障检测方法;邓晓刚 等;《化工学报》;20180731;第3092-3100* |
Also Published As
| Publication number | Publication date |
|---|---|
| CN109407652A (en) | 2019-03-01 |
Similar Documents
| Publication | Publication Date | Title |
|---|---|---|
| CN109407652B (en) | Multivariable industrial process fault detection method based on main and auxiliary PCA models | |
| CN108062565B (en) | Double-principal element-dynamic core principal element analysis fault diagnosis method based on chemical engineering TE process | |
| CN105955219B (en) | Distributed dynamic procedure failure testing method based on mutual information | |
| CN108803520B (en) | A Dynamic Process Monitoring Method Based on Variable Nonlinear Autocorrelation Elimination | |
| CN106647718A (en) | Non-linear industrial process fault detection method based on Bayes kernel slow feature analysis | |
| CN104699077B (en) | A kind of failure variable partition method based on nested iterations Fei Sheer discriminant analyses | |
| CN110244692B (en) | Method for detecting minor faults in chemical process | |
| CN101169623A (en) | Nonlinear Process Fault Identification Method Based on Kernel Principal Component Analysis Contribution Graph | |
| CN104714537A (en) | Fault prediction method based on joint relative change analysis and autoregression model | |
| CN114611067B (en) | A method for detecting slowly changing faults in chemical processes based on typical variable heterogeneity analysis | |
| CN106092625A (en) | The industrial process fault detection method merged based on correction type independent component analysis and Bayesian probability | |
| CN101403923A (en) | Course monitoring method based on non-gauss component extraction and support vector description | |
| CN101308385A (en) | Nonlinear Process Fault Detection Method Based on 2D Dynamic Kernel Principal Component Analysis | |
| CN107092242A (en) | A kind of Industrial Process Monitoring method based on missing variable pca model | |
| CN108181893B (en) | PCA-KDR-based fault detection method | |
| CN108572639B (en) | Dynamic process monitoring method based on principal component autocorrelation elimination | |
| CN104536439B (en) | A kind of method for diagnosing faults based on nested iterations Fei Sheer discriminant analysiss | |
| Xiang et al. | Multimode process monitoring based on fuzzy C-means in locality preserving projection subspace | |
| CN112904810A (en) | Process industry nonlinear process monitoring method based on effective feature selection | |
| CN108830006B (en) | Linear-nonlinear industrial process fault detection method based on linear evaluation factor | |
| CN108153267A (en) | A kind of Industrial Process Monitoring method based on error Principal Component Analysis Model | |
| CN117556202A (en) | Industrial process micro fault detection method based on probability correlation slow feature analysis | |
| CN113253682A (en) | Nonlinear chemical process fault detection method | |
| Li et al. | Local component based principal component analysis model for multimode process monitoring | |
| CN109683594B (en) | A method for accurate identification and localization of abnormal variables |
Legal Events
| Date | Code | Title | Description |
|---|---|---|---|
| PB01 | Publication | ||
| PB01 | Publication | ||
| SE01 | Entry into force of request for substantive examination | ||
| SE01 | Entry into force of request for substantive examination | ||
| GR01 | Patent grant | ||
| GR01 | Patent grant |