CN108960276B - A Sample Expansion and Consistency Discrimination Method to Improve the Performance of Spectral Image Supervised Classification - Google Patents
A Sample Expansion and Consistency Discrimination Method to Improve the Performance of Spectral Image Supervised ClassificationDownload PDFInfo
- Publication number
- CN108960276B CN108960276BCN201810432942.5ACN201810432942ACN108960276BCN 108960276 BCN108960276 BCN 108960276BCN 201810432942 ACN201810432942 ACN 201810432942ACN 108960276 BCN108960276 BCN 108960276B
- Authority
- CN
- China
- Prior art keywords
- template
- sample
- neighborhood
- matching
- matrix
- Prior art date
- Legal status (The legal status is an assumption and is not a legal conclusion. Google has not performed a legal analysis and makes no representation as to the accuracy of the status listed.)
- Active
Links
Images


Classifications
- G—PHYSICS
- G06—COMPUTING OR CALCULATING; COUNTING
- G06F—ELECTRIC DIGITAL DATA PROCESSING
- G06F18/00—Pattern recognition
- G06F18/20—Analysing
- G06F18/24—Classification techniques
- G—PHYSICS
- G06—COMPUTING OR CALCULATING; COUNTING
- G06V—IMAGE OR VIDEO RECOGNITION OR UNDERSTANDING
- G06V10/00—Arrangements for image or video recognition or understanding
- G06V10/70—Arrangements for image or video recognition or understanding using pattern recognition or machine learning
- G06V10/74—Image or video pattern matching; Proximity measures in feature spaces
- G06V10/75—Organisation of the matching processes, e.g. simultaneous or sequential comparisons of image or video features; Coarse-fine approaches, e.g. multi-scale approaches; using context analysis; Selection of dictionaries
- G06V10/751—Comparing pixel values or logical combinations thereof, or feature values having positional relevance, e.g. template matching
Landscapes
- Engineering & Computer Science (AREA)
- Theoretical Computer Science (AREA)
- Computer Vision & Pattern Recognition (AREA)
- Evolutionary Computation (AREA)
- Data Mining & Analysis (AREA)
- Artificial Intelligence (AREA)
- General Physics & Mathematics (AREA)
- Physics & Mathematics (AREA)
- General Engineering & Computer Science (AREA)
- Evolutionary Biology (AREA)
- Bioinformatics & Computational Biology (AREA)
- Bioinformatics & Cheminformatics (AREA)
- Life Sciences & Earth Sciences (AREA)
- Health & Medical Sciences (AREA)
- Computing Systems (AREA)
- Databases & Information Systems (AREA)
- General Health & Medical Sciences (AREA)
- Medical Informatics (AREA)
- Software Systems (AREA)
- Multimedia (AREA)
- Image Analysis (AREA)
Abstract
Translated fromChinese
Description
Translated fromChinese技术领域technical field
本发明涉及高光谱图像监督分类算法中的预处理及后处理技术,具体涉及一种提升光谱图像监督分类性能的样本扩充与一致性判别方法。The invention relates to preprocessing and postprocessing technologies in a hyperspectral image supervised classification algorithm, in particular to a sample expansion and consistency discrimination method for improving the performance of spectral image supervised classification.
技术背景technical background
遥感高光谱图像是由几十甚至上百连续光谱波段组成的三维数据集,由于每个像元的通道数量远远超过普通RGB彩色图像的通道数量,所以在地物识别与分类应用中具有很强的分辨性能。因此,在诸如农业监测、污染监测、矿物识别等领域具有广泛的应用。而利用高光谱图像进行识别与分类是在图像获取后最重要的处理过程,其识别精度决定了高光谱图像对地物鉴别的最终效果。在高光谱图像分类研究中,机器学习相关方法受到了广泛关注。Remote sensing hyperspectral images are three-dimensional datasets composed of dozens or even hundreds of continuous spectral bands. Since the number of channels per pixel far exceeds the number of channels in ordinary RGB color images, it is very useful in ground object recognition and classification applications. Strong resolution performance. Therefore, it has a wide range of applications in fields such as agricultural monitoring, pollution monitoring, and mineral identification. The recognition and classification of hyperspectral images is the most important process after image acquisition, and its recognition accuracy determines the final effect of hyperspectral images on ground object identification. In the research of hyperspectral image classification, machine learning related methods have received extensive attention.
传统机器学习方法例如极限学习机、支持向量机、贝叶斯等方法在高光谱图像监督分类领域中都有一定的应用,但由于高光谱数据集样本间具有很强的相似性,以及同谱异物、同物异谱等现象的出现,导致分类器性能在一定程度上下降,使得最终分类精度不高。利用遥感图像的空间信息提升分类性能变得尤为重要。而常规的空-谱联合方法常将样本的空间信息与光谱信息进行融合并生成新的样本,例如增加样本属性维度的Gabor-SVM等方法会使得模型的输入维度增高,从而引入维度扩张带来的额外影响。目前,有许多针对在不改变数据维度的前提下利用预处理及后处理技术提升分类效果的方法,例如慕彩红等人在主动学习方法的基础上提出了利用测试样本邻域高相似像元判别结果来对目标样本的判别结果进行优化的方法(慕彩红,焦李成,王依萍,等.主动学习和邻域信息相结合的高光谱图像分类方法:,CN 104182767 A[P].2014.),取得了较好的效果。然而,上述方法的判定规则较为复杂,且像元相似度参数固定,无法根据数据自适应调整,因此方法应用范围受限。Traditional machine learning methods such as extreme learning machine, support vector machine, Bayesian and other methods have certain applications in the field of hyperspectral image supervised classification. The appearance of foreign objects and different spectra of the same object leads to a decline in the performance of the classifier to a certain extent, which makes the final classification accuracy not high. Using the spatial information of remote sensing images to improve the classification performance becomes particularly important. The conventional space-spectral joint method often fuses the spatial information of the sample with the spectral information to generate new samples. For example, methods such as Gabor-SVM that increase the dimension of sample attributes will increase the input dimension of the model, thereby introducing dimension expansion. additional impact. At present, there are many methods for using preprocessing and postprocessing techniques to improve the classification effect without changing the data dimension. A method for optimizing the discriminative results of target samples (Mu Caihong, Jiao Licheng, Wang Yiping, et al. Hyperspectral Image Classification Method Combining Active Learning and Neighborhood Information:, CN 104182767 A[P].2014 .), and achieved better results. However, the judgment rules of the above methods are relatively complex, and the pixel similarity parameters are fixed, which cannot be adaptively adjusted according to the data, so the application scope of the method is limited.
发明内容SUMMARY OF THE INVENTION
本发明的目的在于提供一种提升光谱图像监督分类性能的样本扩充与一致性判别方法,通过形状模板匹配有效扩充监督样本,利用模板库与分类预测矩阵一致性判别改善分类结果的局部聚集性,大幅提升监督分类器的精度,提升了小样本监督分类算法的鲁棒性,可适用于任何监督分类器。The purpose of the present invention is to provide a sample expansion and consistency discrimination method for improving the performance of spectral image supervision and classification, effectively expanding supervision samples through shape template matching, and improving the local aggregation of classification results by using template library and classification prediction matrix consistency judgment, It greatly improves the accuracy of the supervised classifier and improves the robustness of the small sample supervised classification algorithm, which can be applied to any supervised classifier.
实现本发明目的的技术解决方案为:一种提升光谱图像监督分类性能的样本扩充与一致性判别方法,包括以下步骤:The technical solution for realizing the purpose of the present invention is: a method for sample expansion and consistency discrimination for improving the performance of spectral image supervision and classification, comprising the following steps:
第一步,构造形状匹配模板库,即构造若干大小为d×d的形状匹配模板,作为模板库;The first step is to construct a shape matching template library, that is, construct several shape matching templates with a size of d×d as a template library;
第二步,计算单个训练样本的邻域相似度矩阵,即截取以该训练样本为中心的d×d邻域像元块,并计算其邻域像元与中心像元的相似度,将相似度顺序排列成矩阵形式作为该训练样本的邻域相似度矩阵;The second step is to calculate the neighborhood similarity matrix of a single training sample, that is, to intercept the d × d neighborhood pixel block centered on the training sample, and calculate the similarity between its neighborhood pixels and the center pixel. The degree order is arranged in a matrix form as the neighborhood similarity matrix of the training sample;
第三步,使用模板库对相似度矩阵进行匹配,并根据匹配度选取最佳匹配模板;The third step is to use the template library to match the similarity matrix, and select the best matching template according to the matching degree;
第四步,根据最佳匹配模板扩充训练样本,即将最佳匹配模板所覆盖的像元划归到与中心像元同类别训练集中;The fourth step is to expand the training sample according to the best matching template, that is, classify the pixels covered by the best matching template into the training set of the same category as the central pixel;
第五步,使用扩充后的训练集训练监督分类器;The fifth step is to train a supervised classifier using the expanded training set;
第六步,计算测试样本的邻域预测矩阵,即截取以该测试样本为中心的d×d邻域像元块并分别预测其中每个像元的类别,将预测类别顺序排列成矩阵形式作为该样本的邻域预测矩阵;The sixth step is to calculate the neighborhood prediction matrix of the test sample, that is, intercept the d × d neighborhood pixel block centered on the test sample and predict the category of each pixel respectively, and arrange the predicted categories in a matrix form as The neighborhood prediction matrix of the sample;
第七步,使用模板库对邻域预测矩阵进行匹配,并根据一致性度量计算最佳判别结果,即依次计算邻域预测矩阵与模板库中各模板匹配所对应各类别的一致性度量,选取最大值所对应类别作为该样本的最终判别结果。The seventh step is to use the template library to match the neighborhood prediction matrix, and calculate the best discrimination result according to the consistency metric, that is, calculate the consistency metrics of each category corresponding to the matching of each template in the neighborhood prediction matrix and the template library in turn, and select The category corresponding to the maximum value is used as the final discrimination result of the sample.
本发明与现有技术相比,其显著特点在于:(1)通过形状模板匹配可以有效扩充监督样本,从而有效提升小样本监督学习的性能;(2)通过对邻域预测结果的最佳一致性判别,可以大幅度提升最终分类结果的精度;(3)本发明方法适用于任意监督分类器,具有广泛的应用性;(4)本发明对数据本身特性不敏感,因此拥有较好的自适应性和扩展性,并且在同物异谱和同谱异物问题上进行了改善,大幅度提升了算法的最终分类精度。Compared with the prior art, the present invention has the following notable features: (1) supervised samples can be effectively expanded through shape template matching, thereby effectively improving the performance of supervised learning with small samples; (2) the best consistency of neighborhood prediction results is achieved sex discrimination, which can greatly improve the accuracy of the final classification result; (3) the method of the present invention is suitable for any supervised classifier, and has wide applicability; (4) the present invention is not sensitive to the characteristics of the data itself, so it has better self-confidence Adaptability and expansibility, and improved in the problem of the same spectrum and the same spectrum foreign matter, greatly improving the final classification accuracy of the algorithm.
附图说明Description of drawings
图1为本发明提升光谱图像监督分类性能的样本扩充与一致性判别方法流程图。FIG. 1 is a flowchart of a method for sample expansion and consistency discrimination for improving the performance of spectral image supervised classification according to the present invention.
图2为大小为3×3的匹配模板库示例图。FIG. 2 is an example diagram of a matching template library with a size of 3×3.
图3为大小为5×5的匹配模板库示例图。FIG. 3 is an example diagram of a matching template library with a size of 5×5.
图4(a)为Indian Pines数据集真实地物分布图。Figure 4(a) shows the distribution of real objects in the Indian Pines dataset.
图4(b)为Indian Pines数据集采用ELM方法的分类效果图。Figure 4(b) shows the classification effect of the Indian Pines dataset using the ELM method.
图4(c)为Indian Pines数据集采用ELM方法配合本发明方法(使用大小为3×3的匹配模板)的分类效果图。Figure 4(c) is a classification effect diagram of the Indian Pines data set using the ELM method and the method of the present invention (using a matching template with a size of 3×3).
图4(d)为Indian Pines数据集采用ELM方法配合本发明方法(使用大小为5×5的匹配模板)的分类效果图。Figure 4(d) is a classification effect diagram of the Indian Pines data set using the ELM method and the method of the present invention (using a matching template with a size of 5×5).
图4(e)为Indian Pines数据集采用SVM方法的分类效果图。Figure 4(e) shows the classification effect of the Indian Pines dataset using the SVM method.
图4(f)为Indian Pines数据集采用SVM方法配合本发明方法(使用大小为3×3的匹配模板)的分类效果图。FIG. 4( f ) is a classification effect diagram of the Indian Pines data set using the SVM method and the method of the present invention (using a matching template with a size of 3×3).
图4(g)为Indian Pines数据集采用SVM方法配合本发明方法(使用大小为5×5的匹配模板)的分类效果图。Figure 4(g) is a classification effect diagram of the Indian Pines data set using the SVM method and the method of the present invention (using a matching template with a size of 5×5).
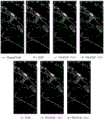
图5(a)为Pavia Center数据集真实地物分布图。Figure 5(a) shows the distribution of real objects in the Pavia Center dataset.
图5(b)为Pavia Center数据集采用ELM方法的分类效果图。Figure 5(b) shows the classification effect of the ELM method on the Pavia Center dataset.
图5(c)为Pavia Center数据集采用ELM方法配合本发明方法(使用大小为3×3的匹配模板)的分类效果图。Figure 5(c) is a classification effect diagram of the Pavia Center dataset using the ELM method and the method of the present invention (using a matching template with a size of 3×3).
图5(d)为Pavia Center数据集采用ELM方法配合本发明方法(使用大小为5×5的匹配模板)的分类效果图。Figure 5(d) is a classification effect diagram of the Pavia Center data set using the ELM method and the method of the present invention (using a matching template with a size of 5×5).
图5(e)为Pavia Center数据集采用SVM方法的分类效果图。Figure 5(e) shows the classification effect of the Pavia Center dataset using the SVM method.
图5(f)为Pavia Center数据集采用SVM方法配合本发明方法(使用大小为3×3的匹配模板)的分类效果图。Figure 5(f) is a classification effect diagram of the Pavia Center dataset using the SVM method and the method of the present invention (using a matching template with a size of 3×3).
图5(g)为Pavia Center数据集采用SVM方法配合本发明方法(使用大小为5×5的匹配模板)的分类效果图。Figure 5(g) is a classification effect diagram of the Pavia Center data set using the SVM method and the method of the present invention (using a matching template with a size of 5×5).
具体实施方式Detailed ways
结合图1,一种提升光谱图像监督分类性能的样本扩充与一致性判别方法,包括以下步骤:Combined with Figure 1, a method for sample expansion and consistency discrimination to improve the performance of spectral image supervised classification includes the following steps:
第一步,构造形状匹配模板库,即构造若干大小为d×d的形状匹配模板,作为模板库;The first step is to construct a shape matching template library, that is, construct several shape matching templates with a size of d×d as a template library;
第二步,计算单个训练样本的邻域相似度矩阵,即截取以该训练样本为中心的d×d邻域像元块,并计算其邻域像元与中心像元的相似度,将相似度顺序排列成矩阵形式作为该训练样本的邻域相似度矩阵;The second step is to calculate the neighborhood similarity matrix of a single training sample, that is, to intercept the d × d neighborhood pixel block centered on the training sample, and calculate the similarity between its neighborhood pixels and the center pixel. The degree order is arranged in a matrix form as the neighborhood similarity matrix of the training sample;
第三步,使用模板库对相似度矩阵进行匹配,并根据匹配度选取最佳匹配模板;The third step is to use the template library to match the similarity matrix, and select the best matching template according to the matching degree;
第四步,将最佳匹配模板所覆盖的像元划归到与中心像元同类别训练集中;The fourth step is to classify the pixels covered by the best matching template into the training set of the same category as the central pixel;
第五步,使用扩充后的训练集训练监督分类器;The fifth step is to train a supervised classifier using the expanded training set;
第六步,计算测试样本的邻域预测矩阵,即选取以该测试样本为中心的d×d邻域像元块并分别预测其中每个像元的类别,将预测类别顺序排列成矩阵形式作为该样本的邻域预测矩阵;The sixth step is to calculate the neighborhood prediction matrix of the test sample, that is, select the d × d neighborhood pixel block centered on the test sample and predict the category of each pixel respectively, and arrange the predicted categories in a matrix form as The neighborhood prediction matrix of the sample;
第七步,使用模板库对邻域预测矩阵进行匹配,并根据一致性度量计算最佳判别结果,即依次计算邻域预测矩阵与模板库中各模板匹配所对应各类别的一致性度量,选取最大值所对应类别作为该样本的最终判别结果。The seventh step is to use the template library to match the neighborhood prediction matrix, and calculate the best discrimination result according to the consistency metric, that is, calculate the consistency metrics of each category corresponding to the matching of each template in the neighborhood prediction matrix and the template library in turn, and select The category corresponding to the maximum value is used as the final discrimination result of the sample.
进一步的,第一步构造L个大小为d×d的形状匹配模板作为模板库,其中L≥8,d≥3且d为奇数;构造匹配模板的基本原则为:Further, the first step is to construct L shape matching templates with a size of d×d as a template library, where L≥8, d≥3 and d is an odd number; the basic principles for constructing matching templates are:
(1)在模板中以像素点为单位,将所有像素分为覆盖与未覆盖,覆盖取1,未覆盖取0;(1) In the template, take pixels as the unit, divide all pixels into covered and uncovered, take 1 for coverage, and take 0 for uncovered;
(2)在模板中所覆盖的像素区域须满足连通性,即模板中值为1的像素可组成满足4-邻接的连同区域,且连通区域须覆盖中心点;(2) The pixel area covered in the template must meet the connectivity, that is, the pixels with a value of 1 in the template can form a joint area that satisfies 4-adjacency, and the connected area must cover the center point;
(3)模板中的覆盖区域点个数n须满足n=(d-1)2。(3) The number n of coverage area points in the template must satisfy n=(d-1)2 .
进一步的,第二步计算单个训练样本的邻域相似度矩阵,具体过程为:Further, the second step calculates the neighborhood similarity matrix of a single training sample, and the specific process is as follows:
(1)对于第i个训练样本xi,在高光谱图像中截取以像元xi为中心的d×d邻域像元块,记为Di,表示如下:(1) For the i-th training sample xi , intercept the d×d neighborhood pixel block centered on the pixel xi in the hyperspectral image, denoted as Di , and expressed as follows:

1≤i≤N,N为训练样本数;1≤i≤N, N is the number of training samples;
(2)依次计算中心像元xi与邻域像元块Di中的像元


(3)将中心像元xi与邻域像元


进一步的,第三步使用模板库对相似度矩阵进行匹配,并根据匹配度选取最佳匹配模板,计算方法为:Further, the third step uses the template library to match the similarity matrix, and selects the best matching template according to the matching degree. The calculation method is:
(1)依次计算模板库中第l个模板与训练样本xi的邻域相似度矩阵Si的匹配度,记为

其中,运算符
(2)在样本xi与L个模板匹配得到的匹配度


进一步的,第四步根据最佳匹配模板扩充训练样本,即将训练样本xi对应的最佳匹配模板
进一步的,第五步使用扩充后的训练集训练监督分类器,即按照步骤二至步骤四依次对所有原始训练样本进行匹配扩充,并使用扩充后的训练样本训练监督分类器。Further, the fifth step uses the expanded training set to train the supervised classifier, that is, according to steps 2 to 4, all original training samples are sequentially matched and expanded, and the expanded training samples are used to train the supervised classifier.
进一步的,第六步计算测试样本的邻域预测矩阵,计算方法为:Further, the sixth step calculates the neighborhood prediction matrix of the test sample, and the calculation method is:
(1)对于第j个测试样本yj,在高光谱图像中截取以像元yj为中心的d×d邻域像元块,记为Kj,表示如下:(1) For the jth test sample yj , intercept a d×d neighborhood pixel block centered on the pixel yj in the hyperspectral image, denoted as Kj , and expressed as follows:

1≤j≤M,M为测试样本数量;1≤j≤M, M is the number of test samples;
(2)使用训练后的分类器依次对像元块Kj中的像元


进一步的,第七步使用模板库对邻域预测矩阵进行匹配,并根据一致性度量计算最佳判别结果,具体过程为:Further, the seventh step uses the template library to match the neighborhood prediction matrix, and calculates the best discrimination result according to the consistency measure. The specific process is as follows:
(1)依次计算测试样本yj与模板库中第l个模板Tl匹配下属于类别c的一致性度量,记为


其中,运算符


(2)在样本yj与各模板匹配下分别属于各类别的一致性度量中,选取一致性度量最大值所对应类别为最终判别结果,记为

其中,
下面结合实施例和附图对本发明进行详细说明。The present invention will be described in detail below with reference to the embodiments and accompanying drawings.
实施例Example
结合图1,一种提升光谱图像监督分类性能的样本扩充与一致性判别方法,步骤如下:Combined with Figure 1, a sample expansion and consistency discrimination method to improve the performance of spectral image supervised classification, the steps are as follows:
第一步,构造形状匹配模板库,即构造L个大小为d×d的形状匹配模板作为模板库,其中L≥8,d≥3且d为奇数。本实施例d=3,L=16,设计16个满足条件的不同匹配模板作为模板库,记为T1,T2,…,T16,模板库如图2所示。每个模板实为一个矩阵,图2中描述的第一个模板T1表示如下:The first step is to construct a shape matching template library, that is, construct L shape matching templates with a size of d×d as a template library, where L≥8, d≥3 and d is an odd number. In this embodiment, d=3, L=16, and 16 different matching templates that satisfy the conditions are designed as template libraries, which are denoted as T1 , T2 , . . . , T16 , and the template library is shown in FIG. 2 . Each template is actually a matrix, and the first template T1 depicted in Figure2 is represented as follows:

同理,其它模板也为矩阵表示形式。大小为5×5的匹配模板库形式如图3所示,模板设计方式按照前述规则进行设计。Similarly, other templates are also in matrix representation. The format of the matching template library with a size of 5×5 is shown in Figure 3, and the template design method is designed according to the aforementioned rules.
第二步,计算单个训练样本的邻域相似度矩阵,在d=3,L=16的条件下,具体过程为:The second step is to calculate the neighborhood similarity matrix of a single training sample. Under the conditions of d=3 and L=16, the specific process is:
(1)对于第i个训练样本xi,在高光谱图像中截取以像元xi为中心的3×3邻域像元块,记为Di,表示如下:(1) For the i-th training sample xi , intercept a 3×3 neighborhood pixel block centered on the pixel xi in the hyperspectral image, denoted as Di , and expressed as follows:

1≤i≤N,N为训练样本数;1≤i≤N, N is the number of training samples;
(2)依次计算中心像元xi与邻域像元块Di中的像元


(3)将中心像元xi与邻域像元


第三步,使用模板库对相似度矩阵进行匹配,并根据匹配度选取最佳匹配模板。在d=3,L=16的条件下,具体计算过程为:The third step is to use the template library to match the similarity matrix, and select the best matching template according to the matching degree. Under the conditions of d=3 and L=16, the specific calculation process is as follows:
(1)依次计算模板库中第l个模板与样本xi的邻域相似度矩阵Si的匹配度,记为

其中,运算符
(2)在样本xi对应的所有模板匹配度


假设
第四步,根据最佳匹配模板扩充训练样本,即将样本xi对应的最佳匹配模板

第五步,使用扩充后的训练集训练监督分类器,即按照步骤二至步骤四依次对所有训练样本进行匹配扩充,并使用扩充后的训练样本训练监督分类器,记分类器为q=classify(y),其中y为测试样本,q为测试样本y通过分类器得到的类别。The fifth step is to use the expanded training set to train the supervised classifier, that is, according to steps 2 to 4, all training samples are sequentially matched and expanded, and the expanded training samples are used to train the supervised classifier, and the classifier is recorded as q=classify (y), where y is the test sample, and q is the category obtained by the classifier for the test sample y.
第六步,计算测试样本的邻域预测矩阵,在d=3,L=16的假设条件下,具体过程为:The sixth step is to calculate the neighborhood prediction matrix of the test sample. Under the assumptions of d=3 and L=16, the specific process is:
(1)对于第j个测试样本yj,在高光谱图像中截取以像元yj为中心的3×3邻域像元块,记为Kj,表示如下:(1) For the jth test sample yj , intercept a 3×3 neighborhood pixel block centered on the pixel yj in the hyperspectral image, denoted as Kj , and expressed as follows:

1≤j≤M,M为测试样本数;1≤j≤M, M is the number of test samples;
(2)使用训练后的分类器依次对像元块Kj中的像元


第七步,使用模板库对邻域预测矩阵进行匹配,并根据一致性度量计算最佳判别结果,在d=3,L=16,样本类别数C=9的条件下,具体过程为:The seventh step is to use the template library to match the neighborhood prediction matrix, and calculate the best discrimination result according to the consistency measure. Under the conditions of d=3, L=16, and the number of sample categories C=9, the specific process is:
(1)依次计算测试样本yj与模板库中第l个模板Tl匹配下属于类别c的一致性度量,记为


其中,运算符°表示哈达玛积,

(2)在样本yj对应的各模板匹配下分别属于各类别的一致性度量中,选取一致性度量最大值所对应类别为最终判别结果,记为

其中

下面通过仿真实验说明本发明的效果:The effects of the present invention are described below through simulation experiments:
仿真实验采用两组真实高光谱数据:Indian Pines数据集和Pavia Center数据集。Indian Pines数据集为机载可见红外成像光谱仪(AVIRIS)在美国印第安纳州IndianPines实验区采集的高光谱遥感图像。该图像共包含220个波段,空间分辨率为20m,图像大小为145×145。去除20个水汽吸收和低信噪比波段后(波段号为104-108,150-163,220),选择剩下的200个波段作为研究对象。该地区共包含16种已知地物共10366个样本。PaviaCenter数据集是由帕维亚的ROSIS传感器采集,共包含115个波段,图像大小为1096×490,在去除噪声波段之后,选择剩下的102个波段作为研究对象。每类样本均随机取10%作为训练样本,其余90%作为测试样本,并分别进行十次实验计算平均结果,并给出OA(OverallAccuracy)以及AA(Average Accuracy)评价指标。在实验前,两组数据集均采用MH预测方法进行平滑处理。仿真实验均在Windows 10操作系统下采用Python3.6与MATLAB R2016a完成。The simulation experiments use two sets of real hyperspectral data: the Indian Pines dataset and the Pavia Center dataset. The Indian Pines dataset is hyperspectral remote sensing images collected by the Airborne Visible Infrared Imaging Spectrometer (AVIRIS) in the Indiana Pines experimental area, Indiana, USA. The image contains a total of 220 bands, the spatial resolution is 20m, and the image size is 145×145. After removing 20 water vapor absorption and low signal-to-noise ratio bands (band numbers are 104-108, 150-163, 220), the remaining 200 bands were selected as research objects. The area contains a total of 10,366 samples of 16 known features. The PaviaCenter dataset was collected by the ROSIS sensor in Pavia, with a total of 115 bands and an image size of 1096×490. After removing the noise band, the remaining 102 bands were selected as the research object. 10% of each type of samples are randomly selected as training samples, and the remaining 90% are used as test samples. Ten experiments are performed to calculate the average results, and OA (Overall Accuracy) and AA (Average Accuracy) evaluation indicators are given. Before the experiment, both datasets were smoothed using the MH prediction method. The simulation experiments were completed under the
本发明采用的评价指标是常规精度的评价方法,包括平均精度(AA)和总体精度(OA)。由于本发明的用途是提升任意分类器的分类精度,在仿真实验中我们分别采用ELM和SVM作为基础分类器进行实验,为了显示该方法对分类器性能的提升,每组数据集均会使用ELM、TM-ELM(3x3)、TM-ELM(5x5)、SVM、TM-SVM(3x3)、TM-SVM(5x5)进行实验,并进行结果对比。其中TM-ELM(3x3)表示使用3x3大小的模板匹配(template matching)结合ELM的分类方法,TM-ELM(5x5)表示使用5x5大小的模板匹配结合ELM的分类方法,同理,TM-SVM(3x3)、TM-SVM(5x5)表示含义类似。大小为3x3的模板库样式如图2所示,大小为5x5的模板库样式如图3所示。The evaluation index adopted in the present invention is the evaluation method of conventional precision, including average precision (AA) and overall precision (OA). Since the purpose of the present invention is to improve the classification accuracy of any classifier, we use ELM and SVM as the basic classifiers in the simulation experiments respectively. , TM-ELM (3x3), TM-ELM (5x5), SVM, TM-SVM (3x3), TM-SVM (5x5) to conduct experiments and compare the results. Among them, TM-ELM (3x3) represents the classification method using 3x3 template matching (template matching) combined with ELM, TM-ELM (5x5) represents the classification method using 5x5 template matching combined with ELM, for the same reason, TM-SVM ( 3x3) and TM-SVM (5x5) have similar meanings. The template library style of size 3x3 is shown in Figure 2, and the template library style of size 5x5 is shown in Figure 3.
表1为本发明方法对Indian Pines与Pavia Center数据集进行仿真实验的分类精度(%)。Table 1 shows the classification accuracy (%) of the simulation experiments performed on the Indian Pines and Pavia Center datasets by the method of the present invention.
表1Table 1

从实验结果可以发现,在不改变原始ELM和SVM分类模型的前提下,仅通过使用本发明方法对数据进行训练样本扩充与预测结果最佳一致性判别,便可以大幅度提升分类精度。在Indian Pines数据集上,本发明方法可以将原始ELM模型96.27%的总体精度提升至98.85%(使用5x5大小模板匹配方法),将原始SVM模型90.33%的总体精度提升至98.99%(使用5x5大小模板匹配方法)。在PaviaCenter数据集上,本发明方法可以将原始ELM模型97.46%的分类精度提升至98.08%(使用5x5大小模板匹配方法),将原始SVM模型98.87%的总体精度提升至99.79%(使用5x5大小模板匹配方法)。显然,本发明方法在使用3x3模板和5x5模板进行匹配后对分类结果均有明显提升,并且随着模板大小的扩大,分类精度也会随之提升,充分表明了本发明方法具有较高的稳定性和扩展性。本发明方法在两组数据集上的结果效果图如图4、图5所示。以上两组真实数据集的仿真实验结果表明了本发明方法的有效性。It can be found from the experimental results that, without changing the original ELM and SVM classification models, the classification accuracy can be greatly improved only by using the method of the present invention to expand the data for training samples and determine the best consistency of the prediction results. On the Indian Pines dataset, the method of the present invention can improve the overall accuracy of the original ELM model from 96.27% to 98.85% (using the 5x5 size template matching method), and improve the overall accuracy of the original SVM model from 90.33% to 98.99% (using the 5x5 size). template matching method). On the PaviaCenter dataset, the method of the present invention can improve the classification accuracy of the original ELM model from 97.46% to 98.08% (using a 5x5 template matching method), and improve the overall accuracy of the original SVM model from 98.87% to 99.79% (using a 5x5 template). matching method). Obviously, the method of the present invention can significantly improve the classification results after using the 3x3 template and the 5x5 template for matching, and with the expansion of the template size, the classification accuracy will also be improved, which fully shows that the method of the present invention has high stability. flexibility and scalability. Figures 4 and 5 show the results of the method of the present invention on two sets of data sets. The simulation results of the above two sets of real data sets show the effectiveness of the method of the present invention.
Claims (7)


Priority Applications (1)
| Application Number | Priority Date | Filing Date | Title |
|---|---|---|---|
| CN201810432942.5ACN108960276B (en) | 2018-05-08 | 2018-05-08 | A Sample Expansion and Consistency Discrimination Method to Improve the Performance of Spectral Image Supervised Classification |
Applications Claiming Priority (1)
| Application Number | Priority Date | Filing Date | Title |
|---|---|---|---|
| CN201810432942.5ACN108960276B (en) | 2018-05-08 | 2018-05-08 | A Sample Expansion and Consistency Discrimination Method to Improve the Performance of Spectral Image Supervised Classification |
Publications (2)
| Publication Number | Publication Date |
|---|---|
| CN108960276A CN108960276A (en) | 2018-12-07 |
| CN108960276Btrue CN108960276B (en) | 2022-02-15 |
Family
ID=64499024
Family Applications (1)
| Application Number | Title | Priority Date | Filing Date |
|---|---|---|---|
| CN201810432942.5AActiveCN108960276B (en) | 2018-05-08 | 2018-05-08 | A Sample Expansion and Consistency Discrimination Method to Improve the Performance of Spectral Image Supervised Classification |
Country Status (1)
| Country | Link |
|---|---|
| CN (1) | CN108960276B (en) |
Families Citing this family (5)
| Publication number | Priority date | Publication date | Assignee | Title |
|---|---|---|---|---|
| CN110008335A (en)* | 2018-12-12 | 2019-07-12 | 阿里巴巴集团控股有限公司 | The method and device of natural language processing |
| CN111241969A (en)* | 2020-01-06 | 2020-06-05 | 北京三快在线科技有限公司 | Target detection method and device and corresponding model training method and device |
| CN112906666A (en)* | 2021-04-07 | 2021-06-04 | 中国农业大学 | Remote sensing identification method for agricultural planting structure |
| CN113252585B (en)* | 2021-04-21 | 2024-02-09 | 深圳市海谱纳米光学科技有限公司 | A method and device for judging gold surface coating based on hyperspectral images |
| CN116051869A (en)* | 2022-12-26 | 2023-05-02 | 磅客策(上海)智能医疗科技有限公司 | Image label matching method and system combining OVR-SVM and PSNR similarity |
Family Cites Families (5)
| Publication number | Priority date | Publication date | Assignee | Title |
|---|---|---|---|---|
| CN103903007B (en)* | 2014-03-10 | 2017-02-22 | 哈尔滨工程大学 | Hyperspectral semi-supervised classification method based on space-spectral information |
| CN104318241A (en)* | 2014-09-25 | 2015-01-28 | 东莞电子科技大学电子信息工程研究院 | Local density spectral clustering similarity measurement algorithm based on Self-tuning |
| US10078780B2 (en)* | 2015-03-27 | 2018-09-18 | Intel Corporation | Gesture recognition mechanism |
| CN107067413B (en)* | 2016-12-27 | 2019-11-15 | 南京理工大学 | A Moving Target Detection Method Based on Statistical Matching of Local Features in Spatio-temporal Domain |
| CN107491734B (en)* | 2017-07-19 | 2021-05-07 | 苏州闻捷传感技术有限公司 | Semi-supervised polarimetric SAR image classification method based on multi-core fusion and space Wishart LapSVM |
- 2018
- 2018-05-08CNCN201810432942.5Apatent/CN108960276B/enactiveActive
Also Published As
| Publication number | Publication date |
|---|---|
| CN108960276A (en) | 2018-12-07 |
Similar Documents
| Publication | Publication Date | Title |
|---|---|---|
| CN108960276B (en) | A Sample Expansion and Consistency Discrimination Method to Improve the Performance of Spectral Image Supervised Classification | |
| CN110321963B (en) | Hyperspectral image classification method based on fusion of multi-scale and multi-dimensional spatial spectral features | |
| CN110399909B (en) | A Hyperspectral Image Classification Method Based on Label-constrained Elastic Net Graph Model | |
| CN107992891B (en) | Multispectral remote sensing image change detection method based on spectral vector analysis | |
| CN109492593B (en) | Hyperspectral image classification method based on principal component analysis network and space coordinates | |
| CN107451614B (en) | Hyperspectral Classification Method Based on Fusion of Spatial Coordinates and Spatial Spectral Features | |
| CN108491849A (en) | Hyperspectral image classification method based on three-dimensional dense connection convolutional neural networks | |
| CN109766858A (en) | Three-dimensional convolution neural network hyperspectral image classification method combined with bilateral filtering | |
| CN112101271A (en) | Hyperspectral remote sensing image classification method and device | |
| CN108009559A (en) | A kind of Hyperspectral data classification method based on empty spectrum united information | |
| CN112990314B (en) | Hyperspectral image anomaly detection method and device based on improved isolated forest algorithm | |
| CN110516754B (en) | Hyperspectral image classification method based on multi-scale superpixel segmentation | |
| CN108830243A (en) | Hyperspectral image classification method based on capsule network | |
| CN107798348A (en) | Hyperspectral image classification method based on neighborhood information deep learning | |
| CN109583469B (en) | A K-means hyperspectral image band clustering method based on mutual information | |
| CN113673556B (en) | A hyperspectral image classification method based on multi-scale dense convolutional network | |
| CN108038501B (en) | Hyperspectral image classification method based on multi-mode compression bilinear pooling | |
| CN110363236B (en) | Hyperspectral Image Extreme Learning Machine Clustering Method Based on Space Spectrum Joint Hypergraph Embedding | |
| CN111222545B (en) | Image classification method based on linear programming incremental learning | |
| CN105184314B (en) | Wrapper formula EO-1 hyperion band selection methods based on pixel cluster | |
| CN103366373B (en) | Multi-time-phase remote-sensing image change detection method based on fuzzy compatible chart | |
| CN107808138A (en) | A kind of communication signal recognition method based on FasterR CNN | |
| Guo et al. | Dual graph U-Nets for hyperspectral image classification | |
| CN104299232A (en) | SAR image segmentation method based on self-adaptive window directionlet domain and improved FCM | |
| CN103390170A (en) | Surface feature type texture classification method based on multispectral remote sensing image texture elements |
Legal Events
| Date | Code | Title | Description |
|---|---|---|---|
| PB01 | Publication | ||
| PB01 | Publication | ||
| SE01 | Entry into force of request for substantive examination | ||
| SE01 | Entry into force of request for substantive examination | ||
| GR01 | Patent grant | ||
| GR01 | Patent grant |