CN108682140B - An Enhanced Anomaly Detection Method Based on Compressed Sensing and Autoregressive Models - Google Patents
An Enhanced Anomaly Detection Method Based on Compressed Sensing and Autoregressive ModelsDownload PDFInfo
- Publication number
- CN108682140B CN108682140BCN201810367791.XACN201810367791ACN108682140BCN 108682140 BCN108682140 BCN 108682140BCN 201810367791 ACN201810367791 ACN 201810367791ACN 108682140 BCN108682140 BCN 108682140B
- Authority
- CN
- China
- Prior art keywords
- monitoring data
- node
- cluster
- data
- abnormal
- Prior art date
- Legal status (The legal status is an assumption and is not a legal conclusion. Google has not performed a legal analysis and makes no representation as to the accuracy of the status listed.)
- Expired - Fee Related
Links
- 238000001514detection methodMethods0.000titleclaimsabstractdescription32
- 238000012544monitoring processMethods0.000claimsabstractdescription108
- 230000002159abnormal effectEffects0.000claimsabstractdescription46
- 241000854291Dianthus carthusianorumSpecies0.000claimsabstractdescription45
- 238000005259measurementMethods0.000claimsabstractdescription6
- 239000013598vectorSubstances0.000claimsdescription19
- 238000000034methodMethods0.000claimsdescription11
- 239000011159matrix materialSubstances0.000claimsdescription9
- 230000005540biological transmissionEffects0.000claimsdescription7
- 238000012545processingMethods0.000claimsdescription2
- 238000005070samplingMethods0.000description3
- 238000004220aggregationMethods0.000description2
- 230000002776aggregationEffects0.000description2
- 238000010586diagramMethods0.000description2
- 230000005856abnormalityEffects0.000description1
- 238000004364calculation methodMethods0.000description1
- 238000013480data collectionMethods0.000description1
- 238000013500data storageMethods0.000description1
- 230000007613environmental effectEffects0.000description1
- 239000000126substanceSubstances0.000description1
Images


Classifications
- G—PHYSICS
- G08—SIGNALLING
- G08C—TRANSMISSION SYSTEMS FOR MEASURED VALUES, CONTROL OR SIMILAR SIGNALS
- G08C25/00—Arrangements for preventing or correcting errors; Monitoring arrangements
- G—PHYSICS
- G08—SIGNALLING
- G08C—TRANSMISSION SYSTEMS FOR MEASURED VALUES, CONTROL OR SIMILAR SIGNALS
- G08C17/00—Arrangements for transmitting signals characterised by the use of a wireless electrical link
- G08C17/02—Arrangements for transmitting signals characterised by the use of a wireless electrical link using a radio link
- H—ELECTRICITY
- H04—ELECTRIC COMMUNICATION TECHNIQUE
- H04W—WIRELESS COMMUNICATION NETWORKS
- H04W4/00—Services specially adapted for wireless communication networks; Facilities therefor
- H04W4/30—Services specially adapted for particular environments, situations or purposes
- H04W4/38—Services specially adapted for particular environments, situations or purposes for collecting sensor information
- H—ELECTRICITY
- H04—ELECTRIC COMMUNICATION TECHNIQUE
- H04W—WIRELESS COMMUNICATION NETWORKS
- H04W84/00—Network topologies
- H04W84/18—Self-organising networks, e.g. ad-hoc networks or sensor networks
Landscapes
- Engineering & Computer Science (AREA)
- Computer Networks & Wireless Communication (AREA)
- Physics & Mathematics (AREA)
- General Physics & Mathematics (AREA)
- Signal Processing (AREA)
- Testing Or Calibration Of Command Recording Devices (AREA)
- Testing And Monitoring For Control Systems (AREA)
Abstract
Description
Translated fromChinese技术领域technical field
本发明主要涉及到无线传感器网络中的异常事件检测领域。The invention mainly relates to the field of abnormal event detection in wireless sensor networks.
背景技术Background technique
异常事件检测是无线传感器网络的一种重要应用。当异常事件(如化学物质泄漏、火灾等)发生后,传感器节点应能够尽快检测出事件可能发生的区域,并及时地向汇聚节点报告。Anomaly detection is an important application of wireless sensor networks. When an abnormal event (such as chemical leakage, fire, etc.) occurs, the sensor node should be able to detect the area where the event may occur as soon as possible, and report it to the sink node in time.
压缩感知为分布式感知网络的数据收集开辟了新的思路。首先对稀疏数据进行采样,然后对采样得到的数据进行压缩测量,得到测量值,最后由测量值对原始数据进行重构。该理论降低了信号的采样频率,还减少了数据存储空间和网络传输量。由于异常事件是小概率发生事件,因此压缩感知为无线传感器网络中异常事件的检测提供了思路。然而,单纯地通过压缩感知中的重构算法对节点数据进行重构,并直接通过重构结果来检测节点发送的数据是否异常,存在检测结果不精确、虚警率上升的缺点。此外,无线传感器网络在事件监测中所面临的主要问题是检测精度受环境噪声和设备不稳定性的影响,如果只根据一个单独节点某个时间点的感知数据对事件进行判断,则很容易造成无线传感器网络中误判事件的发生,而利用时间序列的方法来对各个节点每个时刻的监测数据进行检测,需要计算的量会很大。Compressed sensing opens up new ideas for data collection in distributed sensing networks. First, the sparse data is sampled, then the sampled data is compressed and measured to obtain the measured value, and finally the original data is reconstructed from the measured value. This theory reduces the sampling frequency of the signal, and also reduces the data storage space and the amount of network transmission. Since abnormal events are events with a small probability, compressed sensing provides an idea for the detection of abnormal events in wireless sensor networks. However, simply reconstructing the node data through the reconstruction algorithm in compressed sensing and directly detecting whether the data sent by the node is abnormal through the reconstruction result has the disadvantages of inaccurate detection results and increased false alarm rate. In addition, the main problem faced by wireless sensor networks in event monitoring is that the detection accuracy is affected by environmental noise and equipment instability. If the event is judged only based on the sensing data of a single node at a certain point in time, it is easy to cause The occurrence of misjudgment events in wireless sensor networks, and the use of time series methods to detect the monitoring data of each node at each moment, requires a large amount of calculation.
综上所述,在利用压缩感知对无线传感器网络节点中的异常事件进行初步检测的基础上,如何结合节点自回归模型来提高检测精度,以及如何利用簇内节点的空间相关性来对测量误差和异常事件进行识别、定位等,目前尚没有科学的解决方案。To sum up, based on the preliminary detection of abnormal events in wireless sensor network nodes using compressed sensing, how to combine the node autoregressive model to improve the detection accuracy, and how to use the spatial correlation of nodes in the cluster to detect measurement errors. There is no scientific solution for identifying and locating abnormal events.
发明内容SUMMARY OF THE INVENTION
针对上述问题,提出了在无线传感器网络中的一种基于压缩感知和自回归模型的增强型异常检测方法,具体步骤如下:Aiming at the above problems, an enhanced anomaly detection method based on compressed sensing and autoregressive models in wireless sensor networks is proposed. The specific steps are as follows:
步骤一、网络场景的布置以及网络的初始化处理:Step 1. The layout of the network scene and the initialization of the network:
1、在监测区域随机分布数量为N的传感器节点;所有传感器节点具有相同的初始能量以及传输速率;所有传感器节点可以通过GPS等定位方法获取自身地理位置信息;1. Randomly distribute N sensor nodes in the monitoring area; all sensor nodes have the same initial energy and transmission rate; all sensor nodes can obtain their own geographic location information through GPS and other positioning methods;
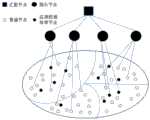
2、根据异常事件的分布,将整个无线传感器网络的监测区域划分为C个簇,并选取簇头和汇聚节点,组成分簇网络,第j个簇头监测的传感器节点数目为Nj,j=1,2,...,C。2. According to the distribution of abnormal events, divide the monitoring area of the entire wireless sensor network into C clusters, and select cluster heads and sink nodes to form a clustered network. The number of sensor nodes monitored by the jth cluster head is Nj , j =1,2,...,C.
步骤二、基于历史正常数据,簇头为其监测区域中的每个传感器节点建立一个自回归模型:Step 2. Based on historical normal data, the cluster head establishes an autoregressive model for each sensor node in its monitoring area:
1、在一定时间范围内,每个传感器节点的监测数据是平稳的,即第i个节点t时刻的监测数据

2、每个传感器节点的监测数据满足大数定律,即对于任意的T个时刻,每个传感器节点的监测数据值收敛于所有监测数据的期望值,期望值为:
3、以各节点监测到的正常的历史数据为先验信息,为第i个节点构造一个pi阶的自回归模型:3. Taking the normal historical data monitored by each node as the prior information, construct an autoregressive model of order pi for theith node:

其中,


步骤三、在t时刻,节点感知监测数据并对其进行二值化,根据预先设定的阈值θ,若


步骤四、簇头对t时刻簇内的节点数据向量进行压缩采样,然后将采样所得数据路由至汇聚节点,汇聚节点对每个簇内的节点数据向量进行重构,得到初步检测结果,最后簇头对异常的监测数据进行收集:Step 4: The cluster head compresses and samples the node data vector in the cluster at time t, and then routes the sampled data to the sink node, and the sink node reconstructs the node data vector in each cluster to obtain the preliminary detection result. The head collects abnormal monitoring data:
1、根据第j个簇头产生随机观测矩阵


2、汇聚节点根据收到的感知数据序列,利用OMP算法对每个簇内的节点数据向量进行重构;2. The sink node uses the OMP algorithm to reconstruct the node data vector in each cluster according to the received sensing data sequence;
3、各个簇内重构得到的监测数据为非零的传感器节点将其原始监测数据发送给簇头,其中序号为i的传感器节点发送的原始监测数据为
步骤五、每个簇头根据簇内监测数据的时空相关性对t时刻各个簇内重构得到的监测数据为非零的传感器节点(以下简称为目标传感器节点)的监测结果进行识别:Step 5: Each cluster head identifies the monitoring results of the sensor nodes (hereinafter referred to as target sensor nodes) whose monitoring data reconstructed in each cluster at time t is non-zero according to the spatiotemporal correlation of the monitoring data in the cluster:
1、根据之前为每个传感器节点建立的自回归模型:1. According to the autoregressive model previously established for each sensor node:

由其t时刻的监测数据和其此前pi个时刻的历史数据,根据模型可计算出其t时刻的残差值
2、判断

3、t时刻各个簇头接收到序号为i的目标传感器节点发送的异常监测数据

4、簇头将簇内所有节点发送的监测数据进行排序,得到中值Me(若有偶数个监测数据,则取中间两数的均值);各节点的监测数据与中值Me差值的集合为


5、当
综上所述,本发明的优点如下:To sum up, the advantages of the present invention are as follows:
1、在利用压缩感知理论对异常数据进行初步检测的基础上,通过建立自回归模型,充分利用传感器节点监测数据的时间相关性来对异常数据进行更精确的检测,降低了网络中的虚警率,使检测结果更可靠。1. Based on the preliminary detection of abnormal data by using compressed sensing theory, by establishing an autoregressive model, making full use of the time correlation of sensor node monitoring data to detect abnormal data more accurately, reducing false alarms in the network rate, making the detection results more reliable.
2、充分利用各个簇内传感器节点监测数据之间的空间相关性,将某传感器节点监测的异常数据与其所在簇内其他传感器节点监测到的数据进行对比,从而能识别异常数据是由于传感器节点所监测的区域发生了异常事件造成的还是由于测量误差造成的。2. Make full use of the spatial correlation between the monitoring data of sensor nodes in each cluster, and compare the abnormal data monitored by a sensor node with the data monitored by other sensor nodes in the cluster, so as to identify the abnormal data due to the sensor node. Whether an abnormal event occurs in the monitored area is also caused by measurement error.
附图说明Description of drawings
图1为本发明的流程图;Fig. 1 is the flow chart of the present invention;
图2为进一步对异常监测数据进行检测以及对异常监测数据进行识别的过程图;Fig. 2 is a process diagram of further detecting abnormal monitoring data and identifying abnormal monitoring data;
图3是本发明网络模型分簇示意图。FIG. 3 is a schematic diagram of the network model clustering of the present invention.
具体实施方法Specific implementation method
本发明设计了在无线传感器网络中的一种基于压缩感知和自回归模型的增强型异常检测方法,结合图1,异常事件检测的具体实施方法如下:The present invention designs an enhanced abnormality detection method based on compressive sensing and autoregressive models in wireless sensor networks. With reference to Figure 1, the specific implementation method of abnormal event detection is as follows:
步骤一、如图2所示,网络场景的布置以及网络的初始化处理:Step 1. As shown in Figure 2, the layout of the network scene and the initialization processing of the network:
1、在监测区域随机分布数量为N的传感器节点;所有传感器节点具有相同的初始能量以及传输速率;所有传感器节点可以通过GPS等定位方法获取自身地理位置信息;1. Randomly distribute N sensor nodes in the monitoring area; all sensor nodes have the same initial energy and transmission rate; all sensor nodes can obtain their own geographic location information through GPS and other positioning methods;
2、根据异常事件的分布,将整个无线传感器网络的监测区域划分为C个簇,并选取簇头和汇聚节点,组成分簇网络,第j个簇头监测的传感器节点数目为Nj,j=1,2,...,C。2. According to the distribution of abnormal events, divide the monitoring area of the entire wireless sensor network into C clusters, and select cluster heads and sink nodes to form a clustered network. The number of sensor nodes monitored by the jth cluster head is Nj , j =1,2,...,C.
步骤二、基于历史正常数据,簇头为其监测区域中的每个传感器节点建立一个自回归模型:Step 2. Based on historical normal data, the cluster head establishes an autoregressive model for each sensor node in its monitoring area:
1、假设在一定时间范围内,每个传感器节点的监测数据是平稳的,即第i个节点t时刻的监测数据

2、每个传感器节点的监测数据满足大数定律,即对于任意的T个时刻,每个传感器节点某时刻的监测数据值都收敛于所有监测数据值的期望值,期望值为:2. The monitoring data of each sensor node satisfies the law of large numbers, that is, for any T time, the monitoring data value of each sensor node at a certain time converges to the expected value of all monitoring data values, and the expected value is:

3、以各节点监测到的正常的历史数据为先验信息,为第i个节点构造一个pi阶的自回归模型:3. Taking the normal historical data monitored by each node as the prior information, construct an autoregressive model of order pi for theith node:

其中,


步骤三、在t时刻,节点感知监测数据并对其进行二值化,根据预先设定的阈值θ,若


步骤四、簇头对t时刻簇内的节点数据向量进行压缩采样,然后将采样所得数据路由至汇聚节点,汇聚节点对每个簇内的节点数据向量进行重构操作,得到初步检测结果,最后簇头对异常的监测数据进行收集:Step 4: The cluster head compresses and samples the node data vector in the cluster at time t, and then routes the sampled data to the sink node, and the sink node reconstructs the node data vector in each cluster to obtain the preliminary detection result. The cluster head collects abnormal monitoring data:
1、根据第j个簇头产生随机观测矩阵


2、汇聚节点根据收到的感知数据序列,利用OMP算法对每个簇内的节点数据向量进行重构;2. The sink node uses the OMP algorithm to reconstruct the node data vector in each cluster according to the received sensing data sequence;
本发明中使用的OMP算法伪代码如下所示:The OMP algorithm pseudocode used in the present invention is as follows:
输入:字典矩阵Φ,原始信号y,稀疏度K,标识待重建信号中非零元素位置的索引集TInput: dictionary matrix Φ, original signal y, sparsity K, index set T identifying the positions of non-zero elements in the signal to be reconstructed
输出:重建信号xoutput: reconstructed signal x
初始化:x=0,r0=y,循环标识k=0,索引集T0为空集Initialization: x=0, r0 =y, loop identifier k=0, index set T0 is an empty set
当没有满足结束条件时,循环执行步骤①~⑥When the end condition is not met, steps ①~⑥ are executed cyclically
①k=k+1①k=k+1
②找出残差r与采样矩阵中最匹配原子的索引λk,即② Find the index λk of the most matching atom in the residual r and the sampling matrix, namely
λk=argmaxj=1,2,...,N{|<rk-1,φk>|}λk =argmaxj=1,2,...,N {|<rk-1 ,φk >|}
③更新索引集Tk=Tk-1∪{λk},并更新相应采样矩阵中的重建原子集合③Update the index set Tk =Tk-1 ∪{λk }, and update the reconstructed atom set in the corresponding sampling matrix

④由最小二乘法得到
⑤更新残差:
⑥判断是否满足k>K,若满足,则停止迭代,若不满足,则执行步骤①⑥ Judge whether k>K is satisfied, if so, stop the iteration, if not, execute step ①
3、各个簇内重构得到的监测数据为非零的传感器节点将其原始监测数据发送给簇头,其中序号为i的传感器节点发送的原始监测数据为
步骤五、簇头根据监测数据的时空相关性对t时刻各个簇内重构得到的监测数据为非零的传感器节点(以下简称为目标传感器节点)的监测结果进行识别:Step 5: The cluster head identifies the monitoring results of the sensor nodes (hereinafter referred to as target sensor nodes) whose monitoring data reconstructed in each cluster at time t is non-zero according to the spatiotemporal correlation of the monitoring data:
1、根据之前为每个传感器节点建立的自回归模型(2):1. According to the autoregressive model (2) previously established for each sensor node:
由其t时刻的监测数据和其此前pi个时刻的历史数据,根据模型可计算出其t时刻的残差值
2、判断

3、t时刻各个簇头接收到序号为i的目标传感器节点发送的异常监测数据

4、簇头将簇内所有节点发送的监测数据进行排序,得到中值Me(若有偶数个监测数据,则取中间两数的均值);各节点的监测数据与中值Me差值集合为


5、当
Claims (2)


Priority Applications (1)
| Application Number | Priority Date | Filing Date | Title |
|---|---|---|---|
| CN201810367791.XACN108682140B (en) | 2018-04-23 | 2018-04-23 | An Enhanced Anomaly Detection Method Based on Compressed Sensing and Autoregressive Models |
Applications Claiming Priority (1)
| Application Number | Priority Date | Filing Date | Title |
|---|---|---|---|
| CN201810367791.XACN108682140B (en) | 2018-04-23 | 2018-04-23 | An Enhanced Anomaly Detection Method Based on Compressed Sensing and Autoregressive Models |
Publications (2)
| Publication Number | Publication Date |
|---|---|
| CN108682140A CN108682140A (en) | 2018-10-19 |
| CN108682140Btrue CN108682140B (en) | 2020-07-28 |
Family
ID=63802144
Family Applications (1)
| Application Number | Title | Priority Date | Filing Date |
|---|---|---|---|
| CN201810367791.XAExpired - Fee RelatedCN108682140B (en) | 2018-04-23 | 2018-04-23 | An Enhanced Anomaly Detection Method Based on Compressed Sensing and Autoregressive Models |
Country Status (1)
| Country | Link |
|---|---|
| CN (1) | CN108682140B (en) |
Families Citing this family (5)
| Publication number | Priority date | Publication date | Assignee | Title |
|---|---|---|---|---|
| CN109348450B (en)* | 2018-11-01 | 2021-05-25 | 北京京航计算通讯研究所 | High-reliability data transmission method applied to emergency disposal |
| CN109492193B (en)* | 2018-12-28 | 2020-11-27 | 同济大学 | Anomaly network data generation and prediction method based on deep machine learning model |
| CN109921952B (en)* | 2019-04-01 | 2021-11-23 | 安徽农业大学 | Data collection method based on compressed sensing and model driving |
| CN111189488B (en)* | 2019-12-13 | 2020-12-04 | 精英数智科技股份有限公司 | Sensor value abnormity identification method, device, equipment and storage medium |
| CN112672302B (en)* | 2020-12-21 | 2022-07-26 | 国网甘肃省电力公司电力科学研究院 | Clustering and data sensing method applied to photovoltaic power station wireless sensor |
Citations (7)
| Publication number | Priority date | Publication date | Assignee | Title |
|---|---|---|---|---|
| CN101511099A (en)* | 2009-04-01 | 2009-08-19 | 南京邮电大学 | Collection method for wireless sensor network data based on time series prediction model |
| CN102594904A (en)* | 2012-03-04 | 2012-07-18 | 浙江大学 | Method for detecting abnormal events of wireless sensor network in distributed way |
| EP3016352A1 (en)* | 2014-11-03 | 2016-05-04 | Fujitsu Limited | Method of managing sensor network |
| CN105636094A (en)* | 2016-03-16 | 2016-06-01 | 中国地质大学(武汉) | Wireless sensor network early warning method and system based on clustering compressed sensing |
| TW201619582A (en)* | 2014-11-25 | 2016-06-01 | 國立臺灣大學 | Method for vibration monitoring and alarming using autoregressive models |
| CN105682171A (en)* | 2016-03-09 | 2016-06-15 | 北京航空航天大学 | Spatio-temporal clustering method for compressive data gathering |
| CN106792435A (en)* | 2016-11-23 | 2017-05-31 | 西安电子科技大学 | A Data Aggregation Method Based on Compressed Sensing in Wireless Sensor Networks |
Family Cites Families (1)
| Publication number | Priority date | Publication date | Assignee | Title |
|---|---|---|---|---|
| WO2008141225A1 (en)* | 2007-05-11 | 2008-11-20 | The Trustees Of Columbia University In The City Of New York | Systems and methods for telescopic data compression in sensor networks |
- 2018
- 2018-04-23CNCN201810367791.XApatent/CN108682140B/ennot_activeExpired - Fee Related
Patent Citations (7)
| Publication number | Priority date | Publication date | Assignee | Title |
|---|---|---|---|---|
| CN101511099A (en)* | 2009-04-01 | 2009-08-19 | 南京邮电大学 | Collection method for wireless sensor network data based on time series prediction model |
| CN102594904A (en)* | 2012-03-04 | 2012-07-18 | 浙江大学 | Method for detecting abnormal events of wireless sensor network in distributed way |
| EP3016352A1 (en)* | 2014-11-03 | 2016-05-04 | Fujitsu Limited | Method of managing sensor network |
| TW201619582A (en)* | 2014-11-25 | 2016-06-01 | 國立臺灣大學 | Method for vibration monitoring and alarming using autoregressive models |
| CN105682171A (en)* | 2016-03-09 | 2016-06-15 | 北京航空航天大学 | Spatio-temporal clustering method for compressive data gathering |
| CN105636094A (en)* | 2016-03-16 | 2016-06-01 | 中国地质大学(武汉) | Wireless sensor network early warning method and system based on clustering compressed sensing |
| CN106792435A (en)* | 2016-11-23 | 2017-05-31 | 西安电子科技大学 | A Data Aggregation Method Based on Compressed Sensing in Wireless Sensor Networks |
Non-Patent Citations (3)
| Title |
|---|
| Distributed Compressive Sampling for Lifetime Optimization in Dense Wireless Sensor Networks;Carlo Caione 等;《IEEE Transactions on Industrial Informatics》;20120229;第8卷(第1期);第30-40页* |
| 基于压缩感知的无线传感网数据收集研究进展;朱更明 等;《西北大学学报(自然科学版)》;20150825;第45卷(第4期);第560-566页* |
| 采用压缩感知和GM(1,1)的无线传感器网络异常检测方法;刘洲洲 等;《西安交通大学学报》;20170228;第51卷(第2期);第40-46页* |
Also Published As
| Publication number | Publication date |
|---|---|
| CN108682140A (en) | 2018-10-19 |
Similar Documents
| Publication | Publication Date | Title |
|---|---|---|
| CN108682140B (en) | An Enhanced Anomaly Detection Method Based on Compressed Sensing and Autoregressive Models | |
| Clouqueur et al. | Fault tolerance in collaborative sensor networks for target detection | |
| CN106687773B (en) | Sensor node location and sensor network organization based on context event detection | |
| CN108882225B (en) | A secure location method based on ranging in wireless sensor networks | |
| Moshtaghi et al. | Anomaly detection by clustering ellipsoids in wireless sensor networks | |
| CN103200597B (en) | Wireless sensor network-oriented fault-tolerance event boundary detection method | |
| CN113497726A (en) | Alarm monitoring method, alarm monitoring system, computer readable storage medium and electronic equipment | |
| CN102752784B (en) | Detection method of distribution type event domain based on graph theory in wireless sensor network | |
| CN108650706B (en) | Sensor node positioning method based on second-order Taylor approximation | |
| CN111027721B (en) | A System Fault Location Method | |
| US10200965B2 (en) | Analysis and monitoring of a positioning infrastructure | |
| CN109547929B (en) | Distributed sensor node localization method based on conjugate gradient method | |
| Nguyen et al. | Applying time series analysis and neighbourhood voting in a decentralised approach for fault detection and classification in WSNs | |
| Rajagopal et al. | Distributed online simultaneous fault detection for multiple sensors | |
| CN110266527B (en) | Sensor node fault classification alarm method and device based on spatial correlation | |
| CN111157943A (en) | TOA-Based Sensor Position Error Suppression in Asynchronous Networks | |
| CN118611706A (en) | A communication control method based on power line network dual-mode communication | |
| Zhang et al. | Cooperative sensor anomaly detection using global information | |
| Chen et al. | Noncooperative topology inference of wireless networks with monitoring sensors | |
| CN111884859A (en) | Network fault diagnosis method and device and readable storage medium | |
| CN108988496B (en) | Method, device and equipment for diagnosing fault of secondary system of intelligent substation | |
| CN110988928B (en) | Satellite navigation landing integrity monitoring method based on length constraint | |
| CN109861859B (en) | Multi-Agent system fault detection method based on side inspection comprehensive judgment | |
| Cho et al. | Robust calibration for localization in clustered wireless sensor networks | |
| CN102075970B (en) | Method for detecting sparse event of wireless sensor network by loop restructuring |
Legal Events
| Date | Code | Title | Description |
|---|---|---|---|
| PB01 | Publication | ||
| PB01 | Publication | ||
| SE01 | Entry into force of request for substantive examination | ||
| SE01 | Entry into force of request for substantive examination | ||
| GR01 | Patent grant | ||
| GR01 | Patent grant | ||
| CF01 | Termination of patent right due to non-payment of annual fee | Granted publication date:20200728 | |
| CF01 | Termination of patent right due to non-payment of annual fee |