CN107463913B - L ab-based image collagen fiber recognition and calculation system and method - Google Patents
L ab-based image collagen fiber recognition and calculation system and methodDownload PDFInfo
- Publication number
- CN107463913B CN107463913BCN201710684074.5ACN201710684074ACN107463913BCN 107463913 BCN107463913 BCN 107463913BCN 201710684074 ACN201710684074 ACN 201710684074ACN 107463913 BCN107463913 BCN 107463913B
- Authority
- CN
- China
- Prior art keywords
- image
- fiber
- pixels
- blue halo
- collagen
- Prior art date
- Legal status (The legal status is an assumption and is not a legal conclusion. Google has not performed a legal analysis and makes no representation as to the accuracy of the status listed.)
- Active
Links
Images


Classifications
- G—PHYSICS
- G06—COMPUTING OR CALCULATING; COUNTING
- G06V—IMAGE OR VIDEO RECOGNITION OR UNDERSTANDING
- G06V20/00—Scenes; Scene-specific elements
- G06V20/60—Type of objects
- G06V20/69—Microscopic objects, e.g. biological cells or cellular parts
- G06V20/693—Acquisition
- G—PHYSICS
- G06—COMPUTING OR CALCULATING; COUNTING
- G06T—IMAGE DATA PROCESSING OR GENERATION, IN GENERAL
- G06T7/00—Image analysis
- G06T7/60—Analysis of geometric attributes
- G06T7/62—Analysis of geometric attributes of area, perimeter, diameter or volume
- G—PHYSICS
- G06—COMPUTING OR CALCULATING; COUNTING
- G06V—IMAGE OR VIDEO RECOGNITION OR UNDERSTANDING
- G06V10/00—Arrangements for image or video recognition or understanding
- G06V10/40—Extraction of image or video features
- G06V10/56—Extraction of image or video features relating to colour
- G—PHYSICS
- G06—COMPUTING OR CALCULATING; COUNTING
- G06V—IMAGE OR VIDEO RECOGNITION OR UNDERSTANDING
- G06V20/00—Scenes; Scene-specific elements
- G06V20/60—Type of objects
- G06V20/69—Microscopic objects, e.g. biological cells or cellular parts
- G06V20/695—Preprocessing, e.g. image segmentation
- G—PHYSICS
- G06—COMPUTING OR CALCULATING; COUNTING
- G06T—IMAGE DATA PROCESSING OR GENERATION, IN GENERAL
- G06T2207/00—Indexing scheme for image analysis or image enhancement
- G06T2207/10—Image acquisition modality
- G06T2207/10056—Microscopic image
Landscapes
- Engineering & Computer Science (AREA)
- Physics & Mathematics (AREA)
- General Physics & Mathematics (AREA)
- Theoretical Computer Science (AREA)
- Multimedia (AREA)
- Life Sciences & Earth Sciences (AREA)
- Health & Medical Sciences (AREA)
- Biomedical Technology (AREA)
- General Health & Medical Sciences (AREA)
- Molecular Biology (AREA)
- Geometry (AREA)
- Computer Vision & Pattern Recognition (AREA)
- Image Analysis (AREA)
Abstract
Translated fromChinese
Description
Translated fromChinese技术领域technical field
本发明属于图像处理技术领域,涉及一种基于Lab颜色空间的图像胶原纤维定量方法。The invention belongs to the technical field of image processing, and relates to an image collagen fiber quantification method based on Lab color space.
背景技术Background technique
随着电子计算机技术的发展,图像中的各个部分已经能够被初步识别和分离,计算机还能够计算图像中的各个组成部分的面积,并逐渐从二维空间向三维空间发展。医学上一般使用图像分析系统用于组织图像分析,如果图像是彩色显示,需要使用彩色图像分析仪,除了灰度测量以外,还可以将不同的灰度编成不同的颜色,但根据提取或复合彩色图像的多个通道(包括RGB)等各个办法,对于胶原纤维的图像处理效果均不理想。With the development of electronic computer technology, each part in the image has been able to be initially identified and separated, and the computer can also calculate the area of each component in the image, and gradually develop from two-dimensional space to three-dimensional space. In medicine, image analysis systems are generally used for tissue image analysis. If the image is displayed in color, a color image analyzer needs to be used. In addition to grayscale measurement, different grayscales can also be programmed into different colors, but according to the extraction or compounding. Various methods such as multiple channels (including RGB) of color images are not ideal for image processing of collagen fibers.
胶原纤维(Collagen Fiber)是结缔组织中分布最广含量最多的一种纤维,广泛分布于各种脏器,其中皮肤、巩膜、肌腱最丰富。但现有的对胶原纤维图像的处理方法无法取得令人满意的效果。例如,基于Quant center分析软件的胶原定量法,是进入Quant center的histo quant软件选取整幅明场光源背景下拍摄的图片上红色区域进行测量进而分析出目的组织区域总面积:红色胶原面积,从而获得胶原的容积率,但在应用过程中发现易出现假阳性染色的分辨情况。Collagen fiber is the most widely distributed fiber in connective tissue, widely distributed in various organs, among which skin, sclera and tendon are the most abundant. However, the existing processing methods for collagen fiber images cannot achieve satisfactory results. For example, the collagen quantification method based on Quant center analysis software is to enter the histo quant software of Quant center to select the red area on the picture taken under the background of the whole bright field light source to measure and then analyze the total area of the target tissue area: the area of red collagen, thereby The volume ratio of collagen was obtained, but the resolution of false positive staining was found during application.
发明内容SUMMARY OF THE INVENTION
为解决上述问题,本发明公开了一种医学图像胶原纤维识别计算系统及方法,基于Lab颜色空间技术,对偏振光下的染色图像提取其纤维部分并进行比值计算,从而实现胶原纤维的准确识别。In order to solve the above problems, the present invention discloses a medical image collagen fiber identification calculation system and method. Based on the Lab color space technology, the fiber part of the dyed image under polarized light is extracted and the ratio calculation is performed, so as to realize the accurate identification of collagen fibers. .
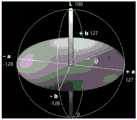
Lab颜色空间是L*a*b(CIELAB)颜色空间的一种非正式缩写,该颜色空间将可见颜色分为三种变量并分别用数学方法将其量化,其中用L来代表亮度,a和b分别代表绿/红和蓝/黄间的偏移程度。在该空间中,L的值域是[0,100]亮度范围是由纯黑色(L=0)渐变为纯白色(L=100)。当L=0并且另外两个颜色通道,a=0和b=0时,呈现的颜色为中性灰度值。红-绿间的渐变程度由a轴来表示,当a>0的时候成现红色,a<0的时候呈现绿色。同理,b轴被用来表示蓝-黄间的渐变程度,并且当b<0时呈现蓝色,b>0时呈现黄色。两个颜色通道的值域都是[-128,127]。在本项研究中,根据b通道数值,我们首先广义地将颜色分为冷色和暖色。在图1中,椭圆形色相环的上半环(b≥0)仅含有暖色,下半环(b≤0)仅含有冷色。The Lab color space is an informal abbreviation for the L*a*b (CIELAB) color space, which divides visible color into three variables and quantifies them mathematically, where L is used for lightness, a and b represents the offset between green/red and blue/yellow, respectively. In this space, the value range of L is [0, 100] and the luminance range is gradually changed from pure black (L=0) to pure white (L=100). When L=0 and the other two color channels, a=0 and b=0, the color presented is a neutral gray value. The degree of gradient between red and green is represented by the a-axis. When a>0, it becomes red, and when a<0, it becomes green. Similarly, the b-axis is used to represent the degree of gradient between blue and yellow, and it is blue when b<0, and yellow when b>0. The range of values for both color channels is [-128, 127]. In this study, we first broadly classify colors into cool and warm colors according to the b-channel value. In Figure 1, the upper half of the elliptical hue circle (b≥0) contains only warm colors, and the lower half (b≤0) only contains cool colors.
与RGB颜色空间不同,Lab颜色空间可以将‘颜色’与‘亮度’完全分离开。例如,L通道仅反映颜色的亮度而不干涉颜色的种类(色相)。相反,a和b通道反映颜色的种类(色相)但与亮度无关。因此,我们利用Lab颜色空间的这个特殊性质,并根据不同颜色色相区间,通过不同程度的亮度等级来将纤维部分所在的像素点提取出来。除此之外,该颜色空间拥有感官统一性,三通道上的数值上的变化程度与视觉感官上的变化程度相对应。因为我们通过视觉来对颜色进行分组,所以我们将颜色空间分为多个区间,每个区间内不同颜色之间色相相似。Unlike the RGB color space, the Lab color space can completely separate 'color' from 'brightness'. For example, the L channel reflects only the brightness of the color and does not interfere with the kind (hue) of the color. Conversely, the a and b channels reflect the kind of color (hue) but have nothing to do with brightness. Therefore, we use this special property of the Lab color space and extract the pixels where the fiber part is located through different brightness levels according to different color hue intervals. In addition, the color space has sensory unity, and the degree of change in the value of the three channels corresponds to the degree of change in the visual sense. Because we visually group colors, we divide the color space into multiple intervals, each with similar hues between different colors.
天狼星红和其衬染液都是强酸性染料,易与胶原分子中的碱性基团结合,吸附牢靠。偏振光镜下检查,胶原纤维有正的单轴双折射光的属性,与天狼星红染色液结合后,可增强双折射,提高分辨率,从而大致区分出不同纤维类型(I型呈黄色、橙红色,III型呈黄绿色)。从而能够避免明场图片易出现假阳性染色的分辨情况,以及因为增强折射而减少了假阴性的染色问题。Sirius red and its lining dye are strong acid dyes, which are easy to combine with basic groups in collagen molecules and have firm adsorption. Examined under a polarized light microscope, collagen fibers have the property of positive uniaxial birefringence light. When combined with Sirius red staining solution, birefringence can be enhanced and resolution can be improved, thereby roughly distinguishing different fiber types (type I is yellow, orange, etc.). red, type III is yellow-green). In this way, it is possible to avoid the discrimination of false-positive staining in brightfield images, and reduce the problem of false-negative staining due to enhanced refraction.
本发明提供如下技术方案:The present invention provides the following technical solutions:
基于Lab的医学图像胶原纤维识别计算方法,包括如下步骤:The Lab-based medical image collagen fiber recognition calculation method includes the following steps:
步骤1,将含有胶原纤维的组织进行染色并在偏振光下拍照,将拍照获得的图像导入计算机中并转换至Lab颜色空间,图像中,胶原纤维具有双折射性呈现染色加强状态;In step 1, the tissue containing collagen fibers is stained and photographed under polarized light, and the image obtained by photographing is imported into the computer and converted to the Lab color space. In the image, the collagen fibers have birefringence and are in a state of enhanced staining;
步骤2,提取曝光区域Step 2, Extract the exposure area
步骤2-1,初步获得包含蓝色光晕的二值图,二值图中每个连续区域都是一个包含像素点的集合An而且集合互相之间互相独立,An中的像素点满足b≤b0,这些独立集合的全集表示如下:Step 2-1, initially obtain a binary image containing a blue halo. Each continuous area in the binary image is a set An containing pixels and the sets are independent of each other. The pixels in An satisfy b ≤b0 , the ensemble representation of these independent sets is as follows:
A=A1∪A2...∪AnA=A1 ∪A2 ...∪An
b0为蓝色光晕的提取阈值;b0 is the extraction threshold of blue halo;
步骤2-2,初步获得包含曝光区域的二值图,二值图中每个连续区域都是一个包含像素点的集合Bm而且集合互相之间互相独立,Bm中的像素点满足L≥L0,这些独立集合的全集表示如下:Step 2-2: Preliminarily obtain a binary image including the exposure area. Each continuous area in the binary image is a set Bm containing pixels and the sets are independent of each other. The pixels in Bm satisfy L≥ L0 , the ensemble representation of these independent sets is as follows:
B=B1∪B2...∪BmB=B1 ∪B2 ...∪Bm
L0为曝光区域的亮度提取阈值;L0 is the brightness extraction threshold of the exposure area;
去除二值图中的噪点,取集合B中与A有交集的元素组成集合C:Remove the noise in the binary image, and take the elements in set B that intersect with A to form set C:


步骤2-3,对蓝色光晕进行形态学转换Steps 2-3, morphological transformation of the blue halo
取集合A中与B有交集的元素组成集合D:Take the elements in set A that have intersection with B to form set D:


使用matlab函数对蓝色光晕进行膨胀;Use the matlab function to expand the blue halo;
对蓝色光晕与图像边界的缺口进行填充;Fill in the gap between the blue halo and the image border;
使用matlab函数对蓝色光晕的内部进行填充;Use the matlab function to fill the interior of the blue halo;
通过matlab函数将蓝色光晕收缩获得集合F;The set F is obtained by shrinking the blue halo by the matlab function;
步骤2-4,求集合C和集合F的交集:Steps 2-4, find the intersection of set C and set F:
PO=C∩FPO =C∩F
步骤3,提取纤维部分Step 3, Extract the fiber part
步骤3-1,提取满足L0≤L≤100,且b>0的所有像素点的集合PRule;Step 3-1, extracting a set PRule of all pixels that satisfies L0 ≤ L ≤ 100, and b>0;
步骤3-2,基于集合PRule和PO求得纤维部分像素的集合:Step 3-2, based on the set PRule andPO to obtain the set of fiber part pixels:
PF=PRule\PO。PF =PRule \PO .
进一步的,还包括计算纤维面积NFibers的步骤:Further, it also includes the steps of calculating the fiber area NFibers :
NFibers=|PF|。NFibers = |PF |.
进一步的,还包括计算纤维率的步骤:Further, it also includes the steps of calculating the fiber rate:
提取有效图像部分:在图片上标记出有效图像部分的边界,计算机识别标记,并只将标记内部的像素点计入有效图像部分NTotal;Extract the effective image part: mark the boundary of the effective image part on the picture, the computer recognizes the mark, and only counts the pixels inside the mark into the effective image part NTotal ;
通过以下公式计算纤维率r:The fiber fraction r is calculated by the following formula:

进一步的,步骤2-3中进行膨胀时采用imdilate方法。Further, the imdilate method is used during expansion in steps 2-3.
进一步的,步骤2-3中对蓝色光晕与图像边界的缺口进行的填充通过在图像边界插入一条线段实现,线段的首末端分别为蓝色光晕与图像边界的接触点。Further, the filling of the gap between the blue halo and the image boundary in step 2-3 is achieved by inserting a line segment at the image boundary, and the beginning and end of the line segment are the contact points of the blue halo and the image boundary respectively.
进一步的,步骤2-3中进行填充时采用imfill方法。Further, the imfill method is used when filling in steps 2-3.
进一步的,步骤2-3中进行收缩时采用imerode方法。Further, the imerode method is used when shrinking in steps 2-3.
基于Lab的医学图像胶原纤维识别计算系统,包括图像采集模块、曝光区域提取模块、纤维提取模块;Lab-based medical image collagen fiber recognition computing system, including image acquisition module, exposure area extraction module, and fiber extraction module;
所述图像采集模块用于获取含有胶原纤维的组织的染色偏振图像,并将图像转换至Lab颜色空间,图像中,胶原纤维具有双折射性呈现染色加强状态;The image acquisition module is used to acquire the dyed polarized image of the tissue containing collagen fibers, and convert the image to Lab color space. In the image, the collagen fibers have birefringence and show enhanced dyeing state;
所述曝光区域提取模块The exposure area extraction module
用于初步获得包含蓝色光晕的二值图,二值图中每个连续区域都是一个包含像素点的集合An而且集合互相之间互相独立,An中的像素点满足b≤bo,独立集合的全集为A=A1∪A2...∪An;It is used to initially obtain a binary image containing a blue halo. Each continuous area in the binary image is a set An containing pixels and the sets are independent of each other. The pixels in An satisfy b≤bo , the complete set of independent sets is A=A1 ∪A2 ... ∪An ;
用于初步获得包含曝光区域的二值图,二值图中每个连续区域都是一个包含像素点的集合Bm而且集合互相之间互相独立,Bm中的像素点满足L≥L0,独立集合的全集表示为B=B1∪B2...∪Bm;It is used to initially obtain a binary image including the exposure area. Each continuous area in the binary image is a set Bm containing pixels and the sets are independent of each other. The pixels in Bm satisfy L≥L0 , The complete set of independent sets is expressed as B=B1 ∪B2 ... ∪Bm ;
用于去除二值图中的噪点,取集合B中与A有交集的元素组成集合C;It is used to remove the noise in the binary image, and take the elements in the set B that have intersection with A to form the set C;
用于对蓝色光晕进行形态学转换,取集合A中与B有交集的元素组成集合D;使用matlab函数对蓝色光晕进行膨胀;对蓝色光晕与图像边界的缺口进行填充;使用matlab函数对蓝色光晕的内部进行填充;通过matlab函数将蓝色光晕收缩获得集合F;求集合C和集合F的交集PO;Used to morphologically transform the blue halo, take the elements in set A that intersect with B to form set D; use the matlab function to expand the blue halo; fill the gap between the blue halo and the image boundary; use the matlab function Fill the interior of the blue halo; shrink the blue halo to obtain a set F by the matlab function; find the intersectionPO of the set C and the set F;
所述纤维提取模块用于提取满足L≥L′,且b>0的所有像素点的集合PRule;并基于集合PRule和PO求得纤维部分像素的集合PF=PRule\PO。The fiber extraction module is used to extract the set PRule of all pixels satisfying L≥L′ and b>0; and based on the set PRule and PO to obtain the set of fiber part pixels PF =PRule \PO .
进一步的,还包括纤维面积计算模块,用于计算纤维面积NFibers:Further, it also includes a fiber area calculation module for calculating the fiber area NFibers :
NFibers=|PF|。NFibers = |PF |.
进一步的,还包括纤维率计算模块,用于计算纤维率,方式为:Further, it also includes a fiber rate calculation module, which is used to calculate the fiber rate in the following ways:
提取有效图像部分:在图片上标记出有效图像部分的边界,计算机识别标记,并只将标记内部的像素点计入有效图像部分NTotal;Extract the effective image part: mark the boundary of the effective image part on the picture, the computer recognizes the mark, and only counts the pixels inside the mark into the effective image part NTotal ;
通过以下公式计算纤维率r:The fiber fraction r is calculated by the following formula:

与现有技术相比,本发明具有如下优点和有益效果:Compared with the prior art, the present invention has the following advantages and beneficial effects:
本发明基于不同类型胶原纤维经天狼星红(Sirius Red)等强酸性染料结合后在偏振光下存在增强的双折射光属性,并利用了Lab颜色空间对黄色过渡到红色的强大的解释性由a通道的数值量化红色的饱和程度,b通道量化黄色的饱和程度),以及独立于颜色信息之外对亮度信息量化方式经过图像预处理剔除杂质曝光点等步骤,设定标准提取目标颜色所在的区间,得到目标颜色的分布图,最后计算比例等步骤实现胶原纤维的区域识别和定量。本发明能够准确地识别出图像中的纤维部分,并能够精确地计算纤维面积和纤维率,不丢失、不遗漏、不增加胶原纤维图像特征,高效高质量完成医学图像的分析。相较于传统人工观察方法提高精度,降低误差率,与现有的胶原定量法相比,准确度更高,实用性强,便于应用和推广。The invention is based on that different types of collagen fibers have enhanced birefringence properties under polarized light after being combined with strong acid dyes such as Sirius Red, and utilizes the Lab color space to explain the transition from yellow to red. The value of the channel quantifies the saturation degree of red, the b channel quantifies the saturation degree of yellow), and independent of the color information, the brightness information is quantified through image preprocessing to remove the impurity exposure points and other steps, and the standard is set to extract the interval where the target color is located. , obtain the distribution map of the target color, and finally calculate the proportion and other steps to realize the regional identification and quantification of collagen fibers. The invention can accurately identify the fiber part in the image, and can accurately calculate the fiber area and fiber rate, without losing, missing or increasing the image features of collagen fibers, and completes the analysis of medical images with high efficiency and high quality. Compared with the traditional manual observation method, the accuracy is improved and the error rate is reduced. Compared with the existing collagen quantification method, the accuracy is higher, the practicability is strong, and the application and promotion are convenient.
附图说明Description of drawings
图1为Lab色彩空间a、b关系示意图。Figure 1 is a schematic diagram of the relationship between a and b in the Lab color space.
图2为步骤1获得的肺部组织切片示意图,其中标示出了各个组成部分。Figure 2 is a schematic diagram of the lung tissue section obtained in step 1, in which various components are marked.
图3为曝光区域与蓝色光晕的分解图。Figure 3 is an exploded view of the exposed area and blue halo.
图4为初步提取出蓝色光晕的二值图。FIG. 4 is a binary image of initially extracted blue halo.
图5为初步提取出曝光区域的二值图。FIG. 5 is a binary image of preliminarily extracted exposure areas.
图6为包含有集合C的二值图。FIG. 6 is a binary graph containing set C. FIG.
图7为包含有集合D的二值图。FIG. 7 is a binary graph containing set D. FIG.
图8为包含有集合E的二值图。FIG. 8 is a binary graph containing set E. FIG.
图9为包含有集合F的二值图。FIG. 9 is a binary graph containing the set F. FIG.
图10为圈出曝光区域的肺部组织切片示意图。Figure 10 is a schematic diagram of the lung tissue section with the circled exposure area.
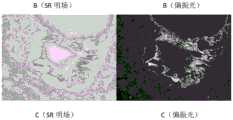
图11为三张肺部切片图。Figure 11 is a view of three lung slices.
图12为本发明方法流程图。Figure 12 is a flow chart of the method of the present invention.
具体实施方式Detailed ways
以下将结合具体实施例对本发明提供的技术方案进行详细说明,应理解下述具体实施方式仅用于说明本发明而不用于限制本发明的范围。The technical solutions provided by the present invention will be described in detail below with reference to specific embodiments. It should be understood that the following specific embodiments are only used to illustrate the present invention and not to limit the scope of the present invention.
本发明提供的基于Lab的医学图像胶原纤维识别计算方法,如图12所示,包括如下步骤:The Lab-based medical image collagen fiber identification calculation method provided by the present invention, as shown in Figure 12, includes the following steps:
步骤1,为了获得肺部组织中纤维率,我们将小鼠肺部切片进行染色并在偏振光下拍照,然后将其导入计算机并数字化,转换至Lab颜色空间,对于数字化后的图片,我们认为纤维部分的特征为暖色,较亮。上述染色剂应采用令胶原纤维在偏振光下具有双折射性呈现染色加强表现的种类,如天狼星红等,这样拍照获得的图像中,胶原纤维均呈现染色加强状态。图2为该切片图像,图上包括背景、曝光区域、蓝色光晕、肺片组织和纤维,还有部分噪点。本发明中针对图像中这些部分进行了如下解析和定义:Step 1, in order to obtain the fiber rate in the lung tissue, we stained the mouse lung sections and photographed them under polarized light, then imported them into the computer and digitized them, and converted them to the Lab color space. For the digitized pictures, we thought that The fiber part is characterized by a warm color, which is brighter. The above-mentioned dyes should be those that make the collagen fibers have birefringence under polarized light and show enhanced staining, such as Sirius Red, so that in the images obtained by taking pictures, the collagen fibers are in a state of enhanced staining. Figure 2 is an image of the slice, which includes the background, exposed areas, blue halo, lung tissue and fibers, and some noise. In the present invention, these parts in the image are analyzed and defined as follows:
由于载玻片上会存在部分杂质,显微镜照出来的相片会存在部分过亮区域,即为曝光区域,该类区域被认作为白色区域但是其中的色相可能会包含冷色和暖色。在所有曝光区域的外层都可能包裹着一层蓝色的光晕,曝光区域与蓝色光晕会存在部分相交部分,区域会根据像素点中的L和b来呈现由白色到蓝色的渐变。在这里我们这部分像素为渐变区域,图3显示了曝光区域与蓝色光晕之间的关联性。由于染剂的化学作用,纤维在显微镜下呈现高亮的暖色。如果某部分像素点亮度较低但不为纯黑色,我们就将其认作为肺片组织。在我们所处理的图像里,背景中的所有像素点都呈现接近纯黑色并同时存在肺片细胞内部与外部的区域。该部分的L值非常小,所以即使呈现黑色,也有可能同时存在冷色与暖色像素。基于上述定义,我们对图像中的各个部分进行识别和分离,从而最终得到纤维部分图像。Due to the presence of some impurities on the slide, the photos taken by the microscope will have some over-bright areas, that is, exposed areas, which are considered as white areas but may contain cool and warm colors. The outer layer of all exposure areas may be wrapped with a layer of blue halo. There will be a partial intersection between the exposure area and the blue halo. The area will show a gradient from white to blue according to L and b in the pixel. . Here our part of the pixel is the gradient area, Figure 3 shows the correlation between the exposure area and the blue halo. Due to the chemical action of the dye, the fibers appear bright and warm under the microscope. If a certain part of the pixel has low brightness but is not pure black, we consider it as a lung slice. In the images we processed, all pixels in the background appeared nearly pure black and existed both inside and outside the lung slice cells. The L value of this part is very small, so even if it appears black, it is possible to have both cool and warm pixels. Based on the above definition, we identify and separate each part in the image, and finally get the fiber part image.
步骤2,提取曝光区域,这部分的主要目的在于定位图像中的曝光区域。曝光部分的像素点的L值很高,而且可能同时存在冷色与暖色的像素。我们通过定位蓝色光晕的位置来找到曝光区域。最终我们可以得到一个包含曝光区域像素的集合。具体包括以下步骤:Step 2, extract the exposure area, the main purpose of this part is to locate the exposure area in the image. The L value of the pixels in the exposed part is very high, and there may be both cool and warm pixels. We find the exposed area by locating the position of the blue halo. In the end we can get a set containing the pixels of the exposed area. Specifically include the following steps:
步骤2-1,蓝色光晕初步提取Step 2-1, preliminary extraction of blue halo
在所有曝光区域的外层都可能包裹着一层蓝色的光晕,而且我们可以通过设定b值上限b0来获得这部分光晕。首先我们通过设定b值上限(b≤-15,由实验得)来获得包含蓝色光晕部分及部分背景中的噪点的二值图(如图4所示),假设二值图中每个连续区域都是一个包含像素点的集合An而且集合互相之间互相独立,An中的像素点满足b≤b0(-15),我们用A来表示这些独立集合的全集:The outer layer of all exposed areas may be wrapped in a blue halo, and we can obtain this part of the halo by setting the upper b value of b0 . First, by setting the upper limit of the b value (b≤-15, obtained by experiment), we can obtain a binary image including the blue halo part and the noise in part of the background (as shown in Figure 4), assuming that each A continuous area is a set An containing pixels and the sets are independent of each other. The pixels in An satisfyb≤b0( -15). We use A to represent the complete set of these independent sets:
A=A1∪A2...∪AnA=A1 ∪A2 ...∪An
该全集中包含蓝色光晕及黑色背景中的噪点。从图4中我们可以看出,蓝色光晕部分并不是完全将曝光区域包裹的。这也许是因为在蓝环上存在暖色的纤维,使其在最开始提取的时候出现断裂,另外一个原因是蓝环有部分在图像外围,由于图像范围的限制使之出现分段。例如,在图4中蓝环部分的上边缘有一部分并不完整,即存在光晕边缘缺损的情况。This full set contains blue halos and noise on a black background. From Figure 4, we can see that the blue halo does not completely wrap the exposed area. This may be due to the presence of warm-colored fibers on the blue ring, which caused it to break at the beginning of extraction, and another reason is that the blue ring is partly at the periphery of the image, which is segmented due to the limitation of the image range. For example, in Fig. 4, a part of the upper edge of the blue ring portion is incomplete, that is, there is a case where the halo edge is missing.
步骤2-2,曝光区域初步提取Step 2-2, Preliminary extraction of exposure area
通过设定L值下限(L≥41,由实验获得),我们可以获得一个包含曝光区域及部分纤维和黑色背景中的噪点的二值图(如图5所示),同理,假设二值图中每个连续区域都是一个包含像素点的集合而且互相之间互相独立,Bm中的像素点满足L≥L0(41),我们用B来表示这些独立集合的全集:By setting the lower limit of L value (L ≥ 41, obtained by experiments), we can obtain a binary image (as shown in Figure 5) containing the exposed area and some fibers and noise in the black background (as shown in Figure 5). Similarly, assuming a binary image Each continuous region in the figure is a set containing pixels and independent of each other. The pixels in Bm satisfy L≥L0 (41). We use B to represent the complete set of these independent sets:
B=B1∪B2...∪BmB=B1 ∪B2 ...∪Bm
图5中显示了B中各个子集之间的关系,其中包括所有曝光区域以及部分过亮纤维和黑色背景中的噪点。The relationship between the various subsets in B is shown in Figure 5, which includes all exposed areas as well as some over-bright fibers and noise in the black background.
为了将图中可能被B包含的纤维部分及噪点除去,我们引入一个新的集合C满足如下关系:In order to remove the fiber parts and noises that may be included by B in the image, we introduce a new set C that satisfies the following relationship:


为了将背景中的噪点消除,我们取B中与A有交集的元素来组成C,如图6所示。理论上来说,C中仅包含曝光区域及与其相连的过渡区域。但是,由于有部分纤维与曝光区域(或过渡区域)相连并被识别为一个整体,所以C中会存在部分纤维。最后,C中会包含曝光区域及与其连通的纤维,二者共同组成了一个初步的曝光区域,如图6所示的左上方部分。接下来我们会对C进行进一步优化直至其只含有曝光区域。In order to remove the noise in the background, we take the elements in B that intersect with A to form C, as shown in Figure 6. In theory, C only contains the exposure area and the transition area connected to it. However, there will be some fibers in C because some fibers are connected to the exposed area (or transition area) and identified as a whole. Finally, C will contain the exposed area and the fibers connected to it, which together form a preliminary exposed area, as shown in the upper left part of Figure 6. Next we will further optimize C until it contains only exposed regions.
步骤2-3,对蓝色光晕进行形态学转换Steps 2-3, morphological transformation of the blue halo
目前A中既包含蓝色光晕也包含背景噪点。因此我们引入一个新集合D通过如下关系来对A进行优化:Currently A contains both blue halo and background noise. Therefore, we introduce a new set D to optimize A through the following relationship:


集合D中,每个元素都是来自于A并且与B存在交集。这意味着D仅含有提取的蓝色光晕以及过渡区域。如图7所示,只有被提取的蓝色光晕部分被显示,原有的背景中的噪点已经被从D中去除。In the set D, each element is from A and has an intersection with B. This means that D contains only the extracted blue halos and transition regions. As shown in Figure 7, only the extracted blue halo portion is displayed, and the original background noise has been removed from D.
为了从C中去除所有纤维部分,我们对D中的蓝色光晕部分进行形态学变换从而使他们闭合然后对封闭后的环进行填充。我们通过如下三步来实现:To remove all fiber parts from C, we morphologically transform the blue halo parts in D so that they are closed and then fill the closed loop. We do this in three steps:
第一步:首先通过使用matlab函数(imdilate)对蓝色光晕中的图像(蓝色光晕及蓝色光晕包围的图像)进行膨胀。Step 1: First, inflate the image in the blue halo (the blue halo and the image surrounded by the blue halo) by using the matlab function (imdilate).
第二步:通过在图像边界插入一条线段,我们对蓝色光晕与图像边界的缺口进行填充,线段的首末端分别为蓝色光晕与图像边界的接触点。Step 2: By inserting a line segment at the image boundary, we fill in the gap between the blue halo and the image boundary, and the beginning and end of the line segment are the contact points between the blue halo and the image boundary.
图8为经第二步填充后的闭合边界。同样也可以观察到,在图7中没有被闭合的上边界(图像边缘)在图8被闭合。已知每一个闭合并填充后的区域包含蓝色光晕及光晕内的区域。我们用E来代表这类区域的全集。Figure 8 shows the closed boundary after filling in the second step. It can also be observed that the upper border (image edge) that is not closed in FIG. 7 is closed in FIG. 8 . Each closed and filled region is known to contain a blue halo and the region within the halo. We use E to represent the complete set of such regions.
第三步:使用matlab函数(imfill)对蓝色光晕的内部进行填充。Step 3: Use the matlab function (imfill) to fill the interior of the blue halo.
通过第三步,闭合边界的内部区域被填充。由于之前对其进行过膨胀处理,我们将对图像进行一次逆向处理,通过matlab函数(imerode)将图像收缩之前膨胀的同等程度。然而,由于膨胀与收缩的过程并不是完全可逆的,收缩处理并不能完全地将其回复到膨胀前的形状。尽管如此,由于膨胀和收缩过程被控制在有限的范围内,填充区域外部的变化并不显著所以可以被忽略。当进行收缩后,我们将获得一个包含蓝色光晕部分在内的填充区域,如图9所示。在这里,我们用F来表示包含图9区域的集合。Through the third step, the inner area of the closed boundary is filled. Since it has been inflated before, we will reverse the image once, and shrink the image by the same amount as before inflating it through the matlab function (imerode). However, since the process of expansion and contraction is not completely reversible, the shrinkage treatment cannot completely restore it to its pre-expansion shape. Nonetheless, since the expansion and contraction processes are controlled within a limited range, the changes outside the filled area are not significant and can be ignored. When shrinking, we get a filled area that includes the blue halo section, as shown in Figure 9. Here, we use F to denote the set containing the region of Figure 9.
步骤2-4,优化粗糙曝光区域Steps 2-4, optimize rough exposure areas
我们需要将C中与曝光区域相连的纤维部分剔除掉。之前提到过曝光区域是由蓝色光晕所包裹的。因此,C中的每个独立的连续区域都比其在F中相对应的区域要小,除了部分有纤维连通的区域。通过比较图6与图9就会很明显的发现其中的对比关系。现在我们可以通过求交集来使该部分纤维被剔除掉,如下式:We need to cull out the part of the fiber in C that is connected to the exposed area. It was mentioned earlier that the exposed area is surrounded by a blue halo. Therefore, each independent continuous region in C is smaller than its corresponding region in F, except for the partially connected regions. By comparing Fig. 6 and Fig. 9, the contrast relationship will be clearly found. Now we can remove this part of the fiber by finding the intersection, as follows:
PO=C∩FPO =C∩F
该关系成立是因为F中不会存在纤维部分。因此,新集合PO所表示的曝光区域会比C中的粗糙曝光区域更小但是更加精确。集合PO中含有所有组成曝光区域的像素。图10中,被圈的曝光区域为通过算法所获取的PO。This relationship holds because there will be no fibrous moieties in F. Therefore, the exposure area represented by the new setPO will be smaller but more precise than the rough exposure area in C. The setPO contains all the pixels that make up the exposure area. In Fig. 10, the circled exposure area is thePO obtained by the algorithm.
步骤3,提取纤维部分Step 3, Extract the fiber part
步骤3-1,如果一个像素点的(L,a,b)满足L>=L’,它就会被提取出来,L’是通过实验数据先验获得。理论上来说,阈值L’=L′(a,b)由所有a值及b>0的所有可能组合来确定。但是这在数学上是不可实现的。由于颜色是在Lab颜色空间中排布的,所以相似色相会在空间中分布的非常接近而且其间的变化是连续的。选取图1中a,b平面中代表暖色的上半部分,并将其等价分为6部分的扇形区域,每一部分的圆心角为30°。通过实践,我们对每一个部分都测出一个相对应的阈值L’。如下表1所示。Step 3-1, if the (L, a, b) of a pixel satisfies L>=L', it will be extracted, and L' is obtained a priori through experimental data. Theoretically, the threshold L'=L'(a,b) is determined by all possible combinations of all values of a and b>0. But this is mathematically impossible. Since the colors are arranged in the Lab color space, similar hues are distributed very close in the space and the changes between them are continuous. Select the upper half of the a and b planes representing warm colors in Figure 1, and divide it into 6-part fan-shaped areas, and the central angle of each part is 30°. Through practice, we measure a corresponding threshold L' for each part. As shown in Table 1 below.
表1Table 1
通过使用表1中所示的阈值,我们提取出每一组(α,b)中满足-L’≤L≤100的所有像素点。我们用PRule来代指某一幅照片中根据以上规则提取出的所有像素点的集合。然而,除了纤维之外,集合PRule可能仍然含有在曝光区域部分的暖色像素。由于这些规则并未将纤维与暖色的曝光点分离开,我们对其进行一步额外操作,来求得纤维部分像素的集合PF:By using the thresholds shown in Table 1, we extract all pixels in each group (α, b) that satisfy -L'≤L≤100. We use PRule to refer to the collection of all pixels in a photo extracted according to the above rules. However, in addition to fibers, the set PRule may still contain warm-colored pixels in parts of the exposed area. Since these rules do not separate the fibers from the warm-colored exposure points, we perform an additional operation on them to find the setPF of fiber part pixels:
PF=PRule\POPF =PRule \PO
集合PF为PO对于Prule的相对补集,即PF=Prule-PO。The set PF is the relative complement of PO to Prule, that is, PF=Prule-PO.
由于计算机中的图片以像素作为最小单位,所以图片中纤维占据的面积可以通过计算该处像素点的个数来估计出来。基于上述求得的纤维部分像素的集合,能够计算纤维面积NFibers:Since the picture in the computer takes the pixel as the smallest unit, the area occupied by the fiber in the picture can be estimated by calculating the number of pixels there. Based on the set of fiber part pixels obtained above, the fiber area NFibers can be calculated:
NFibers=|PF|NFibers = |PF |
Nfiber为PF集合的元素个数。Nfiber is the number of elements in thePF set.
此外,我们还可以进一步计算纤维率,纤维率为纤维部分的面积NFibers比肺部切片的总面积NTotal。除了肺部切片以外,部分图片会存在肺部切片之外的部分,而这个部分也恰恰是不能计入像素点总数的NTotal。在实际应用中,为了获得准确的NTotal,在输出图片时,我们会人工在图片标注出肺部切片部分的边界。计算机会识别标记,并只将标记内部的像素点计入NTotal。In addition, we can further calculate the fiber fraction, which is the area of the fiber sectionNFibers versus the total area of the lung sliceNTotal . In addition to lung slices, some pictures will have parts other than lung slices, and this part is precisely NTotal that cannot be counted in the total number of pixels. In practical applications, in order to obtain an accurate NTotal , when outputting pictures, we will manually mark the boundaries of the lung slices in the pictures. The computer recognizes the marker and only counts the pixels inside the marker into NTotal .
通过以下公式计算纤维率r:The fiber fraction r is calculated by the following formula:

为了实现上述方法,本发明还提供了基于Lab的医学图像胶原纤维识别计算系统,包括图像采集模块、曝光区域提取模块、纤维提取模块;In order to realize the above method, the present invention also provides a Lab-based medical image collagen fiber identification computing system, including an image acquisition module, an exposure area extraction module, and a fiber extraction module;
图像采集模块用于获取含有胶原纤维的组织的染色偏振图像,并将图像转换至Lab颜色空间;图像中,胶原纤维呈现染色加强状态;The image acquisition module is used to acquire the stained polarized image of the tissue containing collagen fibers, and convert the image to Lab color space; in the image, the collagen fibers are in a state of enhanced staining;
曝光区域提取模块Exposure area extraction module
用于初步获得包含蓝色光晕的二值图,二值图中每个连续区域都是一个包含像素点的集合An而且集合互相之间互相独立,An中的像素点满足b≤b0,独立集合的全集为A=A1∪A2...∪An;It is used to initially obtain a binary image containing a blue halo. Each continuous area in the binary image is a set An containing pixel points and the sets are independent of each other. The pixels in An satisfy b≤b0 , the complete set of independent sets is A=A1 ∪A2 ... ∪An ;
用于初步获得包含曝光区域的二值图,二值图中每个连续区域都是一个包含像素点的集合Bm而且集合互相之间互相独立,Bm中的像素点满足L≥L0,独立集合的全集表示为B=B1∪B2...∪Bm;It is used to initially obtain a binary image including the exposure area. Each continuous area in the binary image is a set Bm containing pixels and the sets are independent of each other. The pixels in Bm satisfy L≥L0 , The complete set of independent sets is expressed as B=B1 ∪B2 ... ∪Bm ;
用于去除二值图中的噪点,取集合B中与A有交集的元素组成集合C;It is used to remove the noise in the binary image, and take the elements in the set B that have intersection with A to form the set C;
用于对蓝色光晕进行形态学转换,取集合A中与B有交集的元素组成集合D;使用matlab函数对蓝色光晕进行膨胀;对蓝色光晕与图像边界的缺口进行填充;使用matlab函数对蓝色光晕的内部进行填充;通过matlab函数将蓝色光晕收缩获得集合F;求集合C和集合F的交集PO;Used to morphologically transform the blue halo, take the elements in set A that intersect with B to form set D; use the matlab function to expand the blue halo; fill the gap between the blue halo and the image boundary; use the matlab function Fill the interior of the blue halo; shrink the blue halo to obtain a set F by the matlab function; find the intersectionPO of the set C and the set F;
纤维提取模块用于提取满足L0≤L≤100,且b>0的所有像素点的集合PRule;基于集合PRule和PO求得纤维部分像素的集合PF=PRule\PO。The fiber extraction module is used to extract the set PRule of all pixel points satisfying L0 ≤L≤100 and b>0; the set PF =PRule \PO of fiber part pixels is obtained based on the set PRule and PO .
还包括纤维面积计算模块,用于计算纤维面积NFibers:Also includes a fiber area calculation module for calculating the fiber areaNFibers :
NFibers=|PF|。NFibers = |PF |.
还包括纤维率计算模块,用于计算纤维率,方式为:Also includes a fiber rate calculation module for calculating fiber rate by:
提取有效图像部分:在图片上标记出肺部切片部分的边界,计算机识别标记,并只将标记内部的像素点计入有效图像部分NTotal;Extract the effective image part: mark the boundary of the lung slice part on the picture, the computer recognizes the mark, and only counts the pixels inside the mark into the effective image part NTotal ;
通过以下公式计算纤维率r:The fiber fraction r is calculated by the following formula:

将本发明识别后的纤维图像,用人工识别方法验证,准确率极高,毫无疑问采用本发明识别方法能够避免人工识别带来的误差,且能够快速计算纤维面积和纤维率。以三张肺部切片图像为例,采用本发明方法和胶原定量法分别计算纤维率,对比如下表2。The fiber image identified by the present invention is verified by the manual identification method, and the accuracy is extremely high. There is no doubt that the identification method of the present invention can avoid errors caused by manual identification, and can quickly calculate the fiber area and fiber rate. Taking three lung slice images as an example, the method of the present invention and the collagen quantification method are used to calculate the fiber rate respectively, and the comparison is shown in Table 2 below.

表2Table 2
可以看出,胶原定量法误差极大,无法满足识别需求,而本方案获得的纤维定量比率比胶原定量法要准确地多,避免了假阳性率的发生,具有极强的实用性。It can be seen that the collagen quantification method has a large error and cannot meet the identification requirements. The fiber quantification ratio obtained by this scheme is more accurate than that of the collagen quantification method, which avoids the occurrence of false positive rates and has strong practicability.
本发明方法不仅可以应用于肺部切片图片的胶原纤维识别和计算,还能够应用于其他包含有胶原纤维的组织切片图片中。基于对胶原纤维的准确识别和定量,本发明能够应用于人体图像建模,运动、美容效果评测,病理分析等与人体有关的各种领域中。The method of the present invention can not only be applied to the identification and calculation of collagen fibers in lung slice pictures, but also can be applied to other tissue slice pictures containing collagen fibers. Based on the accurate identification and quantification of collagen fibers, the present invention can be applied to various fields related to the human body, such as human body image modeling, sports, beauty effect evaluation, and pathological analysis.
本发明方案所公开的技术手段不仅限于上述实施方式所公开的技术手段,还包括由以上技术特征任意组合所组成的技术方案。应当指出,对于本技术领域的普通技术人员来说,在不脱离本发明原理的前提下,还可以做出若干改进和润饰,这些改进和润饰也视为本发明的保护范围。The technical means disclosed in the solution of the present invention are not limited to the technical means disclosed in the above embodiments, but also include technical solutions composed of any combination of the above technical features. It should be pointed out that for those skilled in the art, without departing from the principle of the present invention, several improvements and modifications can be made, and these improvements and modifications are also regarded as the protection scope of the present invention.
Claims (10)
Translated fromChinese


Priority Applications (1)
| Application Number | Priority Date | Filing Date | Title |
|---|---|---|---|
| CN201710684074.5ACN107463913B (en) | 2017-08-11 | 2017-08-11 | L ab-based image collagen fiber recognition and calculation system and method |
Applications Claiming Priority (1)
| Application Number | Priority Date | Filing Date | Title |
|---|---|---|---|
| CN201710684074.5ACN107463913B (en) | 2017-08-11 | 2017-08-11 | L ab-based image collagen fiber recognition and calculation system and method |
Publications (2)
| Publication Number | Publication Date |
|---|---|
| CN107463913A CN107463913A (en) | 2017-12-12 |
| CN107463913Btrue CN107463913B (en) | 2020-07-14 |
Family
ID=60547640
Family Applications (1)
| Application Number | Title | Priority Date | Filing Date |
|---|---|---|---|
| CN201710684074.5AActiveCN107463913B (en) | 2017-08-11 | 2017-08-11 | L ab-based image collagen fiber recognition and calculation system and method |
Country Status (1)
| Country | Link |
|---|---|
| CN (1) | CN107463913B (en) |
Families Citing this family (4)
| Publication number | Priority date | Publication date | Assignee | Title |
|---|---|---|---|---|
| CN108230387B (en)* | 2017-12-29 | 2020-10-27 | 杭州筹图科技有限公司 | Fiber interval characteristic quantification method and device |
| CN113129356B (en)* | 2020-01-16 | 2022-08-23 | 安翰科技(武汉)股份有限公司 | Capsule endoscope system, image staining area recognition method thereof, and storage medium |
| CN111462143B (en)* | 2020-03-22 | 2022-12-02 | 华中科技大学 | A method and system for identifying and counting insects based on watershed algorithm |
| CN112700422A (en)* | 2021-01-06 | 2021-04-23 | 百果园技术(新加坡)有限公司 | Overexposure point detection method and device, electronic equipment and storage medium |
Family Cites Families (5)
| Publication number | Priority date | Publication date | Assignee | Title |
|---|---|---|---|---|
| ES2573945T3 (en)* | 2008-09-16 | 2016-06-13 | Novartis Ag | Reproducible quantification of biomarker expression |
| JP5953035B2 (en)* | 2011-11-28 | 2016-07-13 | 学校法人慶應義塾 | Pathological diagnosis support apparatus, pathological diagnosis support method, and pathological diagnosis support program |
| CN104778729A (en)* | 2014-01-09 | 2015-07-15 | 上海帝仪科技有限公司 | Iris extraction method and equipment under uneven illumination condition |
| CN105550651B (en)* | 2015-12-14 | 2019-12-24 | 中国科学院深圳先进技术研究院 | A method and system for automatic analysis of panoramic images of digital pathological slides |
| CN106228545B (en)* | 2016-07-14 | 2018-11-13 | 西北民族大学 | A kind of automatic division method of figure of buddha class Tangka's consistency damaged area |
- 2017
- 2017-08-11CNCN201710684074.5Apatent/CN107463913B/enactiveActive
Also Published As
| Publication number | Publication date |
|---|---|
| CN107463913A (en) | 2017-12-12 |
Similar Documents
| Publication | Publication Date | Title |
|---|---|---|
| Khan et al. | A nonlinear mapping approach to stain normalization in digital histopathology images using image-specific color deconvolution | |
| Celebi et al. | Lesion border detection in dermoscopy images | |
| CN107463913B (en) | L ab-based image collagen fiber recognition and calculation system and method | |
| Banerjee et al. | Automated 3D segmentation of brain tumor using visual saliency | |
| Li et al. | Dual U-Net for the segmentation of overlapping glioma nuclei | |
| US8131054B2 (en) | Computerized image analysis for acetic acid induced cervical intraepithelial neoplasia | |
| Marin et al. | Obtaining optic disc center and pixel region by automatic thresholding methods on morphologically processed fundus images | |
| Khan et al. | HyMaP: A hybrid magnitude-phase approach to unsupervised segmentation of tumor areas in breast cancer histology images | |
| Duan et al. | A WBC segmentation methord based on HSI color space | |
| Pathan et al. | Automated detection of melanocytes related pigmented skin lesions: A clinical framework | |
| CN108320289B (en) | Bone marrow cell segmentation method based on sparse representation and morphological operation | |
| Isaksson et al. | Semantic segmentation of microscopic images of H&E stained prostatic tissue using CNN | |
| Wei et al. | Deep morphological simplification network (MS-Net) for guided registration of brain magnetic resonance images | |
| Mahdiraji et al. | Skin lesion images classification using new color pigmented boundary descriptors | |
| Jiao et al. | Tongue color clustering and visual application based on 2D information | |
| Román et al. | Image color contrast enhancement using multiscale morphology | |
| Fernández-Carrobles et al. | Automatic quantification of IHC stain in breast TMA using colour analysis | |
| Chaira | Intuitionistic fuzzy color clustering of human cell images on different color models | |
| Anandgaonkar et al. | Brain tumor detection and identification from T1 post contrast MR images using cluster based segmentation | |
| Zarei et al. | Automated prostate glandular and nuclei detection using hyperspectral imaging | |
| Jian et al. | Hyperchromatic nucleus segmentation on breast histopathological images for mitosis detection | |
| US20160100789A1 (en) | Computer-aided diagnosis system and computer-aided diagnosis method | |
| CN108629780B (en) | Tongue image segmentation method based on color decomposition and threshold technology | |
| Lv et al. | Acquisition of fruit region in green apple image based on the combination of segmented regions | |
| Gupta et al. | Extracting regions of symmetry |
Legal Events
| Date | Code | Title | Description |
|---|---|---|---|
| PB01 | Publication | ||
| PB01 | Publication | ||
| SE01 | Entry into force of request for substantive examination | ||
| SE01 | Entry into force of request for substantive examination | ||
| GR01 | Patent grant | ||
| GR01 | Patent grant |