CN107203700B - Method and device based on continuous blood glucose monitoring - Google Patents
Method and device based on continuous blood glucose monitoringDownload PDFInfo
- Publication number
- CN107203700B CN107203700BCN201710574788.0ACN201710574788ACN107203700BCN 107203700 BCN107203700 BCN 107203700BCN 201710574788 ACN201710574788 ACN 201710574788ACN 107203700 BCN107203700 BCN 107203700B
- Authority
- CN
- China
- Prior art keywords
- data
- blood sugar
- blood
- sugar data
- blood glucose
- Prior art date
- Legal status (The legal status is an assumption and is not a legal conclusion. Google has not performed a legal analysis and makes no representation as to the accuracy of the status listed.)
- Expired - Fee Related
Links
Images


Landscapes
- Measurement Of The Respiration, Hearing Ability, Form, And Blood Characteristics Of Living Organisms (AREA)
- Investigating Or Analysing Biological Materials (AREA)
Abstract
Description
Translated fromChinese技术领域technical field
本发明实施例涉及血糖监测领域,尤其涉及一种基于连续血糖监测的方法及装置。Embodiments of the present invention relate to the field of blood glucose monitoring, and in particular, to a method and device based on continuous blood glucose monitoring.
背景技术Background technique
糖尿病是长期血糖水平波动超出正常范围(90-120mmol/L)之外的代谢病理状态,若管理不善将会导致严重的并发症。目前,糖尿病的治疗尚无有效方法,现有的血糖测量方法都需要频繁针刺取血进行血糖的自我监测,经常性地对患者进行针刺取血,会对患者造成生理上的疼痛与心理上的恐惧与抵触,甚至会引发感染,从而限制了血糖检测的频率。由于采集的血糖数据较少,使得很多数据分析方法无法使用。Diabetes mellitus is a metabolic pathological state with long-term fluctuations in blood glucose levels outside the normal range (90-120 mmol/L), which can lead to serious complications if not managed properly. At present, there is no effective method for the treatment of diabetes. The existing blood glucose measurement methods all require frequent acupuncture blood collection for self-monitoring of blood glucose. Frequent acupuncture blood collection for patients will cause physical pain and psychological pain to patients. Fear and resistance to the virus can even lead to infections, limiting the frequency of blood sugar testing. Due to the small amount of blood glucose data collected, many data analysis methods cannot be used.
CGM(Continuous Glucose Monitoring,连续血糖监测)技术的出现,为有效解决上述问题提供了可能,其中,最重要的是为通过数据分析方法实现血糖浓度预测提供了可能。具体地,CGM设备通过微创或无创方式实时采集患者的血糖浓度,并每隔较短时间间隔输出一个血糖数据,测得的连续血糖数据可以看作是一种时间序列,针对时间序列的预测算法中,最典型的便是机器学习算法,如ANN(Artificial Neural Network,人工神经网络),SVR(Support Vector Regression,支持向量机回归),RT(Regression Tree,回归树)等,应用上述机器学习算法对连续血糖时间序列进行预测,上述是建立在采集的血糖数据足够多的基础上实现的。但是,在实际应用中,由于很多患者使用CGM设备时间较短,导致采集的血糖数据量较少,因而,无法应用上述机器学习算法对其血糖浓度进行预测。The emergence of CGM (Continuous Glucose Monitoring, continuous blood glucose monitoring) technology provides the possibility to effectively solve the above problems, and the most important thing is to provide the possibility to realize the prediction of blood glucose concentration through data analysis methods. Specifically, the CGM device collects the blood glucose concentration of the patient in real time through a minimally invasive or non-invasive method, and outputs a blood glucose data at short time intervals. The measured continuous blood glucose data can be regarded as a time series, and the prediction of the time series Among the algorithms, the most typical ones are machine learning algorithms, such as ANN (Artificial Neural Network, artificial neural network), SVR (Support Vector Regression, support vector machine regression), RT (Regression Tree, regression tree), etc., the application of the above machine learning The algorithm predicts the continuous blood glucose time series, and the above is realized on the basis of sufficient blood glucose data collected. However, in practical applications, since many patients use the CGM device for a short time, the amount of blood glucose data collected is small, so the above-mentioned machine learning algorithm cannot be used to predict their blood glucose concentration.
针对上述问题,目前尚未提出有效的解决方案。For the above problems, no effective solution has been proposed yet.
发明内容SUMMARY OF THE INVENTION
本发明提供一种基于连续血糖监测的方法及装置,实现用群体血糖数据预测个体血糖数据。The present invention provides a method and device based on continuous blood glucose monitoring, which realizes the prediction of individual blood glucose data using group blood glucose data.
第一方面,本发明实施例提供了一种基于连续血糖监测的方法,包括:In a first aspect, an embodiment of the present invention provides a method based on continuous blood glucose monitoring, comprising:
获取至少两名用户的血糖数据,根据预设的数据拼接方法构成第一血糖数据矩阵,从第一血糖数据矩阵中获取多个第一血糖数据输入向量以及各第一血糖数据输入向量分别对应的输出数据;Obtain the blood sugar data of at least two users, form a first blood sugar data matrix according to a preset data splicing method, and obtain a plurality of first blood sugar data input vectors and the corresponding first blood sugar data input vectors from the first blood sugar data matrix. Output Data;
采用机器学习算法,根据所述多组第一血糖数据输入向量以及各第一血糖数据输入向量分别对应的输出数据,对预设的数学模型进行训练,得到血糖数据预测模型;Using a machine learning algorithm, a preset mathematical model is trained according to the multiple groups of first blood sugar data input vectors and the output data corresponding to each first blood sugar data input vector to obtain a blood sugar data prediction model;
获取一名待预测用户的已有血糖数据,根据预设的数据拼接方法构成第二血糖数据输入向量;Obtaining the existing blood sugar data of a user to be predicted, and forming a second blood sugar data input vector according to a preset data splicing method;
将所述第二血糖数据输入向量输入所述血糖数据预测模型,获取所述待预测用户的当前时刻之后的血糖数据的预测值。The second blood sugar data input vector is input into the blood sugar data prediction model, and the predicted value of the blood sugar data after the current moment of the user to be predicted is obtained.
第二方面,本发明实施例还提供了一种基于连续血糖监测的装置,包括:In a second aspect, an embodiment of the present invention also provides a device based on continuous blood glucose monitoring, including:
训练阶段血糖数据生成模块,用于获取至少两名用户的血糖数据,根据预设的数据拼接方法构成第一血糖数据矩阵,从第一血糖数据矩阵中获取多个第一血糖数据输入向量以及各第一血糖数据输入向量分别对应的输出数据;The blood sugar data generation module in the training stage is used to obtain the blood sugar data of at least two users, form a first blood sugar data matrix according to a preset data splicing method, and obtain a plurality of first blood sugar data input vectors and each of the first blood sugar data input vectors from the first blood sugar data matrix. output data corresponding to the first blood glucose data input vectors respectively;
血糖数据预测模型生成模块,用于采用机器学习算法,根据所述多组第一血糖数据输入向量以及各第一血糖数据输入向量分别对应的输出数据,对预设的数学模型进行训练,得到血糖数据预测模型;The blood sugar data prediction model generation module is used for using a machine learning algorithm to train a preset mathematical model according to the plurality of groups of first blood sugar data input vectors and the output data corresponding to each first blood sugar data input vector to obtain blood sugar data prediction model;
预测阶段血糖数据生成模块,用于获取一名待预测用户的已有血糖数据,根据预设的数据拼接方法构成第二血糖数据输入向量;The blood sugar data generation module in the prediction stage is used to obtain the existing blood sugar data of a user to be predicted, and form a second blood sugar data input vector according to a preset data splicing method;
血糖数据的预测值获取模块,用于将所述第二血糖数据输入向量输入所述血糖数据预测模型,获取所述待预测用户的当前时刻之后的血糖数据的预测值。A predicted value acquisition module of blood glucose data, configured to input the second blood glucose data input vector into the blood glucose data prediction model, and acquire the predicted value of the blood glucose data after the current moment of the user to be predicted.
本发明通过根据预设的数据拼接方法构建由多用户血糖数据构成的群体血糖数据,并基于上述群体血糖数据采用机器学习算法建立血糖数据预测模型,利用上述血糖预测模型预测待预测用户这一个体的血糖浓度,解决了由于个体采集的血糖数据量较少,无法应用上述机器学习算法对其血糖浓度进行预测问题,实现了用群体血糖数据预测个体血糖浓度。The present invention constructs group blood sugar data composed of multi-user blood sugar data according to a preset data splicing method, and uses a machine learning algorithm to establish a blood sugar data prediction model based on the group blood sugar data, and uses the above blood sugar prediction model to predict the individual to be predicted. It solves the problem that the above-mentioned machine learning algorithm cannot be used to predict its blood sugar concentration due to the small amount of blood sugar data collected by individuals, and realizes the use of group blood sugar data to predict individual blood sugar concentration.
附图说明Description of drawings
图1a是本发明实施例一中的一种基于连续血糖监测的方法的流程图;1a is a flowchart of a method based on continuous blood glucose monitoring in
图1b是本发明实施例一中的一种基于连续血糖监测的方法的流程图;Fig. 1b is a flow chart of a method based on continuous blood glucose monitoring according to the first embodiment of the present invention;
图1c是本发明实施例一中的一种基于连续血糖监测的方法的流程图;Fig. 1c is a flow chart of a method based on continuous blood glucose monitoring in the first embodiment of the present invention;
图2a是本发明实施例二中的一种基于连续血糖监测的装置的结构框图;Fig. 2a is a structural block diagram of a device based on continuous blood glucose monitoring according to the second embodiment of the present invention;
图2b是本发明实施例二中的训练阶段血糖数据生成模块的结构框图;Fig. 2b is the structural block diagram of the blood glucose data generation module in the training phase in the second embodiment of the present invention;
图2c是本发明实施例二中的预测阶段血糖数据生成模块的结构框图;Fig. 2c is the structural block diagram of the blood glucose data generation module in the prediction stage in the second embodiment of the present invention;
图3a是本发明实施例三中的一种基于连续血糖监测的LSTM网络算法训练阶段的流程图;Fig. 3a is a flow chart of the training phase of the LSTM network algorithm based on continuous blood glucose monitoring in the third embodiment of the present invention;
图3b是本发明实施例三中的一种基于连续血糖监测的LSTM网络算法预测阶段的流程图;Fig. 3b is a flow chart of the prediction stage of the LSTM network algorithm based on continuous blood glucose monitoring in the third embodiment of the present invention;
图3c是本发明实施例三中的预设的数据拼接方法示意图;3c is a schematic diagram of a preset data splicing method in
图3d是本发明实施例三中的LSTM网络算法结构示意图;3d is a schematic structural diagram of the LSTM network algorithm in
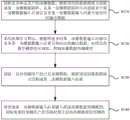
图3e是本发明实施例三中的PH=15分钟时三种方法的预测结果示意图;Fig. 3e is the prediction result schematic diagram of three methods when PH=15 minutes in the embodiment of the present invention three;
图3f是本发明实施例三中的PH=30分钟时三种方法的预测结果示意图;Figure 3f is a schematic diagram of the prediction results of three methods when PH=30 minutes in the third embodiment of the present invention;
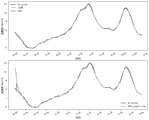
图3g是本发明实施例三中的PH=45分钟时三种方法的预测结果示意图;Fig. 3g is the prediction result schematic diagram of three kinds of methods when PH=45 minutes in the embodiment of the present invention three;
图3h是本发明实施例三中的PH=60分钟时三种方法的预测结果示意图;3h is a schematic diagram of the prediction results of the three methods when PH=60 minutes in the third embodiment of the present invention;
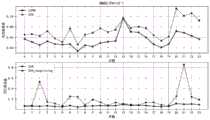
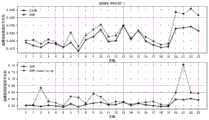
图3i是本发明实施例三中的PH=15分钟时三种方法24天预测结果的RMSE示意图;Fig. 3i is the RMSE schematic diagram of the 24-day prediction results of three methods when PH=15 minutes in the embodiment of the present invention;
图3j是本发明实施例三中的PH=30分钟时三种方法24天预测结果的RMSE示意图;Fig. 3j is the RMSE schematic diagram of three kinds of methods 24-day prediction results when PH=30 minutes in the embodiment of the present invention;
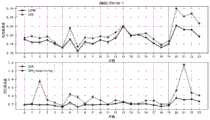
图3k是本发明实施例三中的PH=45分钟时三种方法24天预测结果的RMSE示意图;Fig. 3k is the RMSE schematic diagram of the 24-day prediction results of three methods when PH=45 minutes in the embodiment of the present invention;
图3l是本发明实施例三中的PH=60分钟时三种方法24天预测结果的RMSE示意图;Fig. 31 is the RMSE schematic diagram of three methods 24 days prediction result when PH=60 minutes in the embodiment of the present invention three;
图3m是本发明实施例三中的三种方法24天预测结果的平均RMSE随细分区间变化示意图;3m is a schematic diagram of the variation of the average RMSE of the 24-day prediction results of the three methods in the third embodiment of the present invention with the subdivision interval;
图3n是本发明实施例三中的PH=15分钟时三种方法24天预测结果的SSGPE示意图;Fig. 3n is the SSGPE schematic diagram of the 24-day prediction results of three methods when PH=15 minutes in the third embodiment of the present invention;
图3o是本发明实施例三中的PH=30分钟时三种方法24天预测结果的SSGPE示意图;Fig. 3 o is the SSGPE schematic diagram of the 24-day prediction result of three methods when PH=30 minutes in the embodiment of the present invention;
图3p是本发明实施例三中的PH=45分钟时三种方法24天预测结果的SSGPE示意图;Fig. 3p is the SSGPE schematic diagram of the 24-day prediction results of three methods when PH=45 minutes in the third embodiment of the present invention;
图3q是本发明实施例三中的PH=60分钟时三种方法24天预测结果的SSGPE示意图;Fig. 3 q is the SSGPE schematic diagram of the 24-day prediction result of three methods when PH=60 minutes in the third embodiment of the present invention;
图3r是本发明实施例三中的三种方法24天预测结果的平均SSGPE随细分区间变化示意图;3r is a schematic diagram of the variation of the average SSGPE with the subdivision interval of the 24-day prediction results of the three methods in the third embodiment of the present invention;
具体实施方式Detailed ways
下面结合附图和实施例对本发明作进一步的详细说明。可以理解的是,此处所描述的具体实施例仅仅用于解释本发明,而非对本发明的限定。另外还需要说明的是,为了便于描述,附图中仅示出了与本发明相关的部分而非全部结构。The present invention will be further described in detail below in conjunction with the accompanying drawings and embodiments. It should be understood that the specific embodiments described herein are only used to explain the present invention, but not to limit the present invention. In addition, it should be noted that, for the convenience of description, the drawings only show some but not all structures related to the present invention.
实施例一Example 1
图1a为本发明实施例一提供的一种基于连续血糖监测的方法的流程图,本实施例可适用于利用群体血糖数据预测个体血糖浓度情况,该方法可以由基于连续血糖监测的装置来执行,具体包括如下步骤:Fig. 1a is a flowchart of a method based on continuous blood glucose monitoring provided in the first embodiment of the present invention. This embodiment can be applied to predict the blood glucose concentration of an individual by using group blood glucose data, and the method can be executed by a device based on continuous blood glucose monitoring. , including the following steps:
步骤S110、获取至少两名用户的血糖数据,根据预设的数据拼接方法构成第一血糖数据矩阵,从第一血糖数据矩阵中获取多个第一血糖数据输入向量以及各第一血糖数据输入向量分别对应的输出数据。Step S110: Obtain blood sugar data of at least two users, form a first blood sugar data matrix according to a preset data splicing method, and obtain a plurality of first blood sugar data input vectors and each first blood sugar data input vector from the first blood sugar data matrix corresponding output data.
其中,用户的血糖数据可以通过使用CGM设备进行采集,所述CGM设备可以包括动态血糖仪,通过CGM采集的血糖数据一般设定每隔一段时间采集一次,因此,采集的血糖数据都是按照时间顺序排列的,随着时间的变化而变化,且所采集的数据和数据之间是互相关联的,满足时间序列的特点。数据按照时间的顺序进行采集,将采集的数据组成一个时间序列,主要展示的是数据在一段连续的时间内的动态变化,然后从中寻找数据变化的规律及未来可能发展的趋势。预测就是根据可以获得的数据利用一定的算法和思维对未来发展的趋势做出合理的推测。将跟时间有关的数据组成序列,进行预测的基本思路是:预测一类数据的变化趋势,采用历史数据的值来预测未来一段时间内的值,即通过对某一个现象的历史数据进行研究,进而发现数据随着时间变化的规律,然后运用这种规律对未来进行预测。预设的数据拼接方法为由多名用户的血糖数据构建群体血糖数据所依据的规则。Among them, the user's blood sugar data can be collected by using a CGM device, and the CGM device can include a dynamic blood glucose meter. The blood sugar data collected by the CGM is generally set to be collected at regular intervals. Therefore, the collected blood sugar data are based on time. It is arranged in sequence and changes with time, and the collected data and data are related to each other, which satisfies the characteristics of time series. The data is collected in the order of time, and the collected data is formed into a time series, which mainly shows the dynamic changes of the data in a continuous period of time, and then finds the law of data changes and the possible future development trends. Prediction is to use certain algorithms and thinking to make reasonable predictions about the future development trend based on the available data. The basic idea of forming a sequence of time-related data and making predictions is to predict the change trend of a type of data, and use the value of historical data to predict the value of a certain period of time in the future, that is, by studying the historical data of a certain phenomenon, Then find the law of data change over time, and then use this law to predict the future. The preset data splicing method is a rule on which group blood sugar data is constructed from blood sugar data of multiple users.
步骤S120、采用机器学习算法,根据所述多组第一血糖数据输入向量以及各第一血糖数据输入向量分别对应的输出数据,对预设的数学模型进行训练,得到血糖数据预测模型。Step S120, using a machine learning algorithm to train a preset mathematical model according to the plurality of groups of first blood sugar data input vectors and the output data corresponding to each first blood sugar data input vector to obtain a blood sugar data prediction model.
其中,机器学习算法的研究目的是使用计算机模拟人类的学习活动,它是研究计算机识别现有知识、获取新知识、不断改善性能和实现自身完善的方法,可以通过对已知数据学习来预测未知数据的结果。基于此,针对时间序列的预测算法中可以采用机器学习算法。机器学习算法包括但不限于LSTM(Long Short Term Memory,长短期记忆)网络算法,所述LSTM网络算法是一种特定形式的RNN(Recurrent Neural Network,循环神经网络)算法,RNN算法是一系列能够处理序列数据的神经网络的总称,LSTM网络算法在输入、反馈与防止梯度爆发之间建立了长时间的时滞。Among them, the research purpose of machine learning algorithms is to use computers to simulate human learning activities. It is a method for computers to identify existing knowledge, acquire new knowledge, continuously improve performance and achieve self-improvement. It can predict unknown by learning from known data. result of the data. Based on this, machine learning algorithms can be used in forecasting algorithms for time series. Machine learning algorithms include but are not limited to LSTM (Long Short Term Memory, Long Short Term Memory) network algorithms, the LSTM network algorithm is a specific form of RNN (Recurrent Neural Network, Recurrent Neural Network) algorithm, RNN algorithm is a series of An umbrella term for neural networks that process sequential data, the LSTM network algorithm establishes a long time lag between input, feedback, and preventing gradient bursts.
预设的数学模型为采用的相应的机器学习算法给出的,以多组第一血糖数据输入向量为输入变量输入预设的数学模型获取第一血糖数据输入向量分别对应的输出数据的预测值,通过第一血糖数据输入向量分别对应的输出数据和第一血糖数据输入向量分别对应的输出数据的预测值,对预设的数学模型进行训练生成血糖数据预测模型。示例性的,利用损失函数评价第一血糖数据输入向量分别对应的输出数据的预测值,并选用相应的优化器,通过多次迭代更新预测模型中的参数直到其收敛到最优值,对应最优值的模型为获取的血糖数据预测模型。The preset mathematical model is given by the corresponding machine learning algorithm adopted, and the preset mathematical model is input with multiple sets of first blood sugar data input vectors as input variables to obtain the predicted values of the output data corresponding to the first blood sugar data input vectors respectively. , using the output data corresponding to the first blood sugar data input vector and the predicted values of the output data corresponding to the first blood sugar data input vector respectively, train a preset mathematical model to generate a blood sugar data prediction model. Exemplarily, a loss function is used to evaluate the predicted value of the output data corresponding to the first blood glucose data input vector, and a corresponding optimizer is selected to update the parameters in the prediction model through multiple iterations until it converges to an optimal value, corresponding to the most optimal value. The model of figure of merit is a prediction model of the acquired blood glucose data.
步骤S130、获取一名待预测用户的已有血糖数据,根据预设的数据拼接方法构成第二血糖数据输入向量。Step S130: Obtain the existing blood sugar data of a user to be predicted, and form a second blood sugar data input vector according to a preset data splicing method.
步骤S140、将所述第二血糖数据输入向量输入所述血糖数据预测模型,获取所述待预测用户的当前时刻之后的血糖数据的预测值。Step S140: Input the second blood sugar data input vector into the blood sugar data prediction model, and obtain the predicted value of the blood sugar data after the current time of the user to be predicted.
其中,当前时刻之后可以为当天的当前时刻之后的任一时刻。Wherein, the time after the current time may be any time after the current time of the day.
具体地,如图1b所示,步骤S110包括如下步骤:Specifically, as shown in FIG. 1b, step S110 includes the following steps:
步骤S111、将获取的至少两名用户的血糖数据,按照采集时间周期排列构成所述第一血糖数据矩阵,其中,所述第一血糖数据矩阵中的一个行向量包括一名用户在一个采集时间周期内的血糖数据,一名用户在一个采集时间周期内的血糖数据通过每隔i时间采集一次的方式获取并按照时间先后顺序依次排列。Step S111: Arrange the acquired blood sugar data of at least two users according to the collection time period to form the first blood sugar data matrix, wherein a row vector in the first blood sugar data matrix includes a user at a collection time. For the blood glucose data in a period, the blood glucose data of a user in a collection time period is acquired by collecting once every i time and arranged in chronological order.
其中,采集时间周期为一天,每名用户的血糖数据可以为获取的一天的血糖数据,也可以为获取的多天的血糖数据,根据实际情况设定,并不作具体限定。第一血糖数据矩阵由多个行向量构成,其中,每个行向量由一名用户在一天内按照采集血糖数据的时间先后顺序依次排列构成。The collection time period is one day, and the blood sugar data of each user can be the obtained blood sugar data of one day or the obtained blood sugar data of multiple days, which is set according to the actual situation and is not specifically limited. The first blood sugar data matrix is composed of a plurality of row vectors, wherein each row vector is composed of a user arranged in sequence according to the time sequence of collecting blood sugar data in one day.
步骤S112、根据设定时刻的血糖数据及设定时刻以前的t个血糖数据影响设定时刻以后的血糖数据,针对所述第一血糖数据矩阵中的每个行向量,提取当前行向量中设定时刻的血糖数据及设定时刻以前的t个血糖数据构成所述第一血糖数据输入向量,并提取当前行向量中设定时刻以后的第p个血糖数据作为所述第一血糖数据输入向量对应的输出数据。Step S112, according to the blood sugar data at the set time and the t blood sugar data before the set time that affect the blood sugar data after the set time, for each row vector in the first blood sugar data matrix, extract the set in the current row vector. The blood sugar data at a fixed time and the t blood sugar data before the set time constitute the first blood sugar data input vector, and the p-th blood sugar data after the set time in the current row vector is extracted as the first blood sugar data input vector corresponding output data.
其中,第一血糖数据输入向量对应的输出数据用于对预设的数学模型进行训练生成血糖数据预测模型,示例性的,设定每名用户每天采集的血糖数据总个数为N,设定时刻的血糖数据为采集的第j个血糖数据,则t∈(1,j),p∈[1,N-j],j∈(1,N)。The output data corresponding to the first blood sugar data input vector is used to train a preset mathematical model to generate a blood sugar data prediction model. Exemplarily, the total number of blood sugar data collected by each user per day is set as N, and set The blood glucose data at the moment is the jth blood glucose data collected, then t∈(1,j), p∈[1,N-j], j∈(1,N).
进一步地,第一血糖数据输入向量包括的血糖数据和第一血糖数据输入向量对应的输出数据为获取的同一天的血糖数据,即当天的血糖数据只用来预测当天的血糖浓度。Further, the blood sugar data included in the first blood sugar data input vector and the output data corresponding to the first blood sugar data input vector are obtained blood sugar data of the same day, that is, the blood sugar data of the day is only used to predict the blood sugar concentration of the day.
具体地,如图1c所示,步骤S130包括如下步骤:Specifically, as shown in FIG. 1c, step S130 includes the following steps:
步骤S131、提取在当前采集时间周期内采集的待预测用户的当前时刻的血糖数据和当前时刻之前的t个血糖数据,构成第二血糖数据输入向量。Step S131 , extracting the blood glucose data of the user to be predicted at the current moment and the t blood glucose data before the current moment collected in the current collection time period to form a second blood glucose data input vector.
其中,采用和步骤S111中采集血糖数据的相同的方式,采集待预测用户的当前时刻的血糖数据和当前时刻之前的t个血糖数据,即每隔i时间采集一次。第二血糖数据输入向量由上述血糖数据按照时间先后顺序依次排列构成。此外,本步骤与步骤S112中所述t相同。The blood sugar data of the user to be predicted at the current moment and the t blood sugar data before the current moment are collected in the same manner as the blood sugar data collected in step S111, that is, collected every i time. The second input vector of blood glucose data is formed by the above-mentioned blood glucose data arranged in chronological order. In addition, this step is the same as t described in step S112.
其中,步骤S110、步骤S120构成采用机器学习算法进行血糖数据预测的训练阶段,训练阶段的目的在于生成血糖数据预测模型,为预测阶段提供模型基础。同时,建立上述阶段的数据基础是基于预设的数据拼接方法将多名用户的血糖数据构成的群体血糖数据。Wherein, step S110 and step S120 constitute a training phase of using machine learning algorithm to predict blood glucose data. The purpose of the training phase is to generate a blood glucose data prediction model and provide a model basis for the prediction phase. At the same time, the data base for establishing the above-mentioned stages is the group blood sugar data formed by the blood sugar data of multiple users based on the preset data splicing method.
其中,步骤S130、步骤S140构成采用机器学习算法进行血糖数据预测的预测阶段,预测阶段的目的在于利用获取的血糖数据预测模型对一名用户的血糖浓度进行预测。Wherein, steps S130 and S140 constitute a prediction stage of using a machine learning algorithm to predict blood sugar data, and the purpose of the prediction stage is to predict the blood sugar concentration of a user by using the obtained blood sugar data prediction model.
本实施例的技术方案,通过根据预设的数据拼接方法构建由多用户血糖数据构成的群体血糖数据,并基于上述群体血糖数据采用机器学习算法建立血糖数据预测模型,利用上述血糖预测模型预测待预测用户这一个体的血糖浓度,解决了由于个体采集的血糖数据量较少,无法应用上述机器学习算法对其血糖浓度进行预测问题,实现了用群体血糖数据预测个体血糖浓度。The technical solution of this embodiment is to construct group blood glucose data composed of multi-user blood glucose data according to a preset data splicing method, and based on the above group blood glucose data, a machine learning algorithm is used to establish a blood glucose data prediction model, and the above blood glucose prediction model is used to predict the pending blood glucose data. Predicting the blood sugar concentration of the individual user solves the problem that the above-mentioned machine learning algorithm cannot be used to predict the blood sugar concentration of the individual due to the small amount of blood sugar data collected by the individual, and realizes the prediction of the individual blood sugar concentration by using the group blood sugar data.
实施例二
图2a为本发明实施例三提供的一种基于连续血糖监测的装置的结构框图,本实施例可适用于利用群体血糖数据预测个体血糖浓度情况,该装置具体包括:Fig. 2a is a structural block diagram of a device based on continuous blood glucose monitoring provided by the third embodiment of the present invention. This embodiment can be applied to predict the blood glucose concentration of an individual by using group blood glucose data. The device specifically includes:
训练阶段血糖数据生成模块210,用于获取至少两名用户的血糖数据,根据预设的数据拼接方法构成第一血糖数据矩阵,从第一血糖数据矩阵中获取多个第一血糖数据输入向量以及各第一血糖数据输入向量分别对应的输出数据。The blood sugar
血糖数据预测模型生成模块220,用于采用机器学习算法,根据所述多组第一血糖数据输入向量以及各第一血糖数据输入向量分别对应的输出数据,对预设的数学模型进行训练,得到血糖数据预测模型。The blood sugar data prediction
预测阶段血糖数据生成模块230,用于获取一名待预测用户的已有血糖数据,根据预设的数据拼接方法构成第二血糖数据输入向量。The blood sugar
血糖数据的预测值获取模块240,用于将所述第二血糖数据输入向量输入所述血糖数据预测模型,获取所述待预测用户的当前时刻之后的血糖数据的预测值。The predicted
具体地,如图2b所示,训练阶段血糖数据生成模块210,包括:Specifically, as shown in Figure 2b, the blood glucose
第一血糖数据矩阵生成模块211,用于将获取的至少两名用户的血糖数据,按照采集时间周期排列构成所述第一血糖数据矩阵,其中,所述第一血糖数据矩阵中的一个行向量包括一名用户在一个采集时间周期内的血糖数据,一名用户在一个采集时间周期内的血糖数据通过每隔i时间采集一次的方式获取并按照时间先后顺序依次排列。The first blood sugar data
第一血糖数据输入向量及对应的输出数据生成模块212,用于根据设定时刻的血糖数据及设定时刻以前的t个血糖数据影响设定时刻以后的血糖数据,针对所述第一血糖数据矩阵中的每个行向量,提取当前行向量中设定时刻的血糖数据及设定时刻以前的t个血糖数据构成所述第一血糖数据输入向量,并提取当前行向量中设定时刻以后的第p个血糖数据作为所述第一血糖数据输入向量对应的输出数据。The first blood sugar data input vector and the corresponding output
具体地,如图2c所示,预测阶段血糖数据生成模块230,包括:Specifically, as shown in Figure 2c, the blood glucose
第二血糖数据输入向量生成模块231,用于提取在当前采集时间周期内采集的所述待预测用户的当前时刻的血糖数据和当前时刻之前的t个血糖数据,构成所述第二血糖数据输入向量。The second blood sugar data input
其中,训练阶段血糖数据生成模块210、血糖数据预测模型生成模块220用于构成采用机器学习算法进行血糖数据预测的训练阶段,训练阶段的目的在于生成血糖数据预测模型,为预测阶段提供模型基础。同时,建立上述阶段的数据基础是基于预设的数据拼接方法将多名用户的血糖数据构成的群体血糖数据。Among them, the blood glucose
其中,预测阶段血糖数据生成模块230、血糖数据的预测值获取模块240用于构成采用机器学习算法进行血糖数据预测的预测阶段,预测阶段的目的在于利用获取的血糖数据预测模型对一名用户的血糖数据进行预测。Among them, the blood glucose
本实施例的技术方案,通过根据预设的数据拼接方法构建由多用户血糖数据构成的群体血糖数据,并基于上述群体血糖数据采用机器学习算法建立血糖数据预测模型,利用上述血糖预测模型预测待预测用户这一个体的血糖浓度,解决了由于个体采集的血糖数据量较少,无法应用上述机器学习算法对其血糖浓度进行预测问题,实现了用群体血糖数据预测个体血糖浓度。The technical solution of this embodiment is to construct group blood glucose data composed of multi-user blood glucose data according to a preset data splicing method, and based on the above group blood glucose data, a machine learning algorithm is used to establish a blood glucose data prediction model, and the above blood glucose prediction model is used to predict the pending blood glucose data. Predicting the blood sugar concentration of the individual user solves the problem that the above-mentioned machine learning algorithm cannot be used to predict the blood sugar concentration of the individual due to the small amount of blood sugar data collected by the individual, and realizes the prediction of the individual blood sugar concentration by using the group blood sugar data.
实施例三
本实施例为优选实施例,本实施例提供一种基于连续血糖监测的LSTM算法实现群体血糖数据预测个体血糖数据。图3a、图3b分别是本发明实施例四提供的一种基于连续血糖监测的LSTM网络算法训练阶段、预测阶段的流程图。该方法可以由基于连续血糖监测的装置来执行,该方法具体包括如下步骤:This embodiment is a preferred embodiment, and this embodiment provides an LSTM algorithm based on continuous blood glucose monitoring to realize group blood glucose data prediction of individual blood glucose data. 3a and 3b are flowcharts of a training phase and a prediction phase of an LSTM network algorithm based on continuous blood glucose monitoring according to Embodiment 4 of the present invention, respectively. The method can be performed by a device based on continuous blood glucose monitoring, and the method specifically includes the following steps:
步骤S310、将CGM设备采集的多名用户的血糖数据按天排列成矩阵D。Step S310: Arrange the blood glucose data of multiple users collected by the CGM device into a matrix D by day.
步骤S320、根据预设的数据拼接方法得到输入矩阵Din和输出矩阵Dout。Step S320: Obtain an input matrix Din and an output matrix Dout according to a preset data splicing method.
其中,CGM设备可以实时采集用户的血糖数据,并每隔i时间输出一个血糖值,采集完的数据按照天进行保存,不足一天的数据做丢弃处理,共采集到M天的血糖数据,每天采集数据N个。Among them, the CGM device can collect the user's blood sugar data in real time, and output a blood sugar value every i time. The collected data is saved according to the day, and the data less than one day is discarded. A total of M days of blood sugar data are collected, and the data is collected every day. data N.
如图3c所示,给出了预设的数据拼接方法示意图,具体地,将获取的多名用户的血糖数据,按照采集时间周期排列构成血糖数据矩阵
根据设定时刻的血糖数据及设定时刻以前的t个血糖数据影响设定时刻以后的血糖数据,针对D中的每个行向量,提取当前行向量中设定时刻的血糖数据及设定时刻以前的t个血糖数据构成输入矩阵

步骤S330、将Din按行向量输入LSTM网络输入层获取LSTM层输出hLSTM,并将LSTM层输出hLSTM输入到输出层获取模型输出hout。Step S330 , input Din into the input layer of the LSTM network as a row vector to obtain the LSTM layer output hLSTM , and input the LSTM layer output hLSTM to the output layer to obtain the model output hout .
其中,如图3d,给出了LSTM网络算法结构示意图,LSTM网络算法分为输入层、LSTM层以及输出层。Among them, as shown in Figure 3d, a schematic diagram of the structure of the LSTM network algorithm is given. The LSTM network algorithm is divided into an input layer, an LSTM layer and an output layer.
Din按行向量表示为Dm=[Dm,1,L,Dm,t-1,Dm,t],将其输入LSTM网络输入层得到LSTM层输出hLSTM=fLSTM(Dm),其中,fLSTM为LSTM网络对输入行向量Dm进行的函数操作。Din is represented by a row vector as Dm =[Dm,1 ,L,Dm,t-1 ,Dm,t ], input it into the LSTM network input layer to get the LSTM layer output hLSTM =fLSTM (Dm ), where fLSTM is the function operation performed by the LSTM network on the input row vector Dm .
将LSTM层输出hLSTM输入到输出层,得到模型输出hout=fout(hLSTM),其中,fout为输出层的激活函数,示例性的,选用线性激活函数,即f(x)=kx+c。The LSTM layer output hLSTM is input to the output layer, and the model output hout =fout (hLSTM ) is obtained, where fout is the activation function of the output layer, exemplarily, a linear activation function is selected, that is, f(x)= kx+c.
步骤S340、迭代更新模型参数。Step S340, iteratively update the model parameters.
步骤S350、输出LSTM网络模型。Step S350, output the LSTM network model.
其中,选用相应的损失函数计算模型输出hout与真实输出Dout之间的代价,并选用相应的优化器通过多次迭代更新模型输出参数直到其收敛到最优值,根据收敛到最优值的模型参数确定的模型输出即为LSTM网络模型,也为血糖数据预测模型。示例性的,选用的损失函数为MSE(Mean Squared Error,均方误差),选用的优化器为Adam优化器。Among them, the corresponding loss function is selected to calculate the cost between the model output hout and the real output Dout , and the corresponding optimizer is selected to update the model output parameters through multiple iterations until it converges to the optimal value. The model output determined by the model parameters is the LSTM network model and the blood glucose data prediction model. Exemplarily, the selected loss function is MSE (Mean Squared Error, mean squared error), and the selected optimizer is the Adam optimizer.
上述步骤S310-步骤S350为基于连续血糖监测的LSTM网络算法训练阶段,根据预设的数据拼接方法构建群体血糖数据,基于此,采用LSTM网络算法构建血糖数据预测模型。The above steps S310 to S350 are the training stage of the LSTM network algorithm based on continuous blood glucose monitoring, and the group blood glucose data is constructed according to the preset data splicing method. Based on this, the LSTM network algorithm is used to construct the blood glucose data prediction model.
在步骤S350之后,该方法还包括:After step S350, the method further includes:
步骤S360、将CGM设备采集的一名待预测用户的血糖数据按照预设的数据拼接方法组成输入向量Sm。Step S360 , the blood glucose data of a user to be predicted collected by the CGM device is formed into an input vector Sm according to a preset data splicing method.
其中,按照设定的t个血糖数据组成输入向量Sm=[Sm,1,L,Sm,t-1,Sm,t]。The input vector Sm =[Sm,1 ,L,Sm,t-1 ,Sm,t ] is formed according to the set t blood glucose data.
步骤S370、将输入向量Sm输入训练好的LSTM网络模型。Step S370: Input the input vector Sm into the trained LSTM network model.
步骤S380、获取待预测用户的当前时刻之后的血糖数据。Step S380: Acquire blood glucose data after the current time of the user to be predicted.
其中,将输入向量Sm输入训练好的LSTM网络模型得到hLSTM=fLSTM(Sm),hout=fout(hLSTM),根据设定的p,获取当前时刻之后的第p个血糖数据,其中,p根据实际情况设定,不作具体限定。Among them, input the input vector Sm into the trained LSTM network model to obtain hLSTM =fLSTM (Sm ), hout =fout (hLSTM ), and obtain the p-th blood sugar after the current moment according to the set p data, where p is set according to the actual situation and is not specifically limited.
上述步骤S360-步骤S380为基于连续血糖监测的LSTM网络算法预测阶段,根据训练阶段得到的LSTM网络模型和相应的单名用户的输入依次计算对应的预测血糖数据。The above steps S360 to S380 are the prediction stage of the LSTM network algorithm based on continuous blood glucose monitoring, and the corresponding predicted blood sugar data are sequentially calculated according to the LSTM network model obtained in the training stage and the input of the corresponding single-named user.
示例性的,i=3min,M=120,N=480,t=10,p分别为5、10、15及20,80%的数据作为训练数据,20%的数据作为预测数据。由于采集血糖数据的间隔为3分钟,因此,可以将当前时刻之后的第p个血糖数据中的p换算成时间,并用PH(Prediction Horizon,预测范围)表示,相应的PH分别为15分钟、30分钟、45分钟及60分钟。由于CGM设备直接采集到的数据包含有一定误差,导致采集到的血糖数据有一定的随机波动,这种带抖动的原始的血糖数据将会对算法的精度带来一定的影响,因此,需要对原始血糖数据进行预处理。本实施例选用卡尔曼滤波算法进行预处理。Exemplarily, i=3min, M=120, N=480, t=10, p is 5, 10, 15 and 20, respectively, 80% of the data is used as training data, and 20% of the data is used as prediction data. Since the interval for collecting blood sugar data is 3 minutes, p in the p-th blood sugar data after the current moment can be converted into time, and expressed by PH (Prediction Horizon, prediction range), the corresponding PH are 15 minutes, 30 minutes, 45 minutes and 60 minutes. Because the data directly collected by the CGM equipment contains certain errors, the collected blood glucose data has certain random fluctuations. This jittered original blood glucose data will have a certain impact on the accuracy of the algorithm. Therefore, it is necessary to The raw blood glucose data is preprocessed. In this embodiment, a Kalman filter algorithm is used for preprocessing.
下面从定性和定量两方面对基于预设的数据拼接方法的LSTM网络算法的性能及预测精度进行分析。同时,比较其与基于预设的数据拼接方法的SVR算法及SVR算法性能优劣,其中,采用RMSE(Root Mean Square Error,均方差)和SSGPE(Sum of Squares ofGlucose Prediction Error,血糖预测误差的平方和)作为定量分析的评价指标,其中,


具体地,针对定性分析,选取的一名待预测用户的血糖数据,图3e和图3f分别为PH=15分钟和PH=30分钟时的预测结果。从图中可以看出,基于预设的数据拼接方法的LSTM网络算法和SVR算法预测的血糖数据的变化趋势与用户真实血糖数据变化趋势大体一致,相较而言,基于预设的数据拼接方法的LSTM网络算法的预测值与真实值更接近,且从预测的血糖数据变化趋势可以看出,基于预设的数据拼接方法的SVR算法的时延比基于预设的数据拼接方法的LSTM网络算法更明显。对于具体血糖数据的预测,两种方法预测的血糖数据与用户真实血糖数据也大体相同,当用户真实血糖数据变化出现拐点时,预测的血糖数据便会在拐点处随机波动,但是波动幅度不大。总体来看,基于预设的数据拼接方法的LSTM网络算法性能更好。Specifically, for qualitative analysis, blood glucose data of a selected user to be predicted, Figure 3e and Figure 3f are the prediction results when PH=15 minutes and PH=30 minutes, respectively. As can be seen from the figure, the change trend of blood glucose data predicted by the LSTM network algorithm and the SVR algorithm based on the preset data splicing method is generally consistent with the change trend of the user's real blood glucose data. The predicted value of the LSTM network algorithm is closer to the real value, and it can be seen from the change trend of the predicted blood glucose data that the delay of the SVR algorithm based on the preset data splicing method is longer than that of the LSTM network algorithm based on the preset data splicing method. more obvious. For the prediction of specific blood sugar data, the blood sugar data predicted by the two methods is roughly the same as the user's real blood sugar data. When the user's real blood sugar data changes at an inflection point, the predicted blood sugar data will fluctuate randomly at the inflection point, but the fluctuation range is not large. . Overall, the performance of the LSTM network algorithm based on the preset data stitching method is better.
图3g和图3h分别为PH=45分钟和PH=60分钟时的预测结果。从图中可以看出,基于预设的数据拼接方法的LSTM网络算法和SVR算法预测的血糖数据的变化趋势与用户真实血糖数据变化趋势大体一致,相较而言,基于预设的数据拼接方法的LSTM网络算法的预测值与真实值更接近,且从预测的血糖数据变化趋势可以看出,基于预设的数据拼接方法的SVR算法的时延比基于预设的数据拼接方法的LSTM网络算法更明显,此外,趋势的拟合程度比PH=15分钟和PH=30分钟时较差。对于具体血糖数据的预测,两种方法预测的血糖数据与用户真实血糖数据也大体相同,当用户真实血糖数据变化出现拐点时,预测的血糖数据便会在拐点处随机波动,波动幅度比PH=15分钟和PH=30分钟时更大。总体来看,基于预设的数据拼接方法的LSTM网络算法性能更好。Figure 3g and Figure 3h are the prediction results at pH=45 minutes and pH=60 minutes, respectively. As can be seen from the figure, the change trend of blood glucose data predicted by the LSTM network algorithm and the SVR algorithm based on the preset data splicing method is generally consistent with the change trend of the user's real blood glucose data. The predicted value of the LSTM network algorithm is closer to the real value, and it can be seen from the change trend of the predicted blood glucose data that the delay of the SVR algorithm based on the preset data splicing method is longer than that of the LSTM network algorithm based on the preset data splicing method. It is more obvious, in addition, that the fit of the trend is poorer than at PH=15 min and PH=30 min. For the prediction of specific blood sugar data, the blood sugar data predicted by the two methods is roughly the same as the user's real blood sugar data. When the user's real blood sugar data changes at an inflection point, the predicted blood sugar data will fluctuate randomly at the inflection point, and the fluctuation range is greater than PH= Greater at 15 minutes and pH=30 minutes. Overall, the performance of the LSTM network algorithm based on the preset data stitching method is better.
同时,从图中可以看出,PH=15分钟、30分钟、45分钟及60分钟时,SVR算法与基于预设的数据拼接方法的SVR算法预测的血糖数据变化趋势相比,SVR算法预测结果的初始时间段,呈现很强的波动性,预测误差较大,随着时间的推移,预测结果与基于预设的数据拼接方法的SVR算法的预测结果相近。At the same time, it can be seen from the figure that when PH=15 minutes, 30 minutes, 45 minutes and 60 minutes, the SVR algorithm predicts the blood glucose data change trend compared with the SVR algorithm based on the preset data splicing method, and the SVR algorithm predicts the results. The initial time period of the data shows strong volatility and large prediction errors. As time goes by, the prediction results are similar to the prediction results of the SVR algorithm based on the preset data splicing method.
针对定量分析,具体从RMSE和SSGPE两方面进行分析。For quantitative analysis, the analysis is carried out from two aspects of RMSE and SSGPE.
从RMSE方面分析,图3i-图3l分别为PH=15分钟、30分钟、45分钟及60分钟时基于预设的数据拼接方法的LSTM网络算法、基于预设的数据拼接方法的SVR算法及SVR算法24天预测结果的RMSE。从图中可以看出,对于基于预设的数据拼接方法的LSTM网络算法和SVR算法,当PH=15分钟和30分钟时,采用LSTM网络算法24天的预测结果全部优于SVR算法的预测结果;当PH=45分钟时,采用LSTM网络算法24天的预测结果中超过90%的天数都优于SVR算法的预测结果;当PH=60分钟时,采用LSTM网络算法24天的预测结果中将近90%的天数都优于SVR算法的预测结果。而当PH=15分钟、30分钟、45分钟及60分钟时,采用SVR算法预测结果的RMSE值比基于预设的数据拼接方法的LSTM网络算法和SVR算法的RMSE值高出很多。为更加直观的比较三种算法性能优劣,表1给出了三种方法24天预测结果的RMSE细分统计结果。From the analysis of RMSE, Fig. 3i-Fig. 3l are respectively the LSTM network algorithm based on the preset data splicing method, the SVR algorithm and SVR based on the preset data splicing method when PH=15 minutes, 30 minutes, 45 minutes and 60 minutes. The RMSE of the algorithm's 24-day prediction results. As can be seen from the figure, for the LSTM network algorithm and the SVR algorithm based on the preset data splicing method, when PH=15 minutes and 30 minutes, the prediction results of the LSTM network algorithm for 24 days are all better than the prediction results of the SVR algorithm. ; When PH=45 minutes, more than 90% of the 24-day prediction results using the LSTM network algorithm are better than those of the SVR algorithm; when PH=60 minutes, the 24-day prediction results using the LSTM network algorithm are nearly 90% of the days are better than the predictions of the SVR algorithm. When PH = 15 minutes, 30 minutes, 45 minutes and 60 minutes, the RMSE value of the prediction result using the SVR algorithm is much higher than that of the LSTM network algorithm and the SVR algorithm based on the preset data splicing method. In order to compare the performance of the three algorithms more intuitively, Table 1 presents the RMSE subdivision statistics of the 24-day prediction results of the three methods.
表1 三种方法24天预测结果的RMSE细分统计Table 1 RMSE breakdown statistics of the 24-day forecast results of the three methods


从表1中可以看出,对于基于预设的数据拼接方法的LSTM网络算法和SVR算法,当PH=15分钟和30分钟时,采用LSTM网络算法24天的预测结果与SVR算法相比,大多数处于更小的细分区间;当PH=45分钟时,采用LSTM网络算法24天的预测结果与SVR算法相比,依旧有更多的天数处于更小的细分区间;当PH=60分钟时,采用LSTM网络算法24天的预测结果与SVR算法相比,细分区间的分布大体相同,但是LSTM网络算法依旧更具有优势。而当PH=15分钟、30分钟、45分钟及60分钟时,采用SVR算法预测结果的RMSE值相比于基于预设的数据拼接方法的LSTM网络算法和SVR算法的RMSE值的区间分布,有更多的天数处于更大的细分区间。As can be seen from Table 1, for the LSTM network algorithm and the SVR algorithm based on the preset data splicing method, when PH=15 minutes and 30 minutes, the prediction results of using the LSTM network algorithm for 24 days are larger than those of the SVR algorithm. Most of them are in smaller subdivisions; when PH=45 minutes, the 24-day prediction results using the LSTM network algorithm still have more days in smaller subdivisions than the SVR algorithm; when PH=60 minutes Compared with the SVR algorithm, the 24-day prediction results using the LSTM network algorithm have roughly the same distribution of subdivision intervals, but the LSTM network algorithm still has more advantages. When PH=15 minutes, 30 minutes, 45 minutes and 60 minutes, the RMSE value of the prediction result using the SVR algorithm is compared with the interval distribution of the RMSE value of the LSTM network algorithm and the SVR algorithm based on the preset data splicing method. More days are in larger segments.
进一步地,图3m给出了三种方法24天预测结果的平均RMSE随细分区间变化情况。从图中可以看出,无论细分区间的大小,采用基于预设的数据拼接方法的LSTM网络算法的预测结果都明显优于采用基于预设的数据拼接方法的SVR算法的预测结果,SVR算法的预测结果最差。Further, Fig. 3m shows the variation of the average RMSE of the 24-day prediction results of the three methods with the subdivision interval. It can be seen from the figure that regardless of the size of the subdivision interval, the prediction results of the LSTM network algorithm based on the preset data splicing method are obviously better than the prediction results of the SVR algorithm based on the preset data splicing method. the worst forecast.
从SSGPE方面分析,图3n-图3q分别为PH=15分钟、30分钟、45分钟及60分钟时基于预设的数据拼接方法的LSTM网络算法、基于预设的数据拼接方法的SVR算法及SVR算法24天预测结果的SSGPE。从图中可以看出,对于基于预设的数据拼接方法的LSTM网络算法和SVR算法,当PH=15分钟时,采用LSTM网络算法24天的预测结果全部优于SVR算法的预测结果;当PH=30分钟和45分钟时,采用LSTM网络算法24天的预测结果中超过95%的天数都优于SVR算法的预测结果;当PH=60分钟时,采用LSTM网络算法24天的预测结果中将近90%的天数都优于SVR算法的预测结果。而当PH=15分钟、30分钟、45分钟及60分钟时,采用SVR算法预测结果的SSGPE值比基于预设的数据拼接方法的LSTM网络算法和SVR算法的SSGPE值高出很多。为更加直观的比较三种算法性能优劣,表2给出了三种方法24天预测结果的SSGPE细分统计结果。From the perspective of SSGPE, Figure 3n-Figure 3q are the LSTM network algorithm based on the preset data splicing method, the SVR algorithm and SVR based on the preset data splicing method when PH=15 minutes, 30 minutes, 45 minutes and 60 minutes respectively. The SSGPE of the algorithm's 24-day prediction results. As can be seen from the figure, for the LSTM network algorithm and the SVR algorithm based on the preset data splicing method, when PH=15 minutes, the prediction results of the LSTM network algorithm for 24 days are all better than the prediction results of the SVR algorithm; When PH = 30 minutes and 45 minutes, more than 95% of the 24-day prediction results using the LSTM network algorithm are better than the prediction results of the SVR algorithm; when PH = 60 minutes, nearly 95% of the 24-day prediction results using the LSTM network algorithm are used. 90% of the days are better than the predictions of the SVR algorithm. When PH=15 minutes, 30 minutes, 45 minutes and 60 minutes, the SSGPE value of the predicted result using the SVR algorithm is much higher than that of the LSTM network algorithm and the SVR algorithm based on the preset data splicing method. In order to compare the performance of the three algorithms more intuitively, Table 2 presents the SSGPE subdivision statistics of the 24-day prediction results of the three methods.
表2 三种方法24天预测结果的SSGPE细分统计Table 2 SSGPE subdivision statistics of the 24-day forecast results of the three methods

从表2中可以看出,对于基于预设的数据拼接方法的LSTM网络算法和SVR算法,当PH=15分钟和30分钟时,采用LSTM网络算法24天的预测结果与SVR算法相比,大多数处于更小的细分区间;当PH=45和60分钟时,采用LSTM网络算法24天的预测结果与SVR算法相比,依旧有更多的天数处于更小的细分区间。而当PH=15分钟、30分钟、45分钟及60分钟时,采用SVR算法预测结果的RMSE值相比于基于预设的数据拼接方法的LSTM网络算法和SVR算法的RMSE值的区间分布,有更多的天数处于更大的细分区间。As can be seen from Table 2, for the LSTM network algorithm and SVR algorithm based on the preset data splicing method, when PH=15 minutes and 30 minutes, the prediction results of using the LSTM network algorithm for 24 days are larger than those of the SVR algorithm. Most of them are in smaller subdivision intervals; when PH=45 and 60 minutes, the 24-day prediction results using the LSTM network algorithm still have more days in the smaller subdivision interval compared with the SVR algorithm. When PH=15 minutes, 30 minutes, 45 minutes and 60 minutes, the RMSE value of the prediction result using the SVR algorithm is compared with the interval distribution of the RMSE value of the LSTM network algorithm and the SVR algorithm based on the preset data splicing method. More days are in larger segments.
进一步地,图3r给出了三种方法24天预测结果的平均SSGPE随细分区间变化情况。从图中可以看出,无论细分区间的大小,采用基于预设的数据拼接方法的LSTM网络算法的预测结果都明显优于采用基于预设的数据拼接方法的SVR算法的预测结果,SVR算法的预测结果最差。Further, Fig. 3r shows the variation of the average SSGPE of the 24-day prediction results of the three methods with the subdivision interval. It can be seen from the figure that regardless of the size of the subdivision interval, the prediction results of the LSTM network algorithm based on the preset data splicing method are obviously better than the prediction results of the SVR algorithm based on the preset data splicing method. the worst forecast.
本实施例的技术方案,通过根据预设的数据拼接方法构建由多用户血糖数据构成的群体血糖数据,并基于上述群体血糖数据采用LSTM网络算法建立血糖数据预测模型,利用上述血糖预测模型预测待预测用户这一个体的血糖浓度,解决了由于个体采集的血糖数据量较少,无法应用上述机器学习算法对其血糖浓度进行预测问题,实现了用群体血糖数据预测个体血糖浓度。同时,相比于基于预设的数据拼接方法的SVR算法和SVR算法,基于预设的数据拼接方法的SVR算法的预测精度更高,性能更好。In the technical solution of this embodiment, a group blood sugar data composed of multi-user blood sugar data is constructed according to a preset data splicing method, and a blood sugar data prediction model is established based on the above group blood sugar data by using the LSTM network algorithm, and the above blood sugar prediction model is used to predict the blood sugar data to be predicted. Predicting the blood sugar concentration of the individual user solves the problem that the above-mentioned machine learning algorithm cannot be used to predict the blood sugar concentration of the individual due to the small amount of blood sugar data collected by the individual, and realizes the prediction of the individual blood sugar concentration by using the group blood sugar data. Meanwhile, compared with the SVR algorithm and the SVR algorithm based on the preset data splicing method, the SVR algorithm based on the preset data splicing method has higher prediction accuracy and better performance.
注意,上述仅为本发明的较佳实施例及所运用技术原理。本领域技术人员会理解,本发明不限于这里所述的特定实施例,对本领域技术人员来说能够进行各种明显的变化、重新调整和替代而不会脱离本发明的保护范围。因此,虽然通过以上实施例对本发明进行了较为详细的说明,但是本发明不仅仅限于以上实施例,在不脱离本发明构思的情况下,还可以包括更多其他等效实施例,而本发明的范围由所附的权利要求范围决定。Note that the above are only preferred embodiments of the present invention and applied technical principles. Those skilled in the art will understand that the present invention is not limited to the specific embodiments described herein, and various obvious changes, readjustments and substitutions can be made by those skilled in the art without departing from the protection scope of the present invention. Therefore, although the present invention has been described in detail through the above embodiments, the present invention is not limited to the above embodiments, and can also include more other equivalent embodiments without departing from the concept of the present invention. The scope is determined by the scope of the appended claims.
Claims (8)
Translated fromChinesePriority Applications (1)
| Application Number | Priority Date | Filing Date | Title |
|---|---|---|---|
| CN201710574788.0ACN107203700B (en) | 2017-07-14 | 2017-07-14 | Method and device based on continuous blood glucose monitoring |
Applications Claiming Priority (1)
| Application Number | Priority Date | Filing Date | Title |
|---|---|---|---|
| CN201710574788.0ACN107203700B (en) | 2017-07-14 | 2017-07-14 | Method and device based on continuous blood glucose monitoring |
Publications (2)
| Publication Number | Publication Date |
|---|---|
| CN107203700A CN107203700A (en) | 2017-09-26 |
| CN107203700Btrue CN107203700B (en) | 2020-05-05 |
Family
ID=59911703
Family Applications (1)
| Application Number | Title | Priority Date | Filing Date |
|---|---|---|---|
| CN201710574788.0AExpired - Fee RelatedCN107203700B (en) | 2017-07-14 | 2017-07-14 | Method and device based on continuous blood glucose monitoring |
Country Status (1)
| Country | Link |
|---|---|
| CN (1) | CN107203700B (en) |
Families Citing this family (11)
| Publication number | Priority date | Publication date | Assignee | Title |
|---|---|---|---|---|
| CN109934370B (en)* | 2017-12-15 | 2024-03-05 | 中国农业大学 | A method and device for predicting fish survival rate |
| CN109171754B (en)* | 2018-07-27 | 2022-07-05 | 清华-伯克利深圳学院筹备办公室 | Training method, device, terminal and storage medium for blood glucose prediction model |
| CN109065176B (en)* | 2018-08-20 | 2020-11-10 | 清华-伯克利深圳学院筹备办公室 | A blood sugar prediction method, device, terminal and storage medium |
| GB201817893D0 (en)* | 2018-11-01 | 2018-12-19 | Imperial Innovations Ltd | Predicting physological parameters |
| CN109872821A (en)* | 2019-04-24 | 2019-06-11 | 北京信息科技大学 | A method and device for constructing a blood glucose prediction model |
| CN111326255A (en)* | 2020-01-19 | 2020-06-23 | 湖南盈赛缇思人工智能公共数据平台有限公司 | Blood glucose concentration correction method based on big data, storage medium and system |
| CN112102953B (en)* | 2020-10-22 | 2023-06-16 | 平安科技(深圳)有限公司 | Personalized diabetes health management system, device and storage medium |
| DE102020214050A1 (en)* | 2020-11-09 | 2022-05-12 | Robert Bosch Gesellschaft mit beschränkter Haftung | Computer-implemented method and device for performing a medical laboratory value analysis |
| US20220296133A1 (en)* | 2021-03-22 | 2022-09-22 | CaloSense Ltd. | Methods Circuits Devices Systems and Machine Executable Code for Glucose Event Detection |
| CN114239696B (en)* | 2021-11-26 | 2024-12-10 | 广西大学 | A new intelligent microwave measurement system and method for syrup brix |
| CN114530250B (en)* | 2022-04-24 | 2022-08-02 | 广东工业大学 | Wearable blood glucose detection method, system and storage medium based on data enhancement |
Citations (4)
| Publication number | Priority date | Publication date | Assignee | Title |
|---|---|---|---|---|
| WO2002024065A1 (en)* | 2000-09-22 | 2002-03-28 | Knobbe, Lim & Buckingham | Method and apparatus for real-time estimation and control of pysiological parameters |
| CN103605878A (en)* | 2013-08-19 | 2014-02-26 | 浙江大学 | General blood glucose prediction method based on data modeling and model transplanting |
| CN106777891A (en)* | 2016-11-21 | 2017-05-31 | 中国科学院自动化研究所 | A kind of data characteristics selection and Forecasting Methodology and device |
| CN106777874A (en)* | 2016-11-18 | 2017-05-31 | 中国科学院自动化研究所 | The method that forecast model is built based on Recognition with Recurrent Neural Network |
- 2017
- 2017-07-14CNCN201710574788.0Apatent/CN107203700B/ennot_activeExpired - Fee Related
Patent Citations (4)
| Publication number | Priority date | Publication date | Assignee | Title |
|---|---|---|---|---|
| WO2002024065A1 (en)* | 2000-09-22 | 2002-03-28 | Knobbe, Lim & Buckingham | Method and apparatus for real-time estimation and control of pysiological parameters |
| CN103605878A (en)* | 2013-08-19 | 2014-02-26 | 浙江大学 | General blood glucose prediction method based on data modeling and model transplanting |
| CN106777874A (en)* | 2016-11-18 | 2017-05-31 | 中国科学院自动化研究所 | The method that forecast model is built based on Recognition with Recurrent Neural Network |
| CN106777891A (en)* | 2016-11-21 | 2017-05-31 | 中国科学院自动化研究所 | A kind of data characteristics selection and Forecasting Methodology and device |
Non-Patent Citations (1)
| Title |
|---|
| 基于多元统计分析方法的连续血糖监测仪故障检测研究;宋广健;《中国优秀硕士学位论文全文数据库》;浙江大学;20170101;4.2-4.3* |
Also Published As
| Publication number | Publication date |
|---|---|
| CN107203700A (en) | 2017-09-26 |
Similar Documents
| Publication | Publication Date | Title |
|---|---|---|
| CN107203700B (en) | Method and device based on continuous blood glucose monitoring | |
| Sozinov et al. | Human activity recognition using federated learning | |
| CN110796175A (en) | An online classification method of EEG data based on lightweight convolutional neural network | |
| Chiang et al. | Personalized effect of health behavior on blood pressure: Machine learning based prediction and recommendation | |
| Daniels et al. | Personalised Glucose Prediction via Deep Multitask Networks. | |
| Chiang et al. | Offline and online learning techniques for personalized blood pressure prediction and health behavior recommendations | |
| CN111387936B (en) | A sleep stage identification method, device and equipment | |
| DeMasi et al. | Detecting change in depressive symptoms from daily wellbeing questions, personality, and activity | |
| Aqajari et al. | Context-aware stress monitoring using wearable and mobile technologies in everyday settings | |
| Picchini et al. | Parameters of the diffusion leaky integrate-and-fire neuronal model for a slowly fluctuating signal | |
| Xu et al. | LSM-2: Learning from Incomplete Wearable Sensor Data | |
| Kan et al. | A Novel PSO‐Based Optimized Lightweight Convolution Neural Network for Movements Recognizing from Multichannel Surface Electromyogram | |
| Sarma et al. | Computing confidence intervals for point process models | |
| US20230200697A1 (en) | Automatic evolution method for brainwave database and automatic evolving system for detecting brainwave | |
| Allen et al. | Proximity and gravity: modeling heaped self‐reports | |
| Lim et al. | Context-based healthy lifestyle recommendation for enhancing user's wellness | |
| Hupalo et al. | Acquisition and Processing of Data in CPS for Remote Monitoring of the Human functional State | |
| JP7605293B2 (en) | Learning device, stress estimation device, learning method, stress estimation method, and program | |
| CN118609840B (en) | Intelligent medical data collection and analysis system and method based on the Internet | |
| Nguyen et al. | On the predictability of non-CGM diabetes data for personalized recommendation | |
| JP7426015B1 (en) | Healthcare data analysis system | |
| Budu et al. | Evaluating Temporal Fidelity in Synthetic Time-series Electronic Health Records | |
| CN116484188B (en) | Emotion recognition method of EEG signals based on online adaptive feature parameter optimization | |
| Roadknight et al. | Check for updates Improving Understanding of EEG Measurements Using Transparent Machine Learning Models | |
| EP3948687A1 (en) | A system and method for measuring non-stationary brain signals |
Legal Events
| Date | Code | Title | Description |
|---|---|---|---|
| PB01 | Publication | ||
| PB01 | Publication | ||
| SE01 | Entry into force of request for substantive examination | ||
| SE01 | Entry into force of request for substantive examination | ||
| TA01 | Transfer of patent application right | Effective date of registration:20180725 Address after:518055 Nanshan Zhiyuan 1001, Xue Yuan Avenue, Nanshan District, Shenzhen, Guangdong. Applicant after:TSINGHUA-BERKELEY SHENZHEN INSTITUTE Applicant after:Yu Dongfang Address before:518000 Nanshan Zhiyuan 1001, Xue Yuan Avenue, Nanshan District, Shenzhen, Guangdong. Applicant before:TSINGHUA-BERKELEY SHENZHEN INSTITUTE | |
| TA01 | Transfer of patent application right | ||
| GR01 | Patent grant | ||
| GR01 | Patent grant | ||
| CF01 | Termination of patent right due to non-payment of annual fee | Granted publication date:20200505 | |
| CF01 | Termination of patent right due to non-payment of annual fee |