CN105658138B - Quantification of absolute blood flow in tissue using fluorescence-mediated photoplethysmography - Google Patents
Quantification of absolute blood flow in tissue using fluorescence-mediated photoplethysmographyDownload PDFInfo
- Publication number
- CN105658138B CN105658138BCN201480044769.1ACN201480044769ACN105658138BCN 105658138 BCN105658138 BCN 105658138BCN 201480044769 ACN201480044769 ACN 201480044769ACN 105658138 BCN105658138 BCN 105658138B
- Authority
- CN
- China
- Prior art keywords
- icg
- blood
- fluorescence
- tissue
- dye
- Prior art date
- Legal status (The legal status is an assumption and is not a legal conclusion. Google has not performed a legal analysis and makes no representation as to the accuracy of the status listed.)
- Active
Links
Images


Classifications
- A—HUMAN NECESSITIES
- A61—MEDICAL OR VETERINARY SCIENCE; HYGIENE
- A61B—DIAGNOSIS; SURGERY; IDENTIFICATION
- A61B5/00—Measuring for diagnostic purposes; Identification of persons
- A61B5/02—Detecting, measuring or recording for evaluating the cardiovascular system, e.g. pulse, heart rate, blood pressure or blood flow
- A61B5/026—Measuring blood flow
- A61B5/0295—Measuring blood flow using plethysmography, i.e. measuring the variations in the volume of a body part as modified by the circulation of blood therethrough, e.g. impedance plethysmography
- A—HUMAN NECESSITIES
- A61—MEDICAL OR VETERINARY SCIENCE; HYGIENE
- A61B—DIAGNOSIS; SURGERY; IDENTIFICATION
- A61B5/00—Measuring for diagnostic purposes; Identification of persons
- A61B5/0059—Measuring for diagnostic purposes; Identification of persons using light, e.g. diagnosis by transillumination, diascopy, fluorescence
- A61B5/0071—Measuring for diagnostic purposes; Identification of persons using light, e.g. diagnosis by transillumination, diascopy, fluorescence by measuring fluorescence emission
- A—HUMAN NECESSITIES
- A61—MEDICAL OR VETERINARY SCIENCE; HYGIENE
- A61B—DIAGNOSIS; SURGERY; IDENTIFICATION
- A61B5/00—Measuring for diagnostic purposes; Identification of persons
- A61B5/02—Detecting, measuring or recording for evaluating the cardiovascular system, e.g. pulse, heart rate, blood pressure or blood flow
- A61B5/026—Measuring blood flow
- A61B5/0275—Measuring blood flow using tracers, e.g. dye dilution
- A—HUMAN NECESSITIES
- A61—MEDICAL OR VETERINARY SCIENCE; HYGIENE
- A61B—DIAGNOSIS; SURGERY; IDENTIFICATION
- A61B5/00—Measuring for diagnostic purposes; Identification of persons
- A61B5/68—Arrangements of detecting, measuring or recording means, e.g. sensors, in relation to patient
- A61B5/6801—Arrangements of detecting, measuring or recording means, e.g. sensors, in relation to patient specially adapted to be attached to or worn on the body surface
- A61B5/6813—Specially adapted to be attached to a specific body part
- A61B5/6825—Hand
- A61B5/6826—Finger
Landscapes
- Health & Medical Sciences (AREA)
- Life Sciences & Earth Sciences (AREA)
- Heart & Thoracic Surgery (AREA)
- Medical Informatics (AREA)
- Physics & Mathematics (AREA)
- Veterinary Medicine (AREA)
- Biophysics (AREA)
- Pathology (AREA)
- Engineering & Computer Science (AREA)
- Biomedical Technology (AREA)
- Public Health (AREA)
- General Health & Medical Sciences (AREA)
- Molecular Biology (AREA)
- Surgery (AREA)
- Animal Behavior & Ethology (AREA)
- Physiology (AREA)
- Hematology (AREA)
- Cardiology (AREA)
- Investigating, Analyzing Materials By Fluorescence Or Luminescence (AREA)
- Measuring Pulse, Heart Rate, Blood Pressure Or Blood Flow (AREA)
Abstract
Description
Translated fromChinese相关申请的交叉引用CROSS-REFERENCE TO RELATED APPLICATIONS
本申请要求2013年6月14日提交的美国临时申请号61/835,408的优先权的权益,其公开内容通过引用结合到本文中。This application claims the benefit of priority from US Provisional Application No. 61/835,408, filed June 14, 2013, the disclosure of which is incorporated herein by reference.
技术领域technical field
本发明总的来说涉及组织中血液灌注的光学评价领域,特别涉及组织中绝对血液灌注的定量评价。The present invention relates generally to the field of optical assessment of blood perfusion in tissue, and in particular to quantitative assessment of absolute blood perfusion in tissue.
发明背景Background of the Invention
临床医生对组织(例如皮肤)血液灌注评价的量化仍具有快速增长的兴趣,其应用遍及许多外科和非外科专业。虽然简单的二元评价(流动与非流动)对于某些临床应用可以是足够的,但是许多其它临床应用常常需要相对于某些标准的量化。呈绝对项的量化(例如作为流量量度的容积/时间)越来越令人关注。然而,组织中绝对血液灌注的定量评价作为临床评价工具是难以找到的(elusive)。There remains a rapidly growing interest among clinicians in the quantification of tissue (eg, skin) blood perfusion assessment, with applications across many surgical and non-surgical specialties. While a simple binary evaluation (flow vs. no flow) may be sufficient for some clinical applications, many other clinical applications often require quantification relative to certain criteria. Quantification in absolute terms (eg volume/time as a measure of flow) is of increasing interest. However, quantitative assessment of absolute blood perfusion in tissue is elusive as a clinical assessment tool.
光容积描记术(PPG)是一种用于检测微血管系统中的血液容积变化的光学技术。PPG中观察到的波形与心跳相关,基于PPG的技术已被配制于市购可获得的医学装置用于测量诸如氧饱和度、血压和心输出量等参数。Photoplethysmography (PPG) is an optical technique used to detect changes in blood volume in the microvascular system. The waveforms observed in PPG correlate to the heartbeat, and PPG-based techniques have been formulated in commercially available medical devices to measure parameters such as oxygen saturation, blood pressure, and cardiac output.
尽管基于PPG检测的医学装置的相对广泛的配制,但是PPG未被利用于促进组织血液灌注绝对测量的常规测定。具有所述能力的方法对临床医生将具有重大价值,因为它可使常规获取具有容积/时间/面积维度的组织血液灌注测量成为可能。只有具有所述维度的测量才允许有根据的,直接部位间和受试者间比较。因此,需要用于组织中绝对血液灌注的定量评价的方法和系统。Despite the relatively widespread formulation of medical devices based on PPG detection, PPG has not been utilized to facilitate the routine determination of absolute measurements of tissue blood perfusion. A method with such capabilities would be of great value to clinicians as it would enable routine acquisition of tissue blood perfusion measurements with volume/time/area dimensions. Only measurements with the stated dimensions allow for informed, direct inter-site and inter-subject comparisons. Accordingly, there is a need for methods and systems for quantitative assessment of absolute blood perfusion in tissue.
发明概述SUMMARY OF THE INVENTION
按照本发明的一个方面,提供用于测定血液通过目标组织(例如皮肤组织)的血管系统的合计流量的方法。所述方法包括测量组织容积末端的横截面积、测量血液容积层的厚度增加、测定脉冲占空因数(pulse duty cycle)、测定单次血压脉冲的持续时间,并根据不等式F = (A) (ΔL) (PDC)/Δt推导合计血流量F。在不等式F中,ΔV = (组织容积末端的横截面积,A) x (血液容积层L的厚度增加,ΔL),PDC为脉冲占空因数,Δt = 单次压力脉冲的持续时间。According to one aspect of the present invention, there is provided a method for determining the aggregate flow of blood through the vasculature of a target tissue (eg, skin tissue). The method includes measuring the cross-sectional area of the end of the tissue volume, measuring the thickness increase of the blood volume layer, determining the pulse duty cycle, determining the duration of a single blood pressure pulse, and according to the inequality F = (A) ( ΔL) (PDC )/Δt derives the total blood flow F. In inequality F, ΔV = (cross-sectional area at the end of the tissue volume, A) x (thickness increase of the blood volume layer L, ΔL), PDC is the pulse duty cycle, and Δt = the duration of a single pressure pulse.
在其它方面,所述方法包括荧光成像方案,所述方案包括将适当容积的荧光染料给予供应目标组织区域的血管系统中,并获得目标组织面积的血管造影图像的序列。在其它方面,荧光染料是ICG,其以约25-50 mg/mL的浓度给予。在再其它方面,以20-30帧/秒的帧率获得血管造影图像,并通过近红外荧光成像系统获得所述图像。在不同的方面,成像系统包括用于激发ICG的激光和用于拍摄由ICG发射的荧光的图像的摄像机。In other aspects, the method includes a fluorescence imaging protocol comprising administering an appropriate volume of fluorescent dye into the vasculature supplying the target tissue area, and obtaining a sequence of angiographic images of the target tissue area. In other aspects, the fluorescent dye is ICG, which is administered at a concentration of about 25-50 mg/mL. In yet other aspects, the angiographic images are acquired at a frame rate of 20-30 frames/sec, and the images are acquired by a near infrared fluorescence imaging system. In various aspects, the imaging system includes a laser for exciting the ICG and a camera for taking images of the fluorescence emitted by the ICG.
按照本发明的另一个方面,提供用于定量通过组织容积的绝对血流量的方法。所述方法包括将适当容积的荧光染料给与供应组织容积的血管系统,获得组织容积的血管造影图像的序列,计算组织容积的血管造影图像的序列的平均荧光强度,并生成随时间变化的平均荧光强度的曲线图。在不同的方面,荧光染料是吲哚菁绿(ICG),ICG以约25-50 mg/mL的浓度给予,且所述组织容积包括皮肤组织。在不同的其它方面,以约20-30帧/秒的帧率获取血管造影图像,而在其它方面,血管造影图像通过近红外荧光成像系统获取。在不同的方面,成像系统包括用于激发ICG的激光和用于拍摄由ICG发射的荧光的图像的摄像机。According to another aspect of the present invention, a method for quantifying absolute blood flow through tissue volume is provided. The method includes administering an appropriate volume of fluorescent dye to the vasculature supplying the tissue volume, obtaining a sequence of angiographic images of the tissue volume, calculating an average fluorescence intensity of the sequence of angiographic images of the tissue volume, and generating an average over time. Graph of fluorescence intensity. In various aspects, the fluorescent dye is indocyanine green (ICG), the ICG is administered at a concentration of about 25-50 mg/mL, and the tissue volume includes skin tissue. In various other aspects, the angiographic images are acquired at a frame rate of about 20-30 frames per second, while in other aspects, the angiographic images are acquired by a near-infrared fluorescence imaging system. In various aspects, the imaging system includes a laser for exciting the ICG and a camera for taking images of the fluorescence emitted by the ICG.
附图简述Brief Description of Drawings
在说明本发明的实施方案的附图中,In the drawings illustrating embodiments of the present invention,
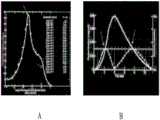
图1说明采用常规光容积描记术(PPG)测量单次血压脉冲期间的合计指尖血液容积;Figure 1 illustrates the use of conventional photoplethysmography (PPG) to measure the aggregated fingertip blood volume during a single blood pressure pulse;
图2A-2C说明按照一个实施方案采用荧光介导的光容积描记术(FM-PPG),通过检测荧光强度的变化测量具有表面积A的组织容积(切片)中的血液容积随时间的变化;Figures 2A-2C illustrate the use of fluorescence-mediated photoplethysmography (FM-PPG) according to one embodiment to measure the change in blood volume over time in a tissue volume (section) having surface area A by detecting changes in fluorescence intensity;
图3A-3B以示意图的方式表示在ICG通过血管转运期间吲哚菁绿(ICG)浓度与荧光强度之间随时间变化的关系;Figures 3A-3B graphically represent the time-dependent relationship between indocyanine green (ICG) concentration and fluorescence intensity during ICG transport through blood vessels;
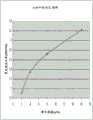
图4A-4B显示含有0.03 mg/ml浓度ICG溶液的渐细毛细管的荧光图像和毛细管直径与荧光强度之间的所得线性关系的曲线图;Figures 4A-4B show fluorescence images of tapered capillaries containing a 0.03 mg/ml concentration of ICG solution and graphs of the resulting linear relationship between capillary diameter and fluorescence intensity;
图5是在将ICG溶液注射到肘脉后从人前臂皮肤区域发射的随时间变化的平均荧光强度的曲线图;Figure 5 is a graph of the mean fluorescence intensity over time emitted from a human forearm skin region following injection of an ICG solution into the cubital vein;
图6显示与从含有0.03 mg/ml浓度ICG溶液的渐细毛细管发射的荧光强度随毛细管厚度而变的曲线有关的一串PPG振荡;Figure 6 shows a series of PPG oscillations associated with a curve of fluorescence intensity emitted from tapered capillaries containing a 0.03 mg/ml concentration of ICG solution as a function of capillary thickness;
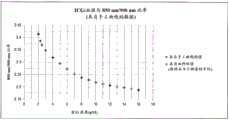
图7说明由血液中的ICG发射的中心大约位于850 nm和900 nm的波长带的强度之比随摩尔浓度而变的关系;Figure 7 illustrates the ratio of the intensities of wavelength bands centered at approximately 850 nm and 900 nm emitted by ICG in blood as a function of molar concentration;
图8显示示例性成像系统,其包括依据用于实施本发明的FM-PPG方法的实施方案的光学组件的排列;8 shows an exemplary imaging system including an arrangement of optical components in accordance with an embodiment for implementing the FM-PPG method of the present invention;
图9显示来自本文所含的本发明的某些工作实施例的随时间变化的平均强度曲线的片段;Figure 9 shows a segment of the mean intensity curve over time from certain working examples of the invention contained herein;
图10说明样品厚度对针对含ICG的乙醇绘制的2-波长比率校准曲线(2-wavelength ratiometric calibration curve)的作用;Figure 10 illustrates the effect of sample thickness on a 2-wavelength ratiometric calibration curve plotted for ICG-containing ethanol;
图11说明样品厚度对针对含ICG的人血绘制的2-波长比率校准曲线的作用;Figure 11 illustrates the effect of sample thickness on a 2-wavelength ratio calibration curve drawn for ICG-containing human blood;
图12说明从5个数据点内推的校准曲线;Figure 12 illustrates a calibration curve interpolated from 5 data points;
图13说明含ICG的人血的Berezin实验室数据;Figure 13 illustrates Berezin laboratory data for human blood containing ICG;
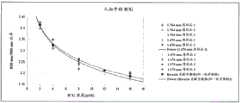
图14显示对于含ICG的人血液采用本发明的FM-PPG示例性方法和系统(来自图12)生成的数据与Berezin实验室数据(来自图13)的比较;Figure 14 shows a comparison of data generated using the FM-PPG exemplary method and system of the present invention (from Figure 12) to Berezin laboratory data (from Figure 13) for ICG-containing human blood;
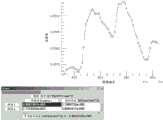
图15显示来自猕猴眼,具体地讲用于分析各序列的图像亮度(总强度)与图像编号的时距曲线的验证数据;Figure 15 shows validation data from rhesus monkey eyes, in particular, time-lapse curves used to analyze image brightness (total intensity) versus image number for each sequence;
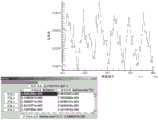
图16显示来自猕猴眼,具体地讲针对图像490-565生成的曲线图的验证数据,其中选择两个连续血流脉冲之间的谷值(正方形);表格表示每次脉冲的计算血流量以及平均流量;Figure 16 shows validation data from a macaque eye, specifically a graph generated for images 490-565, where the trough (square) between two consecutive blood flow pulses is selected; the table represents the calculated blood flow per pulse and average flow;
图17显示与来自猕猴眼的验证数据有关的第二血管造影片序列;Figure 17 shows a second sequence of angiograms related to validation data from rhesus monkey eyes;
图18显示针对图像300-381生成的曲线图,其中选择5个连续血流脉冲之间的谷值(正方形);表格表示每次脉冲的计算血流量以及平均流量;Figure 18 shows graphs generated for images 300-381, where the valleys (squares) between 5 consecutive blood flow pulses were selected; the table represents the calculated blood flow per pulse as well as the average flow;
图19显示与来自猕猴眼的验证数据有关的第三血管造影片序列;Figure 19 shows a third sequence of angiograms related to validation data from rhesus monkey eyes;
图20显示针对图像260-290生成的曲线,其中选择两个连续血流脉冲之间的谷值(正方形);表格表示每次脉冲的计算血流量以及平均流量;和Figure 20 shows curves generated for images 260-290, where the valleys (squares) between two consecutive blood flow pulses are selected; the table represents the calculated blood flow per pulse and the average flow; and
图21A-21B显示人眼血管造影片的图像(21A)和如说明书所述,以在Alm和Bill所用的一只猴的左眼的平铺脉络膜的放射自显影图上叠合的方框表示的视网膜区域(21B)。Figures 21A-21B show images of an angiogram of the human eye (21A) and as described in the specification, shown as superimposed boxes on the autoradiogram of the tiled choroid of the left eye of a monkey used by Alm and Bill retinal area (21B).
发明详述Detailed description of the invention
现将更详细地提及本发明的各个方面和变化的实施和实施方案,在附图中说明了其实例。Reference will now be made in greater detail to various aspects and variant implementations and embodiments of the present invention, examples of which are illustrated in the accompanying drawings.
常规光容积描记术(PPG)通过检测通过组织发射的近红外光的量的变化测量组织(通常为指尖)容积中血液的量随时间变化的相对变化;光程中血液的量越大,所吸收的光的量越大。在血管内压力脉冲舒张期内,指尖血管的合计容积最小,而在收缩期,容积最大,如图1所示,该图显示单次血压脉冲期间合计指尖血液容积的常规PPG测量。Conventional photoplethysmography (PPG) measures the relative change in the amount of blood in the volume of tissue (usually a fingertip) over time by detecting changes in the amount of near-infrared light emitted through the tissue; the greater the amount of blood in the optical path, the more The greater the amount of light absorbed. During the diastolic phase of the intravascular pressure pulse, the aggregated volume of the fingertip vessels is the smallest, and during the systole phase, the volume is greatest, as shown in Figure 1, which shows conventional PPG measurements of aggregated fingertip blood volume during a single blood pressure pulse.
相比之下,按照本发明的不同方面,荧光介导的光容积描记术(FM-PPG)通过检测从组织容积(切片)中发射的近红外荧光的量的变化,测量组织(例如皮肤)容积中血液的量随时间变化的相对改变。按照不同的实施方案,在FM-PPG中,荧光强度与存在于血液中的荧光染料(例如吲哚菁绿(ICG)染料)的总量成正比,因此成为血液容积的度量。在不同的实施方案中,实施FM-PPG以量化绝对组织灌注允许在获取血管造影片序列中的一副图像(或多幅图像)时测定受试者循环血中荧光染料的摩尔浓度。In contrast, according to various aspects of the invention, fluorescence-mediated photoplethysmography (FM-PPG) measures tissue (eg, skin) by detecting changes in the amount of near-infrared fluorescence emitted from tissue volumes (sections). The relative change in the amount of blood in a volume over time. According to various embodiments, in FM-PPG, the fluorescence intensity is proportional to the total amount of fluorescent dye (eg, indocyanine green (ICG) dye) present in the blood and thus becomes a measure of blood volume. In various embodiments, performing FM-PPG to quantify absolute tissue perfusion allows the determination of the molar concentration of fluorescent dyes in the circulating blood of a subject when an image (or images) in an angiogram sequence is acquired.
按照不同的实施方案,FM-PPG和所给予的荧光染料的某些特性,例如浓度荧光猝灭和浓度与双波长比率的荧光测量之间的线性关系,使得以容积/时间/面积的绝对项测定组织(例如皮肤)血流量成为可能。在不同的实施方案中,本发明的方法和系统可应用在大小范围为例如小于约1 cm2-约1/4 m2的宽泛的大小范围的组织(例如皮肤和眼底)区域中。According to various embodiments, the linear relationship between certain properties of FM-PPG and the administered fluorescent dye, such as concentration fluorescence quenching and fluorescence measurement of concentration to dual wavelength ratio, is such that in absolute terms of volume/time/area It is possible to measure blood flow in tissues (eg skin). In various embodiments, the methods and systems of the present invention can be applied in areas of tissue (eg, skin and fundus) over a wide range of sizes, eg, ranging in size from less than about 1 cm2 to about 1/4 m2 .
在不同的实施方案中,合适的荧光染料包括任何无毒染料,所述染料当暴露于足以引起荧光染料发出荧光的量的光能时发荧光从而允许受试者组织区域成像。在不同的实施方案中,可以合适的浓度给予染料,使得当施加适当波长的辐射能时,可检测到荧光。在某些实施方案中,染料是发射红外光谱内的光的荧光染料。在某些实施方案中,染料是三碳菁染料,例如吲哚菁绿(ICG)。在其它实施方案中,染料选自异硫氰酸荧光素、罗丹明、藻红蛋白、藻蓝蛋白、别藻蓝蛋白、邻苯二甲醛、荧光胺、玫瑰红、锥虫蓝、荧光金或其组合。在某些实施方案中,前述染料可混合或组合。在一些实施方案中,可以使用染料类似物。染料类似物包括被化学修饰、但仍保留其在暴露于适当波长的辐射能时发荧光的能力的染料。In various embodiments, suitable fluorescent dyes include any non-toxic dye that fluoresces when exposed to an amount of light energy sufficient to cause the fluorescent dye to fluoresce to allow imaging of areas of subject tissue. In various embodiments, the dye can be administered at a suitable concentration such that when radiant energy of the appropriate wavelength is applied, fluorescence can be detected. In certain embodiments, the dye is a fluorescent dye that emits light in the infrared spectrum. In certain embodiments, the dye is a tricarbocyanine dye, such as indocyanine green (ICG). In other embodiments, the dye is selected from the group consisting of fluorescein isothiocyanate, rhodamine, phycoerythrin, phycocyanin, allophycocyanin, o-phthalaldehyde, fluorescamine, rose bengal, trypan blue, fluorescent gold, or its combination. In certain embodiments, the foregoing dyes may be mixed or combined. In some embodiments, dye analogs can be used. Dye analogs include chemically modified dyes that retain their ability to fluoresce upon exposure to appropriate wavelengths of radiant energy.
在一些实施方案中,可将染料以适于成像的浓度静脉内(例如作为推注团注射剂)给予受试者(例如哺乳动物)。在不同的实施方案中,将染料注射至静脉或动脉内。在使用多种染料的实施方案中,可同时(例如以单次推注团)或序贯(例如以分开的推注团)给予染料。在一些实施方案中,可通过导管给予染料。在不同的实施方案中,染料可作为冻干粉或固体提供。在某些实施方案中,可在小瓶(例如无菌小瓶)中提供,所述小瓶可允许用无菌注射器复溶成合适的浓度。可使用任何合适的载体或稀释液将它复溶。下文提供载体和稀释液的实例。染料可在临给予前复溶,例如用水。In some embodiments, the dye can be administered to a subject (eg, a mammal) intravenously (eg, as a bolus injection) at a concentration suitable for imaging. In various embodiments, the dye is injected into a vein or artery. In embodiments using multiple dyes, the dyes may be administered simultaneously (eg, in a single bolus) or sequentially (eg, in separate boluses). In some embodiments, the dye can be administered through a catheter. In various embodiments, the dye can be provided as a lyophilized powder or as a solid. In certain embodiments, it may be provided in a vial (eg, a sterile vial) that allows for reconstitution to the appropriate concentration with a sterile syringe. It can be reconstituted using any suitable carrier or diluent. Examples of carriers and diluents are provided below. The dye can be reconstituted, eg, with water, immediately prior to administration.
在某些实施方案中,可在获取图像前少于1小时内将染料给予受试者。在一些实施方案中,可在获取图像前少于30分钟内将染料给予受试者。在再其它实施方案中,可在获取图像前至少30秒钟内给予染料。在仍其它实施方案中,在获取图像的同时给予染料。In certain embodiments, the dye can be administered to the subject less than 1 hour before the image is acquired. In some embodiments, the dye can be administered to the subject less than 30 minutes before the image is acquired. In still other embodiments, the dye may be administered at least 30 seconds before the image is acquired. In still other embodiments, the dye is administered at the same time as the image is acquired.
在不同的实施方案中,可以使用可将染料保持在溶液中的任何稀释液或载体。例如,在染料是ICG的某些实施方案中,染料可用水复溶。在染料是ICG的一些实施方案中,染料可用醇(例如乙醇)复溶。在一些实施方案中,一旦染料复溶,则可将其与其它的稀释液和载体混合。在一些实施方案中,使染料与另一种分子(例如蛋白质、肽、氨基酸、合成聚合物或糖)缀合以例如提高溶解度或提高稳定性。可用于某些实施方案的稀释液和载体的其它实例包括甘油、聚乙二醇、丙二醇、聚山梨醇酯80、吐温类、脂质体、氨基酸、卵磷脂、十二烷基硫酸盐、磷脂、脱氧胆酸盐、大豆油、植物油、红花油、芝麻油、花生油、棉籽油、山梨糖醇、阿拉伯树胶、单硬脂酸铝、聚氧乙烯化脂肪酸及其混合物。可任选加入其它缓冲剂,包括Tris、HC1、NaOH、磷酸盐缓冲剂、HEPES。In various embodiments, any diluent or carrier that can keep the dye in solution can be used. For example, in certain embodiments where the dye is ICG, the dye can be reconstituted with water. In some embodiments where the dye is ICG, the dye can be reconstituted with an alcohol (eg, ethanol). In some embodiments, once the dye is reconstituted, it can be mixed with other diluents and carriers. In some embodiments, the dye is conjugated to another molecule (eg, a protein, peptide, amino acid, synthetic polymer, or sugar), eg, to increase solubility or increase stability. Other examples of diluents and carriers useful in certain embodiments include glycerol, polyethylene glycol, propylene glycol, polysorbate 80, Tweens, liposomes, amino acids, lecithin, lauryl sulfate, Phospholipids, deoxycholate, soybean oil, vegetable oil, safflower oil, sesame oil, peanut oil, cottonseed oil, sorbitol, gum arabic, aluminum monostearate, polyoxyethylated fatty acids, and mixtures thereof. Additional buffers may optionally be added, including Tris, HCl, NaOH, phosphate buffers, HEPES.
按照不同的实施方案,在将荧光染料(例如ICG)给予(例如静脉注射)受试者后,FM-PPG通过检测从组织容积中发射的近红外荧光的量的变化,测量组织容积(切片)中血液量随时间变化的变化。荧光强度与血液中所含荧光染料(例如ICG)的总量成比例。According to various embodiments, FM-PPG measures tissue volumes (sections) by detecting changes in the amount of near-infrared fluorescence emitted from the tissue volume following administration (eg, intravenous injection) of a fluorescent dye (eg, ICG) to a subject. Changes in blood volume over time. The fluorescence intensity is proportional to the total amount of fluorescent dye (eg, ICG) contained in the blood.
在图2B中以示意图的方式表示图2A所示皮肤组织的矩形容积(一段组织)内的各个充满ICG的血管段,其中描述了压力脉冲舒张期间(左边)和收缩峰期间(右边)的血管段。组织容积表面(各具有横截面积,A)上的箭头标示当各血管段的直径因血压从舒张水平上升到收缩水平而增加时,发生ICG荧光强度增强。图2C重复图2B所描述的几何关系,不同的是各血管段的合计容积用单个立方体容积表示。另外,舒张压和收缩压之间发生的最大量的血液容积增加标示为ΔV。Individual ICG-filled vessel segments within the rectangular volume (a segment of tissue) of the skin tissue shown in FIG. 2A are schematically represented in FIG. 2B , where the vessels during diastole (left) and peak systole (right) of the pressure pulse are depicted part. Arrows on tissue volume surfaces (each with cross-sectional area, A) indicate that ICG fluorescence intensity enhancement occurs when the diameter of each vessel segment increases as blood pressure rises from diastolic to systolic levels. Figure 2C repeats the geometric relationship described in Figure 2B, except that the combined volume of each vessel segment is represented by a single cubic volume. Additionally, the greatest amount of blood volume increase that occurs between diastolic and systolic blood pressure is denoted ΔV.
在单次血压脉冲振荡中通过矩形组织容积流动的血液总量与脉冲曲线下面积成比例。如果压力脉冲是方波,则在单次脉冲期间流动的总容积会为ΔV。然而,压力脉冲曲线不是方波,因此实际脉冲曲线下面积是方波面积的分数。The total amount of blood flowing through the rectangular tissue volume in a single blood pressure pulse oscillation is proportional to the area under the pulse curve. If the pressure pulse is a square wave, the total volume flowing during a single pulse will be ΔV. However, the pressure pulse curve is not a square wave, so the area under the actual pulse curve is a fraction of the square wave area.
因此,假设脉冲占空因数(PDC)可定义为实际脉冲曲线下面积所占据的方波下面积的分数。因此,在一个压力脉冲周期F中通过组织容积的实际血流量为:Therefore, it is assumed that the pulse duty cycle (PDC ) can be defined as the fraction of the area under the square wave occupied by the area under the actual pulse curve. Therefore, the actual blood flow through the tissue volume during one pressure pulse period F is:
F = (ΔV) (PDC)/Δt,其中F = (ΔV) (PDC )/Δt, where
ΔV = (组织容积末端的横截面积A) x (血液容积层L的厚度增加ΔL),和ΔV = (cross-sectional area A of the end of the tissue volume) x (the thickness increase of the blood volume layer L, ΔL), and
Δt = 单次血压脉冲的持续时间,Δt = duration of a single blood pressure pulse,
因此,F = (A) (ΔL) (PDC)/Δt (1)Therefore, F = (A) (ΔL) (PDC )/Δt (1)
虽然可测定A、PDC和Δt的绝对值,但是之前未显示常规测定ΔL的临床上可接受的方法。下面描述了可以长度/时间为单位定量地测定实施方案。Although absolute values of A, PDC and Δt can be determined, no clinically acceptable method for routine determination of ΔL has been shown before. Embodiments that can be quantitatively assayed in units of length/time are described below.
在一个实施方案中,由荧光染料(例如ICG)显示的浓度依赖性荧光猝灭提供可以长度/时间为单位定量地测定ΔL的方法。In one embodiment, concentration-dependent fluorescence quenching exhibited by fluorescent dyes (eg, ICG) provides a method by which AL can be quantitatively determined in units of length/time.
浓度依赖性荧光猝灭是溶液中的某些染料所显示的现象,其中通过溶液发射的荧光的强度随染料浓度增强直到达到一个点,超过这个点进一步的浓度增加导致荧光减少。例如,对于血液中的ICG,在0.025 mg/ml的浓度下出现最大荧光(参见Flower, R. W.和Hochheimer, B. F.: “Quantification of Indicator Dye Concentration in OcularBlood Vessels (眼血管中指示剂染料浓度的定量)”, Exp. Eye Res., 第25卷: 103,Aug. 1977);在该浓度以上或以下,荧光减少相当急剧地发生,如图3A所示,该图以示意图的方式说明在ICG通过血管转运期间ICG浓度和荧光强度之间随时间变化的关系。图3B以示意图的方式说明对于血管内的固定位置,在ICG染料推注团通过血管转运期间ICG浓度(实心曲线)和荧光强度(虚线曲线)之间随时间变化的关系。Concentration-dependent fluorescence quenching is a phenomenon exhibited by certain dyes in solution, wherein the intensity of fluorescence emitted through solution increases with dye concentration until a point is reached, beyond which further concentration increases result in a decrease in fluorescence. For example, for ICG in blood, maximum fluorescence occurs at a concentration of 0.025 mg/ml (see Flower, R. W. and Hochheimer, B. F.: "Quantification of Indicator Dye Concentration in OcularBlood Vessels" , Exp. Eye Res., Vol. 25: 103, Aug. 1977); above or below this concentration, the decrease in fluorescence occurs rather sharply, as shown in Figure 3A, which schematically illustrates the transport of ICG through blood vessels Time-dependent relationship between ICG concentration and fluorescence intensity during the period. Figure 3B graphically illustrates the time-dependent relationship between ICG concentration (solid curve) and fluorescence intensity (dashed curve) during transport of an ICG dye bolus through the blood vessel for a fixed location within the vessel.
图3表示在图3A和图3B两图中染料浓度为0.025 mg/ml的点和发生荧光猝灭的浓度处于某一显著较大水平的点(例如在该实例中,约10倍)。图3B说明随着ICG推注团在血管中转运和染料浓度增加(实心曲线),ICG荧光也增强(虚线),且当染料浓度达到0.025 mg/ml时达到最大强度(左侧箭头)。在浓度继续增加时,荧光由于浓度荧光猝灭所致减弱,在浓度达到其最大时(在该实例中约0.250)达到最小强度(中间箭头)。此后,浓度降低,引起荧光强度增强,直到再次达到0.025 mg/ml的最大水平(右侧箭头);然后随着浓度继续降低,荧光也开始再次减弱。Figure 3 shows the point in both Figures 3A and 3B where the dye concentration is 0.025 mg/ml and the point where the concentration of fluorescence quenching is at some significantly larger level (eg, in this example, about 10 times). Figure 3B illustrates that as the ICG bolus is transported in the vessel and the dye concentration increases (solid curve), ICG fluorescence also increases (dashed line) and reaches a maximum intensity (left arrow) when the dye concentration reaches 0.025 mg/ml. As the concentration continued to increase, the fluorescence diminished due to concentration fluorescence quenching, reaching a minimum intensity (middle arrow) when the concentration reached its maximum (about 0.250 in this example). Thereafter, the concentration decreases, causing the fluorescence intensity to increase until a maximum level of 0.025 mg/ml is again reached (right arrow); then the fluorescence also begins to decrease again as the concentration continues to decrease.
在不同的实施方案中,在足够高的浓度和容积完整性的ICG推注团转运期间发生的相等的最大荧光强度的独特的双峰允许以绝对项测定图2C所示血液容积厚度的增加ΔL。由于峰出现在0.025 mg/ml的浓度下,并且由于可测定在任一峰出现的精确时间从已知面积(A)发射的荧光强度,因此可凭经验测定在相同的照明和放大倍数条件下发射相同荧光强度的含有0.025 mg/ml ICG的血层的厚度。In various embodiments, the unique double peak of equal maximum fluorescence intensity that occurs during the delivery of an ICG bolus of sufficiently high concentration and volume integrity allows determination of the increase in blood volume thickness ΔL shown in Figure 2C in absolute terms . Since the peaks occur at a concentration of 0.025 mg/ml, and since the intensity of fluorescence emitted from a known area (A) at the precise time at which any peak appears can be determined, it can be determined empirically that the same emission is emitted under the same illumination and magnification conditions Fluorescence intensity of the thickness of the blood layer containing 0.025 mg/ml ICG.
例如,使用与获得的高速血管造影图像(从所述图像中获取双峰荧光强度)所用的相同光学器件和荧光激发照明,可以获取如例如图4中所示的充满0.025 mg/ml ICG/血液或ICG/乙醇溶液的精巧渐细的毛细管的荧光图像。根据该图像(图4A),可生成毛细管直径ΔL和荧光强度间的线性关系的曲线图(图4B)。For example, using the same optics and fluorescence excitation illumination used to obtain high-speed angiography images from which bimodal fluorescence intensities were obtained, a full 0.025 mg/ml ICG/blood as shown, for example, in Figure 4 can be obtained Fluorescence images of finely tapered capillaries of ICG/ethanol solution. From this image (FIG. 4A), a graph of the linear relationship between capillary diameter [Delta]L and fluorescence intensity can be generated (FIG. 4B).
现已知方程式F = (A x ΔL)/Δt中的所有项的绝对值,使之可能解出通过位于面积A下的皮肤组织的容积以ml/sec为单位的绝对血流量。因此,该实施方案说明了用于对临床医生之前难以获得的组织容积中血流量(例如皮肤血流量)绝对定量的方法。The absolute values of all terms in the equation F = (A x ΔL)/Δt are now known, making it possible to solve for the absolute blood flow in ml/sec through the volume of skin tissue lying under area A. Thus, this embodiment illustrates a method for absolute quantification of blood flow in tissue volumes (eg, skin blood flow) previously difficult for clinicians to obtain.
在另一个实施方案中,在快速肘脉注射0.40 ml的50 mg/ml ICG染料水性溶液和即刻快速5.0-ml等渗盐水冲洗后,以23/sec的速率获得人前臂内对侧(medialcontralateral forearm)皮肤250 mm2面积的高空间分辨率血管造影图像。使血管造影片序列中的各图像再登记以排除帧间臂运动,并依据这些图像的每一个,计算各图像的组织区域的平均荧光强度。然后采用这些数据生成随时间变化的平均荧光强度的曲线图,其一部分(中心大约位于图像编号100)在图5中示出。In another embodiment, a human medialcontralateral forearm was obtained at a rate of 23/sec following a rapid cubital injection of 0.40 ml of a 50 mg/ml aqueous solution of ICG dye and an immediate rapid 5.0-ml isotonic saline flush ) High spatial resolution angiographic image of a 250mm2 area of the skin. The images in the angiogram sequence were re-registered to exclude inter-frame arm motion, and from each of these images, the mean fluorescence intensity of the tissue region for each image was calculated. These data were then used to generate a graph of the mean fluorescence intensity versus time, a portion of which (centered approximately at image number 100) is shown in FIG. 5 .
高频“PPG”振荡明显可见,取决于(riding on)与250 mm2表面积下皮肤组织容积内所含合计血管容积的染料填充有关的荧光强度曲线的低频分量。如图6所示,将中心大约位于图像编号100的3个PPG振荡(和第4个的一部分)与来自图4B的毛细管直径与荧光数据的曲线图并列。两个曲线都处于图右边所示的相同荧光强度标尺上。High frequency "PPG" oscillations are clearly visible, riding on the low frequency component of the fluorescence intensity curve associated with dye filling of the aggregated vascular volume contained within the skin tissue volume under a 250mm2 surface area. As shown in Figure 6, the 3 PPG oscillations (and part of the 4th) centered at approximately
将由PPG荧光强度振荡的最小值(虚线)和最大值(虚线)限定的包迹线投射到荧光强度与毛细管直径曲线图,然后投射到曲线图的横座标。后一投射的宽度标示血液容积层的厚度增加,ΔL=0.001 mm。The envelope line defined by the minimum (dashed line) and maximum (dashed line) of the PPG fluorescence intensity oscillations was projected onto a graph of fluorescence intensity versus capillary diameter and then onto the abscissa of the graph. The width of the latter projection indicates the increased thickness of the blood volume layer, ΔL = 0.001 mm.
在该实例中,3个荧光强度振荡的平均脉冲占空因数(PDC)被确定为40%,一次脉冲的平均持续时间被测定为Δt = 0.680 sec。In this example, the average pulse duty cycle (PDC ) of 3 fluorescence intensity oscillations was determined to be 40%, and the average duration of one pulse was determined to be Δt = 0.680 sec.
因F = (A) (ΔL) (PDC)/Δt (1)Since F = (A) (ΔL) (PDC )/Δt (1)
= (250 mm2) (0.001 mm) (0.40) / (0.680)= (250 mm2 ) (0.001 mm) (0.40) / (0.680)
= 0.147 mm3/sec或0.147 ml/sec= 0.147 mm3 /sec or 0.147 ml/sec
由于无法获得可靠的测量方法,在现有技术中几乎没有有关臂部皮肤中的绝对血流量的可用信息。可应用下列平均血液循环和解剖值生成极粗略的近似值:There is little information available in the prior art on absolute blood flow in the skin of the arm due to the inability to obtain reliable measurements. A very rough approximation can be generated by applying the following average blood circulation and anatomical values:
总心输出量= 5 L/min = 83.33 ml/secTotal cardiac output = 5 L/min = 83.33 ml/sec
至皮肤的心输出量的分数= 20%或16.67 ml/secFraction of cardiac output to skin = 20% or 16.67 ml/sec
皮肤面积(m2) = {[高(in) x 重量(lbs)]/3131}1/2= {[68 x 154]/3131}1/2=1.83 m2Skin area (m2 ) = {[height (in) x weight (lbs)]/3131}1/2 = {[68 x 154]/3131}1/2 = 1.83 m2
= 1.83 x 106 mm2= 1.83 x 106 mm2
因此,至1 mm2皮肤的总血流量= (16.67 ml/sec)/(1.83 x 106)Therefore, total blood flow to 1 mm2 of skin = (16.67 ml/sec)/(1.83 x 106 )
= 9.11 x 10⁻⁶ml/sec= 9.11 x 10⁻⁶ ml/sec
因此,至250 mm2皮肤的血流量= 250 x 9.11 x 10-6ml/secSo blood flow to 250mm2 skin = 250 x 9.11 x 10-6 ml/sec
= 0.0023 ml/sec= 0.0023 ml/sec
该至250 mm2皮肤的血流量的后一近似值与采用上文实例所述本发明的荧光介导的PPG方法和系统推导的0.147 ml/sec相比小约1/60倍。然而,结果的这种差异可鉴于以下原有假设来解释:在基于循环/生理近似值的计算中血流量在全身皮肤面积上均匀分布,和FM-PPG实例中的毛细管直径/荧光强度数据是使用含ICG的乙醇而非血液汇编,以及经眼毛细管直径测量是通过叠合标尺(superimposed scale)而不是通过数字方法进行。This latter approximation of blood flow to 250mm2 skin is about 1/60 times smaller than the 0.147 ml/sec derived using the fluorescence-mediated PPG method and system of the invention described in the examples above. However, this difference in results can be explained in light of the original assumptions that blood flow is uniformly distributed over the whole body skin area in the calculation based on the circulation/physiological approximation, and that the capillary diameter/fluorescence intensity data in the FM-PPG example was calculated using Ethanol with ICG instead of blood compilation, and transocular capillary diameter measurements were performed on a superimposed scale rather than by numerical methods.
在不同的实施方案中,用以达到超过38 μΜ的循环峰值染料浓度的小体积,高浓度染料推注团(例如ICG)的快速静脉注射,接着盐水冲洗,如前述校准方法所要求,可适于所选择的临床实施。In various embodiments, bolus injection of a small-volume, high-concentration dye bolus (eg, ICG), followed by saline flush, to achieve circulating peak dye concentrations in excess of 38 μM, may be adapted in the selected clinical practice.
在本发明的另一个实施方案中,开发了备选校准方法以适应常规临床应用中遇到的峰值染料(例如ICG)浓度的范围。In another embodiment of the present invention, an alternative calibration method was developed to accommodate the range of peak dye (eg, ICG) concentrations encountered in routine clinical applications.
例如,典型的ICG给予由注射约3 ml的25 mg/ml水性溶液,接着5 ml盐水冲洗组成。在血管内转运到不同目标部位期间发生约400-600倍的注射的染料推注团稀释,导致约5.4-8 μΜ的峰值染料浓度范围。为了适应峰值染料浓度的这种变化性,额外荧光波长数据与血管造影图像一起同时获取;将这些数据用于双波长比率分析以确定在获取各图像时的血管内染料浓度。For example, a typical ICG administration consists of an injection of about 3 ml of a 25 mg/ml aqueous solution followed by a 5 ml saline flush. About 400-600-fold dilution of the injected dye bolus occurred during intravascular transport to different target sites, resulting in a peak dye concentration range of about 5.4-8 μΜ. To accommodate this variability in peak dye concentration, additional fluorescence wavelength data was acquired concurrently with the angiography images; these data were used for dual wavelength ratio analysis to determine the intravascular dye concentration at the time each image was acquired.
然而前述实施方案中描述的校准方法具有除ICG荧光血管造影术序列以外不需要其它数据的优势,该实施方案所描述的备选校准方法具有对用户是完全明显的优势,因为不需要与常规注射技术有偏离。然而,结合该实施方案,将记录器件的成像光学器件(optics)改进以允许连续地同时测量与用于图像形成的波长相比更长的2个近红外波长。Whereas the calibration method described in the previous embodiment has the advantage that no other data than the ICG fluorescein angiography sequence is required, the alternative calibration method described in this embodiment has an advantage that is entirely clear to the user, since no interaction with conventional injections is required. Technology deviates. However, in conjunction with this embodiment, the imaging optics of the recording device are modified to allow continuous simultaneous measurement of 2 near-infrared wavelengths that are longer than those used for image formation.
如同前述实施方案描述的校准方法一样,在备选的校准方法中,测定了图2C所示血液容积层L的厚度增加ΔL。此外,将实施此的数据嵌入通过在单次压力脉冲振荡期间照射矩形组织容积中合计ICG染料标记的血液容积而生成的荧光中。当矩形组织容积的表面积A用805 nm波长激光照射时,产生的总荧光F是激发光强度即在805 nm下的ICG摩尔吸收系数£、ICG摩尔浓度C、ICG量子效率Φ和合计的ICG标记的血液层厚度L的函数。即:As with the calibration method described in the previous embodiment, in an alternative calibration method, the thickness increase ΔL of the blood volume layer L shown in FIG. 2C is determined. In addition, the data implementing this was embedded in the fluorescence generated by illuminating the volume of blood labeled with the ICG dye in a rectangular volume of tissue during a single pressure pulse oscillation. When the surface area A of the rectangular tissue volume is irradiated with 805 nm wavelength laser light, the total fluorescence F produced is the excitation light intensity i.e. the ICG molar absorption coefficient at 805 nm, the ICG molar concentration C, the ICG quantum efficiency Φ and the total ICG labeling function of the blood layer thickness L. which is:
F =f (Ie,ε,C,Φ,L) (2)F =f (Ie, ε, C, Φ, L) (2)
然而,考虑到激发光在其传播通过ICG标记的血液容积时被吸收,如Beer-Lambert吸收定律所述,发射荧光的强度If为:However, considering that the excitation light is absorbed as it propagates through the ICG-labeled blood volume, as stated by the Beer-Lambert absorption law, the intensity If of the emitted fluorescence is:
If = Ie Φ (1-e-εC L) (3)If = Ie Φ (1-e-εC L ) (3)
对于L的解方程式(3):The solution to equation (3) for L:
L = ln [IeΦ/(IeΦ - If)](ε C)-1 (4)L = ln [Ie Φ/(Ie Φ - If )](ε C)-1 (4)
其中除瞬间ICG摩尔浓度C之外,所有参数的值是已知的。where the values of all parameters are known except the instantaneous ICG molarity C.
然而,在不同的实施方案中,可通过超过用于形成染料(例如ICG)荧光图像的波长带的2个合适的近红外波长的比率分析,测定染料(例如ICG)摩尔浓度。例如,下图7显示血液中由ICG发射的中心大约位于850 nm和900 nm波长的波长带的强度比率随染料摩尔浓度变化的关系。(注意,摩尔浓度的范围包括,大幅度地,由整形和重建外科医生所采用的现行常规ICG染料给予方案产生的5.4-8 μΜ范围。然而,该范围对于所述关系而言更远地延伸到更高和更低的摩尔浓度。)However, in various embodiments, dye (eg, ICG) molarity can be determined by ratiometric analysis of 2 suitable near-infrared wavelengths beyond the wavelength band used to form the dye (eg, ICG) fluorescent image. For example, Figure 7 below shows the ratio of the intensity of the wavelength bands emitted by the ICG in blood centered approximately at the 850 nm and 900 nm wavelengths as a function of the molar concentration of the dye. (Note that the molarity range includes, by a large margin, the 5.4-8 μM range produced by current conventional ICG dye administration protocols employed by plastic and reconstructive surgeons. However, this range extends further for the relationship to higher and lower molar concentrations.)
在不同的实施方案中,比率染料(例如ICG)摩尔浓度测定的实施包括将光学和电子组件加入荧光成像路径中。按照一个实施方案,图8以示意图的方式显示了在加拿大,Mississauga的Novadaq Technologies Inc.的SPY©成像系统的情况下插入这些组件的实例。图8以示意图的方式显示成像系统10,其包括用于对来自组织40的荧光的荧光成像的CCD摄像机12和物镜14。如图8的实施方案所示,将光学和电子组件(例如组件16)加到荧光成像路径中可包括将所述组件布置在SPY®物镜14和CCD摄像机12之间。将来自图8所示2个Si光电探测器20和22的信号输出利用图7中的关系实时分析,并将针对各血管造影图像测定的所得的摩尔浓度嵌入其TIFF标题(header),随后按需提取以确定循环血液中的瞬间染料摩尔浓度。下面结合硬件执行的实例更详细地论述图8中的实施方案。In various embodiments, the implementation of ratiometric dye (eg, ICG) molarity assays includes incorporating optical and electronic components into the fluorescence imaging pathway. According to one embodiment, Figure 8 schematically shows an example of the insertion of these components in the context of the SPY© imaging system of Novadaq Technologies Inc., Mississauga, Canada. FIG. 8 shows, in schematic form, an
在不同的实施方案中,可在血管造影序列期间的任何时间,通过应用方程式(4)测定在压力脉冲峰值Lp下和在脉冲最小值Lm下的层厚度,然后计算两者之间的差异,来求出在压力脉冲期间发生的血液容积层厚度增加ΔL:In various embodiments, the slice thickness at the pressure pulse peakLp and at the pulse minimumLm can be determined at any time during the angiography sequence by applying equation (4), and then calculating the difference between the two difference to find the increase in hemovolume layer thickness, ΔL, that occurs during the pressure pulse:
ΔL= Lp - Lm = ln [(IeΦ - Im)/(IeΦ - Ip)](ε C)-I (5)ΔL= Lp - Lm = ln [(Ie Φ - Im )/(Ie Φ - Ip )](ε C)-I (5)
其中Lp和Lm是在脉冲峰值和最小值下测量的各自的荧光强度,和whereLp andLm are the respective fluorescence intensities measured at the pulse peak and minimum, and
其中L = ln [IeΦ/(IeΦ - If)] (εC)-I,其中,where L = ln [IeΦ/(IeΦ - If)] (εC)-I , where,
L = 面积A之下所有血管的血液层的合计厚度(cm)L = total thickness of the blood layer of all vessels below area A (cm)
Ie = 激发光强度(W cm-2)Ie = excitation light intensity (W cm-2 )
If = 发射荧光的强度(W cm-2)If = intensity of emitted fluorescence (W cm-2 )
ε = ICG摩尔吸收系数(M-1 cm-1)ε = ICG molar absorption coefficient (M-1 cm-1 )
Φ = ICG量子效率Φ = ICG quantum efficiency
(0.13)(0.13)
A = 目标面积(cm2)A = target area (cm2 )
C = ICG摩尔浓度(M)C = ICG molarity (M)
在血流脉冲的收缩峰值(LS)下和在其舒张最低值(LD)下测定L,然后如下计算通过目标组织面积(A)的流量:L is measured at the peak systolic (LS) and at its diastolic nadir (LD) of the blood flow pulse, and the flow through the target tissue area (A ) is then calculated as follows:
流量 = A (LS - LD)/时间,其中,时间按血流脉冲的持续时间计算。Flow = A (LS - LD )/time, where time is calculated as the duration of the blood flow pulse.
在不同的实施方案中,可采用例如图6所示实例算法所用的相同数据测定荧光强度Lp和Lm,其中形成血管造影片图像的压力脉冲周围的包迹线的平均强度水平用水平虚线表示。然而,在本实例中,将这2条水平线投射到曲线图右侧的相对荧光强度标尺:一条线与在1100处与纵坐标交叉,另一条线在1035处交叉。In a different embodiment, the fluorescence intensitiesLp andLm can be determined using the same data as used by the example algorithm shown in Figure 6, where the average intensity level of the envelope around the pressure pulse forming the angiogram image is represented by a horizontal dashed line express. However, in this example, these 2 horizontal lines are projected onto the relative fluorescence intensity scale on the right side of the graph: one line intersects the ordinate at 1100 and the other intersects the ordinate at 1035.
在不同的实施方案中,为了将Lp和Lm的这些相对强度水平转换成实际光强度水平(μW/cm2),通过按受控制的染料(例如ICG)荧光强度输入水平校准摄像机的灰度输出,将CCD摄像机用作光度计。In various embodiments, to convert these relative intensity levels ofLp andLm to actual light intensity levels (μW/cm2 ), the grayscale of the camera is calibrated by input levels of controlled dye (eg, ICG) fluorescence intensity degree output, using a CCD camera as a photometer.
校准方法经设计考虑到了总荧光(If,方程式3)以球状方式发射,并且仅其一部分被摄像机检测到,这取决于成像系统的光圈直径和光圈距发射源的距离。发现摄像机的输出从约50到2500 μW是线性的,使得:The calibration method is designed to take into account that the total fluorescence (If, Equation 3) isemitted in a spherical manner and only a portion of it is detected by the camera, depending on the aperture diameter of the imaging system and the distance of the aperture from the emission source. The output of the camera was found to be linear from about 50 to 2500 μW such that:
If (μW) = (平均强度 - 100)/413.012 (6),If (μW) = (average intensity - 100)/413.012 (6),
因此,Ip = 2.905 μW,Im= 2.749 μW。Therefore, Ip = 2.905 μW andIm = 2.749 μW.
注意,在获取图6所示血管造影片数据期间,Ie = 4.0 W,方程式(5)变成:ΔL =ln [((4000 x 10-3 x 0.13) - (2.749 x 10⁻³))/((4000 x 10-3x 0.13) -(2.905 x 10⁻³))](ε C)-1Note that during the acquisition of the angiogram data shown in Figure 6, Ie = 4.0 W and equation (5) becomes: ΔL = ln [((4000 x 10-3 x 0.13) - (2.749 x 10⁻³ )) /((4000 x 10-3 x 0.13) -(2.905 x 10⁻³ ))](ε C)-1
= 0.0005 mm= 0.0005 mm
将ΔL的该值代入方程式(1)中:F = (A) (ΔL) (PDO)/ΔtSubstitute this value of ΔL into equation (1): F = (A) (ΔL) (PDO )/Δt
= (250 mm2) (0.0005 mm) (0.40)/(0.680)= (250 mm2 ) (0.0005 mm) (0.40)/(0.680)
= 0.0735 mm3/sec或0.0735 ml/sec= 0.0735 mm3 /sec or 0.0735 ml/sec
该血流量(0.0735 ml/sec)是通过用于第一实例中的前述方法(0.147 ml/sec)计算的一半,使之更接近以全身生理参数为基础的0.0023 ml/sec的近似值。This blood flow (0.0735 ml/sec) is half that calculated by the previous method used in the first example (0.147 ml/sec), bringing it closer to the approximation of 0.0023 ml/sec based on systemic physiological parameters.
皮肤血流量的变化由多个生理参数的变化,以及由环境温度的变化诱导。为了测定这种变化的量,进行了这样的实验,其中各在快速注射0.33 ml 25 mg/ml ICG和5 ml盐水冲洗入对侧肘脉(contralateral cubicle vein)中后,记录32分钟时间内与上述实例相同的250 mm2面积的人前臂皮肤的2张ICG血管造影片。第1张血管造影片在约70° F的环境室温下记录,第2张紧接在以6英寸的距离暴露于来自24 W石英卤素灯的辐射约1分钟后记录;该温度感觉与在几英寸距离呼吸经口快速呼出产生的类似。Changes in skin blood flow are induced by changes in a number of physiological parameters, as well as by changes in ambient temperature. To determine the amount of this change, an experiment was performed in which each bolus injection of 0.33 ml of 25 mg/ml ICG and 5 ml of saline into the contralateral cubicle vein recorded a 32-minute period with Two ICG angiograms of the same 250mm2 area of human forearm skin as the above example. The first angiogram was recorded at ambient room temperature of about 70°F, and the second was recorded immediately after exposure to radiation from a 24 W quartz halogen lamp at a distance of 6 inches for about 1 minute; the temperature felt the same as in a few days Inch distance breathing through the mouth produces a similar rate of exhalation.
图9显示两个实验随时间变化的平均强度曲线的片段(顶行)以及其相应的关于时间曲线的一阶导数(底端行)。因为该实验在实施FM-PPG算法的校准部分之前进行,所以图底部的计算的皮肤面积血流量只是按相对项,而不是ml/sec的绝对项。然而,在略升高的温度下血流量是与环境室温相比的约1.4倍的事实,指示了在FM-PPG血流量测量中可预期的正常皮肤组织的变化范围,除非在数据采集时没有考虑温度和其它生理参数。Figure 9 shows a segment of the mean intensity curve over time for two experiments (top row) and its corresponding first derivative with respect to the time curve (bottom row). Because this experiment was performed prior to implementing the calibration portion of the FM-PPG algorithm, the calculated skin area blood flow at the bottom of the graph is only in relative terms, not absolute terms in ml/sec. However, the fact that blood flow is about 1.4 times higher at slightly elevated temperature compared to ambient room temperature, indicates the range of variation in normal skin tissue that can be expected in FM-PPG blood flow measurements, unless there is no Consider temperature and other physiological parameters.
按照本发明的FM-PPG方法和系统的一个实施方案,通过注射足够高浓度的ICG染料推注团将ICG静脉内给予受试者,在通过目标组织面积转运期间,峰值染料浓度将超过0.025 mg/ml (最大荧光强度,且其中如下文更详细的描述,开始浓度荧光猝灭)。在这些条件下,记录染料转运的血管造影片图像亚序列含有确定随图像灰度强度而变化的完整序列中各图像的ICG摩尔浓度所需要的信息,假设染料激发水平在整个血管造影片记录中是不变的,且荧光强度与CCD摄像机灰度输出是已知的。According to one embodiment of the FM-PPG method and system of the present invention, ICG is administered intravenously to a subject by injecting a bolus of ICG dye at a sufficiently high concentration that the peak dye concentration will exceed 0.025 mg during transport through the target tissue area /ml (maximum fluorescence intensity, and where, as described in more detail below, the onset concentration of fluorescence quenching). Under these conditions, the subsequences of angiogram images recording dye transport contain the information needed to determine the molar concentration of ICG for each image in the complete sequence as a function of image grayscale intensity, assuming that dye excitation levels are present in the entire angiogram recording is constant, and the fluorescence intensity and the grayscale output of the CCD camera are known.
在不同的实施方案中,为了抵消ICG染料荧光猝灭,开发了用于测定循环血中的ICG摩尔浓度的实时2-波长比率方法。它包括无特殊制剂,不偏离用于染料注射的从业人员的常用方案,也不必记录染料通过目标组织的转运期,但是在图像获取期间保持荧光激发强度在已知的恒定水平下,且当循环血被染料饱和或存在明显的血管染色时不进行血管造影术。在不同的实施方案中,波长比率方法的实施包括其它光学器件及硬件和软件用于与所获得的各图像一起同时测定2个近红外波长的带的强度,并用于将这些数据嵌入相应的图像标题。就血管造影片获取而言,这些附加件和事件对于并入它们的任何设备的操作者是完全显然的。在不同的实施方案中,在其进入常规临床应用之前,对各设备实施了其它校准步骤。In various embodiments, to counteract ICG dye fluorescence quenching, a real-time 2-wavelength ratiometric method was developed for the determination of ICG molar concentration in circulating blood. It includes no special preparation, does not deviate from the usual protocols of practitioners for dye injection, and does not have to record the transit period of the dye through the target tissue, but maintains the fluorescence excitation intensity at a known constant level during image acquisition, and when cycling Angiography is not performed when blood is saturated with dye or when there is significant vascular staining. In various embodiments, the implementation of the wavelength ratio method includes additional optics and hardware and software for simultaneous determination of the intensities of the 2 near-infrared wavelength bands along with each acquired image, and for embedding these data into the corresponding images title. As far as angiogram acquisition is concerned, these add-ons and events are completely obvious to the operator of any device incorporating them. In various embodiments, additional calibration steps are performed on each device before it enters routine clinical use.
硬件执行的实施例Hardware-implemented embodiment
按照一个实施方案,为了评价ICG摩尔浓度的比率方法,通过在如图8所示的物镜14和CCD摄像机12之间插入分束器16,对原型FM-PPG系统(例如图8所示成像系统10)的ICG荧光成像光程进行改进。在该实施方案中,分束器16发射用于图像拍摄的ICG荧光波长带30(约815-845 nm波长,其可通过带通滤光片23过滤),并将所有较高波长32 (例如波长> 845nm)转向平行路径(其可包括中继镜17),沿此路径光被第二分束器18进一步分开成波长小于约875 nm (波长34)和波长大于约875 nm (波长36)。在这些稍后路径的末端放置了近红外敏感的Si检测器(例如Si检测器20和22) (Thorlabs,PDA36A型Si Switchable GainDetector)。最初,分别将中心大约位于850 (滤光片24)和900 nm (滤光片26)的窄带宽滤光片插在检测器20和22各自的前面以接近正面激发荧光发射光谱数据,所述数据来自用于测定比率方法所依据的2波长的含有2、4、8、16和32 μΜ ICG(由Washington University,St. Louis的Berezen Lab 按照合约生产)的全血样品。随后的分析表明在另一个变动中,可采用更宽得多的带宽实现基本相同的比率分辨。因此,在该实施方案中,取出窄带宽滤光片,从而增加印在Si检测器上的光强度。值得注意的是,印在各Si检测器上的光经计算自各血管造影片图像中记录的整个视场产生。然而由于分析仪器可得性限制所致,第二分束器后光程和光对Si检测器的聚焦未被严格证实。According to one embodiment, to evaluate the ratiometric method of ICG molarity, a prototype FM-PPG system such as the imaging system shown in FIG. 10) The optical path of ICG fluorescence imaging is improved. In this embodiment,
软件执行的实施例Software Executed Embodiment
数据获取data collection
在该实施方案中,使各Si检测器放大器输出与高分辨率数字转换器(Advantech10M,12比特,4ch Simultaneous Analog Input Card,PCI-1714UL-BE型)的2个输入通道之一连接,并使来自CCD摄像机的触发器输出(trigger output)与数字转换器的触发器输入通道连接。通过λ-link软件将来自各通道的数字化输出插入所记录的各血管造影片图像的标题中。数字转换器连续每秒获取合计500k数据样品,其以来自3个输入通道每一个的等分部分轮转推导。当λ-link检出摄像机触发通道中超过1.5伏特阈值的上升(意味来自805 nm激光的5 msec脉冲的激发光的开启)时,开始来自其它2个通道的数据样品计数和记录。排除来自850 nm通道的前300个样品(以避免与激光脉冲上升时间有关的伪像),记录接下来的600个样品(按经验被确定为最适量),并排除其余样品;然后将相同的获取算法应用到来自900 nm通道的样品。当在激光脉冲结束时触发通道电压下降到1.5伏特以下时,启动程序以寻找高于阈值水平的下一次电压上升。In this embodiment, each Si detector amplifier output is connected to one of the 2 input channels of a high-resolution digitizer (Advantech 10M, 12-bit, 4ch Simultaneous Analog Input Card, type PCI-1714UL-BE), and the The trigger output from the CCD camera is connected to the trigger input channel of the digitizer. The digitized output from each channel was inserted into the header of each recorded angiogram image by λ-link software. The digitizer continuously acquires a total of 500k data samples per second, which are round-robin derived in aliquots from each of the 3 input channels. When the λ-link detects a rise above the 1.5 volt threshold in the camera trigger channel (meaning the on-off of the excitation light from the 5 msec pulse of the 805 nm laser), it starts counting and recording data samples from the other 2 channels. The first 300 samples from the 850 nm channel were excluded (to avoid artifacts related to laser pulse rise time), the next 600 samples were recorded (determined empirically as the optimum amount), and the rest were excluded; then the same The acquisition algorithm was applied to samples from the 900 nm channel. When the trigger channel voltage dropped below 1.5 volts at the end of the laser pulse, the program was initiated to look for the next voltage rise above the threshold level.
数据分析data analysis
构建了λ-link软件的分析部分,以φ-运动方式,提取同时嵌入各记录的血管造影片图像的光的850-和900 nm波长带的强度数据,自Si检测器放大器产生2串数字电压。每一串含有600个每次激发激光脉冲(即每图像)的数据样品,由此共1,200个数据样品保存在各图像标题中。将来自850 nm通道的电压样品的平均水平除以来自900 nm通道的样品的平均水平,得到被转化(通过校准曲线)成用于计算绝对组织灌注的ICG的μΜ浓度(C)的比率。The analysis part of the λ-link software was constructed to extract the intensity data of the 850- and 900-nm wavelength bands of light embedded in each recorded angiogram image simultaneously, in a φ-motion manner, to generate 2 strings of digital voltages from the Si detector amplifier . Each train contains 600 data samples per excitation laser pulse (ie, per image), whereby a total of 1,200 data samples are stored in each image header. The average level of the voltage samples from the 850 nm channel was divided by the average level of the samples from the 900 nm channel to obtain a ratio of the μM concentration (C ) of ICG that was converted (by the calibration curve) to calculate absolute tissue perfusion.
来自2个通道的数字化输出以及2-波长比率报告至6个小数位。依经验确定,40幅连续图像(约1.7秒钟中记录的数目)的滚动平均比率稳定至3个小数位,因此为了计算和报告目的删去最后3位。Digitized output from 2 channels and 2-wavelength ratio reporting to 6 decimal places. The rolling average ratio of 40 consecutive images (number recorded in approximately 1.7 seconds) was determined empirically to stabilize to 3 decimal places, so the last 3 digits were omitted for calculation and reporting purposes.
绘制2-波长比率与C校准曲线Plot 2-Wavelength Ratio vs.C Calibration Curve
与实施原型系统有关的校准曲线对于与其电子和光学组件两者(例如镜头光圈、激发激光功率、Si检测器放大等)有关的参数的具体组合是独特的,其许多已通过以观察为依据的实验优化。曲线的必要特征是:它是单调的、具有充分陡的斜率(正或负)以允许用于测定血液中的ICG浓度的适当分辨率、对于给定固定组的装置参数是可再现的、并且基本不依赖于样品厚度。The calibration curves associated with implementing the prototype system are unique to the specific combination of parameters associated with both its electronic and optical components (eg, lens aperture, excitation laser power, Si detector magnification, etc.), many of which have been validated by observation-based Experimental optimization. The necessary characteristics of the curve are that it is monotonic, has a sufficiently steep slope (positive or negative) to allow adequate resolution for determining ICG concentrations in blood, is reproducible for a given fixed set of device parameters, and Basically independent of sample thickness.
实验设置和数据获取Experimental setup and data acquisition
原型系统校准曲线的绘制基于新鲜获取的抗凝人全血的样品,其含有2、4、8、12和16 μΜ浓度的新鲜复溶的ICG染料。将3毫升各样品置于开盖培养皿中,产生1.764 mm厚具有大到足以完全充满所述装置的视场的表面积的血层。The calibration curves for the prototype system were drawn based on freshly obtained samples of anticoagulated human whole blood containing freshly reconstituted ICG dye at 2, 4, 8, 12 and 16 μΜ concentrations. Three milliliters of each sample was placed in an open-top petri dish, resulting in a 1.764 mm thick blood layer with a surface area large enough to completely fill the device's field of view.
将5个样品的每一个逐一置于成像系统10的物镜14下,记录约5秒长的血管造影图像序列;将这个过程尽可能快另重复两次,以避免悬浮于血浆中的红细胞沉淀。从各样品中取出0.5毫升血液,降低血液层厚度达0.294 mm,再次记录5个样品的3组血管造影序列。然后从各样品中取出另外0.5 ml血液,并记录最后3组血管造影序列。因此,从5个ICG/血液样品的每一个中获取9组比率数据,3组每组自来自3种不同的样品厚度。Each of the 5 samples was placed under the
出于比较目的,从具有与ICG/血液样品相同的ICG浓度范围的含ICG的乙醇的5个样品中,获取相同序列的比率数据。然而,在这种情况下,从每个样品层厚度5个样品的每一个仅记录一个血管造影序列而非3个。因吸收激发光能,尤其是对于较高的ICG浓度样品,加快了乙醇蒸发从而降低样品层厚度并增加样品浓度的事实,使得与ICG/血液方案必定有这样的偏差。For comparison purposes, ratio data for the same sequence was obtained from 5 samples of ICG-containing ethanol with the same ICG concentration range as the ICG/blood samples. In this case, however, only one angiographic sequence was recorded from each of the 5 samples per sample layer thickness instead of 3. Such a deviation from the ICG/blood protocol must be due to the fact that absorption of excitation light energy, especially for higher ICG concentration samples, accelerates ethanol evaporation, thereby reducing sample layer thickness and increasing sample concentration.
图10和11分别表示样品厚度对针对含ICG的乙醇和含ICG的人血绘制的2-波长比率校准曲线的作用。尽管就发射的荧光强度随ICG浓度变化而言,含ICG的全血、血清和乙醇的溶液显示类似性质,图10和11中的曲线说明了就用于绘制2-波长比率校准曲线所用发射波长的带强度间的关系而言,血液和乙醇溶液之间显著不同的,性质尤其在较低的染料浓度下。与ICG和两种溶质之间的化学相互作用(例如缔合和相互作用)的差异有关的Beer-Lambert定律的分解(breakdown)可说明这种差异。按经验推导的含ICG的血液的校准曲线符合本说明书中上文描述的目前了解的必要特性。Figures 10 and 11 show the effect of sample thickness on 2-wavelength ratio calibration curves plotted for ICG-containing ethanol and ICG-containing human blood, respectively. Although solutions containing ICG in whole blood, serum, and ethanol exhibited similar behavior in terms of the fluorescence intensity emitted as a function of ICG concentration, the curves in Figures 10 and 11 illustrate the emission wavelengths used to draw the 2-wavelength ratio calibration curves. In terms of the relationship between the band intensities, the properties were significantly different between blood and ethanol solutions, especially at lower dye concentrations. A breakdown of the Beer-Lambert law related to differences in chemical interactions (eg, association and interaction) between the ICG and the two solutes may account for this difference. The empirically derived calibration curve for ICG-containing blood conforms to the currently understood necessary properties described above in this specification.
为了利用结合计算组织灌注的软件嵌入式算法的校准曲线,它必须是以数字格式可存取的,并且对于软件呈现为连续的函数,即使在该实施例中,它也只由5个数据点绘制。这可通过找出描绘通过全部5个点的平滑曲线来实现。遗憾的是,未找到令人满意的适合的线性或二阶多项式,因此手工绘制了的确通过全部5个点的曲线图;并从中推导12个另外的数据点,得到图12中的曲线。在共17数据点间内推软件程序。校准曲线见图12。如图13所示,沿曲线的比率数据的平均变化平均为+/-0.014。In order to utilize a calibration curve in conjunction with a software-embedded algorithm that calculates tissue perfusion, it must be accessible in digital format and presented to the software as a continuous function, even in this example, it consists of only 5 data points draw. This can be done by finding a smooth curve that traces through all 5 points. Unfortunately, no satisfactory fitting linear or second order polynomial was found, so a graph was manually drawn that did pass through all 5 points; and 12 additional data points were derived therefrom, resulting in the curve in Figure 12. The software program was interpolated between a total of 17 data points. The calibration curve is shown in Figure 12. As shown in Figure 13, the average change in ratio data along the curve averaged +/- 0.014.
现行校准数据与来自Berezin实验室的校准数据的比较Comparison of current calibration data with calibration data from Berezin's laboratory
委托华盛顿大学医学院的Berezin实验室(St. Louis,MO)从含有不同浓度的ICG的人血中生成荧光数据,其用于确定绘制比率校准曲线的最适波长。Berezin实验室是具有可用荧光分光光度计的少数机构之一,其光谱范围远到足以深入近红外区以产生证实原始数据所需要的高分辨率数据,2-波长比率方法和系统以所述光谱范围为基础。The Berezin laboratory (St. Louis, MO) at Washington University School of Medicine was commissioned to generate fluorescence data from human blood containing various concentrations of ICG, which were used to determine the optimal wavelengths for drawing ratio calibration curves. Berezin's lab is one of the few institutions with available spectrofluorometers with a spectral range far enough into the near-infrared region to generate the high-resolution data needed to corroborate the original data, 2-wavelength ratio methods and systems based on the spectral range range-based.
就噪声水平和分辨率而言,预期2条校准曲线将不同,因为Berezin装置有效地具有单一光学路径(通道),并使用同一检测器获取全部波长数据,而原型系统具有2个独立的路径,并使用两个不同的检测器以及两种不同的信号放大器等。两种装置都能够产生符合本说明书中的上述最少必需特征的校准曲线,即使曲线看起来不同。The 2 calibration curves are expected to be different in terms of noise level and resolution, since the Berezin setup effectively has a single optical path (channel) and uses the same detector to acquire all wavelength data, whereas the prototype system has 2 separate paths, And use two different detectors and two different signal amplifiers etc. Both devices are capable of producing calibration curves that meet the minimum required characteristics described above in this specification, even if the curves look different.
在比较图12的曲线和图13的曲线(其中十字为数据点)时证实,它们十分不同:尽管两者都是单调的,它们的斜率相反,且Berezin数据的比率范围约大5倍。但是这些无一使原型系统的曲线无效。实际上,通过将Berezin曲线的比率标尺归一化至原型系统的比率标尺(这抵消与信号强度和放大有关的差异),并通过改变Berezin数据比率标尺的方向(使曲线倒转,从而改变其斜率),得到与原型系统严密匹配的图14的曲线(其中转圈为数据点),如图14所示。Comparing the curves of Figure 12 with the curves of Figure 13 (where the crosses are the data points) confirms that they are quite different: although both are monotonic, their slopes are opposite, and the Berezin data have about a 5-fold larger range of ratios. But none of these invalidated the curves of the prototype system. In effect, by normalizing the ratio scale of the Berezin curve to that of the prototype system (this cancels out the differences related to signal strength and amplification), and by changing the direction of the Berezin data ratio scale (inverting the curve, thus changing its slope ), resulting in the curve of Figure 14 (where the circles are the data points) that closely matches the prototype system, as shown in Figure 14.
用于使Berezin数据比率标尺归一化的变换函数如下:The transformation function used to normalize the Berezin data ratio scale is as follows:
R1 = (R0/5.796) + 1.858R1 = (R0 /5.796) + 1.858
其中:in:
R0是Berezin比率标尺上的原始数据点值;R0 is the raw data point value on the Berezin ratio scale;
R1是在原型装置比率标尺上绘制的变换点值;R1 is the transformation point value plottedon the prototype device ratio scale;
5.796是Berezin比率数据范围与原型装置的比率数据范围相比更大多少倍(2和16 μΜ比率值的差异);和5.796 is how many times larger the Berezin ratio data range is compared to the ratio data range of the prototype device (difference in ratio values of 2 and 16 μΜ); and
1.858是16 μΜ Berezin样品的R1籍以在原型装置的标尺(在Berezin曲线倒转后)上为使之对应于原型装置的2 μΜ数据点的位置而移位的量。1.858 is the amount by which the R1 of the 16 μM Berezin sample was shifted on the scale of the prototype device (after the Berezin curve was inverted) to correspond to the position of the 2 μM data point of the prototype device.
原型系统数据的计算机生成的二阶多项式曲线(标记为“Power”)不太契合;这一点因其通过8或16 μΜ浓度两者的“+”数据点分散范围(spread)的偏斜度而突显。The computer-generated second-order polynomial curve (labeled "Power") of the prototype system data does not fit well; this is due to the skewness of the spread of "+" data points through both 8 or 16 μM concentrations. highlighted.
然而,值得注意的是,Berezin数据的转换并倒转的“Power”曲线全部位于原型装置的“Power”曲线的平均变化性包迹线内,如数据点的分散范围所描绘。这表明Berezin和原型装置数据两者的点间关系的绝对值基本相同。因此,根据现行可获得的最佳度量,用于测定血液中的ICG浓度的硬件和软件显得经优化并适于人受试者评价。It is worth noting, however, that the transformed and inverted "Power" curves of the Berezin data all lie within the mean variability envelope of the "Power" curves of the prototype device, as depicted by the spread of data points. This indicates that the absolute value of the point-to-point relationship between the Berezin and the prototype device data is substantially the same. Therefore, hardware and software for determining ICG concentrations in blood appear to be optimized and suitable for evaluation in human subjects according to the best metric currently available.
绝对组织灌注算法的验证Validation of the absolute tissue perfusion algorithm
由于缺乏有关通过不同组织的绝对血流量水平的已公开数据,因此在基础实验室台上实验之外,组织灌注分析程序的验证是有困难的。没有有关容易获取的组织的可用数据用于比较,算法和原型装置在活组织中概念验证在此之前(heretofore)与自前臂内侧获得的血管造影片数据的分析结合。Validation of tissue perfusion analysis procedures outside of basic laboratory bench-top experiments is difficult due to the lack of published data on absolute blood flow levels through different tissues. No data were available on readily available tissue for comparison, and the algorithm and prototype device proof-of-concept in living tissue was heretofore combined with analysis of angiography data obtained from the medial forearm.
从可用作比较金标准的无需侵入性程序容易获得的组织中以绝对项提供的唯一血流量数据来源于Alm和Bill (Exp. Eye Res. 15: 15-29, 1973)的猕猴眼组织。采用充分确立的放射性标记的微球体注射方法,得到这些数据,以mg /min/ mm2为单位提供。将他们的数据转换成μL/sec/mm2需要仅已知血液的平均密度为1.06 x 103kg/m3,便容易推导出下列关系:The only blood flow data provided in absolute terms from tissue readily available without invasive procedures that can be used as a comparison gold standard is from macaque eye tissue from Alm and Bill (Exp. Eye Res. 15: 15-29, 1973). These data were obtained using the well established radiolabeled microsphere injection method and are presented in mg/min/mm2 . Converting their data to μL/sec/mm requires only knowing that the mean density of blood is 1.06 x 10³ kg/m 3, it is easy to derive the following relationship:
X (mg /min/ mm2)/63.6 = X (μL /sec/ mm2)X (mg/min/ mm2 )/63.6 = X (μL/sec/ mm2 )
按照一个实施方案,为了获取眼组织的血管造影术数据,可使用眼底摄像机。然而,眼底摄像机没有提供对于循环血中ICG浓度(C)的比率测定所需的额外的两个波长的数据的同时获取。然而,有测定在ICG推注团转运期间何时达到32.2 μΜ的浓度的备选方法,并且在这时记录的短序列的图像可通过FM-PPG算法分析,可将其结果与Alm和Bill的结果进行比较。According to one embodiment, to acquire angiographic data of ocular tissue, a fundus camera may be used. However, fundus cameras do not provide simultaneous acquisition of the additional two wavelengths of data required for ratiometric determination of circulating blood ICG concentrations (C ). However, there is an alternative method of determining when a concentration of 32.2 μM is reached during ICG bolus delivery, and short sequences of images recorded at this time can be analyzed by the FM-PPG algorithm, the results of which can be compared with Alm and Bill’s results are compared.
一种备选方法基于浓度荧光猝灭,一种由溶液中的ICG染料显示的现象,其中溶液发射的荧光强度随着染料浓度增加直到达到这样的点:超过该点浓度进一步增加导致荧光减少。对于含ICG的血液,最大荧光出现在0.025 mg/ml的浓度下;超过或低于该浓度,相当急剧地发生荧光减少。当注射的ICG推注团在血管网中转运且染料浓度增加时,ICG荧光也增强,并且当染料浓度达到0.025 mg/ml时达到最大强度。当浓度继续增加时,荧光因浓度荧光猝灭所致减弱,在浓度达到其最大时达到最小强度。此后,浓度降低,引起荧光强度增强,直到它再次达到0.025 mg/ml的最大水平;然后当浓度继续降低时,荧光也开始再次减弱。因此,其中发生猝灭的ICG眼底血管造影片的序列图像编号与总体图像亮度的曲线中会含有相等荧光强度的不同双峰。可通过注射充分高浓度和高容积完整性的ICG推注团,在眼血管系统中诱导所述猝灭,但是只有当染料注射和紧接着适当容积的盐水冲洗快速进行时。An alternative approach is based on concentration fluorescence quenching, a phenomenon exhibited by ICG dyes in solution, where the intensity of fluorescence emitted by solution increases with dye concentration until a point is reached beyond which further increase in concentration results in a decrease in fluorescence. For ICG-containing blood, maximum fluorescence occurs at a concentration of 0.025 mg/ml; above or below this concentration, the decrease in fluorescence occurs rather sharply. When the injected ICG bolus was transported in the vascular network and the dye concentration increased, ICG fluorescence also increased and reached a maximum intensity when the dye concentration reached 0.025 mg/ml. As the concentration continues to increase, the fluorescence decreases due to concentration fluorescence quenching, reaching a minimum intensity when the concentration reaches its maximum. After that, the concentration decreased, causing the fluorescence intensity to increase until it again reached a maximum level of 0.025 mg/ml; then as the concentration continued to decrease, the fluorescence also began to decrease again. Consequently, the plot of sequential image number versus overall image brightness for an ICG fundus angiogram in which quenching occurs will contain distinct doublets of equal fluorescence intensity. Such quenching can be induced in the ocular vasculature by injecting a bolus of ICG of sufficiently high concentration and high volume integrity, but only if the dye injection followed by an appropriate volume of saline flush occurs rapidly.
第二种备选方法基于在转运到眼部血管期间肘脉注射的染料推注团所经历的先前确定量的稀释(Invest. Ophthal. 12:881-895, 1973):普通成年猕猴中310倍,在普通成人中600倍。此外,可采用总体图像亮度与ICG眼底血管造影片序列的图像编号的曲线,这时只是测定在峰值亮度期间获得的血管造影片图像亚集。然后将峰值亮度与注射的染料推注团浓度的ICG浓度1/600 (人中)或1/310 (猕猴中)关联。A second alternative method is based on a previously determined dilution (Invest. Ophthal. 12:881-895, 1973) of the cubital injected dye bolus experienced during transport into the ocular vessels: 310-fold in common adult rhesus monkeys , 600 times that of the average adult. In addition, a curve of overall image brightness versus image number of an ICG fundus angiogram sequence can be used, in which case only a subset of angiography images obtained during peak brightness are measured. Peak brightness was then correlated to ICG concentrations 1/600 (in humans) or 1/310 (in cynomolgus monkeys) of the injected dye bolus concentration.
来自猕猴眼的验证数据Validation data from macaque eyes
在该实施例中,受试者是经麻醉的8.79 kg猕猴(几乎与短尾猴(cynomolgusmonkey)相同)的扩瞳(dilated)右眼。记录3个血管造影序列,如下:In this example, the subject was the dilated right eye of an anesthetized 8.79 kg rhesus monkey (almost identical to cynomolgus monkey).
序列1—隐静脉注射0.1 ml (25 mg/0.7ml ICG溶液)紧接快速3.0 ml盐水冲洗。Sequence 1—Saphenous vein injection of 0.1 ml (25 mg/0.7 ml ICG solution) followed by a rapid 3.0 ml saline flush.
序列2—3.0分钟后,无其它染料注射Sequence 2 - 3.0 minutes later with no other dye injections
序列3—3.0分钟后,隐静脉注射0.1 ml (25 mg/0.5ml ICG溶液)紧接快速3.0 ml盐水冲洗。
对于各序列的分析,绘制第一序列的图像亮度(总强度)与图像编号的时间曲线,如图15所示。根据该曲线,确定图像490-565的亚序列处于峰值亮度。由于未检出双峰,因此采用如前所述的用于测定循环血中ICG浓度的第二种备选方法。即,第一次注射的ICG推注团的浓度为25 mg/0.7 ml = 35.7 mg/ml,在其转运至眼期间,被稀释310倍至0.115 mg/ml的浓度。因此,眼血管中染料的峰值浓度(对应于图像490-565)为148 μΜ;将该值录入分析窗的合适的框内代替可获得的2-波长比率数据。For the analysis of each sequence, a time curve of image brightness (total intensity) versus image number for the first sequence was plotted, as shown in FIG. 15 . From this curve, it is determined that the subsequence of images 490-565 is at peak brightness. Since no double peaks were detected, a second alternative method for the determination of circulating blood ICG concentrations as previously described was used. That is, the concentration of the ICG bolus for the first injection was 25 mg/0.7 ml = 35.7 mg/ml, which was diluted 310-fold to a concentration of 0.115 mg/ml during its transport to the eye. Therefore, the peak concentration of the dye in the ocular vessels (corresponding to images 490-565) was 148 μM; this value was entered in the appropriate box of the analysis window in place of the available 2-wavelength ratio data.
针对所得图像490-565生成第二曲线,选择2个连续血流脉冲间的谷值(绿色正方形)。同时,如图16所示,还生成表明每次脉冲的计算血流量以及平均流量(0.058 μL/sec/mm2)的表格。总的来说,对于图17所示第二血管造影片序列,遵循相同程序。根据该曲线,选择图像300-381亚集,基于该亚集中脉冲的强度(0.0204)计算相应的ICG染料浓度(C),并与第一序列中峰值亮度的强度(0.0595,其相当于148 μΜ浓度)进行比较。于是,148 μΜ/0.0595 =C/0.0204,因此C = 50.7 μΜ。A second curve was generated for the resulting images 490-565, selecting the valley (green square) between 2 consecutive blood flow pulses. At the same time, as shown in FIG. 16 , a table showing the calculated blood flow per pulse and the average flow (0.058 μL/sec/mm2 ) was also generated. In general, the same procedure was followed for the second angiogram sequence shown in FIG. 17 . From this curve, a subset of images 300-381 was selected, and the corresponding ICG dye concentration (C ) was calculated based on the intensity of the pulses in this subset (0.0204) and compared with the intensity of the peak brightness in the first sequence (0.0595, which corresponds to 148 μM concentration) for comparison. Thus, 148 μM/0.0595=C /0.0204, thusC =50.7 μM.
针对所得图像300-381生成第二曲线,选择5个连续血流脉冲间的谷值(正方形)。同时,如图18中所示,还生成了表明每次脉冲的计算血流量以及平均流量(0.055 μL/sec/mm2)的表格。最后,将相同的程序应用于第3个序列,得到曲线图和表格,其中曲线图见图19。A second curve was generated for the resulting images 300-381, selecting the valleys (squares) between 5 consecutive blood flow pulses. At the same time, as shown in FIG. 18, a table showing the calculated blood flow per pulse and the average flow (0.055 μL/sec/mm2 ) was also generated. Finally, the same procedure was applied to the 3rd sequence, resulting in a graph and table, with the graph shown in Figure 19.
此外,根据该曲线图,确定图像260-290的亚序列处于峰值亮度,并计算转运中稀释后的循环血中ICG的浓度。这次,注射的ICG推注团的浓度为25 mg/0.5 ml = 50.0 mg/ml,在其转运到眼时被稀释310倍达到0.161 mg/ml的浓度。因此,眼血管中染料的峰值浓度(对应于图像260-290)为207 μΜ。In addition, from this graph, the subsequence of images 260-290 was determined to be at peak luminance, and the concentration of ICG in the circulating blood diluted in transit was calculated. This time, the injected ICG bolus had a concentration of 25 mg/0.5 ml = 50.0 mg/ml, which was diluted 310-fold to a concentration of 0.161 mg/ml when it was transported to the eye. Therefore, the peak concentration of the dye in the ocular vessels (corresponding to images 260-290) is 207 μM.
针对所得图像260-290生成第二曲线图,选择2个连续血流脉冲间的谷值(绿色正方形)。同时,按20图所示,生成表明每次脉冲的计算血流量以及平均流量(0.105 μL/sec/mm2)的表格。A second graph is generated for the resulting images 260-290, selecting the valley (green square) between 2 consecutive blood flow pulses. At the same time, as shown in Fig. 20, a table showing the calculated blood flow per pulse and the average flow (0.105 μL/sec/mm2 ) was generated.
从同一眼的3个连续血管造影片的上述分析得到0.058、0.055和0.105 μL/sec/mm2的脉络膜血流量,将其全部与如Alm和Bill报告的和下面最后部分描述的0.0866 μL/sec/mm2的金标准流量相比有利。Choroidal blood flow of 0.058, 0.055 and 0.105 μL/sec/mm2 was obtained from the above analysis of 3 consecutive angiograms from the same eye, all of which were compared with 0.0866 μL/sec as reported by Alm and Bill and described in the last section below This compares favorably to the gold standard flow rate of /mm2 .
来自短尾猴眼的放射性标记的微球体数据(“金标准”)Radiolabeled microsphere data from cynomolgus monkey eyes ("gold standard")
图21左边的图像(图21 A)是来自人眼血管造影片的图像。在右边的图像(图21B)中,左边图像(图21A)所示视网膜区表示为在来自由Alm和Bill在他们的实验中所用的一只猴的左眼的平铺脉络膜的放射自显影图上叠合的方框。中间的孔是因除去视神经所致。黑色斑点表示截留的微球体,斑点的密度是血液流速的度量。被红色方框包围的区域包括中心凹注视和视乳头周围区域,按照其来自17个受试者的结果,分别具有6.49和4.53 mg/min/mm2的血流量。这些数据转化成所包括区域的0.866 μL/sec/mm2的平均流速。The image on the left of Figure 21 (Figure 21 A) is an image from an angiogram of the human eye. In the right image (FIG. 21B), the retinal area shown in the left image (FIG. 21A) is represented as an autoradiogram in the tiled choroid from the left eye of a monkey used by Alm and Bill in their experiments superimposed boxes. The hole in the middle is due to the removal of the optic nerve. Black spots represent entrapped microspheres, and the density of the spots is a measure of blood flow rate. The area enclosed by the red box includes the foveal fixation and the peripapillary region, which have blood flow of 6.49 and 4.53 mg/min/mm2 , respectively, according to their results from 17 subjects. These data were translated into an average flow rate of 0.866 μL/sec/mm2 for the included area.
因此,按照不同的实施方案,研究了材料(例如组织)中光的吸收和该材料中吸收剂的浓度之间的物理关系,且将这种关系用作定量血流量的工具。按照不同的实施方案,因为可独立地测定上述所有变量,所以根据所述测定中,可测定吸收剂随时间的变化(例如应用Beer-Lambert定律,亦称Beer定律、Lambert-Beer定律或Beer-Lambert-Bouguer定律)以给出血流量(绝对血流量)的表示(representation)。在不同的实施方案中,Beer-Lambert定律应用于利用时间作为血流量的度量,使用荧光染料(其中荧光给出吸收的指示)作为血液中荧光染料的浓度的指示。Therefore, according to various embodiments, the physical relationship between the absorption of light in a material (eg, tissue) and the concentration of the absorber in the material is investigated and used as a tool to quantify blood flow. According to various embodiments, since all of the above variables can be determined independently, the change in the absorbent over time can be determined according to the assay (eg applying the Beer-Lambert law, also known as Beer's law, Lambert-Beer law or Beer- Lambert-Bouguer law) to give a representation of blood flow (absolute blood flow). In various embodiments, the Beer-Lambert law is applied using time as a measure of blood flow, using fluorescent dyes (where fluorescence gives an indication of absorption) as an indication of the concentration of the fluorescent dye in the blood.
在不同的实施方案中,独立地测定上述所有变量。然而,最困难的方面涉及测定在任何时间的血液的瞬间浓度。荧光染料例如ICG随浓度稍稍改变其光谱。按照不同的实施方案,测定瞬间浓度的方法的实例包括采用荧光比率。例如,可采用两个不同波段的比率。按照一个实施方案,两个不同的波长带可包括目标波长带(即用于进行成像的带),并将荧光被分成3个带。在不同的实施方案中,可通过取两个波长带用于测定荧光比率,并且同时使用整个光谱以成像(例如时间复用),来解决低的信号限制。在不同的其它实施方案中,可通过查看荧光染料的吸收而不是查看荧光来完成评价。在该实施方案中,可检出较高的信号。In various embodiments, all of the above variables are determined independently. However, the most difficult aspect involves determining the instantaneous concentration of blood at any time. Fluorescent dyes such as ICG slightly change their spectrum with concentration. According to various embodiments, an example of a method of determining the instantaneous concentration includes the use of fluorescence ratios. For example, a ratio of two different bands can be used. According to one embodiment, the two different wavelength bands may include the wavelength band of interest (ie, the band used for imaging), and the fluorescence is divided into 3 bands. In various embodiments, the low signal limitation can be addressed by taking two wavelength bands for fluorescence ratio determination, and simultaneously using the entire spectrum for imaging (eg, time multiplexing). In various other embodiments, the evaluation can be done by looking at the absorption of the fluorescent dye instead of looking at the fluorescence. In this embodiment, a higher signal can be detected.
虽然结合详细描述和显示的不同实施方案说明并描述了本发明,但是无意受限于所示细节,因为可在不以任何方式偏离本发明的范围的情况下进行各种变动和结构变化。可对所示实施方案以及本发明的其它实施方案的形式、组件的排列、操作的步骤、细节和顺序进行各种改动而不以任何方式偏离本发明的范围,并且在参照本说明书时对本领域技术人员而言将是显而易见的。因此,预期随附权利要求书会涵盖所述改动和实施方案,因为它们落入本发明的真实范围内。While the invention has been illustrated and described in connection with the various embodiments described in detail and shown, it is not intended to be limited to the details shown, since various modifications and structural changes may be made without departing in any way from the scope of the invention. Various changes may be made in the form, arrangement of components, steps, details and sequence of operations of the illustrated embodiment as well as other embodiments of the invention without departing in any way from the scope of the invention and, upon reference to this specification, are It will be obvious to the skilled person. Therefore, it is intended that the appended claims cover such modifications and embodiments as fall within the true scope of this invention.
Claims (12)
Translated fromChinesePriority Applications (1)
| Application Number | Priority Date | Filing Date | Title |
|---|---|---|---|
| CN202010423399.XACN112515652A (en) | 2013-06-14 | 2014-06-16 | Quantification of absolute blood flow in tissue using fluorescence-mediated photoplethysmography |
Applications Claiming Priority (3)
| Application Number | Priority Date | Filing Date | Title |
|---|---|---|---|
| US201361835408P | 2013-06-14 | 2013-06-14 | |
| US61/835408 | 2013-06-14 | ||
| PCT/IB2014/002184WO2015001427A2 (en) | 2013-06-14 | 2014-06-16 | Quantification of absolute blood flow in tissue using fluorescence mediated photoplethysmography |
Related Child Applications (1)
| Application Number | Title | Priority Date | Filing Date |
|---|---|---|---|
| CN202010423399.XADivisionCN112515652A (en) | 2013-06-14 | 2014-06-16 | Quantification of absolute blood flow in tissue using fluorescence-mediated photoplethysmography |
Publications (2)
| Publication Number | Publication Date |
|---|---|
| CN105658138A CN105658138A (en) | 2016-06-08 |
| CN105658138Btrue CN105658138B (en) | 2020-06-16 |
Family
ID=52019808
Family Applications (2)
| Application Number | Title | Priority Date | Filing Date |
|---|---|---|---|
| CN201480044769.1AActiveCN105658138B (en) | 2013-06-14 | 2014-06-16 | Quantification of absolute blood flow in tissue using fluorescence-mediated photoplethysmography |
| CN202010423399.XAPendingCN112515652A (en) | 2013-06-14 | 2014-06-16 | Quantification of absolute blood flow in tissue using fluorescence-mediated photoplethysmography |
Family Applications After (1)
| Application Number | Title | Priority Date | Filing Date |
|---|---|---|---|
| CN202010423399.XAPendingCN112515652A (en) | 2013-06-14 | 2014-06-16 | Quantification of absolute blood flow in tissue using fluorescence-mediated photoplethysmography |
Country Status (8)
| Country | Link |
|---|---|
| US (1) | US10285603B2 (en) |
| EP (1) | EP3007618B1 (en) |
| JP (1) | JP6310550B2 (en) |
| KR (2) | KR20160019950A (en) |
| CN (2) | CN105658138B (en) |
| CA (1) | CA2913692A1 (en) |
| HK (1) | HK1222527A1 (en) |
| WO (1) | WO2015001427A2 (en) |
Families Citing this family (25)
| Publication number | Priority date | Publication date | Assignee | Title |
|---|---|---|---|---|
| US20070122344A1 (en) | 2005-09-02 | 2007-05-31 | University Of Rochester Medical Center Office Of Technology Transfer | Intraoperative determination of nerve location |
| US20080161744A1 (en) | 2006-09-07 | 2008-07-03 | University Of Rochester Medical Center | Pre-And Intra-Operative Localization of Penile Sentinel Nodes |
| US8406860B2 (en) | 2008-01-25 | 2013-03-26 | Novadaq Technologies Inc. | Method for evaluating blush in myocardial tissue |
| US10492671B2 (en) | 2009-05-08 | 2019-12-03 | Novadaq Technologies ULC | Near infra red fluorescence imaging for visualization of blood vessels during endoscopic harvest |
| WO2013190391A2 (en) | 2012-06-21 | 2013-12-27 | Novadaq Technologies Inc. | Quantification and analysis of angiography and perfusion |
| US10426361B2 (en) | 2013-06-14 | 2019-10-01 | Novadaq Technologies ULC | Quantification of absolute blood flow in tissue using fluorescence-mediated photoplethysmography |
| CN105658138B (en) | 2013-06-14 | 2020-06-16 | 诺瓦达克技术公司 | Quantification of absolute blood flow in tissue using fluorescence-mediated photoplethysmography |
| HK1244873A1 (en) | 2014-09-29 | 2018-08-17 | Novadaq Technologies Inc. | Imaging a target fluorophore in a biological material in the presence of autofluorescence |
| CA2963450A1 (en)* | 2014-10-09 | 2016-04-14 | Novadaq Technologies Inc. | Quantification of absolute blood flow in tissue using fluorescence-mediated photoplethysmography |
| CN107530452A (en) | 2015-02-02 | 2018-01-02 | 诺瓦达克技术公司 | Methods and systems for characterizing tissue of a subject |
| JP6640334B2 (en)* | 2015-09-23 | 2020-02-05 | ノバダック テクノロジーズ ユーエルシー | Methods and systems for management of data derived from medical imaging |
| WO2017051230A1 (en) | 2015-09-23 | 2017-03-30 | Novadaq Technologies Inc. | Methods and systems for assessing healing of tissue |
| EP3416547A4 (en)* | 2016-02-16 | 2019-08-14 | Novadaq Technologies ULC | FACILITATION OF EVALUATION OF BLOOD FLOW AND TISSUE PERFUSION BY FLUORESCENCE-MEDIATED PHOTOPLETHYSMOGRAPHY |
| US10335045B2 (en) | 2016-06-24 | 2019-07-02 | Universita Degli Studi Di Trento | Self-adaptive matrix completion for heart rate estimation from face videos under realistic conditions |
| WO2018018160A1 (en) | 2016-07-29 | 2018-02-01 | Novadaq Technologies ULC | Methods and systems for characterizing tissue of a subject utilizing machine learning |
| EP3580609B1 (en) | 2017-02-10 | 2023-05-24 | Stryker European Operations Limited | Open-field handheld fluorescence imaging systems and methods |
| EP3540494B1 (en) | 2018-03-16 | 2022-11-23 | Leica Instruments (Singapore) Pte. Ltd. | Augmented reality surgical microscope and microscopy method |
| AU2019285086B2 (en)* | 2018-06-14 | 2025-03-27 | Perfusion Tech Aps | System and method for automatic perfusion measurement |
| US11911139B2 (en) | 2018-06-14 | 2024-02-27 | Perfusion Tech Aps | System and method for automatic perfusion measurement |
| JP6659784B2 (en)* | 2018-08-17 | 2020-03-04 | ノバダック テクノロジーズ ユーエルシー | Quantifying absolute blood flow in tissue using fluorescence-mediated photoelectric plethysmography |
| CN119366875A (en)* | 2018-09-27 | 2025-01-28 | 史赛克公司 | System and method for pipeline fluid characterization |
| CN111323846A (en)* | 2018-12-13 | 2020-06-23 | 核工业二0八大队 | Multi-element ore control factor combined quantitative ore formation prediction method |
| EP3808275A1 (en) | 2019-10-14 | 2021-04-21 | Koninklijke Philips N.V. | Perfusion angiography combined with photoplethysmography imaging for peripheral vascular disease assessment |
| JP6834040B2 (en)* | 2020-02-06 | 2021-02-24 | ノバダック テクノロジーズ ユーエルシー | Quantification of absolute blood flow in tissues using fluorescence-mediated photoelectric volumetric pulse wave recording |
| CN114190893B (en)* | 2021-12-09 | 2024-01-05 | 吉林大学 | Blood circulation assessment device and method after replantation of severed limb and free flap operation |
Family Cites Families (26)
| Publication number | Priority date | Publication date | Assignee | Title |
|---|---|---|---|---|
| SE8901358D0 (en)* | 1989-04-14 | 1989-04-14 | Radi Medical System | PUT TO MEET THE FLOW IN A BLOOD BLOOD AND DEVICE |
| CN1121798A (en)* | 1994-08-16 | 1996-05-08 | 北京工业大学 | Cardiovascular function dynamic parameter testing analysis method and apparatus |
| US6982431B2 (en) | 1998-08-31 | 2006-01-03 | Molecular Devices Corporation | Sample analysis systems |
| US20050182434A1 (en) | 2000-08-11 | 2005-08-18 | National Research Council Of Canada | Method and apparatus for performing intra-operative angiography |
| US6577884B1 (en)* | 2000-06-19 | 2003-06-10 | The General Hospital Corporation | Detection of stroke events using diffuse optical tomagraphy |
| GR1004180B (en) | 2000-03-28 | 2003-03-11 | ����������� ����� ��������� (����) | Method and system for characterization and mapping of tissue lesions |
| US7474906B2 (en) | 2001-05-22 | 2009-01-06 | Alfred E. Mann Institute For Biomedical Engineering At The University Of Southern California | Method for dye injection for the transcutaneous measurement of cardiac output |
| CN1229074C (en)* | 2002-07-09 | 2005-11-30 | 医能生物科技股份有限公司 | Pulse information measuring method and equipment for pickingup pulse pressure and blood flow at same time |
| JP4537681B2 (en) | 2003-09-24 | 2010-09-01 | 株式会社東芝 | Blood flow analyzer |
| US20060011853A1 (en) | 2004-07-06 | 2006-01-19 | Konstantinos Spartiotis | High energy, real time capable, direct radiation conversion X-ray imaging system for Cd-Te and Cd-Zn-Te based cameras |
| WO2006086442A2 (en) | 2005-02-08 | 2006-08-17 | Case Western Reserve University | Method of detecting abnormal tissue |
| DE602006010831D1 (en) | 2005-03-14 | 2010-01-14 | Philips Intellectual Property | METHOD AND DEVICE FOR DETERMINING THE BLOOD IN A BODY ELEMENT |
| KR100867977B1 (en) | 2006-10-11 | 2008-11-10 | 한국과학기술원 | Tissue perfusion analysis apparatus using indocyanine green blood concentration dynamics and tissue perfusion analysis method using the same |
| KR100818669B1 (en)* | 2007-03-09 | 2008-04-02 | 한국과학기술원 | Unit perfusion degree measuring device |
| JP2009100971A (en) | 2007-10-24 | 2009-05-14 | Ge Medical Systems Global Technology Co Llc | Ultrasonic imaging apparatus |
| US8718747B2 (en) | 2010-04-16 | 2014-05-06 | Oslo Universitetssykehus Hf | Estimating and correcting for contrast agent extravasation in tissue perfusion imaging |
| US9451903B2 (en) | 2010-10-20 | 2016-09-27 | Advanced Mri Technologies, Llc | Simultaneous multislice perfusion imaging in MRI |
| WO2012174495A2 (en) | 2011-06-17 | 2012-12-20 | Carnegie Mellon University | Physics based image processing and evaluation process of perfusion images from radiology imaging |
| US9299142B2 (en) | 2011-10-24 | 2016-03-29 | Koninklijke Philips N.V. | Perfusion imaging |
| IN2014DN08703A (en) | 2012-03-29 | 2015-05-22 | Univ Johns Hopkins | |
| FR2996667B1 (en) | 2012-10-05 | 2015-12-11 | Olea Medical | SYSTEM AND METHOD FOR ESTIMATING A QUANTITY OF INTEREST IN A CINEMATIC SYSTEM BY CONTRAST AGENT TOMOGRAPHY |
| CN105658138B (en) | 2013-06-14 | 2020-06-16 | 诺瓦达克技术公司 | Quantification of absolute blood flow in tissue using fluorescence-mediated photoplethysmography |
| US10426361B2 (en) | 2013-06-14 | 2019-10-01 | Novadaq Technologies ULC | Quantification of absolute blood flow in tissue using fluorescence-mediated photoplethysmography |
| CN107530452A (en) | 2015-02-02 | 2018-01-02 | 诺瓦达克技术公司 | Methods and systems for characterizing tissue of a subject |
| WO2017051230A1 (en) | 2015-09-23 | 2017-03-30 | Novadaq Technologies Inc. | Methods and systems for assessing healing of tissue |
| EP3416547A4 (en) | 2016-02-16 | 2019-08-14 | Novadaq Technologies ULC | FACILITATION OF EVALUATION OF BLOOD FLOW AND TISSUE PERFUSION BY FLUORESCENCE-MEDIATED PHOTOPLETHYSMOGRAPHY |
- 2014
- 2014-06-16CNCN201480044769.1Apatent/CN105658138B/enactiveActive
- 2014-06-16EPEP14820367.2Apatent/EP3007618B1/enactiveActive
- 2014-06-16KRKR1020167000943Apatent/KR20160019950A/ennot_activeCeased
- 2014-06-16CACA2913692Apatent/CA2913692A1/ennot_activeAbandoned
- 2014-06-16KRKR1020197033703Apatent/KR102210458B1/enactiveActive
- 2014-06-16WOPCT/IB2014/002184patent/WO2015001427A2/enactiveApplication Filing
- 2014-06-16USUS14/305,950patent/US10285603B2/enactiveActive
- 2014-06-16HKHK16110790.3Apatent/HK1222527A1/enunknown
- 2014-06-16CNCN202010423399.XApatent/CN112515652A/enactivePending
- 2014-06-16JPJP2016518598Apatent/JP6310550B2/enactiveActive
Also Published As
| Publication number | Publication date |
|---|---|
| WO2015001427A3 (en) | 2015-04-30 |
| CA2913692A1 (en) | 2015-01-08 |
| JP6310550B2 (en) | 2018-04-11 |
| KR20160019950A (en) | 2016-02-22 |
| CN105658138A (en) | 2016-06-08 |
| KR102210458B1 (en) | 2021-02-02 |
| US20140371583A1 (en) | 2014-12-18 |
| HK1222527A1 (en) | 2017-07-07 |
| KR20190130674A (en) | 2019-11-22 |
| CN112515652A (en) | 2021-03-19 |
| JP2016521612A (en) | 2016-07-25 |
| EP3007618A4 (en) | 2017-05-31 |
| EP3007618A2 (en) | 2016-04-20 |
| US10285603B2 (en) | 2019-05-14 |
| EP3007618B1 (en) | 2019-09-04 |
| WO2015001427A2 (en) | 2015-01-08 |
Similar Documents
| Publication | Publication Date | Title |
|---|---|---|
| CN105658138B (en) | Quantification of absolute blood flow in tissue using fluorescence-mediated photoplethysmography | |
| US11701016B2 (en) | Facilitating assessment of blood flow and tissue perfusion using fluorescence-mediated photoplethysmography | |
| JP6487544B2 (en) | Quantification of absolute blood flow in tissues using fluorescence-mediated photoelectric plethysmography | |
| US11696695B2 (en) | Quantification of absolute blood flow in tissue using fluorescence mediated photoplethysmography | |
| BRPI0815175B1 (en) | device for diagnosing and / or monitoring therapy for inflammatory diseases such as rheumatoid arthritis | |
| JP6659784B2 (en) | Quantifying absolute blood flow in tissue using fluorescence-mediated photoelectric plethysmography | |
| JP6834040B2 (en) | Quantification of absolute blood flow in tissues using fluorescence-mediated photoelectric volumetric pulse wave recording |
Legal Events
| Date | Code | Title | Description |
|---|---|---|---|
| C06 | Publication | ||
| PB01 | Publication | ||
| C10 | Entry into substantive examination | ||
| SE01 | Entry into force of request for substantive examination | ||
| GR01 | Patent grant | ||
| GR01 | Patent grant | ||
| TR01 | Transfer of patent right | ||
| TR01 | Transfer of patent right | Effective date of registration:20210118 Address after:Delaware, USA Patentee after:Stryker Europe Holdings Ltd. Address before:Delaware, USA Patentee before:Stryker Europe Holdings Ltd. Effective date of registration:20210118 Address after:Ai Erlankekejun Patentee after:Stryker Europe Operations Ltd. Address before:Delaware, USA Patentee before:Stryker Europe Holdings Ltd. Effective date of registration:20210118 Address after:Delaware, USA Patentee after:Stryker Europe Holdings Ltd. Address before:michigan Patentee before:Stryker Europe holding LLC Effective date of registration:20210118 Address after:Ontario, Canada Patentee after:NOVADAQ TECHNOLOGIES ULC Address before:Ontario, Canada Patentee before:NOVADAQ TECHNOLOGIES Inc. Effective date of registration:20210118 Address after:michigan Patentee after:Stryker Europe holding LLC Address before:Ontario, Canada Patentee before:NOVADAQ TECHNOLOGIES ULC | |
| TR01 | Transfer of patent right | ||
| TR01 | Transfer of patent right | Effective date of registration:20240423 Address after:michigan Patentee after:STRYKER Corp. Country or region after:U.S.A. Address before:Ai Erlankekejun Patentee before:Stryker Europe Operations Ltd. Country or region before:Ireland |