CN103747742A - Vascular characterization using ultrasound imaging - Google Patents
Vascular characterization using ultrasound imagingDownload PDFInfo
- Publication number
- CN103747742A CN103747742ACN201280028868.1ACN201280028868ACN103747742ACN 103747742 ACN103747742 ACN 103747742ACN 201280028868 ACN201280028868 ACN 201280028868ACN 103747742 ACN103747742 ACN 103747742A
- Authority
- CN
- China
- Prior art keywords
- vessel
- pulse
- echo data
- region
- blood vessel
- Prior art date
- Legal status (The legal status is an assumption and is not a legal conclusion. Google has not performed a legal analysis and makes no representation as to the accuracy of the status listed.)
- Granted
Links
- 230000002792vascularEffects0.000titleclaimsdescription111
- 238000012285ultrasound imagingMethods0.000titledescription24
- 238000012512characterization methodMethods0.000titledescription6
- 238000000034methodMethods0.000claimsabstractdescription138
- 238000002604ultrasonographyMethods0.000claimsabstractdescription119
- 230000033001locomotionEffects0.000claimsabstractdescription72
- 230000017531blood circulationEffects0.000claimsabstractdescription61
- 210000004204blood vesselAnatomy0.000claimsdescription168
- 238000003384imaging methodMethods0.000claimsdescription127
- 238000006073displacement reactionMethods0.000claimsdescription100
- 238000012545processingMethods0.000claimsdescription75
- 238000002560therapeutic procedureMethods0.000claimsdescription65
- 239000013598vectorSubstances0.000claimsdescription50
- 210000004369bloodAnatomy0.000claimsdescription32
- 239000008280bloodSubstances0.000claimsdescription32
- 238000005259measurementMethods0.000claimsdescription30
- 230000000004hemodynamic effectEffects0.000claimsdescription25
- 238000005070samplingMethods0.000claimsdescription21
- 230000000737periodic effectEffects0.000claimsdescription18
- 238000009826distributionMethods0.000claimsdescription15
- 230000005284excitationEffects0.000claimsdescription11
- 230000007505plaque formationEffects0.000claimsdescription5
- 210000001519tissueAnatomy0.000description61
- 238000004422calculation algorithmMethods0.000description40
- 238000004364calculation methodMethods0.000description27
- 210000001715carotid arteryAnatomy0.000description20
- 230000006870functionEffects0.000description17
- 238000001914filtrationMethods0.000description16
- 238000005314correlation functionMethods0.000description14
- 239000012530fluidSubstances0.000description14
- 230000008569processEffects0.000description14
- 238000013480data collectionMethods0.000description12
- 238000002592echocardiographyMethods0.000description10
- 239000000523sampleSubstances0.000description10
- 238000012384transportation and deliveryMethods0.000description10
- 230000000875corresponding effectEffects0.000description9
- 238000010586diagramMethods0.000description9
- 230000000747cardiac effectEffects0.000description8
- 238000012360testing methodMethods0.000description8
- 230000008901benefitEffects0.000description7
- 238000010168coupling processMethods0.000description7
- 238000013461designMethods0.000description7
- 201000010099diseaseDiseases0.000description7
- 208000037265diseases, disorders, signs and symptomsDiseases0.000description7
- 230000001965increasing effectEffects0.000description7
- 239000011159matrix materialSubstances0.000description7
- 230000004044responseEffects0.000description7
- 238000004088simulationMethods0.000description7
- 230000001225therapeutic effectEffects0.000description7
- 238000004458analytical methodMethods0.000description6
- 238000003491arrayMethods0.000description6
- 230000009286beneficial effectEffects0.000description6
- 230000000694effectsEffects0.000description6
- 150000002632lipidsChemical group0.000description6
- 230000002123temporal effectEffects0.000description6
- 238000002679ablationMethods0.000description5
- 238000013459approachMethods0.000description5
- 238000002474experimental methodMethods0.000description5
- 239000000203mixtureSubstances0.000description5
- 238000005457optimizationMethods0.000description5
- 238000010845search algorithmMethods0.000description5
- 239000007787solidSubstances0.000description5
- 238000003860storageMethods0.000description5
- 238000011282treatmentMethods0.000description5
- 201000001320AtherosclerosisDiseases0.000description4
- 230000008859changeEffects0.000description4
- 230000001427coherent effectEffects0.000description4
- 230000001276controlling effectEffects0.000description4
- 230000008878couplingEffects0.000description4
- 238000005859coupling reactionMethods0.000description4
- 238000001514detection methodMethods0.000description4
- 229940079593drugDrugs0.000description4
- 239000003814drugSubstances0.000description4
- 238000012544monitoring processMethods0.000description4
- 238000005311autocorrelation functionMethods0.000description3
- 230000005540biological transmissionEffects0.000description3
- 238000013500data storageMethods0.000description3
- 238000009472formulationMethods0.000description3
- 230000036541healthEffects0.000description3
- 238000001727in vivoMethods0.000description3
- 238000001228spectrumMethods0.000description3
- 238000012549trainingMethods0.000description3
- 238000007476Maximum LikelihoodMethods0.000description2
- 241000699670Mus sp.Species0.000description2
- 230000003044adaptive effectEffects0.000description2
- 210000001367arteryAnatomy0.000description2
- 230000003143atherosclerotic effectEffects0.000description2
- 210000004027cellAnatomy0.000description2
- 238000007906compressionMethods0.000description2
- 230000006835compressionEffects0.000description2
- 238000004590computer programMethods0.000description2
- 230000007423decreaseEffects0.000description2
- 238000000502dialysisMethods0.000description2
- 230000002526effect on cardiovascular systemEffects0.000description2
- 238000002091elastographyMethods0.000description2
- 230000003993interactionEffects0.000description2
- 238000002608intravascular ultrasoundMethods0.000description2
- 239000000463materialSubstances0.000description2
- 238000010606normalizationMethods0.000description2
- 230000002093peripheral effectEffects0.000description2
- 238000012805post-processingMethods0.000description2
- 238000011160researchMethods0.000description2
- 238000013519translationMethods0.000description2
- 210000005166vasculatureAnatomy0.000description2
- 238000012800visualizationMethods0.000description2
- XLYOFNOQVPJJNP-UHFFFAOYSA-NwaterSubstancesOXLYOFNOQVPJJNP-UHFFFAOYSA-N0.000description2
- PXFBZOLANLWPMH-UHFFFAOYSA-N16-EpiaffinineNatural productsC1C(C2=CC=CC=C2N2)=C2C(=O)CC2C(=CC)CN(C)C1C2COPXFBZOLANLWPMH-UHFFFAOYSA-N0.000description1
- 208000024172Cardiovascular diseaseDiseases0.000description1
- 206010061818Disease progressionDiseases0.000description1
- 206010016717FistulaDiseases0.000description1
- 208000031481Pathologic ConstrictionDiseases0.000description1
- 241000282887SuidaeSpecies0.000description1
- 238000009825accumulationMethods0.000description1
- 230000002411adverseEffects0.000description1
- 230000002776aggregationEffects0.000description1
- 238000004220aggregationMethods0.000description1
- 230000000879anti-atherosclerotic effectEffects0.000description1
- 210000000709aortaAnatomy0.000description1
- 230000004872arterial blood pressureEffects0.000description1
- 230000015572biosynthetic processEffects0.000description1
- 230000036772blood pressureEffects0.000description1
- 230000002308calcificationEffects0.000description1
- 238000007675cardiac surgeryMethods0.000description1
- 229920002678cellulosePolymers0.000description1
- 239000001913celluloseSubstances0.000description1
- 238000006243chemical reactionMethods0.000description1
- 230000002301combined effectEffects0.000description1
- 239000002131composite materialSubstances0.000description1
- 230000001143conditioned effectEffects0.000description1
- 210000002808connective tissueAnatomy0.000description1
- 239000000470constituentSubstances0.000description1
- 238000010276constructionMethods0.000description1
- 210000004351coronary vesselAnatomy0.000description1
- 230000002596correlated effectEffects0.000description1
- 238000013481data captureMethods0.000description1
- 238000013144data compressionMethods0.000description1
- 238000013523data managementMethods0.000description1
- 238000013079data visualisationMethods0.000description1
- 238000000354decomposition reactionMethods0.000description1
- 230000000881depressing effectEffects0.000description1
- 238000009795derivationMethods0.000description1
- 238000011161developmentMethods0.000description1
- 238000002059diagnostic imagingMethods0.000description1
- 230000005750disease progressionEffects0.000description1
- 235000019800disodium phosphateNutrition0.000description1
- 238000012377drug deliveryMethods0.000description1
- 238000002651drug therapyMethods0.000description1
- 230000009977dual effectEffects0.000description1
- 230000003028elevating effectEffects0.000description1
- 238000005516engineering processMethods0.000description1
- 210000003743erythrocyteAnatomy0.000description1
- 238000011156evaluationMethods0.000description1
- 239000000284extractSubstances0.000description1
- 238000000605extractionMethods0.000description1
- 230000002349favourable effectEffects0.000description1
- 230000003890fistulaEffects0.000description1
- 230000030279gene silencingEffects0.000description1
- 230000035876healingEffects0.000description1
- 238000002675image-guided surgeryMethods0.000description1
- 230000008676importEffects0.000description1
- 230000006872improvementEffects0.000description1
- 238000011503in vivo imagingMethods0.000description1
- 238000010348incorporationMethods0.000description1
- 230000028709inflammatory responseEffects0.000description1
- 238000007689inspectionMethods0.000description1
- 230000010354integrationEffects0.000description1
- 239000010410layerSubstances0.000description1
- 230000003902lesionEffects0.000description1
- 230000004807localizationEffects0.000description1
- 239000003550markerSubstances0.000description1
- 239000004005microsphereSubstances0.000description1
- 238000002156mixingMethods0.000description1
- 238000012986modificationMethods0.000description1
- 230000004048modificationEffects0.000description1
- 238000012806monitoring deviceMethods0.000description1
- 230000003287optical effectEffects0.000description1
- 238000003672processing methodMethods0.000description1
- 230000010349pulsationEffects0.000description1
- 238000012887quadratic functionMethods0.000description1
- 239000002356single layerSubstances0.000description1
- 210000004872soft tissueAnatomy0.000description1
- 238000000638solvent extractionMethods0.000description1
- 230000036262stenosisEffects0.000description1
- 208000037804stenosisDiseases0.000description1
- 238000006467substitution reactionMethods0.000description1
- 238000001356surgical procedureMethods0.000description1
- 230000008685targetingEffects0.000description1
- 230000008719thickeningEffects0.000description1
- 230000009466transformationEffects0.000description1
- 238000000844transformationMethods0.000description1
- 210000001604vasa vasorumAnatomy0.000description1
- 208000019553vascular diseaseDiseases0.000description1
- 230000006438vascular healthEffects0.000description1
- 230000004865vascular responseEffects0.000description1
- 210000003462veinAnatomy0.000description1
Images


Classifications
- A—HUMAN NECESSITIES
- A61—MEDICAL OR VETERINARY SCIENCE; HYGIENE
- A61B—DIAGNOSIS; SURGERY; IDENTIFICATION
- A61B8/00—Diagnosis using ultrasonic, sonic or infrasonic waves
- A61B8/08—Clinical applications
- A—HUMAN NECESSITIES
- A61—MEDICAL OR VETERINARY SCIENCE; HYGIENE
- A61B—DIAGNOSIS; SURGERY; IDENTIFICATION
- A61B8/00—Diagnosis using ultrasonic, sonic or infrasonic waves
- A61B8/08—Clinical applications
- A61B8/0891—Clinical applications for diagnosis of blood vessels
- A—HUMAN NECESSITIES
- A61—MEDICAL OR VETERINARY SCIENCE; HYGIENE
- A61B—DIAGNOSIS; SURGERY; IDENTIFICATION
- A61B8/00—Diagnosis using ultrasonic, sonic or infrasonic waves
- A61B8/06—Measuring blood flow
- A—HUMAN NECESSITIES
- A61—MEDICAL OR VETERINARY SCIENCE; HYGIENE
- A61B—DIAGNOSIS; SURGERY; IDENTIFICATION
- A61B8/00—Diagnosis using ultrasonic, sonic or infrasonic waves
- A61B8/08—Clinical applications
- A61B8/0833—Clinical applications involving detecting or locating foreign bodies or organic structures
- A61B8/085—Clinical applications involving detecting or locating foreign bodies or organic structures for locating body or organic structures, e.g. tumours, calculi, blood vessels, nodules
- A—HUMAN NECESSITIES
- A61—MEDICAL OR VETERINARY SCIENCE; HYGIENE
- A61B—DIAGNOSIS; SURGERY; IDENTIFICATION
- A61B8/00—Diagnosis using ultrasonic, sonic or infrasonic waves
- A61B8/48—Diagnostic techniques
- A61B8/485—Diagnostic techniques involving measuring strain or elastic properties
- A—HUMAN NECESSITIES
- A61—MEDICAL OR VETERINARY SCIENCE; HYGIENE
- A61N—ELECTROTHERAPY; MAGNETOTHERAPY; RADIATION THERAPY; ULTRASOUND THERAPY
- A61N7/00—Ultrasound therapy
- A—HUMAN NECESSITIES
- A61—MEDICAL OR VETERINARY SCIENCE; HYGIENE
- A61B—DIAGNOSIS; SURGERY; IDENTIFICATION
- A61B8/00—Diagnosis using ultrasonic, sonic or infrasonic waves
- A61B8/48—Diagnostic techniques
- A61B8/486—Diagnostic techniques involving arbitrary m-mode
Landscapes
- Health & Medical Sciences (AREA)
- Life Sciences & Earth Sciences (AREA)
- General Health & Medical Sciences (AREA)
- Animal Behavior & Ethology (AREA)
- Veterinary Medicine (AREA)
- Nuclear Medicine, Radiotherapy & Molecular Imaging (AREA)
- Public Health (AREA)
- Radiology & Medical Imaging (AREA)
- Engineering & Computer Science (AREA)
- Biomedical Technology (AREA)
- Medical Informatics (AREA)
- Physics & Mathematics (AREA)
- Molecular Biology (AREA)
- Surgery (AREA)
- Heart & Thoracic Surgery (AREA)
- Pathology (AREA)
- Biophysics (AREA)
- Vascular Medicine (AREA)
- Hematology (AREA)
- Ultra Sonic Daignosis Equipment (AREA)
Abstract
Translated fromChinese
Description
Translated fromChinese关于联邦资助的研究或开发的声明Statement Regarding Federally Sponsored Research or Development
本发明是在来自NIH的奖励编号EB 6893下的政府支持的情况下完成的。政府具有本发明中的某些权利。This invention was made with government support under award number EB 6893 from the NIH. The government has certain rights in this invention.
相关申请的交叉引用Cross References to Related Applications
本申请要求保护2011年4月14日提交的名称为“Vascular Characterization Using Ultrasound Imaging”的序列号61/475,550的美国临时申请的权益,该美国临时申请以其整体通过引用合并于此。This application claims the benefit of U.S. Provisional Application Serial No. 61/475,550, filed April 14, 2011, entitled "Vascular Characterization Using Ultrasound Imaging," which is hereby incorporated by reference in its entirety.
背景技术Background technique
这里的公开总体上涉及超声成像。更具体地,这里的公开涉及供在例如诊断和/或疗法应用(例如血管和/或接近其的区域的成像等)中使用的超声成像方法和系统。The disclosure herein relates generally to ultrasound imaging. More specifically, the disclosure herein relates to ultrasound imaging methods and systems for use, eg, in diagnostic and/or therapeutic applications (eg, imaging of blood vessels and/or regions proximate thereto, etc.).
脉管成像正在获得越来越多的关注,不仅作为一种检测心血管疾病的方式,而且还用于评估对新的抗动脉粥样硬化疗法的反应(参见Ainswoth等人的“3D ultrasound measurement of change in carotid plaque volume - A tool for rapid evaluation of new therapies,”Stroke, vol. 36, no. 9, pp. 1904-1909, SEP 2005)。血管内超声(IVUS)已经被示出以提供一种响应于疗法测量动脉粥样硬化疾病的进展或消退的有效工具。然而,IVUS是有创的,有潜在风险,并且比利用超声的无创成像更昂贵。Vascular imaging is gaining increasing attention not only as a modality to detect cardiovascular disease but also to assess response to new anti-atherosclerotic therapies (see "3D ultrasound measurement of change in carotid plaque volume - A tool for rapid evaluation of new therapies,"Stroke , vol. 36, no. 9, pp. 1904-1909, SEP 2005). Intravascular ultrasound (IVUS) has been shown to provide an effective tool for measuring the progression or regression of atherosclerotic disease in response to therapy. However, IVUS is invasive, potentially risky, and more expensive than noninvasive imaging with ultrasound.
超声扫描仪上的先进成像模式已经导致对成像重要量越来越感兴趣,像使用多普勒的管壁剪切速率(WSR, wall shear rate)(参见Blake等人的“A method to estimate wall shear rate with a clinical ultrasound scanner,”Ultrasound in Medicine and Biology, vol. 34, no. 5, pp. 760-764, MAY 2008)和使用斑点追踪的组织/管壁运动(参见Tsou等人的“Role of ultrasonic shear rate estimation errors in assessing inflammatory response and vascular risk,” Ultrasound in Medicine and Biology, vol. 34, no. 6, pp. 963-972, JUN 2008;Karimi等人的“Estimation of Nonlinear Mechanical Properties of Vascular Tissues via Elastography,”Cardiovascular Engineering, vol. 8, no. 4, pp. 191-202, DEC 2008;和Weitzel等人的“High- Resolution Ultrasound Elasticity Imaging to Evaluate Dialysis Fistula Stenosis,”Seminars In Dialysis, vol. 22, no. 1, pp. 84-89, JAN-FEB 2009)。Advanced imaging modalities on ultrasound scanners have led to increased interest in imaging important quantities like wall shear rate (WSR) using Doppler (see "A method to estimate wall shear rate" by Blake et al. shear rate with a clinical ultrasound scanner,”Ultrasound in Medicine and Biology , vol. 34, no. 5, pp. 760-764, MAY 2008) and tissue/tube wall motion using speckle tracking (see “Role of ultrasonic shear rate estimation errors in assessing inflammatory response and vascular risk,”Ultrasound in Medicine and Biology , vol. 34, no. 6, pp. 963-972, JUN 2008; Karimi et al., “Estimation of Nonlinear Mechanical Properties of Vascular Tissues via Elastography,”Cardiovascular Engineering , vol. 8, no. 4, pp. 191-202, DEC 2008; and Weitzel et al., “High- Resolution Ultrasound Elasticity Imaging to Evaluate Dialysis Fistula Stenosis,”Seminars In Dialysis , vol. 22, no. 1, pp. 84-89, JAN-FEB 2009).
近来,已经对与对大动脉血流动力学的评估进行建模的计算流体动力学(CFD)相结合对血流进行成像越来越感兴趣(参见Steinman等人的“Flow imaging and computing: Large artery hemodynamics,”ANNALS OF BIOMEDICAL ENGINEERING, vol. 33, no. 12, pp. 1704-1709, DEC 2005;Figueroa等人的“A computational framework for fluid-solid-growth modeling in cardiovascular simulations,”Computer Methods in Applied Mechanics and Engineering, vol. 198, no. 45-46, pp. 3583 - 3602, 2009;和Taylor等人的“Open problems in computational vascular biomechanics: Hemodynamics and arterial wall mechanics,”Computer Methods in Applied Mechanics and Engineering, vol. 198, no. 45-46, pp. 3514 - 3523, 2009)。在该上下文中,已经将建模流-固界面定义为脉管力学中的挑战领域。Recently, there has been increasing interest in imaging blood flow in conjunction with computational fluid dynamics (CFD) modeling for the assessment of large artery hemodynamics (see Steinman et al., "Flow imaging and computing: Large artery hemodynamics,"ANNALS OF BIOMEDICAL ENGINEERING , vol. 33, no. 12, pp. 1704-1709, DEC 2005; "A computational framework for fluid-solid-growth modeling incardiovascular simulations," by Figueroa et al.and Engineering , vol. 198, no. 45-46, pp. 3583 - 3602, 2009; and Taylor et al., "Open problems in computational vascular biomechanics: Hemodynamics and arterial wall mechanics,"Computer Methods in Applied Mechanics and Engineering , vol . 198, no. 45-46, pp. 3514-3523, 2009). In this context, modeling the fluid-solid interface has been defined as a challenging area in vascular mechanics.
发明内容Contents of the invention
本公开的至少一个实施例涉及能够同时对管壁组织运动(例如血管周组织)和变形二者连同流体流量进行成像的超声成像。例如,在本公开的一个实施例中,结合同时为组织和流体二者中的矢量位移追踪提供足够帧速率的成像模式(例如M2D模式成像)利用斑点追踪(例如适合于利用最小插值进行轴向方向和横向方向上的子采样位移估计的2D相位耦合斑点追踪方法)来完成使用超声的成像脉管力学。例如,可以在装配有用于控制成像序列和对RF数据进行流线化以便在感兴趣的区域中(例如血管周围)执行2D斑点追踪的研究界面的临床扫描仪上实施M2D成像。将2D斑点追踪与足够高帧速率成像进行组合允许轴向方向和横向方向上的精细位移追踪。由这种处理得到的矢量位移场非常适合于利用最小滤波的应变和剪切应变计算以及使用相对较小的追踪窗口(即斑点区域)来最大化分辨率。可以对(例如组织/流体应用中的,诸如患者颈动脉中活体的)流体和组织运动应变场进行评估(例如为了识别出脉管特征或出于一个或多个其他目的,例如供在疗法中使用)。At least one embodiment of the present disclosure relates to ultrasound imaging capable of simultaneously imaging both vessel wall tissue motion (eg, perivascular tissue) and deformation along with fluid flow. For example, in one embodiment of the present disclosure, speckle tracking (e.g. suitable for axial A 2D phase-coupled speckle-tracking method with subsampled displacement estimation in both direction and transverse direction) to accomplish imaging vascular mechanics using ultrasound. For example, M2D imaging can be performed on a clinical scanner equipped with a research interface for controlling the imaging sequence and streamlining the RF data to perform 2D speckle tracking in regions of interest (eg, perivascular). Combining 2D speckle tracking with sufficiently high frame rate imaging allows fine displacement tracking in axial and transverse directions. The vector displacement fields resulting from this processing are well suited for strain and shear strain calculations with minimal filtering and the use of relatively small tracking windows (i.e., speckle regions) to maximize resolution. Fluid and tissue motion strain fields (e.g. in tissue/fluid applications, such as in vivo in a patient's carotid artery) can be evaluated (e.g., to identify vascular features or for one or more other purposes, e.g., for use in therapy use).
成像方法的一个示例性实施例可以包括:提供至少一部分血管位于其中的区域的超声脉冲回波数据(例如,其中脉冲回波数据包括处于下述帧速率的脉冲回波数据:该帧速率使得所测得的限定所述至少一部分血管的管壁的位移和所测得的经过所述至少一部分血管的平均血流量随时间具有准周期性分布,以便允许同时对管壁和血流量二者进行运动追踪);以及使用斑点追踪来生成所述至少一部分血管位于其中的区域的应变和剪切应变图像数据。例如,斑点追踪可以包括使用所述至少一部分血管位于其中的区域中的经受变形的一个或多个斑点区域的脉冲回波数据的多维相关(例如,其中多维相关包括基于互相关脉冲回波数据的相位和幅度梯度来确定采样脉冲回波数据的互相关性峰值)。此外,该方法可以包括基于应变和剪切应变图像数据来识别至少一部分血管位于其中的区域的至少一个脉管特征(例如,其中所述至少一个脉管特征包括与经过血管的流量相关联的流量特征、与血管相关联的结构特征、以及与血管相关联的血流动力学特征中的至少一个)。An exemplary embodiment of an imaging method may include providing ultrasound pulse-echo data of a region in which at least a portion of the blood vessel is located (e.g., wherein the pulse-echo data comprises pulse-echo data at a frame rate such that the The measured displacement of the vessel wall defining the at least a portion of the vessel and the measured mean blood flow through the at least a portion of the vessel have a quasi-periodic distribution over time so as to allow simultaneous measurement of both the vessel wall and blood flow motion tracking); and using speckle tracking to generate strain and shear strain image data of the region in which the at least a portion of the blood vessel is located. For example, speckle tracking may include multidimensional correlation using pulse-echo data of one or more speckle regions undergoing deformation in the region in which the at least a portion of the blood vessel is located (e.g., wherein the multidimensional correlation includes correlation based on cross-correlation pulse-echo data). phase and amplitude gradients to determine cross-correlation peaks of sampled pulse-echo data). Additionally, the method can include identifying at least one vascular feature of a region in which at least a portion of the blood vessel is located based on the strain and shear strain image data (e.g., wherein the at least one vascular feature includes a flow rate associated with flow through the blood vessel). at least one of features, structural features associated with blood vessels, and hemodynamic features associated with blood vessels).
另一示例性成像方法可以包括:提供至少一部分血管位于其中的区域的超声脉冲回波数据;以及使用至少一部分血管位于其中的区域的一个或多个斑点区域的斑点追踪来追踪限定所述至少一部分血管的管壁以及经过所述至少一部分血管的血流量二者的运动。以下述帧速率来提供脉冲回波数据:该帧速率使得可在同一周期性循环(例如与心脏脉搏周期相对应)内同时测量限定所述至少一部分血管的管壁的位移以及经过所述至少一部分血管的血流量。此外,该方法可以包括基于同时测得的管壁位移和平均血流量来识别至少一部分血管位于其中的区域的至少一个脉管特征。这样的成像方法还可以包括使用斑点追踪来生成所述至少一部分血管位于其中的区域的应变和剪切应变图像数据,其中所述斑点追踪包括使用所述至少一部分血管位于其中的区域中的经受变形的一个或多个斑点区域的采样脉冲回波数据的多维相关(例如,所述多维相关可以包括基于互相关采样脉冲回波数据的相位和幅度梯度来确定采样脉冲回波数据的互相关性峰值)。Another exemplary imaging method may include: providing ultrasound pulse echo data of a region in which at least a portion of the blood vessel is located; Movement of both the wall of the blood vessel and blood flow through the at least a portion of the blood vessel. The pulse-echo data is provided at a frame rate such that the displacement of the vessel wall defining the at least a portion of the blood vessel and passing through the at least a portion of the vessel can be measured simultaneously within the same periodic cycle (e.g. blood flow in blood vessels. Additionally, the method may include identifying at least one vessel characteristic of a region in which at least a portion of the vessel is located based on the simultaneously measured vessel wall displacement and mean blood flow. Such an imaging method may further comprise using speckle tracking to generate strain and shear strain image data of the region in which the at least a portion of the blood vessel is located, wherein the speckle tracking includes using the strain and shear strain image data in the region in which the at least a portion of the blood vessel is located. Multidimensional correlation of sampled pulse-echo data for one or more speckle regions (e.g., the multidimensional correlation may include determining cross-correlation peaks of the sampled pulse-echo data based on phase and amplitude gradients of the cross-correlated sampled pulse-echo data ).
在这里所述的方法的一个或多个实施例中,识别至少一个脉管特征可以包括识别一个或多个管壁边界;并且这些方法的斑点追踪还可以包括基于所识别的一个或多个管壁边界来修改被追踪的一个或多个斑点区域中的至少一个的特征(例如位置、尺寸、形状等等)以使得所述至少一个斑点区域完全在管壁之内或之外。In one or more embodiments of the methods described herein, identifying at least one vascular feature may include identifying one or more vessel wall boundaries; and the speckle tracking of these methods may further include The characteristics (eg, location, size, shape, etc.) of at least one of the tracked one or more speckle regions are modified according to the wall boundary such that the at least one speckle region is completely inside or outside the tube wall.
此外,在这里所述的方法的一个或多个实施例中,识别至少一个脉管特征可以包括识别整个血管周围的管壁边界(例如,沿着管轴取得的整个横截面视图中的壁边界);可以包括测量一个或多个管壁边界内的组织特性(例如硬度或顺应性);可以包括识别邻近所述一个或多个管壁边界的斑块(plaque)构造的一个或多个部分(例如,使得疗法可以聚焦于该结构的一部分;诸如其基部);以及/或者可以包括基于同时对血流量和管壁的运动二者的运动追踪来计算一个或多个血流动力学测量结果。Additionally, in one or more embodiments of the methods described herein, identifying at least one vascular feature may include identifying vessel wall boundaries around the entire vessel (e.g., wall boundaries in an entire cross-sectional view taken along the vessel axis ); may include measuring tissue properties (such as stiffness or compliance) within one or more vessel wall boundaries; may include identifying one or more portions of a plaque formation adjacent to the one or more vessel wall boundaries (e.g., allowing therapy to be focused on a portion of the structure; such as its base); and/or may include calculating one or more hemodynamic measurements based on motion tracking of both blood flow and vessel wall motion .
更进一步地,在这里所述的方法的一个或多个实施例中,使用一个或多个斑点区域的采样脉冲回波数据的多维相关可以包括使用一个或多个斑点区域的采样脉冲回波数据的二维相关(例如以追踪壁位移或血流量),以及甚至三维相关。Still further, in one or more embodiments of the methods described herein, the multidimensional correlation using the sampled pulse echo data of the one or more speckle regions may comprise using the sampled pulse echo data of the one or more speckle regions Two-dimensional correlations (for example to track wall displacement or blood flow), and even three-dimensional correlations.
再进一步地,在这里所述的方法的一个或多个实施例中,该方法还可以包括基于至少一部分血管位于其中的区域的至少一个脉管特征的识别来向患者递送疗法(例如,使用超声能量以基于至少一部分血管位于其中的区域的至少一个脉管特征的识别来递送疗法)。例如,可以提供至少一个被配置成发射和接收超声能量的换能器,其中该至少一个换能器被用来获得脉冲回波数据(例如用于图像数据生成)和生成递送疗法的超声能量。Still further, in one or more embodiments of the methods described herein, the method may further include delivering therapy to the patient based on identification of at least one vascular feature of the region in which at least a portion of the blood vessel is located (e.g., using ultrasound energy to deliver therapy based on identification of at least one vascular characteristic of the region in which at least a portion of the blood vessel is located). For example, at least one transducer configured to transmit and receive ultrasound energy may be provided, wherein the at least one transducer is used to obtain pulse-echo data (eg, for image data generation) and to generate ultrasound energy to deliver therapy.
在这里所述的方法的一个或多个实施例中,使用二维斑点追踪来生成所述至少一部分血管位于其中的区域的应变和剪切应变图像数据可以包括生成轴向应变和轴向剪切应变图像数据以及/或者横向应变和横向剪切应变图像数据中的至少一个。此外,在这样的方法中,提供至少一部分血管位于其中的区域的超声脉冲回波数据可以包括使用编码激励。In one or more embodiments of the methods described herein, using two-dimensional speckle tracking to generate strain and shear strain image data for the region in which the at least a portion of the blood vessel is located may include generating axial strain and axial shear Strain image data and/or at least one of transverse strain and transverse shear strain image data. Additionally, in such methods, providing ultrasound pulse echo data for a region in which at least a portion of the blood vessel is located may include using coded excitation.
在这里所述的方法的一个或多个实施例中,该方法可以包括将去混响滤波器应用于来自血液中的一个或多个斑点区域的脉冲回波数据,以便在执行来自血液中的一个或多个斑点区域的脉冲回波数据的斑点追踪时去除因管壁处的反射而引起的脉冲回波数据中的回波分量。In one or more embodiments of the methods described herein, the method may include applying a dereverberation filter to pulse-echo data from one or more speckle regions in the blood, such that when performing Speckle tracking of pulse-echo data of one or more speckle regions removes echo components in the pulse-echo data due to reflections at the pipe wall.
另一示例性成像方法可以包括:提供至少一部分血管位于其中的区域的超声脉冲回波数据;使用所述至少一部分血管位于其中的区域的一个或多个斑点区域的斑点追踪来追踪限定所述至少一部分血管的管壁和经过所述至少一部分血管的血流量中的至少一个的运动;基于所述一个或多个斑点区域的斑点追踪来识别一个或多个管壁边界;以及基于所识别的一个或多个管壁边界来修改被追踪的一个或多个斑点区域中的至少一个的至少一个特征,以使得所述至少一个斑点区域完全在管壁之内或之外(例如,可以基于所识别的一个或多个管壁边界来修改被追踪的一个或多个斑点区域中的至少一个的位置、尺寸或形状中的至少一个,以使得所述至少一个斑点区域完全在管壁之内或之外)。Another exemplary imaging method may include: providing ultrasound pulse echo data of a region in which at least a portion of the blood vessel is located; motion of at least one of a vessel wall of a portion of the vessel and blood flow through the at least a portion of the vessel; identifying one or more vessel wall boundaries based on speckle tracking of the one or more speckle regions; and identifying one or more vessel wall boundaries based on the identified one or more vessel wall boundaries to modify at least one feature of at least one of the tracked one or more speckle regions such that the at least one speckle region is completely inside or outside the vessel wall (e.g., may be based on identified modify at least one of the position, size or shape of at least one of the tracked one or more speckle regions such that the at least one speckle region is completely within or outside the tube wall outside).
在另一示例性成像方法中,该方法可以包括:提供至少一部分血管位于其中的区域的超声脉冲回波数据;使用至少一部分血管位于其中的区域的一个或多个斑点区域的斑点追踪来追踪至少经过所述至少一部分血管的血流量的运动;以及在执行来自血液中的一个或多个斑点区域的脉冲回波数据的斑点追踪时去除因管壁处的反射而引起的脉冲回波数据中的回波分量(例如,去除因管壁处的反射而引起的脉冲回波数据中的回波分量可以包括使用时变反滤波器来减小因管壁处的反射而引起的脉冲回波数据中的分量)。In another exemplary imaging method, the method may include: providing ultrasound pulse echo data of a region in which at least a portion of the blood vessel is located; tracking at least movement of blood flow through the at least a portion of the blood vessel; and removing in the pulse echo data due to reflections at the vessel wall while performing speckle tracking of the pulse echo data from one or more speckle regions in the blood Echo components (e.g., removing echo components in pulse-echo data due to reflections at pipe walls may include using a time-varying inverse filter to reduce weight).
用于脉管成像的系统的一个示例性实施例可以包括:一个或多个超声换能器(例如,其中该一个或多个换能器被配置成将超声能量递送到脉管区域,从其产生脉冲回波数据);和处理装置,其被配置成(可通过一个程序、例程或指令的执行来操作以引起一个或多个功能的执行):控制以下述帧速率来捕获脉冲回波数据,该帧速率使得所测得的限定所述脉管区域中的至少一部分血管的管壁的位移和所测得的经过所述至少一部分血管的平均血流量随时间具有准周期性分布,以便允许同时对管壁和血流量二者进行运动追踪;使用斑点追踪来生成所述至少一部分血管位于其中的区域的应变和剪切应变图像数据(例如,其中所述斑点追踪可以包括使用所述至少一部分血管位于其中的区域中的经受变形的一个或多个斑点区域的脉冲回波数据的多维相关;所述多维相关可以包括基于互相关脉冲回波数据的相位和幅度梯度来确定采样脉冲回波数据的互相关性峰值);以及基于应变和剪切应变图像数据来识别至少一部分血管位于其中的脉管区域的至少一个脉管特征(例如,其中所述至少一个脉管特征包括与经过血管的流量相关联的流量特征、与血管相关联的结构特征、以及与血管相关联的血流动力学特征中的至少一个)。An exemplary embodiment of a system for vascular imaging may include: one or more ultrasound transducers (e.g., wherein the one or more transducers are configured to deliver ultrasound energy to a vascular region, from which generate pulse-echo data); and processing means configured (operable by execution of a program, routine, or instructions to cause the performance of one or more functions): to control the capture of pulse-echo data at a frame rate of data at a frame rate such that the measured displacement of a vessel wall defining at least a portion of the vessel in said vascular region and the measured mean blood flow through said at least a portion of the vessel have a quasi-periodic distribution over time, to allow simultaneous motion tracking of both the vessel wall and blood flow; using speckle tracking to generate strain and shear strain image data for the region in which the at least a portion of the vessel is located (e.g., wherein the speckle tracking may comprise using the multi-dimensional correlation of pulse-echo data of one or more speckle regions subjected to deformation in the region in which at least a portion of the vessel is located; the multi-dimensional correlation may include determining sampled pulse-echo data based on phase and amplitude gradients of the cross-correlated pulse-echo data cross-correlation peaks of wave data); and identifying at least one vascular feature of a vascular region in which at least a portion of the blood vessel is located based on the strain and shear strain image data (e.g., wherein the at least one vascular feature includes a At least one of a flow characteristic associated with flow, a structural characteristic associated with a blood vessel, and a hemodynamic characteristic associated with a blood vessel).
用于脉管成像的另一示例性系统可以包括:一个或多个超声换能器(例如,其中该一个或多个换能器被配置成将超声能量递送到脉管区域,从其产生脉冲回波数据);和处理装置,其被配置成(可通过一个程序、例程或指令的执行来操作以引起一个或多个功能的执行):控制至少一部分血管位于其中的脉管区域的脉冲回波数据的捕获;以及使用至少一部分血管位于其中的脉管区域的一个或多个斑点区域的斑点追踪来追踪限定所述至少一部分血管的管壁和经过所述至少一部分血管的血流量二者的运动。可以以下述帧速率来捕获脉冲回波数据:该帧速率使得可在与心脏脉搏周期相对应的同一周期性循环内同时测量限定所述至少一部分血管的管壁的位移和经过所述至少一部分血管的血流量。此外,该处理装置可以被配置成基于同时测得的管壁位移和平均血流量来识别所述至少一部分血管位于其中的脉管区域的至少一个脉管特征。在这种系统的一个实施例中,该处理装置还可以可操作用于使用斑点追踪来生成所述至少一部分血管位于其中的区域的应变和剪切应变图像数据(例如,其中所述斑点追踪可以包括使用所述至少一部分血管位于其中的区域中的经受变形的一个或多个斑点区域的采样脉冲回波数据的多维相关;并且另外其中所述多维相关可以包括基于互相关采样脉冲回波数据的相位和幅度梯度来确定采样脉冲回波数据的互相关性峰值)。Another exemplary system for vascular imaging may include: one or more ultrasound transducers (e.g., wherein the one or more transducers are configured to deliver ultrasound energy to a vascular region, from which pulses echo data); and processing means configured (operable by execution of a program, routine, or instructions to cause the performance of one or more functions): to control the pulse of the vascular region in which at least a portion of the blood vessel is located acquisition of echo data; and tracking both a vessel wall defining at least a portion of the vessel and blood flow through the at least a portion of the vessel using speckle tracking of one or more speckle regions of the vessel region in which at least a portion of the vessel is located exercise. The pulse-echo data may be captured at a frame rate such that displacement of a vessel wall defining said at least a portion of the blood vessel and movement through said at least a portion of the blood vessel may be measured simultaneously within the same periodic cycle corresponding to a cardiac pulse cycle. blood flow. Furthermore, the processing device may be configured to identify at least one vascular characteristic of the vascular region in which the at least part of the blood vessel is located based on the simultaneously measured vessel wall displacement and mean blood flow. In an embodiment of such a system, the processing means may be further operable to use speckle tracking to generate strain and shear strain image data of the region in which said at least a portion of the blood vessel is located (e.g., wherein said speckle tracking may comprising multidimensional correlation using sampled pulse-echo data of one or more speckle regions subjected to deformation in the region in which said at least a portion of the vessel is located; and further wherein said multidimensional correlation may comprise cross-correlation based sampled pulse-echo data phase and amplitude gradients to determine cross-correlation peaks of sampled pulse-echo data).
在这里提供的示例性系统的一个或多个实施例中,该处理装置可以可操作用于识别一个或多个管壁边界,并且更进一步地,该处理装置可以可操作用于:当使用斑点追踪时,基于所识别的一个或多个管壁边界来修改被追踪的一个或多个斑点区域中的至少一个的特征(例如位置、尺寸、形状等等)以使得所述至少一个斑点区域完全在管壁之内或之外。In one or more embodiments of the exemplary systems provided herein, the processing means may be operable to identify one or more vessel wall boundaries, and further, the processing means may be operable to: when using blob While tracking, modifying at least one feature (such as position, size, shape, etc.) of the tracked one or more speckle regions based on the identified one or more vessel wall boundaries so that the at least one speckle region is completely inside or outside the pipe wall.
此外,在示例性系统的一个或多个实施例中,该处理装置可以可操作用于识别整个血管周围的管壁边界;该处理装置可以可操作用于测量一个或多个管壁边界内的组织特性;该处理装置可以可操作用于识别邻近所述一个或多个管壁边界的斑块构造的一个或多个部分;以及/或者该处理装置可以可操作用于基于同时对血流和管壁的运动二者的运动追踪来计算一个或多个血流动力学测量结果。Furthermore, in one or more embodiments of the exemplary system, the processing means may be operable to identify vessel wall boundaries around the entire vessel; the processing means may be operable to measure tissue properties; the processing device may be operable to identify one or more portions of plaque formation adjacent to the one or more vessel wall boundaries; and/or the processing device may be operable to Motion tracking of both the motion of the vessel wall to calculate one or more hemodynamic measurements.
更进一步地,在这里提供的示例性系统的一个或多个实施例中,该处理装置可以可操作用于使用一个或多个斑点区域的采样脉冲回波数据的二维相关(例如以追踪斑点区域),以及甚至三维相关。Still further, in one or more embodiments of the exemplary system provided herein, the processing means may be operable to use two-dimensional correlation of sampled pulse-echo data of one or more speckle regions (e.g. to track speckle area), and even three-dimensional correlations.
再进一步地,在这里提供的示例性系统的一个或多个实施例中,该系统还可以包括用于基于至少一部分血管位于其中的区域的至少一个脉管特征的识别来向患者递送疗法(例如,可操作用于使用超声能量以基于至少一部分血管位于其中的区域的至少一个脉管特征的识别来递送疗法的设备)。例如,疗法装置可以包括至少一个被配置成发射和接收超声能量的换能器,其中该至少一个换能器可操作用于基于至少一部分血管位于其中的区域的至少一个脉管特征的识别来提供递送疗法的超声能量,并且所述至少一个换能器可操作以用于获得脉冲回波数据以生成图像数据。Still further, in one or more embodiments of the exemplary system provided herein, the system may further include means for delivering therapy to the patient based on the identification of at least one vascular characteristic of the region in which at least a portion of the blood vessel is located (e.g., , a device operable to use ultrasound energy to deliver therapy based on identification of at least one vascular feature of a region in which at least a portion of the blood vessel is located). For example, a therapy device may include at least one transducer configured to transmit and receive ultrasonic energy, wherein the at least one transducer is operable to provide Therapeutic ultrasound energy is delivered, and the at least one transducer is operable to obtain pulse-echo data to generate image data.
更进一步地,在这里提供的示例性系统的一个或多个实施例中,该处理装置可以可操作用于使用二维斑点追踪来生成所述至少一部分血管位于其中的区域的应变和剪切应变图像数据,其中使用二维斑点追踪包括生成轴向应变和轴向剪切应变图像数据以及/或者横向应变和横向剪切应变图像数据中的至少一个。此外,例如,该处理装置可以可操作用于控制使用编码激励来提供至少一部分血管位于其中的区域的超声脉冲回波数据。Still further, in one or more embodiments of the exemplary systems provided herein, the processing device may be operable to use two-dimensional speckle tracking to generate strain and shear strain for the region in which the at least a portion of the blood vessel is located The image data, wherein using two-dimensional speckle tracking includes generating at least one of axial strain and axial shear strain image data and/or transverse strain and transverse shear strain image data. Furthermore, for example, the processing means may be operable to control the use of encoded excitations to provide ultrasound pulse echo data of the region in which at least a portion of the blood vessel is located.
更进一步地,在这里提供的示例性系统的一个或多个实施例中的另一个中,该处理装置可以可操作用于将去混响滤波器应用于来自血液中的一个或多个斑点区域的脉冲回波数据,以便在执行来自血液中的一个或多个斑点区域的脉冲回波数据的斑点追踪时去除因管壁处的反射而引起的脉冲回波数据中的回波分量。Still further, in another of the one or more embodiments of the exemplary system provided herein, the processing means may be operable to apply a dereverberation filter to one or more speckle regions from the blood The pulse-echo data for removing echo components in the pulse-echo data due to reflections at the vessel wall when performing speckle tracking of the pulse-echo data from one or more speckle regions in the blood.
用于脉管成像的另一示例性系统可以包括:一个或多个超声换能器(例如,其中该一个或多个换能器被配置成将超声能量递送到脉管区域,从其产生脉冲回波数据);和处理装置,其被配置成:控制至少一部分血管位于其中的脉管区域的超声脉冲回波数据的捕获;使用所述至少一部分血管位于其中的脉管区域的一个或多个斑点区域的斑点追踪来追踪限定所述至少一部分血管的管壁和经过所述至少一部分血管的血流量中的至少一个的运动;基于所述一个或多个斑点区域的斑点追踪来识别一个或多个管壁边界;以及基于所识别的一个或多个管壁边界来修改被追踪的一个或多个斑点区域中的至少一个的特征,以使得所述至少一个斑点区域完全在管壁之内或之外。例如,该处理装置可以可操作用于基于所识别的一个或多个管壁边界来修改至少一个斑点区域的位置、尺寸或形状中的至少一个,以使得所述至少一个斑点区域完全在管壁之内或之外。Another exemplary system for vascular imaging may include: one or more ultrasound transducers (e.g., wherein the one or more transducers are configured to deliver ultrasound energy to a vascular region, from which pulses echo data); and a processing device configured to: control the capture of ultrasound pulse echo data of the vascular region in which at least a portion of the blood vessel is located; use one or more of the vascular regions in which the at least a portion of the blood vessel is located Speckle tracking of the speckle region to track movement of at least one of a vessel wall defining the at least a portion of the vessel and blood flow through the at least a portion of the vessel; identifying one or more speckle regions based on the speckle tracking of the one or more speckle regions and modifying, based on the identified one or more wall boundaries, the characteristics of at least one of the tracked one or more speckle regions such that the at least one speckle region is completely within the tube wall or outside. For example, the processing means may be operable to modify at least one of the location, size or shape of the at least one speckle region based on the identified one or more vessel wall boundaries such that the at least one speckle region is completely within the vessel wall inside or outside.
在用于脉管成像的另一示例性系统中,该系统可以包括:一个或多个超声换能器(例如,其中该一个或多个换能器被配置成将超声能量递送到脉管区域,从其产生脉冲回波数据);和处理装置,其被配置成:控制至少一部分血管位于其中的脉管区域的超声脉冲回波数据的捕获;使用至少一部分血管位于其中的区域的一个或多个斑点区域的斑点追踪来追踪至少经过所述至少一部分血管的血流量的运动;以及在执行来自血液中的一个或多个斑点区域的脉冲回波数据的斑点追踪时去除因管壁处的反射而引起的脉冲回波数据中的回波分量(例如,使用时变反滤波器来减小因管壁处的反射而引起的脉冲回波数据中的分量)。In another exemplary system for vascular imaging, the system may include: one or more ultrasound transducers (e.g., wherein the one or more transducers are configured to deliver ultrasound energy to a vascular region , from which pulse-echo data are generated); and a processing device configured to: control the capture of ultrasound pulse-echo data for the region of the vessel in which at least a portion of the blood vessel is located; use one or more Speckle tracking of one or more speckle regions to track movement of blood flow at least through said at least a portion of the blood vessel; echo components in the pulse-echo data (eg, using a time-varying inverse filter to reduce components in the pulse-echo data due to reflections at the pipe wall).
更进一步地,用于脉管成像的另一示例性系统可以包括:一个或多个超声换能器(例如,其中该一个或多个换能器被配置成将超声能量递送到脉管区域,从其产生脉冲回波数据);用于控制以下述帧速率来捕获脉冲回波数据的装置,该帧速率使得所测得的限定所述脉管区域中的至少一部分血管的管壁的位移和所测得的经过所述至少一部分血管的平均血流量随时间具有准周期性分布,以便允许同时对管壁和血流量二者进行运动追踪;用于使用斑点追踪来生成所述至少一部分血管位于其中的区域的应变和剪切应变图像数据的装置(例如,其中所述斑点追踪可以包括使用所述至少一部分血管位于其中的区域中的经受变形的一个或多个斑点区域的脉冲回波数据的多维相关;并且进一步地,其中所述多维相关可以包括基于互相关脉冲回波数据的相位和幅度梯度来确定采样脉冲回波数据的互相关性峰值);以及用于基于应变和剪切应变图像数据来识别至少一部分血管位于其中的脉管区域的至少一个脉管特征的装置(例如,其中所述至少一个脉管特征包括与经过血管的流量相关联的流量特征、与血管相关联的结构特征、以及与血管相关联的血流动力学特征中的至少一个)。进一步地,例如,该系统可以包括用于基于至少一部分血管位于其中的区域的至少一个脉管特征的识别来向患者递送疗法的疗法装置(例如超声疗法装置)。Still further, another exemplary system for vascular imaging may include: one or more ultrasound transducers (e.g., wherein the one or more transducers are configured to deliver ultrasound energy to a vascular region, Generate pulse-echo data therefrom); means for controlling the capture of pulse-echo data at a frame rate such that the measured displacement and The measured mean blood flow through the at least a portion of the blood vessel has a quasi-periodic distribution over time to allow simultaneous motion tracking of both the vessel wall and blood flow; for generating the at least a portion of the blood vessel using speckle tracking Means for strain and shear strain image data of a region therein (for example, wherein said speckle tracking may comprise using pulse-echo data of one or more speckle regions undergoing deformation in a region in which said at least a portion of a blood vessel is located and further, wherein the multidimensional correlation may include determining cross-correlation peaks of sampled pulse-echo data based on phase and amplitude gradients of the cross-correlation pulse-echo data); and for determining cross-correlation peaks based on strain and shear strain image data to identify at least one vascular feature of a vascular region in which at least a portion of the blood vessel is located (e.g., wherein the at least one vascular feature includes a flow feature associated with flow through the blood vessel, a structure associated with the blood vessel characteristics, and at least one of hemodynamic characteristics associated with blood vessels). Further, for example, the system may include a therapy device (eg, an ultrasound therapy device) for delivering therapy to a patient based on identification of at least one vascular characteristic of a region in which at least a portion of the blood vessel is located.
上面的概括不意图描述本公开的每个实施例或每个实施方式。通过参考结合附图作出的下面的详细描述和权利要求,更全面的理解将变得显而易见且被认识到。The above summary is not intended to describe each embodiment or every implementation of the present disclosure. A fuller understanding will become apparent and appreciated by reference to the following detailed description and claims taken in conjunction with the accompanying drawings.
附图说明Description of drawings
图1是描绘具有可选疗法系统的示例性超声成像系统的框图。FIG. 1 is a block diagram depicting an exemplary ultrasound imaging system with an optional therapy system.
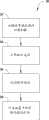
图2是描绘示例性超声成像方法的流程图。2 is a flowchart depicting an exemplary ultrasound imaging method.
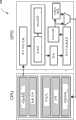
图3是图1中总体示出的成像系统的一个示例性实施例的框图。FIG. 3 is a block diagram of an exemplary embodiment of the imaging system shown generally in FIG. 1 .
图4是成像系统(诸如图3中示出的成像系统)的一个示例性GPU实施方式的框图。FIG. 4 is a block diagram of an exemplary GPU implementation of an imaging system, such as the imaging system shown in FIG. 3 .
图5A-5D提供了示出以各个帧速率捕获的图像数据的随时间变化的通道直径和平均流速的示例性曲线图。5A-5D provide exemplary graphs showing channel diameter and average flow velocity over time for image data captured at various frame rates.
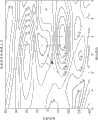
图6A-6B示出包括用于描述可用在图1-2中总体示出的成像方法和/或系统中的斑点追踪的一个示例性实施例的互相关性的某些参数的等值线的曲线图。Figures 6A-6B illustrate contour lines including certain parameters for describing the cross-correlation of an exemplary embodiment that may be used in the imaging method and/or system shown generally in Figures 1-2. Graph.
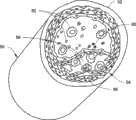
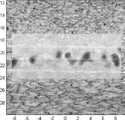
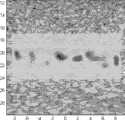
图7提供了在描述图1-2中总体示出的一个或多个方法和/或系统(当它们与脉管诊断或脉管疗法有关时)中使用的血管的示例性图像。7 provides exemplary images of blood vessels used in describing one or more of the methods and/or systems generally shown in FIGS. 1-2 as they relate to vascular diagnostics or vascular therapy.
图8A-8B示出与这里至少部分地实施和描述的示例有关的流通道壁的轴向应变和轴向剪切应变图像。8A-8B show axial strain and axial shear strain images of a flow channel wall in connection with an example at least partially embodied and described herein.
图9A-9B示出与这里至少部分地实施和描述的示例有关的流通道壁的横向应变和横向剪切应变图像。9A-9B show lateral strain and lateral shear strain images of a flow channel wall in connection with an example at least partially implemented and described herein.
图10示出与这里至少部分地实施和描述的示例有关的根据随时间追踪的通道壁位移计算的通道直径和从流通道内随时间追踪的流体位移获得的平均流速的曲线图。10 shows a graph of channel diameter calculated from channel wall displacement tracked over time and average flow velocity obtained from fluid displacement tracked over time within a flow channel in connection with an example at least partially implemented and described herein.
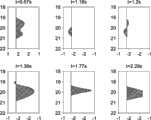
图11示出与这里至少部分地实施和描述的示例有关的在不同时间实例处通道的总位移矢量波形的曲线图。Figure 11 shows a graph of the total displacement vector waveform of a channel at different time instances in relation to an example at least partially implemented and described herein.
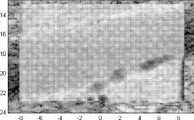
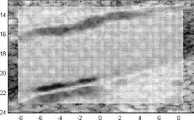
图12A-12B示出与这里至少部分地实施和描述的示例有关的颈动脉纵向管壁的轴向应变和轴向剪切应变图像。12A-12B show axial strain and axial shear strain images of a longitudinal wall of a carotid artery in connection with an example at least partially embodied and described herein.
图13A-13B示出与这里至少部分地实施和描述的示例有关的颈动脉纵向管壁的横向应变和横向剪切应变图像。13A-13B show transverse strain and transverse shear strain images of a longitudinal wall of a carotid artery in connection with an example at least partially embodied and described herein.
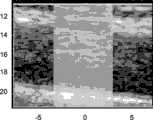
图14A-14B示出与这里至少部分地实施和描述的示例有关的颈动脉横截面管壁的轴向应变和轴向剪切应变图像。14A-14B show axial strain and axial shear strain images of a carotid artery cross-sectional wall in connection with an example at least partially embodied and described herein.
图15A-15B示出与这里至少部分地实施和描述的示例有关的颈动脉横截面管壁的横向应变和横向剪切应变图像。15A-15B show transverse strain and transverse shear strain images of a carotid artery cross-sectional wall in relation to an example at least partially embodied and described herein.
图16A-16B示出与去混响滤波示例有关的横向和轴向位移。16A-16B illustrate lateral and axial displacements associated with an example of dereverberation filtering.
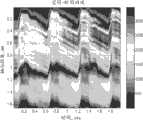
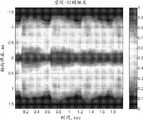
图17A-17B示出与去混响滤波示例有关的空间-时间图。17A-17B show space-time diagrams related to examples of dereverberation filtering.
图18A-18B示出与去混响滤波示例有关的空间-时间图。18A-18B show space-time diagrams related to examples of dereverberation filtering.
图19A-19D示出与这里给出的示例的去混响滤波结果有关的曲线图。19A-19D show graphs related to the dereverberation filtering results of the examples presented here.
具体实施方式Detailed ways
在说明性实施例的以下详细描述中,参考形成其一部分的图示的附图,并且在所述附图中以说明的方式示出可以实施的具体实施例。要理解,在不偏离(例如仍落入)由此给出的公开的范围的情况下可以利用其他实施例并且作出结构改变。In the following detailed description of the illustrative embodiments, reference is made to the accompanying drawings which form a part hereof, and in which are shown by way of illustration specific embodiments that may be practiced. It is to be understood that other embodiments may be utilized and structural changes may be made without departing from (eg, still falling within) the scope of the disclosure thus given.
将参考图1-19来描述示例性方法、装置和系统。本领域技术人员将会认识到,来自一个实施例的元件或过程(例如包括其步骤)可以结合其他实施例的元件或过程来使用,并且使用这里阐述的特征的组合的这些方法、装置和系统的可能实施例不限于图中示出和/或这里所述的具体实施例。进一步地,将会认识到,这里所述的实施例可以包括不必按照比例示出的许多元件。更进一步地,将会认识到,这里的过程的时序以及各种元件的尺寸和形状可以被修改但是仍落在本公开的范围内,尽管某些时序、一个或多个形状和/或尺寸、或元件的类型可能比其他的更有利。Exemplary methods, apparatus, and systems will be described with reference to FIGS. 1-19. Those skilled in the art will recognize that elements or processes (eg, including steps thereof) from one embodiment can be used in combination with elements or processes of other embodiments, and that methods, apparatus and systems using combinations of features set forth herein The possible embodiments of the invention are not limited to the specific embodiments shown in the figures and/or described herein. Further, it will be appreciated that the embodiments described herein may include many elements that are not necessarily shown to scale. Still further, it will be appreciated that the timing of the processes herein and the size and shape of the various elements may be modified and still fall within the scope of the present disclosure, although certain timing, shape(s and/or dimensions, or element types may be more favorable than others.
图1示出示例性超声成像系统10,其包括处理装置(框12)以及一个或多个超声换能器(框22),诸如提供脉冲的发射和回波的接收的换能器阵列。该处理装置(框12)可以可操作地耦合到一个或多个换能器(框22)以便使用该一个或多个换能器(框22)来促进感兴趣的图像的成像(例如脉冲回波数据的捕获)。此外,该处理装置(框12)包括数据储存器(框14)。数据储存器(框14)允许对可被采用以实施示例性成像方法(例如图2的框图中总体示出的方法)的处理程序或例程(框16)以及一个或多个其他类型的数据(框18)的访问。FIG. 1 shows an exemplary
例如,处理程序或例程(框16)可以包括用于执行计算数学、矩阵数学、压缩算法(例如数据压缩算法)、校准算法、图像构建算法、反演算法、信号处理算法、标准化算法、比较算法、向量数学、或实施如这里所述的一个或多个实施例所需的任何其他处理(例如提供成像、实施斑点追踪、生成应变图像等等)的程序或例程。这里参考图3-19来更具体地描述可在这里所述的系统和方法中使用的示例性数学公式/等式。For example, a processing program or routine (block 16) may include functions for performing computational mathematics, matrix mathematics, compression algorithms (such as data compression algorithms), calibration algorithms, image construction algorithms, inversion algorithms, signal processing algorithms, normalization algorithms, comparison Algorithms, vector mathematics, or any other processing required to implement one or more embodiments as described herein (eg, provide imaging, perform speckle tracking, generate strain images, etc.) programs or routines. Exemplary mathematical formulas/equations that may be used in the systems and methods described herein are described in more detail herein with reference to FIGS. 3-19.
数据(框18)可以包括例如采样脉冲回波信息(例如使用该一个或多个换能器(框22)而采样或收集)、表示测量结果的数据(例如脉管特征)、来自根据这里的公开而采用的一个或多个处理程序或例程的结果(例如感兴趣的对象(诸如血管或其周围的区域)的重构应变图像)、或实施这里所述的一个或多个过程或方法可能所必需的任何其他数据。Data (block 18) may include, for example, sampled pulse echo information (e.g., sampled or collected using the one or more transducers (block 22)), data representing measurements (e.g., vessel characteristics), from results of one or more processing procedures or routines employed for disclosure (e.g., reconstructed strain images of an object of interest, such as a blood vessel or the region surrounding it), or implementation of one or more procedures or methods described herein Any other data that may be necessary.
在一个或多个实施例中,可以使用在可编程计算机上执行的一个或多个计算机程序来实施该系统10,所述可编程计算机诸如是包括例如处理能力(例如计算机处理单元(CPU)、图形处理单元(GPU))、数据储存器(例如易失性或非易失性存储器和/或存储元件)、输入设备和输出设备的计算机。这里所述的程序代码和/或逻辑可以被应用于输入数据以执行这里所述的功能且生成期望的输出信息(例如应变图像、脉管特征等等)。输出信息可以作为输入而被应用于如这里所述的一个或多个其他设备和/或过程(例如一个或多个疗法装置(框20),诸如药物疗法装置、超声疗法装置等等),或者以其他方式被如这里所述的一个或多个其他设备和/或过程使用。In one or more embodiments, the
可以使用任何可编程语言(例如适合于与计算机系统进行通信的高级过程和/或面向对象的编程语言)来提供用于实施这里所述的过程的(一个或多个)程序或(一个或多个)例程。任何这样的程序可以例如被存储在任何适合的设备(例如存储介质)上,当该适合的设备被读取以用于执行这里所述的过程时,所述程序可被用于配置和操作计算机的通用或专用程序、计算机或处理器装置(例如(一个或多个)处理器)读取。换言之,至少在一个实施例中,可以使用配置有计算机程序的计算机可读存储介质来实施该系统10,其中这样配置的存储介质使得计算机以特定和预定义的方式操作以执行这里所述的功能。The program(s) or (one or more ) routines. Any such program may, for example, be stored on any suitable device (such as a storage medium) which, when read for carrying out the processes described herein, can be used to configure and operate a computer general-purpose or special-purpose program, computer or processor device (such as processor(s)) reads. In other words, in at least one embodiment, the
同样地,该成像系统10可以被配置在远程站点(例如应用服务器)处,该远程站点允许一个或多个用户经由远程计算机装置(例如经由网页浏览器)访问,并且该远程站点允许用户采用根据本公开的功能(例如用户访问与一个或多个程序相关联的图形用户界面以处理数据)。Likewise, the
该处理装置(框12)可以是例如任何固定或移动计算机系统(例如,具有例如CPU、GPU等等的个人计算机或小型计算机)。计算装置的准确配置不进行限制,并且本质上可以使用能够提供合适的计算能力和控制能力(例如控制成像设置配置且获取数据(诸如脉冲回波数据))的任何设备。此外,预期结合处理装置(框12)使用各种外围设备(诸如计算机显示器、鼠标、键盘、存储器、打印机、扫描仪等等),诸如用于成像结果的可视化(例如,应变图像的显示、诸如与高强度聚焦超声的使用一起对疗法递送的实时显示等等)。The processing device (block 12 ) may be, for example, any stationary or mobile computer system (eg, a personal computer or minicomputer with eg a CPU, GPU, etc.). The exact configuration of the computing means is not limiting and essentially any device capable of providing suitable computing power and control capabilities (eg controlling imaging setup configuration and acquiring data such as pulse echo data) may be used. Furthermore, the use of various peripherals (such as computer monitors, mice, keyboards, memory, printers, scanners, etc.) in conjunction with the processing means (block 12), such as for visualization of imaging results (eg, display of strain Real-time display of therapy delivery with use of high-intensity focused ultrasound, etc.).
此外,在一个或多个实施例中,输出(例如图像、图像数据、图像数据文件、数字文件、具有用户可读格式的文件等等)可以被用户分析、被基于其提供输出的另一机器使用等等。Furthermore, in one or more embodiments, output (e.g., images, image data, image data files, digital files, files in a user-readable format, etc.) may be analyzed by the user, another machine based on which the output is provided use etc.
如这里所述的那样,数字文件可以是包含这里所述的处理装置(框14)可能可读和/或写的(例如以二进制、三进制编码的)数字比特的任何介质(例如易失性或非易失性存储器、CD-ROM、穿孔卡、磁性可记录带等等)。As described herein, a digital file may be any medium (e.g., volatile volatile or nonvolatile memory, CD-ROM, punched cards, magnetically recordable tape, etc.).
此外,如这里所述的那样,具有用户可读格式的文件可以是可呈现在任何介质(例如纸、显示器、声波等等)上的用户可读和/或可理解的任何数据表示(例如ASCII文本、二进制数、十六进制数、十进制数、音频、图形)。Furthermore, as described herein, a file in a user-readable format may be any user-readable and/or intelligible representation of data (e.g., ASCII text, binary, hexadecimal, decimal, audio, graphics).
一般来说,如这里所述的方法和系统可以利用实施计算数学(例如矩阵求逆、替代、傅里叶变换技术等等)的算法来(例如根据脉冲回波数据)重构这里所述的图像。In general, methods and systems as described herein can utilize algorithms implementing computational mathematics (e.g., matrix inversion, substitution, Fourier transform techniques, etc.) to reconstruct (e.g., from pulse-echo data) the image.
鉴于以上内容,将显而易见的是,如在根据本公开的一个或多个实施例中描述的功能可以以如本领域技术人员将已知的任何方式来实施。由此,用于实施这里所述的过程的计算机语言、计算机系统或任何其他软件/硬件应该不会对这里所述的系统、过程或程序(例如由这些系统、过程或程序提供的功能)的范围进行限制。In view of the above it will be apparent that the functionality as described in one or more embodiments according to the present disclosure may be implemented in any way as would be known to a person skilled in the art. Accordingly, computer languages, computer systems, or any other software/hardware used to implement the processes described herein should have no The scope is limited.
将会认识到,可以结合这里所述的实施例使用图形用户界面。该用户界面可以提供允许用户向其输入的各种特征、输入的改变、文件的导入或导出、或者通常可适合于与这里所述的过程一起使用的任何其他特征。例如,用户界面可以允许使用缺省值或者可能需要输入某些值、界限、阈值或其他相关信息。It will be appreciated that graphical user interfaces may be used in conjunction with the embodiments described herein. The user interface may provide various features that allow a user to input thereto, change of input, import or export of files, or any other feature generally suitable for use with the processes described herein. For example, the user interface may allow for default values or may require the entry of certain values, limits, thresholds, or other relevant information.
本公开中描述的方法(包括归属于系统或各种构成组件的那些方法)可以至少部分以硬件、软件、固件或其任何组合来实施。例如,可以在一个或多个处理器内实施该技术的各种方面,该一个或多个处理器包括一个或多个微处理器、DSP、ASIC、FPGA、或任何其他等效集成或分立逻辑电路,以及这些组件、图像处理设备或其他设备的任何组合。术语“处理器”或“处理电路”通常可以指代独立地或结合其他逻辑电路或任何其他等效电路的任何前述逻辑电路。The methods described in this disclosure, including those methods attributed to a system or various constituent components, may be implemented at least in part in hardware, software, firmware, or any combination thereof. For example, various aspects of the technology may be implemented within one or more processors including one or more microprocessors, DSPs, ASICs, FPGAs, or any other equivalent integrated or discrete logic circuits, and any combination of these components, image processing devices, or other devices. The terms "processor" or "processing circuitry" may generally refer to any of the foregoing logic circuitry alone or in combination with other logic circuitry or any other equivalent circuitry.
可以在同一设备或分离的设备内实施这样的硬件、软件和/或固件以便支持本公开中描述的各种操作和功能。此外,任何所述组件可以一起实施或者分离地实施为分立但能共同操作的逻辑设备。例如使用框图等等来描绘不同特征意图突出不同功能方面并且不一定暗示这些特征必须由分离的硬件或软件组件来实现。相反,功能可以由分离的硬件或软件组件来执行或者集成在共同或分离的硬件或软件组件中。Such hardware, software and/or firmware may be implemented within the same device or in separate devices to support the various operations and functions described in this disclosure. In addition, any of the described components may be implemented together or separately as discrete but interoperable logic devices. Depiction of different features, such as using block diagrams and the like, is intended to highlight different functional aspects and does not necessarily imply that these features must be realized by separate hardware or software components. Rather, the functions may be performed by separate hardware or software components or integrated in common or separate hardware or software components.
当以软件来实施时,归属于本公开中所述的系统、设备和方法的功能可以被体现为计算机可读介质(诸如RAM、ROM、NVRAM、EEPROM、FLASH存储器、磁性数据存储介质、光学数据存储介质等等)上的指令。该指令可以由一个或多个处理器来执行以支持本公开中所述的功能的一个或多个方面。When implemented in software, the functionality attributed to the systems, devices, and methods described in this disclosure can be embodied as a computer-readable medium (such as RAM, ROM, NVRAM, EEPROM, FLASH memory, magnetic data storage media, optical data instructions on storage media, etc.). The instructions may be executed by one or more processors to support one or more aspects of the functionality described in this disclosure.
成像系统10还可以与可选疗法装置(框20)一起使用或者可以形成可选疗法装置(框20)的一部分。例如,疗法装置(框20)可以使用超声成像的结果来提供一个或多个疗法。在一个或多个实施例中,该疗法装置(框20)可以是无创或有创疗法装置,诸如药物递送装置或系统(将药物递送到特定位置)、外科装置或系统(例如将支架递送到特定位置)、消融装置或系统(例如高频或高强度聚焦超声疗法装置或系统)等等。The
在一个或多个实施例中,该疗法装置(框20)可以是接收来自成像系统的输出(例如图像信息)且递送一个或多个疗法的单独的系统或装置。在其他实施例中,该疗法装置(框20)可以与成像系统集成以执行一个或多个疗法(例如使用(一个或多个)双模式超声换能器的高强度聚焦超声系统;用于诊断(诸如成像)以及用于治疗(诸如消融))。例如,在一个或多个实施例中,该疗法装置(框20)可以包括诸如2008年12月31日公开的名称为“Image Guided Plaque Ablation”且通过引用合并于此的PCT国际公开No. WO2009/002492中描述的系统的一个或多个部分。例如,这里所述的超声成像可以被用来无创地减小脉管斑块。例如,这里所述的超声成像可以被用来识别无创地执行如PCT国际公开No. WO2009/002492中所述的斑块的消融所需的流和脉管特征。In one or more embodiments, the therapy device (block 20 ) may be a separate system or device that receives output from the imaging system (eg, image information) and delivers one or more therapies. In other embodiments, the therapy device (block 20) may be integrated with an imaging system to perform one or more therapies (e.g., a high-intensity focused ultrasound system using dual-mode ultrasound transducer(s); for diagnostic (such as imaging) and for treatment (such as ablation)). For example, in one or more embodiments, the therapy device (box 20) may comprise a device such as PCT International Publication No. WO2009, published December 31, 2008, entitled "Image Guided Plaque Ablation" and incorporated herein by reference. One or more parts of the system described in /002492. For example, ultrasound imaging as described herein can be used to reduce plaque non-invasively. For example, ultrasound imaging as described herein can be used to identify flow and vascular features required to non-invasively perform ablation of plaque as described in PCT International Publication No. WO2009/002492.
例如,疗法系统可以是用于通过超声能量波无创地提升组织的温度的系统,其包括:至少一个超声递送设备,其被适配成将超声能量波递送到目标组织的焦点;温度监测设备,其用于监测焦点处目标组织的温度;以及控制器,其用于操纵和控制超声递送设备以在焦点处递送超声能量波从而将目标组织的温度提升到期望温度。For example, the therapy system may be a system for non-invasively raising the temperature of tissue by ultrasonic energy waves comprising: at least one ultrasonic delivery device adapted to deliver the ultrasonic energy waves to a focal point of the target tissue; a temperature monitoring device, It is used to monitor the temperature of the target tissue at the focal point; and a controller is used to manipulate and control the ultrasound delivery device to deliver waves of ultrasonic energy at the focal point to raise the temperature of the target tissue to a desired temperature.
进一步地,例如,疗法系统可以使用这里所述的一个或多个成像系统来产生哺乳动物身体的至少一部分的图像,例如以使得可以确定至少一个脉管斑块在所述图像中的位置并且查明所述脉管斑块的基部的位置。例如,超声递送设备可以查明斑块基部处的一个或多个目标位置。更进一步地,可以在用于使用超声疗法系统(例如,其可以是用于成像的同一超声系统(其超声换能器))通过能量波来提升目标位置处的温度的方法中使用这里提供的成像系统的一个或多个实施例。例如,该方法可以包括:将一束超声能量波从源递送到目标位置;监测目标位置的温度;以及如果已经到达目标位置处的期望温度,则停止该束超声能量波的递送。Further, for example, a therapy system can use one or more of the imaging systems described herein to generate an image of at least a portion of a mammalian body, for example, such that the location of at least one plaque in the image can be determined and examined. The location of the base of the vascular plaque is illustrated. For example, an ultrasound delivery device may pinpoint one or more target locations at the base of the plaque. Still further, the methods provided herein can be used in methods for raising the temperature at a target location with energy waves using an ultrasound therapy system (for example, it can be the same ultrasound system (its ultrasound transducer) used for imaging). One or more embodiments of an imaging system. For example, the method may include: delivering a beam of ultrasonic energy waves from a source to a target location; monitoring the temperature of the target location; and ceasing delivery of the beam of ultrasonic energy waves if a desired temperature at the target location has been reached.
进一步地,准备用于无创地提升管壁中组织的温度从而导致脉管斑块消退的计划的方法可以包括:对身体的至少一部分进行成像以产生图像(例如使用如这里所述的超声成像来对脉管区域进行成像);确定至少一个脉管斑块在所述图像中的位置;查明所述脉管斑块的基部的位置以及斑块基部处的一个或多个目标位置(例如使用超声所生成的图像);以及/或者确定用于将超声能量波从源递送到焦点以便将管壁中目标组织的温度提升到足以减小或破坏血管滋养管的期望温度的参数。Further, the method of preparing a plan for non-invasively elevating the temperature of tissue in a vessel wall to cause plaque regression may include imaging at least a portion of the body to produce an image (e.g., using ultrasound imaging as described herein to imaging a vascular region); determining the location of at least one plaque in said image; ascertaining the location of the base of said plaque and one or more target locations at the plaque base (e.g., using images generated by ultrasound); and/or determining parameters for delivering waves of ultrasound energy from a source to a focal point in order to raise the temperature of target tissue in the vessel wall to a desired temperature sufficient to reduce or destroy the vasa vasorum.
进一步地,例如,这里所述的超声成像可以被用来识别执行斑块的有创治疗(例如支架递送、心脏外科手术等等)所需的流和脉管特征。Further, for example, ultrasound imaging as described herein may be used to identify flow and vascular characteristics required to perform invasive treatments of plaque (eg, stent delivery, cardiac surgery, etc.).
更进一步地,在一个或多个实施例中,疗法装置(框20)可以包括诸如在2010年6月9日提交的名称为“Dual Mode Ultrasound Transducer (DMUT) System for Monitoring and Control of Lesion Formation Dynamics”且通过引用合并于此的美国临时专利申请No. 61/353,096中描述的系统的一个或多个部分。例如,可以利用在其中描述的相同或相似换能器阵列来执行这里所述的超声成像,所述换能器阵列可以被用于成像(例如以监视疗法过程)以及递送疗法(例如以递送高强度聚焦超声能量)二者。例如,可以使用超声换能器阵列来递送疗法,同时使用同一换能器阵列的成像模式可以被用来引导疗法波束,评估热和机械组织反应以估计疗法的剂量(例如疗法的初始剂量),在疗法期间监视组织反应并对其进行表征,以及评估在完成对疗法超声能量的每次暴露时被治疗组织的状态(例如在疗法递送时段之间实时监视)。Still further, in one or more embodiments, the therapy device (box 20) may include a device such as that filed on June 9, 2010 entitled "Dual Mode Ultrasound Transducer (DMUT) System for Monitoring and Control of Lesion Formation Dynamics " and one or more portions of the system described in U.S. Provisional Patent Application No. 61/353,096, which is incorporated herein by reference. For example, the ultrasound imaging described herein can be performed using the same or similar transducer arrays described therein, which can be used for imaging (eg, to monitor the course of therapy) and to deliver therapy (eg, to deliver high intensity focused ultrasound energy) both. For example, ultrasound transducer arrays can be used to deliver therapy, while imaging modalities using the same transducer array can be used to steer therapy beams, assess thermal and mechanical tissue responses to estimate therapy dose (e.g., initial dose of therapy), Monitor and characterize tissue response during therapy, and assess the state of treated tissue at the completion of each exposure to therapeutic ultrasound energy (eg, real-time monitoring between therapy delivery sessions).
例如,如这里所述的超声成像可以被用来识别一个或多个脉管特征。在图7中示出血管50的示例性图示以促进对使用这里所述的成像的使用的讨论。图7中示出的血管50包括管壁52,其具有形成在管壁52内部上的斑块结构54。结构54的斑块构造可以包括例如斑块基部56、脂质核心58和纤维或钙化帽60。血液62流过由管壁52限定的血管50。For example, ultrasound imaging as described herein may be used to identify one or more vascular features. An exemplary illustration of a
这里所述的方法和/或系统的一个或多个实施例可以被用来识别一个或多个脉管特征,例如与经过血管50的流量相关联的流量特征,与血管50相关联的结构特征、以及/或者血流动力学特征。例如,流量特征可以包括流速、容积流量、壁剪切应力、壁剪切速率等等。One or more embodiments of the methods and/or systems described herein may be used to identify one or more vessel features, such as flow features associated with flow through
例如,结构特征可以包括确定管壁的边界(例如外边界和内边界,诸如在坐标系中)、管壁的厚度、管壁内组织特性的测量结果(例如组织的硬度,诸如例如其与患病状态有关)、斑块与管壁的区别、斑块的各个组分的区别(例如,基部与脂质核心的区别、基部与纤维帽的区别、脂质核心与纤维帽的区别等等)等等。例如,在一个或多个实施例中,在将斑块构造的基部与纤维帽相区别时,可以提供治疗以使基部消融从而减小进一步的斑块构建或生长或者根据PCT国际公开No. WO2009/002492提供治疗。For example, structural characterization may include determining the boundaries of the vessel wall (e.g., outer and inner boundaries, such as in a coordinate system), the thickness of the vessel wall, measurements of tissue properties within the vessel wall (e.g., the stiffness of the tissue, such as, for example, its disease state), distinction between plaque and vessel wall, distinction between plaque components (e.g., base versus lipid core, base versus fibrous cap, lipid core versus fibrous cap, etc.) etc. For example, in one or more embodiments, where the base of the plaque build-up is distinguished from the fibrous cap, treatment may be provided to ablate the base to reduce further plaque build-up or growth or according to PCT International Publication No. WO2009 /002492 provides healing.
更进一步地,例如,血流动力学特征可以包括所计算的血流动力学测量结果,诸如例如动脉压、心输出量、动脉顺应性、脉冲波速等等。至少在一个实施例中,可以基于与血流量的追踪和管壁运动或位移的追踪二者有关的参数来确定这样的血流动力学测量结果,由此,为了获得准确的血流动力学确定,必须同时确定与血流量的追踪和管壁运动或位移的追踪二者有关的参数或测量结果,或者在能够确定(例如有效地确定)这二者的周期性循环内确定上述参数或测量结果。例如,血管的顺应性可以基于与血流量的追踪有关的容积流量和可通过追踪血管位移而确定的血管内的压力二者。Still further, for example, hemodynamic characteristics may include calculated hemodynamic measurements such as, for example, arterial pressure, cardiac output, arterial compliance, pulse wave velocity, and the like. In at least one embodiment, such hemodynamic measurements may be determined based on parameters related to both tracking of blood flow and tracking of vessel wall motion or displacement, whereby, in order to obtain accurate hemodynamic determinations , parameters or measurements related to both the tracking of blood flow and the tracking of wall motion or displacement must be determined simultaneously, or within a periodic cycle in which both can be determined (eg, effectively determined) . For example, the compliance of a blood vessel may be based on both volumetric flow associated with tracking of blood flow and pressure within the blood vessel, which may be determined by tracking blood vessel displacement.
例如,在高帧速率成像的情况下管直径的准确估计和腔(lumen)内横向流量的估计将允许无创地对脉冲波速(PWV)的有用测量。例如,可以在相位空间(容积流量QA相对于管面积A)中绘制例如图5C-5D中示出的时间波形。可以根据流量数据来计算容积流量,同时可以从管壁移动获得面积。该测量必须在心搏周期的无反射部分期间以形式PWV=dQ/dA的斜率测量的形式进行。在有充分采样的时间波形(例如使用M2D模式成像)的情况下,可以完成估计管壁运动和管内流量的任务。For example, accurate estimation of tube diameter and estimation of lateral flow within a lumen with high frame rate imaging would allow useful measurements of pulse wave velocity (PWV) non-invasively. For example, a temporal waveform such as that shown in FIGS. 5C-5D can be plotted in phase space (volume flow QA versus tube area A). Volumetric flow can be calculated from flow data, while area can be obtained from pipe wall movement. This measurement must be made during the non-reflection part of the cardiac cycle in the form of a slope measurement of the form PWV=dQ/dA. The task of estimating vessel wall motion and intraductal flow can be accomplished in the presence of a well-sampled temporal waveform (eg, imaged using M2D modalities).
换言之,横向流速和壁运动二者可以被同时估计,由此提供压力(通过管直径)和流量(通过矢量速度)。如这里所述的那样,这样的测量可以提供可在管壁顺应性的评估中使用的血流动力学计算的基础,其中管壁顺应性是血管健康的重要指标。此外,如这里所述的那样,轴向和横向位移场表现良好,并允许组织和血液二者中的应变和剪切应变计算。这些速度/应变场连同解剖图像信息一起可以为计算流体动力学模型提供输入,该计算流体动力学模型可能允许适合于评估脉管系统和周围组织的健康的逆计算(例如动脉粥样硬化的检测和分期)。In other words, both lateral flow velocity and wall motion can be estimated simultaneously, thereby providing pressure (via tube diameter) and flow (via vector velocity). As described herein, such measurements can provide the basis for hemodynamic calculations that can be used in the assessment of vessel wall compliance, an important indicator of vessel health. Furthermore, as described here, axial and transverse displacement fields are well behaved and allow strain and shear strain calculations in both tissue and blood. These velocity/strain fields, together with anatomical image information, can provide input to computational fluid dynamics models that may allow inverse calculations suitable for assessing the health of the vasculature and surrounding tissues (e.g. detection of atherosclerosis). and installments).
在一个或多个实施例中,超声使能的定量成像系统可以被用来评估动脉粥样硬化血管中的疾病状态。例如,该成像可以被用来直接估计管壁附近的应变场。这样的方法可能减轻可导致相关性损失且可能使基于相关性的斑点追踪方法在管壁附近无用的局部变形的不利影响。这样的变形(根据严重性)可能导致速度(以及由此,应变)估计中的错误估计或者可能甚至导致准确性损失。In one or more embodiments, an ultrasound-enabled quantitative imaging system can be used to assess disease state in atherosclerotic vessels. For example, this imaging can be used to directly estimate the strain field near the pipe wall. Such an approach might mitigate the adverse effects of local deformations that could lead to a loss of correlation and could render correlation-based speckle tracking methods useless near the vessel wall. Such deformations may (depending on severity) lead to miscalculations or possibly even loss of accuracy in velocity (and thus strain) estimates.
针对还原真实速度/应变估计的问题的一种三方面方法可以包括:1)用于使用壁附近2D RF数据的变形模型来直接估计速度/应变分量的两步算法;2)将正演计算流体动力学(CFD)模型用作正则化滤波器的重构方法;以及3)将基于超声的速度/应变场用作观察的组织机械特性的定量逆重构。如这里所述的那样,可以实施在轴向方向和横向方向二者上以子采样精度对组织运动和流的同时成像。例如,这样的成像可以包括使用相位耦合的2D斑点追踪方法,其采用真实2D复互相关来找到轴向方向和横向方向二者上的子像素位移。此外,可以在Sonix RP扫描仪上使用经过修改的成像序列以在覆盖感兴趣区域的有限视场中允许高帧速率2D数据收集(M2D-模式)。连同鲁棒的2D斑点追踪方法一起,M2D成像允许捕获流和壁/组织运动的完全动力学,即使当流主要处于横向方向(相对于成像束)上时。轴向方向和横向方向二者上的精细矢量位移估计被示出以允许利用最小滤波的平滑且相接的应变和剪切应变计算。以高空间和时间采样对矢量流场和壁/组织运动以及对应应变的同时成像可以提供一种对血液和血管之间的流-固相互作用进行建模的工具。血管反应的这种基于图像的建模可以允许疾病状态的预测和疾病状态的可能演变。A three-pronged approach to the problem of restoring true velocity/strain estimates could include: 1) a two-step algorithm for directly estimating velocity/strain components using deformation models from 2D RF data near walls; A dynamical (CFD) model is used as a reconstruction method for a regularizing filter; and 3) an ultrasound-based velocity/strain field is used as a quantitative inverse reconstruction of the observed tissue mechanical properties. As described herein, simultaneous imaging of tissue motion and flow with sub-sampling accuracy in both axial and transverse directions can be performed. For example, such imaging may include the use of a phase-coupled 2D speckle tracking method that employs true 2D complex cross-correlation to find sub-pixel displacements in both axial and lateral directions. Furthermore, a modified imaging sequence can be used on the Sonix RP scanner to allow high frame rate 2D data collection (M2D-mode) in a limited field of view covering the region of interest. Together with robust 2D speckle tracking methods, M2D imaging allows capturing the full dynamics of flow and wall/tissue motion, even when the flow is predominantly in the lateral direction (relative to the imaging beam). Refined vector displacement estimates in both axial and transverse directions are shown to allow smooth and contiguous strain and shear strain calculations with minimal filtering. Simultaneous imaging of vector flow fields and wall/tissue motion and corresponding strains with high spatial and temporal sampling may provide a tool for modeling fluid-solid interactions between blood and vessels. Such image-based modeling of vascular response may allow prediction of disease state and possible evolution of disease state.
此外,观察模型与管壁附近的组织特性的逆重构之间的结合可以允许斑块成分的定量评估(例如脂含量或钙化)。这可以提供用于基于破裂或其他风险因素的概率选择治疗选项的可靠无创模型。Furthermore, the coupling between the observation model and the inverse reconstruction of tissue properties near the vessel wall can allow quantitative assessment of plaque composition (eg lipid content or calcification). This may provide a reliable non-invasive model for selecting treatment options based on the probability of rupture or other risk factors.
换言之,可以结合对大动脉血流动力学的评估进行建模的计算流体动力学(CFD)来使用这里所述的成像。已经示出CFD产生具有复杂几何结构的大动脉中的时变3D流场的有用预测。在该上下文中,已经将建模流-固界面定义为脉管力学中的挑战领域。如这里所述的能够捕获血管周(以及壁)组织运动和变形二者连同流体流量的成像方法可以被用来解决该问题。MRI和其他成像模态中的进步已导致越来越关注基于图像的患者专用CFD建模以便监视疾病进展。MRI具有极好的软组织对比度,这可以允许准确地捕获组织(固体)模型。尽管这可以是优于诊断超声的优点,其中诊断超声不提供组织边界的相同级别的限定和各组织类型之间的辨别,然而,可以通过3D图像获取(徒手和机动化二者)中的最近改进来减轻该限制。因此,诊断超声扫描仪可以为基于图像的CFD建模提供有吸引力的替换方案。基于3D超声和使用M2D模式的改进的2D速度/应变成像,可以实施用于提供管壁附近的定量组织特性图像以对疾病状态进行表征的过程。这里所述的成像方法解决了用于速度/应变估计的现有的基于相关性的方法的限制以便恢复壁附近的损失的或充满伪影的估计。此外,可以实现将我们的速度/应变估计作为观察模型集成到动态正演/反演的基于CFD的模型中以重构符合纳维—斯托克斯(Navier-Stokes)方程的场/组织特性值。例如,可以如下开发:用于使用M2D模式数据进行管壁处的直接应变估计的两步算法;用于利用从3D超声获得的正演CFD模型重构位移/应变图的正则化方法(例如正演模型可以提供重构滤波器来对使用斑点追踪算法获得的速度/应变估计进行正则化);以及/或者用于基于使用M2D模式数据获得的应变图重构管壁附近的机械特性的反演方法。In other words, the imaging described here can be used in conjunction with computational fluid dynamics (CFD) modeling the assessment of aortic hemodynamics. CFD has been shown to produce useful predictions of time-varying 3D flow fields in aorta with complex geometry. In this context, modeling the fluid-solid interface has been defined as a challenging area in vascular mechanics. Imaging methods capable of capturing both perivascular (and wall) tissue motion and deformation along with fluid flow as described herein can be used to address this issue. Advances in MRI and other imaging modalities have led to increased attention to image-based patient-specific CFD modeling for monitoring disease progression. MRI has excellent soft tissue contrast, which can allow accurate capture of tissue (solid) models. Although this can be an advantage over diagnostic ultrasound, which does not provide the same level of definition of tissue boundaries and discrimination between tissue types, it can, however, be achieved with the latest in 3D image acquisition (both manual and motorized). improvements to alleviate this limitation. Therefore, diagnostic ultrasound scanners may provide an attractive alternative to image-based CFD modeling. Based on 3D ultrasound and modified 2D velocity/strain imaging using M2D modalities, a procedure for providing quantitative images of tissue properties near vessel walls for characterization of disease states can be implemented. The imaging method described here addresses the limitations of existing correlation-based methods for velocity/strain estimation to recover lost or artifact-laden estimates near walls. Furthermore, integration of our velocity/strain estimates as observational models into dynamic forward/inverted CFD-based models to reconstruct field/tissue properties conforming to the Navier-Stokes equations can be achieved value. For example, a two-step algorithm for direct strain estimation at the pipe wall using M2D model data; a regularization method (e.g. normalized The model can provide a reconstruction filter to regularize the velocity/strain estimates obtained using the speckle tracking algorithm); and/or an inversion for reconstructing the mechanical properties near the pipe wall based on the strain map obtained using the M2D model data method.
该一个或多个超声换能器(框22)可以是能够递送超声脉冲且对预期在超声成像系统中使用以及结合系统10的处理装置(框12)使用的超声回波能量进行采样/收集的任何装置(例如发射组件、接收组件等等)。如这里所使用的那样,这样的换能器可以包括发射部分(例如用于递送脉冲能量)以及接收部分(例如用于对回波或反射能量进行采样/收集),它们可以是同一部分或可以不是同一部分。在目标(例如血管,诸如颈动脉、冠状动脉等等)的超声成像期间,该一个或多个换能器(框22)可以相对于该目标而定位,以便能够将能量递送到目标,从而产生反射能量(也被称为结果得到的脉冲回波或回波能量)并且还对回波能量进行采样。The one or more ultrasound transducers (box 22) may be capable of delivering ultrasound pulses and sampling/collecting ultrasound echo energy intended for use in the ultrasound imaging system and for use in conjunction with the processing device (box 12) of the
该一个或多个换能器(框22)可以包括彼此分离的多个换能器位置或者可以是换能器阵列。在一个或多个实施例中,各个阵列可以具有优于其他的一个或多个益处。例如,在一个或多个实施例中,换能器阵列可以是具有多个子孔以便从多个角度对血管进行声穿透的分段的凹面换能器。这将允许从更多方向更好地限定血管边界。可以在线性阵列或相控阵模式中将至少一个子孔用于血管的应变成像和初始B模式。换能器的驱动器可以被设计成利用独立码来驱动多个子孔。每个子孔可以是一维或二维阵列。编码激励可以帮助改进数据速率(例如提供更高帧速率)和回波质量(例如通过降低腔内的混响)二者。接收器可以是具有用于编码激励的波束赋形和/或脉冲压缩的多通道接收器。The one or more transducers (block 22 ) may include multiple transducer locations separated from each other or may be a transducer array. In one or more embodiments, each array may have one or more benefits over the other. For example, in one or more embodiments, the transducer array may be a segmented concave transducer with multiple sub-holes to insonify the blood vessel from multiple angles. This will allow better definition of vessel boundaries from more directions. At least one subaperture can be used for strain imaging of blood vessels and initial B-mode in either linear array or phased array mode. The driver of the transducer can be designed to drive multiple subapertures with independent codes. Each subhole can be a one-dimensional or two-dimensional array. Encoded excitation can help improve both data rate (eg, by providing higher frame rates) and echo quality (eg, by reducing reverberation in the cavity). The receiver may be a multi-channel receiver with beamforming and/or pulse compression for coded excitation.
例如,在Ebbini等人的“Dual-Mode Ultrasound Phased Arrays for Image-Guided Surgery,”Ultrasound Imaging, vol. 28, pp. 65-82 (2006);Ballard等人的“Adaptive Transthoracic Refocusing of Dual-Mode Ultrasound Arrays,”IEEE Transactions on Biomedical Engineering, vol. 57, no. 1, pp. 93-102 (2010年1月);和Wan等人的“Imaging with Concave Large-Aperture Therapeutic Ultrasound Arrays Using Conventional Synthetic-Aperture Beamforming,”IEEE Transactions on Ultrasound, Ferroelectrics, and Frequency Control, vol. 55, no. 8, pp. 1705-1718 (2008年8月)中描述了各种阵列及其操作,通过引用将它们全部合并于此。For example, in Ebbini et al., "Dual-Mode Ultrasound Phased Arrays for Image-Guided Surgery,"Ultrasound Imaging , vol. 28, pp. 65-82 (2006); Ballard et al., "Adaptive Transthoracic Refocusing of Dual-Mode Ultrasound Arrays,”IEEE Transactions on Biomedical Engineering , vol. 57, no. 1, pp. 93-102 (January 2010); and Wan et al., “Imaging with Concave Large-Aperture Therapeutic Ultrasound Arrays Using Conventional Synthetic-Aperture Beamforming Various arrays and their operations are described inIEEE Transactions on Ultrasound, Ferroelectrics, and Frequency Control , vol. 55, no. 8, pp. 1705-1718 (August 2008), all of which are hereby incorporated by reference .
图2中描绘了用于脉管成像的示例性超声成像方法30的流程图。将会认识到,可以使用一个或多个程序或例程以及/或者成像系统(例如图1的成像系统10)和/或疗法系统(例如图1的疗法系统20)的任何其他组件来实施这里所述的一个或多个功能框。A flowchart of an exemplary
一般来说,方法30提供了以采样帧速率捕获脉冲回波数据(框32)。在一个实施例中,提供至少一部分血管位于其中的区域的超声脉冲回波数据。例如,该脉冲回波数据可以是以下述帧速率采样的脉冲回波数据:该帧速率使得所测得的限定所述至少一部分血管的管壁的位移和所测得的经过所述至少一部分血管的平均血流量随时间具有准周期性分布,以便允许同时对管壁和血流量二者进行运动追踪。此外,该方法包括对脉冲回波数据应用斑点追踪(框34)以允许例如生成应变和剪切应变图像数据。In general,
如这里关于图1中示出的系统所阐述的那样,可以基于对流量和管壁中的运动的追踪来识别一个或多个脉管特征,例如与经过血管50的流量相关联的流量特征、与血管50相关联的结构特征、以及/或者血流动力学特征(框36)。在一个实施例中,因为同时捕获流量和管壁二者中的位移场(例如在周期性循环(诸如心动周期)期间),可以确定依赖于从这两种类型的位移(例如诸如血流动力学)得到的或与这两种类型的位移有关的测量结果的一个或多个脉管特征。As explained herein with respect to the system shown in FIG. 1 , one or more vascular characteristics may be identified based on tracking flow and motion in the vessel wall, such as flow characteristics associated with flow through
更进一步地,如图2中所示,可选地,方法30可以包括基于一个或多个脉管特征来递送疗法(框38)。例如,如关于图1的系统所述的那样,疗法的递送可以采用一种或多种不同的形式(例如,药物、消融、外科或者任何其他有创或无创治疗)。Still further, as shown in FIG. 2 ,
在一个或多个实施例中,该方法可以包括M2D模式成像,其被设计成最大化处于足够高帧速率的成像区域的横向范围,以捕获管壁和血管内流量的完全动力学。M2D模式产生来自给定探头的视场(FoV)的所选区域的2D波束赋形RF回波数据。该区域可以是相接的或者由多于一个脱节子分段组成。举例来说,在SonixRP扫描仪(Ultrasonix, BC, Canada)上,FoV内的任意A线集合可以被用来形成M2D模式图像,其帧模式大概比B模式成像高MB/MM2D,其中MB和MM2D分别指示用于形成B模式图像和M2D模式图像的A线的数目。In one or more embodiments, the method may include M2D mode imaging designed to maximize the lateral extent of the imaging region at a sufficiently high frame rate to capture the full dynamics of the vessel wall and intravascular flow. The M2D mode produces 2D beamformed RF echo data from a selected region of a given probe's field of view (FoV). The region can be contiguous or consist of more than one disjoint subsegment. For example, on a Sonix RP scanner (Ultrasonix, BC, Canada), any set of A-lines within the FoV can be used to form an M2D-mode image with a frame mode roughlyMB/MM2D higher than B-mode imaging, whereMB andMM2D indicate the number of A lines used to form a B-mode image and an M2D-mode image, respectively.
如图4中所示,可以通过创建能够采用用于实时实现的各种各样的计算资源的强大流水线执行/流程程序架构来实现M2D模式成像。此外,程序架构可能允许用户调用计算机上(或者通常互联网上)可用的额外计算资源以实现其他计算任务。来自这些计算的结果可以与程序无缝集成。例如,可以实时地经过吉比特(Gigabit)接口来传输波束赋形RF回波数据,以允许使用GPU(或FPGA)、使用1D斑点追踪的实时2D轴向应变计算。然而,波束赋形RF数据可用于使用例如预安装的MATLAB引擎的额外处理。可以以最小等待时间(例如在完成MATLAB计算之后)将MATLAB结果无缝地导入回到M2D模式成像程序。该能力可以允许我们执行实时2D斑点追踪以实现管壁附近的应变和剪切应变,例如对小RoI执行重载的基于MATLAB的计算以允许它们的实时结合。在至少一个实施例中,可以实时地实施真实2D斑点追踪方法,如当前对于1D斑点追踪的情况那样。这样,可以实施流水线程序执行架构以便支持允许我们收获用于准实时地分析管壁的强大计算工具的益处的M2D成像。As shown in Figure 4, M2D modality imaging can be achieved by creating a powerful pipelined execution/flow program architecture capable of employing a wide variety of computing resources for real-time implementation. In addition, the program's architecture may allow the user to call upon additional computing resources available on the computer (or generally the Internet) for other computing tasks. Results from these calculations can be seamlessly integrated with the program. For example, beamformed RF echo data can be transmitted over a Gigabit interface in real-time to allow real-time 2D axial strain calculation using 1D speckle tracking using a GPU (or FPGA). However, beamformed RF data is available for additional processing using, for example, a pre-installed MATLAB engine. MATLAB results can be seamlessly imported back into the M2D mode imaging program with minimal latency (e.g. after completion of MATLAB calculations). This capability may allow us to perform real-time 2D spot tracking to achieve strain and shear strain near the tube wall, for example to perform heavy-duty MATLAB-based calculations on small RoIs to allow their real-time incorporation. In at least one embodiment, a true 2D speckle tracking method can be implemented in real-time, as is currently the case for 1D speckle tracking. In this way, a pipelined program execution architecture can be implemented in order to support M2D imaging that allows us to reap the benefits of powerful computational tools for analyzing tube walls in near real-time.
高帧速率M2D模式保留相关性以产生表现良好的2D位移/速度分布从而允许鲁棒应变计算。高质量2D(+时间)应变和剪切应变场在轴向视图中产生血管两侧上的管壁边界的视图。此外,它们还可以在横截面视图中在横向方向上产生壁的更好限定。这可以允许测量壁增厚,动脉粥样硬化的早期征兆。The high frame rate M2D mode preserves correlations to produce well-behaved 2D displacement/velocity distributions allowing robust strain calculations. High quality 2D (+time) strain and shear strain fields produce a view of the vessel wall boundary on both sides of the vessel in the axial view. Furthermore, they can also produce a better definition of the wall in the transverse direction in a cross-sectional view. This could allow measurement of wall thickening, an early sign of atherosclerosis.
更进一步地,高质量2D(+时间;即随时间变化)应变和剪切应变将允许管壁内的组织特性测量(例如硬度)。这样的组织特性测量将允许疾病状态以及在给定高分辨率的情况下的斑块构造(例如基部、脂质核心以及纤维或钙化帽)的表征。可以基于这种信息来递送疗法或治疗,或者可以在递送这种疗法(例如以斑块基部为目标而不会损伤帽或甚至脂质核心的高强度聚焦超声治疗、组织对疗法的反应的连续确定(诸如在高强度聚焦超声的剂量之间)等等)期间使用这种信息。Going a step further, high quality 2D (+time; ie over time) strain and shear strain will allow tissue property measurements (eg stiffness) within the vessel wall. Such tissue property measurements will allow the characterization of the disease state as well as, given high resolution, the plaque architecture (eg, base, lipid core, and fibrous or calcified cap). Therapy or therapy can be delivered based on this information, or can be delivered on the basis of such therapy (e.g. high-intensity focused ultrasound therapy targeting the plaque base without damaging the cap or even the lipid core, continuum of tissue response to therapy). This information is used during determinations (such as between doses of high-intensity focused ultrasound, etc.).
可以使用任何成像系统(例如图1的成像系统10)来提供脉冲回波数据,尽管一个或多个成像系统可能优于其他成像系统。在一个或多个实施例中,可以由诸如图3和图4中示出的成像系统100来执行数据获取。例如,如图3中所示,该成像系统100可以被用来获取数据以及对这样获取的数据执行实时处理。该成像系统100可以包括加载有用于高帧速率脉冲回波数据收集的程序的超声扫描仪102(例如Sonix RP(Ultrasonix, Canada))。该超声扫描仪可以包括诸如啁啾生成、波形生成、数据收集和数据传输能力之类的特征。Any imaging system (eg,
如示例性实施例中所示,可以通过例如吉比特以太网将所收集的数据流线化到控制器PC 104以进行实时数据处理。该数据处理计算机104可以通过利用多核图形处理单元106(例如GPU;nVIDIA, Santa Clara, CA)来应对高分辨率(空间和时间二者)斑点追踪和可分离的2D后置滤波所需的密集计算。超声扫描仪102可以操作在B模式中以进行图像引导(例如产生B模式图像)并且可以操作在M2D模式中以进行高帧速率数据收集。M2D模式通过根据如用户所定义的那样将扫描线的数目限制到感兴趣区域(ROI)来实现高帧速率成像。M2D数据可以用于斑点追踪。例如,在一个实施例中,可以执行利用在1000fps处每帧10个A线的M2D模式获取。例如,通过将扫描线的数目限制到10且将成像范围限制到40mm,可以将线性阵列探头(例如LA14-5/38)用于M2D模式中的1000fps帧速率处的数据收集。在一个或多个具有编码激励的实施例中,M2D模式可以以每秒从2000到5000帧或更高的帧速率来收集数据。As shown in the exemplary embodiment, the collected data may be streamed to the
在图3中示出的实施例中,高强度聚焦超声(HIFU)也是可能的(例如用于生成针对治疗或亚治疗机械和/或热效应的超声)。由此,Virtex2Pro(Xilinx, CA)现场可编程门阵列(FPGA)板108专用于HIFU源和同步帧触发生成。该实施通过在脉冲回波成像活动时短暂地使HIFU发生器静寂来允许无干扰的数据收集。In the embodiment shown in Fig. 3, High Intensity Focused Ultrasound (HIFU) is also possible (eg for generating ultrasound for therapeutic or sub-therapeutic mechanical and/or thermal effects). Thus, a Virtex2Pro (Xilinx, CA) field programmable gate array (FPGA)
用于这里的成像的斑点追踪依赖于递增的逐帧时移的准确估计,所述逐帧时移通常比RF回波采样周期小得多。在一个实施例中,实施脉冲回波数据的两个后续帧的2D复相关。实时数据处理引擎110基于具有大量核的GPU 106(例如具有240个处理核且被设计成充分利用其高度并行架构的GTX285 GPU)。利用集成性能基元(Intel)和Matlab 工具112、114来补充实时处理的实施。此外,提供了研究接口系统120以用于操作者控制。Speckle tracking for imaging here relies on accurate estimation of incremental frame-by-frame time shifts, which are typically much smaller than the RF echo sampling period. In one embodiment, a 2D complex correlation of two subsequent frames of pulse-echo data is performed. The real-time
图4示出用于成像系统(诸如图3中示出的成像系统)的基于GPU的实施方式130的示例性框图。在一个实施例中,针对每个处理阶段,以数据独立方式来为算法执行细粒度的划分,以使得所有240个处理器高效地工作于各个数据块。FIG. 4 shows an exemplary block diagram of a GPU-based
例如,图4示出用于应变成像的波束赋形超声数据的实时信号处理链的一个示例性实施例(例如针对1D而示出,但是其可以被推广到2D或3D)。在轴向方向上执行实时斑点追踪,但是作为第一步可以实时地执行轴向应变和轴向剪切应变以识别血管边界(例如这已经在各种直径(老鼠中~1mm以及猪中~4mm)的血管上活体测试)。可以在所识别的血管周围的感兴趣区域(RoI)中执行2D应变计算。可以在该步骤之后实时地计算轴向和横向应变以及对应的剪切应变。此外,可以提供紧邻管壁的应变和剪切应变的直接估计。对于应变计算的1D和2D版本二者,时间方向上的附加计算将进一步限定血管边界和壁的内部边界。例如,在对动脉粥样硬化进行成像的上下文中,这可能得到斑块的内部组分。For example, Fig. 4 shows an exemplary embodiment of a real-time signal processing chain for beamformed ultrasound data for strain imaging (eg shown for 1D, but it can be generalized to 2D or 3D). Real-time speckle tracking is performed in the axial direction, but axial strain and axial shear strain can be performed in real-time as a first step to identify vessel boundaries (e.g. this has been done in various diameters (~1mm in mice and ~4mm in pigs). ) in vivo test on blood vessels). 2D strain calculations can be performed in the identified region of interest (RoI) around the blood vessel. Axial and transverse strains and corresponding shear strains can be calculated in real time after this step. In addition, direct estimates of strain and shear strain in the immediate vicinity of the pipe wall can be provided. For both the 1D and 2D versions of the strain calculations, additional calculations in the time direction will further define the vessel boundary and the internal boundary of the wall. For example, in the context of imaging atherosclerosis, this could yield plaque internal components.
如图4中所示,在CPU侧,数据可以来自网络堆栈(例如实验模式,其中,从SonixRP扫描仪对数据进行流线化)或数据文件(例如检查模式)。可以利用所设计的UI系统(基于OpenGL)来对经过处理的结果进行可视化,或者将经过处理的结果暴露给其他商业软件以进一步分析(例如Matlab)。还可以在用于实时温度控制的反馈控制中使用该结果。As shown in Figure 4, on the CPU side, the data can come from the network stack (e.g. experiment mode, where data is streamed from a SonixRP scanner) or data files (e.g. inspection mode). The processed results can be visualized using the designed UI system (based on OpenGL), or exposed to other commercial software for further analysis (such as Matlab). The result can also be used in feedback control for real-time temperature control.
在GPU侧,图4示出在如下文献中描述的算法的基于GPU的实施方式:(参见例如Simon等人的“Two-Dimensional Temperature Estimation Using Diagnostic Ultrasound,”IEEE Transactions on Ultrasonics, Ferroelectronics, and Frequency Control, vol. 45, no. 4, pp. 1088-1099, JULY 1998)。图4中示出的各个框具有至少如下功能:希尔伯特(Hilbert)变换:使用FIR希尔伯特变换器来计算RF回波的分析信号;互相关/相位投影/累积:实施斑点追踪的1D版本;2D可分离滤波器:允许温度估计(例如热应变计算);双线性插值:为数据可视化提供硬件加速的插值;以及本地存储:提供GPU域中的数据管理。On the GPU side, FIG. 4 shows a GPU-based implementation of the algorithm described in: (See, e.g., Simon et al., "Two-Dimensional Temperature Estimation Using Diagnostic Ultrasound,"IEEE Transactions on Ultrasonics, Ferroelectronics, and Frequency Control , vol. 45, no. 4, pp. 1088-1099, JULY 1998). The various blocks shown in Fig. 4 have at least the following functions: Hilbert transform: use FIR Hilbert transformer to calculate the analysis signal of the RF echo; cross-correlation/phase projection/accumulation: implement speckle tracking 1D version of ; 2D separable filter: allows temperature estimation (e.g. thermal strain calculation); bilinear interpolation: provides hardware-accelerated interpolation for data visualization; and local storage: provides data management in the GPU domain.
换言之,在一个或多个实施例中,这里提供了一种用于脉管成像的系统,其包括一个或多个超声换能器(例如,其中该一个或多个换能器被配置成将超声能量递送到脉管区域,从其产生脉冲回波数据);和处理装置(例如包括一个或多个程序,系统的一个或多个处理器可执行所述程序以便实施如这里所述的以及该系统的一个或多个功能,诸如控制数据帧获取、斑点追踪、可视化、图像生成、特征识别等等)。In other words, in one or more embodiments, there is provided a system for imaging vessels comprising one or more ultrasound transducers (eg, wherein the one or more transducers are configured to delivery of ultrasound energy to a vascular region from which pulse-echo data is generated); and a processing device (eg, comprising one or more programs executable by one or more processors of the system to implement as described herein and One or more functions of the system, such as controlling data frame acquisition, speckle tracking, visualization, image generation, feature recognition, etc.).
换言之,该处理装置(例如GPU、CPU等)可以被配置(例如在一个或多个程序的控制下操作)成例如:控制以下述帧速率来捕获脉冲回波数据,该帧速率使得所测得的限定脉管区域中的至少一部分血管的管壁的位移和所测得的经过所述至少一部分血管的平均血流量随时间具有准周期性分布,以便允许同时对管壁和血流量二者进行运动追踪;使用斑点追踪来生成所述至少一部分血管位于其中的区域的应变和剪切应变图像数据;以及基于应变和剪切应变图像数据来识别至少一部分血管位于其中的脉管区域的至少一个脉管特征(例如,其中所述至少一个脉管特征包括与经过血管的流量相关联的流量特征、与血管相关联的结构特征、以及与血管相关联的血流动力学特征中的至少一个)。In other words, the processing device (e.g., GPU, CPU, etc.) may be configured (e.g., to operate under the control of one or more programs), for example, to control the capture of pulse-echo data at a frame rate such that the measured The displacement of the vessel wall of at least a portion of the vessel in the defined vascular region and the measured mean blood flow through said at least a portion of the vessel have a quasi-periodic distribution over time so as to allow simultaneous analysis of both vessel wall and blood flow performing motion tracking; using speckle tracking to generate strain and shear strain image data of the region in which the at least a portion of the blood vessel is located; and identifying at least one of the region of the vessel in which at least a portion of the blood vessel is located based on the strain and shear strain image data a vascular feature (eg, wherein the at least one vascular feature includes at least one of a flow feature associated with flow through a blood vessel, a structural feature associated with a blood vessel, and a hemodynamic feature associated with a blood vessel) .
此外,例如,处理装置可以被配置成:使用至少一部分血管位于其中的脉管区域的一个或多个斑点区域的斑点追踪来追踪限定所述至少一部分血管的管壁和经过所述至少一部分血管的血流量二者的运动(例如,其中以下述帧速率来捕获脉冲回波数据,该帧速率使得可在与心脏脉搏周期相对应的相同周期性循环内同时测量限定所述至少一部分血管的管壁的位移和经过所述至少一部分血管的血流量);以及/或者基于同时测得的管壁位移和平均血流量来识别所述至少一部分血管位于其中的脉管区域的至少一个脉管特征。此外,例如,该处理装置进一步可操作用于(例如通过执行一个或多个程序)使用斑点追踪来生成所述至少一部分血管位于其中的区域的应变和剪切应变图像数据(例如,其中所述斑点追踪包括使用所述至少一部分血管位于其中的区域中的经受变形的一个或多个斑点区域的采样脉冲回波数据的多维相关,其中所述多维相关包括基于互相关采样脉冲回波数据的相位和幅度梯度来确定采样脉冲回波数据的互相关性峰值)。Furthermore, for example, the processing device may be configured to: use speckle tracking of one or more speckle regions of the vessel region in which at least a portion of the blood vessel is located to track the vessel walls defining the at least a portion of the vessel and the Motion of both blood flow (e.g., wherein the pulse-echo data is captured at a frame rate such that the vessel wall defining the at least a portion of the vessel can be measured simultaneously within the same periodic cycle corresponding to the cardiac pulse cycle and/or identifying at least one vascular feature of the vascular region in which the at least a portion of the blood vessel is located based on simultaneously measured wall displacement and mean blood flow. Also, for example, the processing device is further operable (eg, by executing one or more procedures) to generate strain and shear strain image data of the region in which said at least a portion of the blood vessel is located using speckle tracking (eg, wherein said Speckle tracking includes multidimensional correlation using sampled pulse echo data of one or more speckle regions subject to deformation in the region in which the at least a portion of the vessel is located, wherein the multidimensional correlation includes phase correlation of the sampled pulse echo data based on cross-correlation and amplitude gradients to determine the cross-correlation peak of the sampled pulse-echo data).
如图5A-5D中所示,在一个或多个实施例中,获取脉冲回波数据的帧速率应该至少大于100fps、以及甚至大于200fps。在至少一个实施例中,该帧速率大于300fps。该帧速率应该足够高以用于同时在组织和血液二者中的可靠运动追踪(例如以使得涉及其的测量结果与同一时间帧或周期性循环有关)。例如,在一个实施例中,M2D模式允许在将相关性保持在高级别的同时提供高帧速率,以便产生平滑且相接的位移/速度场(例如组织的位移、血流的运动),从而允许鲁棒的应变和剪切应变确定。As shown in Figures 5A-5D, in one or more embodiments, the frame rate at which pulse-echo data is acquired should be at least greater than 100 fps, and even greater than 200 fps. In at least one embodiment, the frame rate is greater than 300 fps. The frame rate should be high enough for reliable motion tracking in both tissue and blood simultaneously (eg such that measurements involving it relate to the same time frame or periodic cycle). For example, in one embodiment, M2D mode allows high frame rates while maintaining high levels of correlation in order to produce smooth and contiguous displacement/velocity fields (e.g. displacement of tissue, motion of blood flow), thereby Allows robust strain and shear strain determination.
用于获取脉冲回波数据的帧速率应该足以提供表现良好的、流和组织二者中的位移场。在一个实施例中,可以通过随时间对与组织位移(例如管壁位移或运动)的追踪有关的通道直径以及与经过血管的流量的追踪(例如经过血管的血流量的追踪)有关的平均流速的测量来识别这种表现良好的位移。由此,图5A-5D示出对于多个帧速率的、血管中流量的追踪(例如由以实线示出的平均流速的变化来表示)以及血管组织位移的追踪(例如由以虚线示出的通道直径随时间的变化来表示)二者的曲线图。图5A示出对于40fps帧速率的确定;图5B示出对于81fps帧速率的确定;图5C示出对于162fps帧速率的确定;以及图5D示出对于325fps帧速率的确定。The frame rate used to acquire pulse-echo data should be sufficient to provide a well-behaved displacement field in both flow and tissue. In one embodiment, channel diameter related to tracking of tissue displacement (eg, vessel wall displacement or motion) and average flow velocity related to tracking of flow through a vessel (eg, tracking of blood flow through a vessel) can be calculated over time measurements to identify such well-behaved displacements. Thus, FIGS. 5A-5D illustrate the tracking of flow in a blood vessel (as represented by, for example, the change in mean flow velocity shown in solid lines) and tracking of vascular tissue displacement (as represented by, for example, shown in dashed lines) for multiple frame rates. The change of the channel diameter with time) is a graph of the two. FIG. 5A shows the determination for a frame rate of 40 fps; FIG. 5B shows the determination for a frame rate of 81 fps; FIG. 5C shows the determination for a frame rate of 162 fps; and FIG. 5D shows the determination for a frame rate of 325 fps.
从图5A和5B清楚地看到,这些低帧速率(例如小于100fps)未产生表现良好的所测得的限定血管的管壁的位移以及所测得的经过血管的平均血流量。换言之,可能未准确地同时测量流量以及组织位移(例如管壁位移)的测量结果。例如,如图5A和5B中清楚地示出的那样,遍及由通道直径信息表示的管壁位移的周期性循环(例如管壁位移的从峰值到峰值),血流量被示为相当随机。换言之,这种血流量数据充满伪影,从而在该循环期间使准确的流量确定变得困难。甚至管壁位移信息看起来也包括一些伪影。As is clear from Figures 5A and 5B, these low frame rates (eg, less than 100 fps) do not produce well-behaved measured displacements of the vessel walls defining the vessel and measured mean blood flow through the vessel. In other words, measurements of flow and tissue displacement (eg, vessel wall displacement) may not be accurately measured simultaneously. For example, as clearly shown in FIGS. 5A and 5B , blood flow is shown to be fairly random throughout the periodic cycle of wall displacement represented by the channel diameter information (eg, peak to peak of wall displacement). In other words, such blood flow data is riddled with artifacts, making accurate flow determination difficult during the cycle. Even the wall displacement information appears to include some artifacts.
然而,从图5C和5D可辨别出,在较高的帧速率(例如大于100fps)处,所测得的限定血管的管壁的位移以及所测得的经过血管的平均血流量表现良好,以使得可以准确地同步(例如对应于同一时间)测量流量和组织位移(例如管壁位移)的测量结果。例如,如图5C和5D中清楚地示出的那样,遍及由通道直径信息表示的管壁位移的周期性循环(例如管壁位移的从峰值到峰值),血流量被示为不随机得多。换言之,所测得的限定血管的管壁的位移和所测得的经过血管的平均血流量随时间具有准周期性分布,这允许同时对管壁和血流量二者进行运动追踪。要注意,通道直径和平均流速二者的强峰值在同一周期性循环(例如对应于心动周期)内。However, it can be discerned from Figures 5C and 5D that at higher frame rates (e.g., greater than 100 fps), the measured displacement of the vessel wall defining the vessel and the measured mean blood flow through the vessel perform well to This makes it possible to accurately synchronize (eg correspond to the same time) measurements of flow and tissue displacement (eg vessel wall displacement). For example, as clearly shown in Figures 5C and 5D, blood flow is shown to be much less random throughout the periodic cycle of vessel wall displacement represented by channel diameter information (e.g., peak-to-peak of vessel wall displacement). . In other words, the measured displacement of the vessel wall defining the vessel and the measured mean blood flow through the vessel have a quasi-periodic distribution over time, which allows simultaneous motion tracking of both vessel wall and blood flow. Note that the strong peaks of both channel diameter and mean flow velocity are within the same periodic cycle (eg corresponding to a cardiac cycle).
如这里所使用的那样,术语“准周期性分布”意在反映下述分布:该分布在周期性循环中以正则化模式的形式基本上一致,即使将在逐帧的基础上存在一些变化(例如与心动周期相对应的周期性循环)。例如,针对流速的这种准周期性分布可以包括:在每个循环期间指示最大流量的强峰值,随后是指示在该循环的剩余部分期间极少或没有流量的流量测量结果。此外,例如,针对通道直径的这种准周期性分布可以包括:在每个循环期间指示管壁的最大位移的强峰值,随后是指示在该循环的剩余部分期间血管松弛到正常状态的测量结果。产生准周期性分布的这种帧速率允许同时或者换言之彼此同步(例如彼此同相)追踪流量和血管位移。As used herein, the term "quasi-periodic distribution" is intended to reflect a distribution that is substantially consistent over a periodic cycle in a regularized pattern, even though there will be some variation on a frame-by-frame basis ( such as the periodic cycle corresponding to the cardiac cycle). For example, such a quasi-periodic distribution for flow rate may include a strong peak during each cycle indicating maximum flow, followed by flow measurements indicating little or no flow during the remainder of the cycle. Furthermore, for example, such a quasi-periodic distribution for channel diameters may include a strong peak during each cycle indicating the maximum displacement of the vessel wall, followed by a measurement indicating relaxation of the vessel to a normal state during the remainder of the cycle . Such a frame rate producing a quasi-periodic distribution allows tracking of flow and vessel displacement simultaneously or in other words synchronously with each other (eg in phase with each other).
帧速率可以根据各种因素而变化。例如,帧速率可以基于血管结构(例如颈动脉相对于外围静脉)、经过血管的周期性流量的定时(例如脉冲循环长度)、血管结构的运动(例如血管松弛到正常的时间);目标血管的深度(例如可以以较低的帧速率来对较深的血管进行成像)、编码激励的使用(例如编码激励可能允许增大的帧速率)、以及成像聚焦的焦距比数(f-number)(例如较高的焦距比数可能导致降低的横向分辨率)等等。Frame rate can vary based on various factors. For example, the frame rate can be based on vascular structure (e.g., carotid artery versus peripheral vein), timing of periodic flow through the vessel (e.g., pulse cycle length), motion of vascular structure (e.g., time for a vessel to relax to normal); Depth (e.g., deeper vessels can be imaged at lower frame rates), use of coded excitation (e.g., coded excitation may allow increased frame rates), and focal ratio number (f-number) of imaging focus ( For example a higher f ratio number may result in reduced lateral resolution), etc.
更进一步地,在一个或多个实施例中,当使用编码激励超声时,可以实现较高的帧速率。例如在文献中描述了这样的编码激励超声并且这里将不再对其详细讨论。例如在以下文献中提供了可与这里所述的成像方法和/或系统结合使用的编码激励超声的一个或多个说明性示例:Shen 等人的“A New Coded-Excitation Ultrasound Imaging System---Part I: Basic Principles,”IEEE Transactions on Ultrasonics, Ferroelectrics, and Frequency Control, vol. 43, no. 1, pp. 131-140, Jan. 1996;Shen等人的“A New Coded-Excitation Ultrasound Imaging System---Part II: Operator Design," IEEE Transactions on Ultrasonics, Ferroelectrics, and Frequency Control, vol. 43, no. 1, pp. 141-148, Jan. 1996;以及Shen等人的“Filter-Based Coded-Excitation System for High-Speed Ultrasound Imaging," IEEE Transactions on Medical Imaging, vol. 17, no. 6, pp. 923-934, Dec. 1998,通过引用将它们全部合并于此。Still further, in one or more embodiments, higher frame rates can be achieved when coded excitation ultrasound is used. Such coded excitation ultrasound is described, for example, in the literature and will not be discussed in detail here. One or more illustrative examples of coded-excited ultrasound that may be used in conjunction with the imaging methods and/or systems described herein are provided, for example, in Shen et al., "A New Coded-Excitation Ultrasound Imaging System--- Part I: Basic Principles,”IEEE Transactions on Ultrasonics, Ferroelectrics, and Frequency Control , vol. 43, no. 1, pp. 131-140, Jan. 1996; “A New Coded-Excitation Ultrasound Imaging System- --Part II: Operator Design,"IEEE Transactions on Ultrasonics, Ferroelectrics, and Frequency Control , vol. 43, no. 1, pp. 141-148, Jan. 1996; and Shen et al., "Filter-Based Coded-Excitation System for High-Speed Ultrasound Imaging,"IEEE Transactions on Medical Imaging , vol. 17, no. 6, pp. 923-934, Dec. 1998, which is hereby incorporated by reference in its entirety.
在一个或多个实施例中,帧速率可以大于100fps,大于200fps,大于300fps,大于500fps,大于1000fps,并且甚至大于5000fps。在其他实施例中,帧速率可以小于5000fps,小于4000fps,小于3000fps,小于2000fps,小于1000fps,小于600fps,小于500fps,小于400fps,小于300fps,或小于200fps。在至少一个实施例中,帧速率在100fps到5000fps的范围内。In one or more embodiments, the frame rate may be greater than 100 fps, greater than 200 fps, greater than 300 fps, greater than 500 fps, greater than 1000 fps, and even greater than 5000 fps. In other embodiments, the frame rate may be less than 5000 fps, less than 4000 fps, less than 3000 fps, less than 2000 fps, less than 1000 fps, less than 600 fps, less than 500 fps, less than 400 fps, less than 300 fps, or less than 200 fps. In at least one embodiment, the frame rate is in the range of 100 fps to 5000 fps.
如图2中的成像方法30中所示,将斑点追踪应用于脉冲回波数据(框34)。例如,可以使用斑点追踪来生成所述至少一部分血管位于其中的区域的应变和剪切应变图像数据。在一个或多个实施例中,斑点追踪可以包括使用所述至少一部分血管位于其中的区域中的经受变形的一个或多个斑点区域(例如窗口)的采样脉冲回波数据的多维相关。该多维相关可以包括基于互相关采样脉冲回波数据的相位和幅度梯度来确定采样脉冲回波数据的互相关性峰值。As shown in
应变和剪切应变图像数据的这种生成允许识别至少一部分血管位于其中的区域的至少一个脉管特征(框36)(例如,与经过血管的流量相关联的流量特征、与血管相关联的结构特征、与血管相关联的血流动力学特征等等)。可以使用和/或可视化一种或多种类型的应变和剪切应变图像数据以便识别这些脉管特征。Such generation of strain and shear strain image data allows identification of at least one vascular feature (block 36 ) of a region in which at least a portion of the blood vessel is located (e.g., a flow feature associated with flow through the blood vessel, a structure associated with the blood vessel features, hemodynamic features associated with blood vessels, etc.). One or more types of strain and shear strain image data may be used and/or visualized in order to identify these vascular features.
应变计算包括对使用(2D或3D中的)斑点追踪获得的2D(或3D)位移场执行限带的梯度计算。全图像尺寸上(即对于RF回波数据的每个像素)的实时斑点追踪可能可实现在轴向方向上。可以在血管周围的感兴趣区域中实时地实现2D或3D斑点追踪。可以在B模式或者其他超声成像格式上覆盖应变和剪切应变。例如,关于这种计算的信息还见于通过引用合并于此的Liu等人的“Real-Time 2-D Temperature Imaging Using Ultrasound,”IEEE Transactions on Biomedical Engineering, vol. 57, no. 1, pp. 12-16 (2010年1月)中。Strain calculations include performing band-limited gradient calculations on 2D (or 3D) displacement fields obtained using (in 2D or 3D) speckle tracking. Real-time speckle tracking on the full image scale (ie for each pixel of the RF echo data) may be achievable in the axial direction. 2D or 3D speckle tracking can be achieved in real-time in regions of interest around blood vessels. Strain and shear strain can be overlaid on B-mode or other ultrasound imaging formats. For example, information on such calculations is also found in Liu et al., "Real-Time 2-D Temperature Imaging Using Ultrasound,"IEEE Transactions on Biomedical Engineering , vol. 57, no. 1, pp. 12, which is hereby incorporated by reference -16 (January 2010).
例如,使用斑点追踪来生成所述至少一部分血管位于其中的区域的应变和剪切应变图像数据可以包括生成轴向应变和/或轴向剪切应变图像数据(例如轴向涉及经过所成像的血管的轴)中的至少一个。此外,应变和剪切应变图像数据的这种生成可以包括生成横向应变和/或横向剪切应变图像数据。可以例如在纵视图(例如沿着血管)或横截面视图(例如与血管的轴正交)中对这种数据进行可视化,如这里进一步提供的那样。For example, using speckle tracking to generate strain and shear strain image data of the region in which the at least a portion of the blood vessel is located may include generating axial strain and/or axial shear strain image data (e.g. at least one of the axes). Furthermore, such generation of strain and shear strain image data may comprise generating transverse strain and/or transverse shear strain image data. Such data can be visualized, for example, in a longitudinal view (eg, along a vessel) or a cross-sectional view (eg, orthogonal to the axis of the vessel), as further provided herein.
例如,可以使用和/或可视化一种或多种类型的应变和剪切应变图像数据以识别一个或多个管壁边界,包括整个血管周围的管壁边界(例如,可以以横截面来对这些边界进行可视化和/或在整个血管周围测量这些边界)。可以从其识别、测量或计算一个或多个其他脉管特征,诸如一个或多个管壁边界内的组织特性、邻近该一个或多个管壁边界的斑块构造的一个或多个部分、和/或基于同时对管壁和血流量的运动追踪的一个或多个血流动力学测量结果。For example, one or more types of strain and shear strain image data can be used and/or visualized to identify one or more vessel wall boundaries, including vessel wall boundaries around the entire vessel (e.g., these can be visualized in cross-section borders and/or measure these borders around the entire vessel). One or more other vascular characteristics may be identified, measured or calculated therefrom, such as tissue properties within one or more vessel wall boundaries, one or more portions of plaque formation adjacent to the one or more vessel wall boundaries, And/or one or more hemodynamic measurements based on simultaneous motion tracking of vessel wall and blood flow.
对于将血管以及经过其的流量的一个或多个部分进行成像来说,某些类型的应变和剪切应变图像数据可能比其他图像数据更有益。例如,在识别(例如血管的相对侧上的)第一组相对壁边界时,轴向应变图像数据可能是有益的,而在识别(例如血管的相对侧上的)第二组相对壁边界时,轴向剪切应变图像数据可能是有益的,以使得可以识别整个血管的边界(例如在横截面中可辨别)。此外,对于横向应变和横向剪切应变,通常同样是这种情况。此外,例如,在提供壁剪切应变数据(例如用于识别可能的斑块形成)时,横向剪切应变可能是有益的。Certain types of strain and shear strain image data may be more beneficial than others for imaging one or more portions of a blood vessel and flow therethrough. For example, axial strain image data may be beneficial in identifying a first set of opposing wall boundaries (e.g., on opposite sides of a blood vessel), while identifying a second set of opposing wall boundaries (e.g., on opposite sides of a blood vessel) , axial shear strain image data may be beneficial so that the boundaries of the entire vessel can be identified (eg discernible in cross-section). Furthermore, the same is generally the case for transverse strain and transverse shear strain. In addition, transverse shear strain may be beneficial, for example, when providing wall shear strain data (e.g. for identifying possible plaque formation).
此外,例如,剪切应变图像进一步限定管壁,不仅是近端和远端壁,而且还有侧壁,在传统超声中侧壁难以看到。(2D/3D+时间)计算还可以被用来改善作为心搏周期期间的时间的函数的壁边界的检测。Furthermore, for example, shear strain images further define vessel walls, not only the proximal and distal walls, but also the side walls, which are difficult to see in conventional ultrasound. (2D/3D+time) calculations can also be used to improve detection of wall boundaries as a function of time during the heart cycle.
对脉冲回波数据应用的斑点追踪(框34)可以包括使用一个或多个斑点区域(即被追踪的窗口)的采样脉冲回波数据的任何多维相关。例如,可以使用一个或多个斑点区域的采样脉冲回波数据的二维相关,以及其他多维相关技术。The speckle tracking applied to the pulse echo data (block 34 ) may include any multidimensional correlation of the sampled pulse echo data using one or more speckle regions (ie, windows being tracked). For example, two-dimensional correlation of sampled pulse-echo data of one or more speckle regions may be used, as well as other multidimensional correlation techniques.
在一个实施例中,例如,如在通过引用合并于此的E.S. Ebbini的“Phase-coupled two-dimensional speckle tracking algorithm,”IEEE Trans. Ultrason., Ferroelect., Freq. Contr., vol. 53, no. 5, pp. 972-990, May 2006(在下文中被称为“Ebbini 2006”)中所述的那样执行斑点追踪。例如,一般来说,这种斑点追踪包括:在横向和轴向方向上粗略搜索采样脉冲回波数据的幅度以在互相关的采样脉冲回波数据内定位互相关性峰值的附近区;在该互相关性峰值的附近区内确定接近该互相关性峰值的至少两个相对的梯度矢量;在该互相关性峰值的附近区内确定互相关采样脉冲回波数据的零相位线;以及使用接近该互相关性峰值的该至少两个相对的梯度矢量以及零相位线来估计互相关性峰值。In one embodiment, for example, as in ES Ebbini, "Phase-coupled two-dimensional speckle tracking algorithm,"IEEE Trans. Ultrason., Ferroelect., Freq. Contr. , vol. 53, no 5, pp. 972-990, May 2006 (hereinafter referred to as "Ebbini 2006") to perform speckle tracking. For example, in general, such speckle tracking involves: roughly searching the amplitudes of the sampled pulse-echo data in both lateral and axial directions to locate the vicinity of cross-correlation peaks within the cross-correlated sampled pulse-echo data; determining at least two relative gradient vectors proximate to the cross-correlation peak in the vicinity of the cross-correlation peak; determining a zero-phase line of the cross-correlation sampled pulse-echo data in the vicinity of the cross-correlation peak; The at least two relative gradient vectors and the zero phase line of the cross-correlation peak estimate the cross-correlation peak.
更具体地,如在Ebbini(2006)中描述的那样,提供了一种用于基于搜索区域中二维(2D)复相关性的幅度和相位的梯度进行位移估计的2D斑点追踪方法。该方法将相关性峰值附近的相位和幅度梯度相联系以便在轴向方向和横向方向二者上以子采样精度确定其坐标。这利用根据在采样的(横向插值的)2D互相关性网格上幅度和相位梯度矢量之间的角度确定的最低级别横向插值来实现。该算法后的一个结果是幅度梯度矢量对真实峰值的最终逼近与零相位等值线正交。这导致零相位等值线上的2D鲁棒投影,其导致插值级别处的子采样精度完全低于所需的精度。此外,该方法包括鲁棒的快速搜索算法,其允许在不需要穷举搜索的情况下对真实峰值进行定位。More specifically, as described in Ebbini (2006), a 2D speckle tracking method for displacement estimation based on gradients of magnitude and phase of two-dimensional (2D) complex correlations in a search region is provided. This method relates the phase and magnitude gradients around the correlation peak to determine its coordinates with sub-sampling accuracy in both the axial and transverse directions. This is achieved using the lowest level lateral interpolation determined from the angle between the magnitude and phase gradient vectors on the sampled (transversely interpolated) 2D cross-correlation grid. A consequence of this algorithm is that the final approximation of the magnitude gradient vector to the true peak is orthogonal to the zero-phase contour. This results in a 2D robust projection on the zero-phase contour, which results in a subsampling accuracy at the interpolation level that is well below the required accuracy. Furthermore, the method includes a robust fast search algorithm that allows the localization of true peaks without the need for an exhaustive search.
换言之,斑点追踪使用2D复互相关的相位来根据斑点数据进行鲁棒且高效的位移估计。该斑点追踪方法找到2D复互相关性的真实峰值作为约束的优化问题。该优化问题的目的是:找到经受零相位约束的2D复互相关性的真实峰值处的轴向和横向滞后的坐标。该公式的基础在数学上是根据真实相关性峰值附近的2D互谱的逆傅里叶变换示出的。该几何方法以子采样精度找到轴向和横向位移估计。该方法基于下述事实:2D互相关性的幅度的梯度矢量沿零相位等值线的正交线逼近真实峰值。在已知零相位等值线也经过真实峰值的情况下,倘若幅度梯度矢量源自足够靠近峰值的网格点,则可能通过在该等值线上找到这些矢量正交的点来简单地定位该峰值。该算法的一个特征是以允许进行有效投影的最低级别来使用复互相关的插值。因此,就根据基础2D互相关函数的特性而不是根据期望横向分辨率来确定子采样精度所需的插值的级别来说,该算法在计算上是高效的。In other words, speckle tracking uses the phase of 2D complex cross-correlation for robust and efficient displacement estimation from speckle data. This speckle tracking method finds the true peak of the 2D complex cross-correlation as a constrained optimization problem. The objective of this optimization problem is: to find the coordinates of the axial and transverse lags at the true peak of the 2D complex cross-correlation subject to the zero-phase constraint. The basis of this formulation is shown mathematically in terms of the inverse Fourier transform of the 2D cross-spectrum near the true correlation peak. This geometric method finds axial and lateral displacement estimates with subsampling precision. The method is based on the fact that the gradient vector of the magnitude of the 2D cross-correlation approaches the true peak along the orthogonal line of the zero-phase contour. Given that the zero-phase contour is known to also pass through the true peak, it is possible to simply locate the peak. A feature of the algorithm is to use complex cross-correlation interpolation at the lowest level that allows efficient projection. Thus, the algorithm is computationally efficient in that the level of interpolation required for sub-sampling precision is determined from the properties of the underlying 2D cross-correlation function rather than from the desired lateral resolution.
下面是基于相关性的2D斑点追踪的数学基础并将其与2D互谱方法相关。此后,然后提供了相位耦合的2D斑点追踪算法的两种实现。Below is the mathematical basis for correlation-based 2D speckle tracking and correlating it with 2D cross-spectral methods. Thereafter, two implementations of the phase-coupled 2D speckle tracking algorithm are then provided.
令 


其中


在该等式的推动下,一位研究人员开发了一种基于2D互谱来估计轴向方向和横向方向上的精细位移的算法。已经提出了用于估计轴向和横向频率分量的斜率的迭代加权的最小二乘法。然而,可以通过找到由(3)和(4)给出的2D互相关函数的真实峰值来获得针对该问题的更有效解,Motivated by this equation, a researcher developed an algorithm based on 2D cross-spectrum to estimate fine displacements in both axial and transverse directions. An iteratively weighted least squares method has been proposed for estimating the slopes of the axial and lateral frequency components. However, a more efficient solution to this problem can be obtained by finding the true peak of the 2D cross-correlation function given by (3) and (4),

其中,

根据(3),可以通过评估真实峰值(其中且

其中:in:

因子


其中,元素

要注意,


然而,基于上述近似,由下式给出2D互相关性的幅度:However, based on the above approximation, the magnitude of the 2D cross-correlation is given by:

对于该式,可以如(15)中示出的那样评估梯度矢量的转置,这指示了如预期的那样在真实峰值(l=dx)处该梯度同样为零。 For this equation, the transpose of the gradient vector can be evaluated as shown in (15), which indicates that the gradient is also zero at the true peak (l=dx) as expected. the

此外,l=dx附近的幅度梯度的幅度与距真实峰值的距离成比例,即,网格点越靠近真实峰值,则梯度的幅度越小。此外,如果该梯度点使得l-dx与
这得到了如这里所述的在以最低级别使用插值以确保向零相位等值线上的有效投影的条件的意义上鲁棒且数值上高效的用于找到真实峰值的算法。这里所述的公式还提供了在二次曲面(2D互相关性的幅度)上找到服从零相位条件的点的优化过程的基础。可以使用如这里所述的拉格朗日乘数法来解决该问题。This results in a robust and numerically efficient algorithm for finding the true peak in the sense that interpolation is used at the lowest level to ensure a valid projection condition to the zero-phase contour as described here. The formulations described here also provide the basis for an optimization procedure for finding points subject to the zero-phase condition on quadric surfaces (magnitudes of 2D cross-correlations). This problem can be solved using the Lagrangian multiplier method as described here.
可以容易地将上面的结果扩展到仿射变换的情况[13]:The above results can be easily extended to the case of affine transformations [13]:

其中:in:

这计及了平移(dx)、应变(


在这种情况下,我们以矢量形式使用在时间

其中T'是T的转置,并且|·|是矩阵的行列式。要注意,(19)仅是1D中的傅里叶变换的扩缩特性的推广,先前已经用在存在应变时对超声回波的去相关的分析中。其还与[5]中示出的2D/3D公式一致,该公式分析了变形和波形扭曲对位移估计的方差的组合影响。where T' is the transpose of T, and |·| is the determinant of the matrix. Note that (19) is only a generalization of the scaling property of the Fourier transform in 1D, which has been previously used in the analysis of decorrelation of ultrasound echoes in the presence of strain. It is also consistent with the 2D/3D formulation shown in [5], which analyzes the combined effects of deformation and waveform distortion on the variance of the displacement estimates.
暗示了轴向应变和横向应变二者均可以影响单独基于相位匹配的位移估计。其还可以提供直接(或迭代地)估计被窗口询问的组织区域上的应变的机会。这里我们要注意,在应变参数、、


。 .
在斑点追踪方法中,感兴趣的是使用相位耦合方法来找到当组织经受位移和/或无穷小应变时2D互相关函数的真实峰值。这可以被看作估计诸如例如矢量速度估计和弹性成像之类的应用中所需的位移矢量中的第一步。这样的应用可能需要基于2D互相关性的峰值的位移追踪作为公共步骤,但是它们可能在所使用的变形模型参数方面不同。这可以通过实施后处理步骤来完成,该后处理步骤从通过找到2D互相关性的真实峰值而获得的移位估计结果提取变形参数。这样的后处理取决于要确定的具体问题。Among speckle-tracking methods, it is of interest to use phase-coupling methods to find the true peak of the 2D cross-correlation function when the tissue is subjected to displacement and/or infinitesimal strain. This can be seen as a first step in estimating the displacement vector required in applications such as eg vector velocity estimation and elastography. Such applications may require displacement tracking based on peaks of 2D cross-correlations as a common step, but they may differ in the deformation model parameters used. This can be done by implementing a post-processing step that extracts deformation parameters from the displacement estimation results obtained by finding the true peak of the 2D cross-correlation. Such post-processing depends on the specific problem to be determined.
示例性相位耦合的2D斑点追踪算法。Exemplary phase-coupled 2D speckle tracking algorithm .
由经受运动和/或变形的斑点区域的2D相关的特性来引导示例性斑点追踪算法的步骤。具有复包络的2D相关性的幅度具有表现良好的峰值,其在轴向方向和横向方向上的范围与斑点单元尺寸成比例。主要思想是使用快速搜索算法来在搜索窗口内找到基于相关性的匹配(即高于阈值的相关性值)。如果当前搜索点远离相关性峰值,则可以以在轴向方向和横向方向上相关单元尺寸的范围的大约一半的轴向和横向步长使用快速搜索。这允许该搜索在不丢失真实峰值(如果它存在的话)的情况下粗略地覆盖较大区域。一旦找到匹配,就使用互相关性的幅度梯度来找到(由RF采样频率以及图像中A线之间的间距确定的)采样网格上的峰值互相关。这通过遵循梯度上升轨迹来完成,对于沿该轨迹的每个点,其需要计算两个到三个相关性值。如果搜索点在轴向和横向方向上的相关性峰值的宽度内(例如在距峰值3dB内),则对峰值的梯度搜索从任何方向都是非常鲁棒和高效的。一旦找到基于网格的相关性峰值,就计算3×3相关性网格(以该峰值为中心)。在紧邻相关性峰值处,可以根据经过真实峰值的零相位等值线和幅度梯度矢量来确定该真实峰值。根据处于原始采样坐标的3×3网格,通过以将允许使用(13)的方式将2D互相关的相位耦合到振幅(梯度)来产生真实相关性峰值的精细估计。The steps of the exemplary speckle tracking algorithm are guided by the 2D-related properties of the speckle region subject to motion and/or deformation. The magnitude of the 2D correlation with a complex envelope has a well-behaved peak whose extent in the axial and transverse directions is proportional to the spot cell size. The main idea is to use a fast search algorithm to find correlation-based matches (i.e. correlation values above a threshold) within the search window. If the current search point is far from the correlation peak, a fast search can be used with axial and lateral step sizes approximately half the range of correlated cell sizes in the axial and lateral directions. This allows the search to roughly cover larger areas without losing the true peak (if it exists). Once a match is found, the magnitude gradient of the cross-correlation is used to find the peak cross-correlation on the sampling grid (determined by the RF sampling frequency and the spacing between A-lines in the image). This is done by following a gradient ascent trajectory, which requires computing two to three correlation values for each point along the trajectory. Gradient search for a peak is very robust and efficient from any direction if the search point is within the width of the correlation peak in both axial and transverse directions (eg within 3dB from the peak). Once a grid-based correlation peak is found, a 3 × 3 correlation grid is calculated (centered on this peak). In the immediate vicinity of the correlation peak, the true peak can be determined from the zero-phase contour and the magnitude gradient vector passing through the true peak. A refined estimate of the true correlation peak is produced by coupling the phase of the 2D cross-correlation to the amplitude (gradient) in a way that would allow the use of (13), according to a 3×3 grid at the original sampling coordinates.
在下面的子章节中描述用于获得精细估计的两个示例性方法。Two exemplary methods for obtaining refined estimates are described in the following subsections.
A.零相位等值线上的二维投影。A. 2D projection of zero-phase contours.
该方法以足够大的因子(即尽可能小)插值在横向滞后方向上真实峰值附近的3×3网格,以便估计与零相位等值线正交的幅度梯度矢量。幅度梯度和零相位等值线的交点是2D互相关性的所估计的真实峰值。The method interpolates a 3 × 3 grid around the true peak in the transverse lag direction by a factor large enough (i.e., as small as possible) to estimate the magnitude gradient vector orthogonal to the zero-phase contour. The intersection of the magnitude gradient and the zero-phase contour is the estimated true peak of the 2D cross-correlation.
如下概述该算法的步骤。The steps of the algorithm are outlined as follows.
步骤0:根据处的2D自相关函数,直接估计轴向方向和横向方向上的搜索步长

步骤1:在所限定的搜索区域中使用和
步骤2:在没有任何插值的情况下,计算局部幅度梯度并沿着梯度上升轨迹移动。当达到无插值网格上的峰值点时,该步骤停止。Step 2: Without any interpolation, compute the local magnitude gradient and move along the gradient ascent trajectory. The step stops when the peak point on the grid without interpolation is reached.
步骤3:一旦达到无插值网格上的最大值点,就计算以该最大值为中心的3×3网格上的互相关性值。以小的因子(例如8)横向插值3×3网格并找到针对最靠近真实峰值的两个梯度矢量的线等式,但是指向相对的横向方向。如果在当前的插值因子的情况下不满足该条件,则将插值增加2并重复该测试。如果达到最大插值因子(例如128)并且插值峰值处的相关性低于阈值(例如0.75),则声明位移估计无效并给位移估计分配值NaN。否则进行到步骤4。Step 3: Once the maximum point on the grid without interpolation is reached, calculate the cross-correlation value on a 3×3 grid centered at this maximum. Interpolate the 3x3 grid laterally by a small factor (eg 8) and find the line equation for the two gradient vectors closest to the true peak, but pointing in opposite lateral directions. If the condition is not met with the current interpolation factor, the interpolation is increased by 2 and the test is repeated. If the maximum interpolation factor (eg 128) is reached and the correlation at the interpolation peak is below a threshold (eg 0.75), the displacement estimate is declared invalid and assigned the value NaN. Otherwise go to
步骤4:找到针对插值网格上的相关函数的零相位线的线等式。所估计的真实相关性峰值是零相位线与经过来自幅度梯度的两个最大斜率线的交点的正交线之间的交点。Step 4: Find the line equation for the zero-phase line of the correlation function on the interpolation grid. The estimated true correlation peak is the intersection between the zero phase line and the quadrature line passing through the intersection of the two maximum slope lines from the magnitude gradient.
为了说明的目的,图6A中的搜索轨迹基于


在该搜索示例中,对第一回路上的八个滞后进行测试,并且没有发现候选峰值(即没有相关性值>0.65)。该算法从第一回路中的最后一点(横向-1且轴向0)跳到第二回路中的第一点(横向-2且轴向-10),并沿着横向滞后方向逆时针移动。一旦阈值测试成功,该步骤就停止,即当前相关滞后处的相关性值高于所选阈值。在图6A中,在达到阈值0.65之后,该步骤在横向滞后0且轴向滞后-10处停止。还在图6A的帮助下图示了步骤2。

可以在图6B的帮助下图示该算法的最后两个步骤,图6B示出靠近真实峰值的插值2D互相关的相位等值线和幅度。进一步地,图6B示出在相关峰值附近(在轴向滞后-13和-15且横向滞后1和3之间)横向插值的3×3网格上的2D互相关的相位等值线和幅度。箭头表示插值网格上的幅度梯度矢量。在该情况下使用因子为16的横向插值(其中箭头基部指示插值网格点)。相位等值线标记有以弧度计的相位值并且看起来几乎是具有较小倾斜的直线。真实峰值由零相位线上的开口圆指示。虚点线是最靠近峰值和切线的幅度梯度矢量的方向以及零相位线的正交线的方向。此外,可以看到幅度梯度矢量指向真实峰值的(总)方向。对于在横向滞后1和3且轴向滞后-13和-15之间(即来自步骤2的中心处于横向2且轴向-14)的该情况,使用的插值因子为16。沿着两个最靠近幅度梯度矢量、零相位线的正切线以及通过最大斜率线的交点的零相位的正交线绘制四条(粗的虚点)线。由开口圆指示的真实相关峰值是开口圆与零相位线的交点。The last two steps of the algorithm can be illustrated with the help of Fig. 6B, which shows the phase contour and magnitude of the interpolated 2D cross-correlation close to the true peak. Further, Figure 6B shows the phase contours and magnitudes of the 2D cross-correlation on a laterally interpolated 3 × 3 grid around the correlation peak (between axial lags −13 and −15 and
零相位投影算法的最后步骤是与真实峰值处的零相位等值线正交的幅度梯度矢量的近似。近似误差取决于所使用的插值级别并且可以通过使用横向插值因子来控制以便刚好确保在最后的近似中使用的两个幅度梯度矢量中的至少一个大体上不与靠近真实峰值的零相位等值线平行。一般来说,这一条件不仅仅在轴向移位几乎等于轴向采样间隔的整数倍时才需要。例如,在图6B中,可以看到轴向滞后-14处从右侧接近的幅度梯度矢量几乎平行于零相位线。这里使用为16的插值因子刚好足以产生有效投影。有效投影是两个最靠近峰值的幅度梯度矢量与零相位线的切线相交,在交点处切线很好地近似相位等值线。然而,这里的关键点是可以自适应地执行插值,从而最小化位移估计算法中的任何不必要的计算。除了该方法的计算优点之外,还可以减小或消除因为插值而引起的误差。The final step of the zero-phase projection algorithm is the approximation of the magnitude gradient vector in quadrature to the zero-phase contour at the true peak. The approximation error depends on the level of interpolation used and can be controlled by using a transverse interpolation factor to just ensure that at least one of the two magnitude gradient vectors used in the final approximation does not substantially correspond to the zero-phase contour near the true peak parallel. In general, this condition is not only required when the axial displacement is nearly equal to an integer multiple of the axial sampling interval. For example, in Fig. 6B, it can be seen that the magnitude gradient vector approaching from the right at axial lag −14 is almost parallel to the zero phase line. Here an interpolation factor of 16 is used just enough to produce a valid projection. The effective projection is the intersection of the two magnitude gradient vectors closest to the peak with the tangent of the zero-phase line, at which point the tangent approximates the phase contour well. However, the key point here is that interpolation can be performed adaptively, thereby minimizing any unnecessary computations in the displacement estimation algorithm. In addition to the computational advantages of this method, errors due to interpolation can be reduced or eliminated.
应该注意,可以在该方法中实施一个或多个不同步骤,并且这里提供的具体步骤不意在限制本公开。例如,可以使用一个或多个其他数字信号处理方法来实施该示例性搜索算法。此外,例如,对于模板匹配,可以使用(0,0)滞后附近的自相关序列。相关问题是在步骤3中声明基于相关阈值的无效估计并且分配值NaN。这可以被看作在后续处理中使用的标记(如果有必要的话)。例如,可以使用适应的窗口尺寸来最大化复合信噪比(SNR)。可替换地,可以使用与由(19)描述的模型类似明确变形模型。It should be noted that one or more different steps may be implemented in the method, and the specific steps provided here are not intended to limit the present disclosure. For example, the exemplary search algorithm may be implemented using one or more other digital signal processing methods. Also, e.g. for template matching, autocorrelation sequences around (0,0) lags can be used. A related issue is declaring in
此外,本公开不限于使用2D斑点追踪。例如,在这里的一个或多个实施例中,其他多维追踪方法(诸如3D斑点追踪方法)也可以适用。Furthermore, the present disclosure is not limited to the use of 2D speckle tracking. For example, other multi-dimensional tracking methods, such as 3D speckle tracking methods, may also be applicable in one or more embodiments herein.
B.具有相位约束的表面多项式拟合。B. Polynomial fitting of surfaces with phase constraints.
上面描述的2D相位投影方法可以被看作用于实施找到复2D互相关性的真实峰值的优化过程的高效方法。峰值寻找问题可以被描写成找到对真实峰值附近的2D互相关性的幅度的表面的多项式拟合的系数。从实际成像数据获得图6A和6B中示出的标称和插值等值线图,并且它们表示可从标准成像扫描仪期望的内容。非常清楚的是,靠近真实相关性峰值的表面表现良好并看起来在

其中,

其中,
这相当于求解等式的超定系统:This is equivalent to solving an overdetermined system of equations:

这得到:This gets:

通过取得该二次函数关于实向量

当矩阵A是良态的(well conditioned)时上式有效。如果不是这种情况,则寻求正则化解(例如使用奇异值分解)[17]。一旦获得系数


然而,该解可以相当于仅基于幅度的一种插值形式,这可能在真实相关峰值的估计中导致不可接受的高级别偏差和差异,尤其在轴向方向上。这归因于在轴向方向上由q描述的表面的几乎平坦性质(轴向范围仅±1滞后采样)。然而,q在横向方向上通常具有明显的峰值,并且该方向上的导数产生可靠的峰值估计。已知超声回波信号的分析性质通过使用没有插值的复互相关而在轴向移位估计中允许高子采样精度。如果根据由(30)描述的表面拟合解的横向估计具有从被分析的RF数据获得的轴向估计,则可以获得改进的解。However, this solution may amount to a form of interpolation based only on magnitude, which may lead to unacceptably high levels of bias and variance in the estimation of the true correlation peak, especially in the axial direction. This is attributed to the almost flat nature of the surface described by q in the axial direction (only ±1 lag sampling for the axial range). However, q often has a distinct peak in the transverse direction, and the derivative in this direction yields reliable peak estimates. It is known that the analytical nature of ultrasound echo signals allows high sub-sampling accuracy in axial displacement estimation by using complex cross-correlation without interpolation. An improved solution can be obtained if the lateral estimate from the surface fitting solution described by (30) has an axial estimate obtained from the analyzed RF data.
可以通过将(13)用作结合适当成本函数的约束(例如使用拉格朗日乘数法)来容易地完成计及2D中的相位信息。为此,我们认识到(21)中给出的多项式拟合函数本身在

, ,
其中,


- 


- 。- .
第一约束仅仅是在本征值问题中通常使用的归一化。第二约束将解矢量限于在真实峰值处与零相位线正交(13)。从(6)和(7)中的中心频率值获得m的元素。The first constraint is simply the normalization normally used in eigenvalue problems. The second constraint restricts the solution vector to be orthogonal to the zero-phase line at the true peak (13). Obtain the elements of m from the center frequency values in (6) and (7).
上面的约束允许我们就拉格朗日乘数λ和μ定义新的成本函数:The above constraints allow us to define new cost functions in terms of Lagrangian multipliers λ and μ:

可以通过取得


乘以

其中使用了正交性约束来去掉(34)中的第二项。将μ代入回到(33)中,我们获得本征值问题:where the orthogonality constraint is used to remove the second term in (34). Substituting μ back into (33), we obtain the eigenvalue problem:

针对该本征值问题的解是与矩阵的最大本征值相关联的本征矢量。拉格朗日乘数λ是本征值,其适当地扩缩本征矢量以给出真实滞后(在真实最大值处)。投影矩阵
可以利用这里所述的进一步帮助提供有用图像数据或图像数据的增强的示例性斑点追踪方法(诸如Ebbini(2006)中描述的那些)来实施各种步骤、例程或过程。例如,当执行至少一部分血管位于其中的区域中的斑点区域的斑点追踪时,如果被追踪的斑点区域(即窗口或斑点单元)部分处于限定该至少一部分血管的管壁内并且部分处于管壁之外(例如部分位于血管内的血液中或者部分位于管壁边界之外),则可能难以实施斑点追踪过程或者产生不准确的数据(例如难以互相关等等)。由此,至少在一个实施例中,一旦脉管特征被识别或确定(例如基于斑点追踪识别出血管的一个或多个边界(或其部分)),则可以在执行斑点追踪方法时使用该脉管特征。The various steps, routines or processes may be implemented using exemplary speckle tracking methods described herein, such as those described in Ebbini (2006), which further aid in providing useful image data or enhancements of image data. For example, when performing speckle tracking of a speckle region in an area in which at least a part of blood vessels is located, if the tracked speckle region (ie, a window or a speckle unit) is partly within and partly within the vessel wall defining the at least part of the blood vessel outside the vessel (eg partly in the blood within the vessel or partly outside the vessel wall boundary), it may be difficult to perform the speckle tracking process or produce inaccurate data (eg difficult to cross-correlate, etc.). Thus, in at least one embodiment, once vessel features are identified or determined (eg, one or more boundaries (or portions thereof) of a vessel are identified based on speckle tracking), the vessel can be used when performing the speckle tracking method. Tube features.
例如,可以基于一个或多个脉管区域的斑点追踪来识别一个或多个管壁边界。一旦识别出这样的边界,就可以在斑点追踪过程中使用它们。在一个或多个实施例中,例如,可以基于至少一个所识别的脉管特征(例如诸如管壁边界的识别)来修改该一个或多个斑点区域的特征(例如位置、尺寸、形状等等)。例如,可以基于所识别的一个或多个管壁边界来修改被识别的该一个或多个斑点区域中的至少一个的位置(例如或者可以修改一个或多个斑点区域的任何其他特征,诸如尺寸或形状)(例如以使得要被追踪的斑点区域完全在管壁之内或之外)。换言之,如果斑点追踪过程确定要被追踪的斑点区域或窗口部分在限定该至少一部分血管的管壁之内且部分在该管壁之外(例如部分位于血管内的血液中或者部分在管壁边界之外),则可以修改或以其他方式调整斑点区域位置以使得该斑点区域完全位于管壁之内或管壁之外。此外,可以在斑点追踪期间修改所追踪斑点区域的尺寸或形状(例如狭窄或宽度或长度),以使得斑点区域完全位于管壁之内或管壁之外,或者提供例如位移的质量估计。换言之,基于为血管确定的一个或多个边界来修改斑点区域以使得它完全落在管壁之外、完全在管壁之内、或完全在血液中(例如通过先前的斑点追踪和生成该至少一部分血管位于其中的区域的应变和/或剪切应变图像数据)。For example, one or more vessel wall boundaries may be identified based on speckle tracking of one or more vessel regions. Once such boundaries are identified, they can be used in the blob tracking process. In one or more embodiments, for example, characteristics (e.g., location, size, shape, etc.) of the one or more speckle regions may be modified based on at least one identified vessel characteristic (e.g., such as identification of vessel wall boundaries). ). For example, the position of at least one of the one or more speckle regions identified can be modified based on the identified one or more vessel wall boundaries (for example, or any other characteristic of the one or more speckle regions, such as size or shape) (eg such that the speckle area to be tracked is completely inside or outside the tube wall). In other words, if the speckle tracking process determines that the speckle region or window to be tracked is partly within the vessel wall defining the at least part of the vessel and partly outside the vessel wall (e.g. partly in the blood within the vessel or partly at the vessel wall boundary outside), the speckled region location can be modified or otherwise adjusted so that the speckled region is completely inside or outside the tube wall. Furthermore, the size or shape (eg narrowness or width or length) of the tracked speckle region can be modified during speckle tracking so that the speckle region is completely inside or outside the tube wall, or to provide a mass estimate such as displacement. In other words, the speckle region is modified based on one or more boundaries determined for the vessel such that it falls completely outside the vessel wall, completely within the vessel wall, or completely in the blood (e.g., by previous speckle tracking and generating the at least Strain and/or shear strain image data of a region in which a portion of the blood vessel is located).
例如,一般来说,设计跟踪窗口以便优化或实现(例如通常通过减小窗口尺寸来改进的)空间分辨率和减小位移估计的变化(例如一般通过增大窗口尺寸)之间的折衷。例如,在一个实施例中,对于均匀的斑点区域,回波数据的信噪比(SNR)连同换能器带宽一起是选择窗口尺寸的主要因素。此外,在没有严重变形的情况下,窗口被设计成近似方形,即近似相同的轴向和横向尺度。在管壁附近(尤其在腔侧上),许多假设可能被违背。提供高帧速率成像(例如M2D模式成像)以减轻这些影响中的某些,但是可能还存在直接考虑追踪窗口内的变形的需要(例如窗口的一部分在血管中且一部分在血液中会导致变形组织)。在这种情况下,可以应用将产生优化估计(例如最佳可能位移估计)的适应窗口尺寸和形状设计互选择算法。2D相位耦合的算法提供对估计质量的反馈(例如品质因数)。这些品质因数可以被用来表征例如使用具有同一高度但不同宽度(以及反之亦然)的不同窗口而获得的估计质量。由此,可能并行地运行这些窗口并且实施选择具有最高品质因数的估计的选举方案并且丢弃或压低(例如应用较低的权重因子)具有较低品质因数的估计。For example, in general, tracking windows are designed to optimize or achieve a trade-off between spatial resolution (eg, typically improved by reducing the window size) and reduced variation in displacement estimates (eg, typically by increasing the window size). For example, in one embodiment, for a uniform speckle area, the signal-to-noise ratio (SNR) of the echo data along with the transducer bandwidth is a major factor in selecting the window size. Furthermore, the windows are designed to be approximately square, i.e. approximately the same axial and lateral scales, without severe deformation. Near the vessel wall, especially on the luminal side, many assumptions may be violated. High frame rate imaging (e.g. M2D mode imaging) is provided to mitigate some of these effects, but there may also be a need to directly account for deformations within the tracking window (e.g. part of the window is in a vessel and part in blood resulting in deformed tissue ). In this case, an adaptive window size and shape design interselection algorithm can be applied that will produce an optimal estimate (eg, the best possible displacement estimate). The 2D phase-coupled algorithm provides feedback on the quality of the estimate (eg figure of merit). These figures of merit can be used to characterize the quality of estimates obtained eg using different windows of the same height but different widths (and vice versa). Thus, it is possible to run these windows in parallel and implement an election scheme of selecting the estimate with the highest figure of merit and discarding or depressing (eg applying a lower weighting factor to) the estimate with a lower figure of merit.
更进一步地,管壁回波混响可能损坏从血液接收的脉冲回波数据。由此,在血液内的一个或多个斑点区域的斑点追踪的一个或多个实施例中,在执行来自血液中一个或多个斑点区域的脉冲回波数据的斑点追踪时,该斑点追踪可能去除脉冲回波数据中因管壁处的反射而引起的回波分量(例如使用去混响滤波器)。Still further, wall echo reverberation may corrupt pulse-echo data received from blood. Thus, in one or more embodiments of speckle tracking of one or more speckle regions within blood, when performing speckle tracking from pulse-echo data of one or more speckle regions in blood, the speckle tracking may Remove echo components from pulse-echo data due to reflections at pipe walls (e.g. using a dereverberation filter).
换言之,如这里所述的那样,各种斑点追踪方法(例如二维斑点追踪方法)可以被用来对血管附近变形和组织运动进行成像(例如用于脉管疾病的检测和分期)。然而,在一个或多个实施例中,管壁回波混响可能盖过来自血液的回波(散射)并且导致血管内大区域中流量信息的损失。可被用来校正这些混响的一个实施例包括针对血管内的回波数据(例如来自血液的回波数据)使用时变去混响反滤波器。此类滤波器的设计可能受到混响模式随着管壁的脉动运动显著变化的事实的影响。管壁相对于成像波束的位置/定向的微小变化导致可测得的管壁处斑点镜像回波混合的变化以及观察到的血管内周期性的混响模式。因此,时变反滤波器可以被用来适当地去除心搏周期期间的混响分量。In other words, as described here, various speckle tracking methods (eg, two-dimensional speckle tracking methods) can be used to image deformation and tissue motion near blood vessels (eg, for detection and staging of vascular diseases). However, in one or more embodiments, vessel wall echo reverberation may overwhelm echoes from blood (scatter) and cause loss of flow information in large regions within the vessel. One embodiment that may be used to correct for these reverberations includes using a time-varying dereverberation inverse filter on echo data within a vessel, eg from blood. The design of such filters may be influenced by the fact that the reverberation mode varies significantly with the pulsating motion of the pipe wall. Small changes in the position/orientation of the vessel wall relative to the imaging beam lead to measurable changes in the speckle-mirror echo mixing at the vessel wall and the observed periodic reverberation patterns within the vessel. Therefore, a time-varying inverse filter can be used to properly remove the reverberation component during the heart cycle.
斑点追踪(例如二维斑点追踪)可以被用于分析组织运动和变形,尤其在脉管成像应用中。除了血管动力学的直接测量结果和/或表征之外,这样的斑点追踪可以为重要的挑战领域(诸如计算流体动态学)提供组织位移场和基础解剖信息。Speckle tracking (eg, 2D speckle tracking) can be used to analyze tissue motion and deformation, especially in vascular imaging applications. In addition to direct measurements and/or characterization of vascular dynamics, such speckle tracking can provide tissue displacement fields and underlying anatomical information for important challenging areas such as computational fluid dynamics.
例如,如这里所述的那样,可以使用脉冲回波诊断超声(例如使用相位耦合的二维斑点追踪,其实现轴向方向和横向方向上的子采样位移估计精度以及高帧速率(例如每秒325帧)M2D成像模式,可以同时估计横向流速和壁运动二者因此提供压力(通过血管直径)和流量(通过矢量速度))来执行血管(例如人的颈动脉)中血流矢量速度以及组织运动/变形的同时估计。这样的测量结果可以为血流动力学计算提供基础,该血流动力学可以被用于评估管壁顺应性,如这里所述的其是血管健康的重要指标。此外,如这里所述的那样,轴向和横向位移场表现良好并允许组织和血液中的应变和剪切应变计算。这些速度/应变场连同解剖图像信息一起可以为计算流体动力学模型提供输入,该计算流体动力学可能允许适合于评估脉管系统以及周围组织的健康的逆计算(例如动脉粥样硬化的检测和分期)。For example, as described here, pulse-echo diagnostic ultrasound (e.g., two-dimensional speckle tracking using phase coupling) can be used, which achieves subsampled displacement estimation accuracy in the axial and transverse directions and high frame rates (e.g., per second 325 frames) M2D imaging mode, which can simultaneously estimate both lateral flow velocity and wall motion, thus providing pressure (via vessel diameter) and flow (via vector velocity)) to perform blood flow vector velocity in blood vessels (such as human carotid arteries) and tissue Simultaneous estimation of motion/deformation. Such measurements can provide the basis for hemodynamic calculations that can be used to assess vessel wall compliance, which, as described herein, is an important indicator of vascular health. Furthermore, as described here, axial and transverse displacement fields are well behaved and allow strain and shear strain calculations in tissue and blood. These velocity/strain fields, together with anatomical image information, can provide input to computational fluid dynamics models that may allow inverse calculations suitable for assessing the health of the vasculature as well as surrounding tissues (e.g. detection of atherosclerosis and instalments).
基于脉冲回波超声的二维斑点追踪方法的一个可能的限制是与强镜面反射镜相关的混响分量。混响产生与来自镜面反射镜远端区域的背散射分量混合的杂乱信号分量。这在血管中是明显的,其中来自血液的散射通常低于来自管壁的镜面反射30-40dB。然而,对于组织运动和血液速度矢量都重要的应用,应该最小化由来自管壁内区域的混响引起的杂乱。可以在二维斑点追踪之前使用恢复来自血液散射区域的回波的脉冲回波超声数据去混响算法以解决此类混响。因为在心搏周期的不同阶段期间管壁散射特征的变化,观察到混响信号分量是非稳定的,这指示可能需要用于反混响的时变反滤波器。一种可能的滤波器设计方法可以利用用于来自管壁的回波信号的短程相关和用于来自底壁和血管区域的回波信号的长程相关。相关函数中的周期性归因于产生不同镜面反射分量的多层组织结构以及管壁构造(例如外膜)。A possible limitation of pulse-echo ultrasound-based 2D speckle tracking methods is the reverberation component associated with strong specular mirrors. Reverberation produces cluttered signal components mixed with backscattered components from the far region of the specular mirror. This is evident in blood vessels, where scattering from blood is typically 30-40dB lower than specular reflection from the vessel wall. However, for applications where both tissue motion and blood velocity vectors are important, clutter caused by reverberation from the intramural region should be minimized. A pulse-echo ultrasound data dereverberation algorithm that recovers echoes from blood-scattering regions can be used prior to two-dimensional speckle tracking to account for such reverberation. The reverberation signal component was observed to be non-stationary because of changes in the wall scattering characteristics during different phases of the heart cycle, indicating that a time-varying inverse filter for de-reverberation may be required. One possible filter design approach may utilize short-range correlation for echo signals from the vessel wall and long-range correlation for echo signals from the bottom wall and vessel region. The periodicity in the correlation function is attributed to the multilayer tissue structure and the vessel wall architecture (eg, adventitia) that produce different specular reflection components.
下面提供了去混响的一个或多个实施方式或测试其的示例。不应将此类实施方式或示例视为对本公开的限制。One or more implementations of, or examples of testing for, dereverberation are provided below. Such embodiments or examples should not be considered as limitations of the present disclosure.
示例性去混响滤波信息。Exemplary dereverberation filter information.
示例去混响滤波的数据获取。Data acquisition for example dereverberation filtering.
加载有用于M2D脉冲回波数据收集的程序的Sonix RP(Ultrasonix, Canada)超声扫描仪。然后通过吉比特互联网将所收集的数据流水线到控制器PC以便进行实时数据处理。数据处理计算机可以通过利用多核GPU(nVIDIA, Santa Clara, CA)来容易地应对高分辨率(空间和时间)斑点追踪和可分离的2D后置滤波所需的密集计算。线性阵列探头(LA14-5/38)被用来获取该示例的所有数据。探头上的发射脉冲的中心频率是7.5MHz。A Sonix RP (Ultrasonix, Canada) ultrasound scanner loaded with a program for M2D pulse-echo data collection. The collected data is then pipelined over the Gigabit Internet to the controller PC for real-time data processing. The data-processing computer can easily cope with the intensive computation required for high-resolution (spatial and temporal) speckle tracking and separable 2D post-filtering by utilizing a multi-core GPU (nVIDIA, Santa Clara, CA). A linear array probe (LA14-5/38) was used to acquire all data for this example. The center frequency of the transmit pulse on the probe is 7.5 MHz.
接收信号模型。Receive signal model.
提供了针对从典型扫描仪和典型脉管探头(诸如上面所述的那些)获得的脉冲回波波束赋形超声数据的接收信号模型。由下式给出形成一个图像线的回波数据:Received signal models are provided for pulse-echo beamformed ultrasound data obtained from a typical scanner and a typical vascular probe such as those described above. The echo data forming an image line is given by:

其中,


其中


用于回波去混响的反滤波器设计。Inverse filter design for echo dereverberation.
相干回波分量的相关函数在

可以通过最大化关于流通道内的GMM的对数似然性来获得系数
其中,是GMM中高斯密度的数目(每个都由表示),并且


其中


其中,m是迭代指数并且d被选为足够小以允许精细的收敛(以收敛速度为代价)。在至少一个实施例中,如果GMM受一个分布支配(通常是这种情况),则(5)可以被简化。无论如何,
模型阶数选择:可以根据来自近端管壁以及来自包括近端壁的血管回波数据的复包络的自相关函数中次峰的识别来确定(3)中的参数N。利用主要对血管内的混响作出响应的壁(以及支撑组织)架构,可识别到这些相关函数中的周期性。对于典型人类对象的颈动脉,阶数根据心搏周期的阶段而在20-45的范围内变化(当管壁以最大程度拉伸时阶数降低)。可以根据在整个心搏周期内周期性的观察来设置模型阶数的最大值
无混响训练数据。No reverberation training data.
获得无混响回波数据可以通过(在识别到管壁之后)将成像换能器倾斜以避免来自管壁的镜面反射而完成。实际上,非常小的倾斜就足以显著去除镜面回波并且维持血管的很好地查看。彩色血流或能量多普勒模式可以被用来限定用于提取训练回波数据的血流区域。一旦这个被实现,就将成像换能器转到一个可以从镜面反射最佳地限定血管边界的位置。还可能通过仔细选择不存在混响分量的区域来从损坏的视图得到无混响数据。Obtaining reverberation-free echo data can be accomplished by (after identifying the pipe wall) tilting the imaging transducer to avoid specular reflections from the pipe wall. In fact, a very small tilt is enough to significantly remove the specular echo and maintain a good view of the blood vessel. Color flow or power Doppler modes can be used to define the flow region for extraction of training echo data. Once this is achieved, the imaging transducer is turned to a position that best defines the vessel border from the specular reflection. It is also possible to obtain reverberation-free data from corrupted views by carefully selecting regions where no reverberation components are present.
例如,直径为6mm的血管可以在其远端处提供2mm的无混响回波数据区域。可以使用后面的方法来在典型心搏周期期间识别GMM。基于来自人类对象的实际回波数据,(4)中的的值通常是3到4,均具有零均值。For example, a blood vessel with a diameter of 6 mm may provide a 2 mm region of reverberant echo data at its distal end. The latter approach can be used to identify GMMs during a typical heart cycle. Based on actual echo data from human subjects, the The values for are typically 3 to 4, all with zero mean.
时变滤波器设计算法。Time-varying filter design algorithm.
基于上面的推导以及关于数据获取模型从典型脉管成像超声获取波束赋形回波数据的事实,提供了下面的滤波器设计步骤。对于图像线1和图像帧p,Based on the derivation above and the fact that beamformed echo data is acquired from typical vascular imaging ultrasound with respect to the data acquisition model, the following filter design steps are provided. For
步骤0:根据复包络数据检测近端管壁,Step 0: Detect the proximal vessel wall based on the complex envelope data,
步骤1:根据短程和长程相关函数来确定IIR模型阶数N,Step 1: Determine the orderN of the IIR model according to the short-range and long-range correlation functions,
步骤2:根据血管回波数据的无混响段来确定GMM参数,Step 2: Determine the GMM parameters according to the reverberation-free segment of the vascular echo data,
步骤3:使用最大似然算法来确定滤波器系数(等式4-6),Step 3: Use the maximum likelihood algorithm to determine the filter coefficients (Equations 4-6),
步骤4:在适当初始条件下将IRR滤波器应用于血管数据以避免回波数据中的中断,Step 4: Apply an IRR filter to the vessel data under appropriate initial conditions to avoid discontinuities in the echo data,
步骤5:计算对y[n]的长程相关函数。如果仍能检测到混响,同时
关于示例的结果和讨论:Results and discussion on examples:
数据收集:Soinx被用来从健康志愿者的右颈动脉的成像收集M2D模式数据。以325fps的帧速率收集实时波束赋形RF数据并且离线处理该数据以产生与图16A-16B中示出的图像类似的图像,图16A-16B中示出的图像示出(以彩色或灰度级)编码且叠加在B模式灰度级图像上的颈动脉的横向位移(图16A)和轴向位移(图16B)。使用Ebbini 2006中描述的相位耦合二维斑点追踪算法估计了位移场。Data collection: Soinx was used to collect M2D modality data from imaging of the right carotid artery in healthy volunteers. Real-time beamforming RF data was collected at a frame rate of 325 fps and processed offline to produce images similar to those shown in FIGS. 16A-16B , which show (in color or grayscale level) encoded and superimposed on the B-mode grayscale image of the lateral displacement (Fig. 16A) and axial displacement (Fig. 16B) of the carotid artery. Displacement fields were estimated using the phase-coupled two-dimensional speckle-tracking algorithm described in Ebbini 2006.
获取了大致1.9秒(642帧)的数据,从而捕获了多于3个心搏周期以允许对回波和来自血管(主要归因于近端壁)的混响的动力学进行建模。图17A中示出了来自血管(通过血管的近端壁但是排除远端壁)的回波的空间-时间图。该图像示出来自一个图像线(接近图像的中心处)的RF数据的包络。这被称为M模式超声并且其允许对心脏和脉管成像应用中壁运动的分析。Approximately 1.9 seconds (642 frames) of data were acquired, capturing more than 3 heart cycles to allow modeling of the dynamics of echoes and reverberation from vessels (mainly due to the proximal wall). A space-time diagram of echoes from a vessel (through the proximal wall of the vessel but excluding the distal wall) is shown in Figure 17A. The image shows the envelope of RF data from one image line (near the center of the image). This is known as M-mode ultrasound and it allows the analysis of wall motion in cardiac and vascular imaging applications.
图17B示出在获取周期仅来自近端壁的回波的M模式图像。该图像图示在心搏周期期间壁回波的动力学。例如,对于前几条线(0<t<0:1s),壁仅表示镜面反射器。另一方面,当壁经受因血管中压力变化而引起的膨胀时,壁回波看起来较不规则。图17A中示出对血管包络进行检查,可以看到向血管中下至约4mm的强混响模式。该模式掩盖来自血液的任何散射并且使得它难以(如果不是不可能的话)估计血管内大区域中的流速矢量。Figure 17B shows an M-mode image of echoes from the proximal wall only during the acquisition period. This image illustrates the dynamics of the wall echo during the heart cycle. For example, for the first few lines (0<t <0:1s), the walls simply represent specular reflectors. On the other hand, wall echoes appear less regular when the wall undergoes expansion due to pressure changes in the blood vessel. Examination of the vessel envelope is shown in Figure 17A, and a strongly reverberant mode down to about 4 mm into the vessel can be seen. This mode masks any scatter from the blood and makes it difficult, if not impossible, to estimate the flow velocity vector in large regions within the vessel.
图18A-18B示出与图17A-17B中示出的M模式图像相对应的来自包括近端壁(图18A-长程相关)和仅近端壁(图18B-短程相关)的血管的复包络的归一化相关函数的空间-时间图。可以看到,当管壁没有被拉伸且相当于镜面反射器时强次峰在
图19A-19D图示通过所提出的最大似然算法获得的去混响滤波器的性能。使用短程和长程相关数据,对于两个帧(在t=0.003s处的帧1和在t=0.31sec处的帧100)滤波器阶数被确定成21。使用

来自对健康志愿者的脉管成像实验的结果表明了因为混响分量在心搏周期期间的时变性质而使用时变反去混响滤波器来对来自血管的回波数据进行去混响是可行的。这种滤波可能用于使用斑点追踪(例如二维斑点追踪)方法的更准确血管矢量速度估计。示例性算法是鲁棒且计算高效的,并且需要最少的训练来使其非常好地适合于实时超声成像应用。Results from vascular imaging experiments on healthy volunteers demonstrate that it is feasible to use a time-varying inverse dereverberation filter to dereverberate echo data from blood vessels due to the time-varying nature of the reverberation component during the heart cycle of. Such filtering may be used for more accurate vessel vector velocity estimation using speckle tracking (eg 2D speckle tracking) methods. The exemplary algorithm is robust and computationally efficient, and requires minimal training making it well suited for real-time ultrasound imaging applications.
下面提供了脉管成像以及管壁动力学特征的一个或多个实施方式以及测试其的示例,诸如这里一般性地描述的那些。不应将此类具体实施方式或示例视作对本公开的限制。Provided below are one or more embodiments and examples of testing vessel imaging and vessel wall dynamics, such as those generally described herein. Such specific embodiments or examples should not be considered limitations of the present disclosure.
一般来说,说明了一种以轴向方向和横向方向上的子采样精度对组织运动和流进行同时成像的方法。该方法利用相位耦合2D斑点追踪方法,其采用真实2D复互相关来找到在轴向方向和横向方向上的子帧位移。已经对Sonix RP上的成像序列进行了修改以允许在覆盖感兴趣区域的有限视场中高帧速率2D数据收集(M2D模式)。连同鲁棒2D斑点追踪方法,M2D成像允许捕获流和壁/组织运动的完全动力学,甚至当流主要处于横向方向上(相对于成像波束)时。示出在轴向方向和横向方向上的精细矢量位移估计以允许利用最小滤波的平滑且相接的应变和剪切应变计算。通过来自健康志愿者颈动脉的活体图像和流仿真(ATS 模型524)的实验结果表明位移和应变场的质量。该结果表明矢量流场和壁/组织运动的同时成像以及以高空间和时间采样的对应应变。这可以提供建模血液和血管之间的流-固相互作用的必要工具。In general, a method for simultaneous imaging of tissue motion and flow with subsampling precision in both axial and transverse directions is described. The method utilizes a phase-coupled 2D speckle tracking method that employs real 2D complex cross-correlation to find subframe displacements in axial and lateral directions. The imaging sequence on the Sonix RP has been modified to allow high frame rate 2D data collection (M2D mode) in a limited field of view covering the region of interest. Together with robust 2D speckle tracking methods, M2D imaging allows capturing the full dynamics of flow and wall/tissue motion, even when the flow is predominantly in the lateral direction (relative to the imaging beam). Refined vector displacement estimates in the axial and transverse directions are shown to allow smooth and contiguous strain and shear strain calculations with minimal filtering. The quality of the displacement and strain fields is demonstrated by experimental results from in vivo images and flow simulations (ATS model 524) of the carotid arteries of healthy volunteers. The results demonstrate simultaneous imaging of vector flow fields and wall/tissue motion with corresponding strains sampled in high space and time. This can provide the necessary tools for modeling fluid-solid interactions between blood and blood vessels.
示例性成像方法的资料和方法。Materials and Methods for Exemplary Imaging Methods .
在Ebbini 206中描述了所使用的相位耦合的2D斑点追踪(相位耦合的2D斑点追踪算法)并且这里也至少部分地对其进行了描述。斑点追踪方法基于搜索区域中2D复相关性的幅度和相位的梯度。该方法将相关性峰值附近的相位和幅度梯度相联系以便在轴向方向和横向方向二者上以子采样精度确定其坐标。这利用根据在采样的(横向插值的)2D互相关性网格上幅度和相位梯度矢量之间的角度确定的最低级别横向插值来实现。该算法后的一个结果是幅度梯度矢量对真实峰值的最终逼近与零相位等值线正交。这导致零相位等值线上的2D鲁棒投影,其导致插值级别处的子采样精度完全低于使用先前提出的方法所需的精度。示出了使用相位耦合技术获得的所估计的2D矢量位移场展示了覆盖动力学范围的整个范围的值而无需量化证明。相比而言,先前公开的在横向插值之后使用1D相位投影的方法产生严格量化的横向位移场(处于与2D相位耦合方法相同的插值级别)。The phase-coupled 2D speckle tracking used (phase-coupled 2D speckle tracking algorithm) is described in Ebbini 206 and is also at least partially described here. The speckle tracking method is based on gradients of magnitude and phase of 2D complex correlations in the search region. This method relates the phase and magnitude gradients around the correlation peak to determine its coordinates with sub-sampling accuracy in both the axial and transverse directions. This is achieved using the lowest level lateral interpolation determined from the angle between the magnitude and phase gradient vectors on the sampled (transversely interpolated) 2D cross-correlation grid. A consequence of this algorithm is that the final approximation of the magnitude gradient vector to the true peak is orthogonal to the zero-phase contour. This results in a 2D robust projection on the zero-phase contour, which results in a subsampling accuracy at the interpolation level that is completely lower than that required using previously proposed methods. It is shown that the estimated 2D vector displacement field obtained using the phase coupling technique exhibits a whole range of values covering the dynamic range without quantitative proof. In contrast, previously published methods using 1D phase projection after lateral interpolation yield strictly quantized lateral displacement fields (at the same level of interpolation as 2D phase-coupling methods).
数据获取:使用将加载有用于M2D脉冲回波数据收集的程序的Sonix RP(Ultrasonix, Canada)超声扫描仪。然后通过吉比特互联网将所收集的数据流水线到控制器PC以便进行实时数据处理。数据处理计算机可以通过利用多核GPU(nVIDIA, Santa Clara, CA)容易地来应对高分辨率(空间和时间)斑点追踪和可分离的2D后置滤波所需的密集计算。线性阵列探头(LA14-5/38)被用来获取该文章中示出的所有数据。探头上的发射脉冲的中心频率是7.5MHz。Data Acquisition: A Sonix RP (Ultrasonix, Canada) ultrasound scanner will be loaded with a program for M2D pulse-echo data collection. The collected data is then pipelined over the Gigabit Internet to the controller PC for real-time data processing. The data-processing computer can easily cope with the intensive computation required for high-resolution (spatial and temporal) speckle tracking and separable 2D post-filtering by utilizing a multi-core GPU (nVIDIA, Santa Clara, CA). A linear array probe (LA14-5/38) was used to acquire all data shown in this article. The center frequency of the transmit pulse on the probe is 7.5MHz.
使用ATS模型524流仿真和Cole-Parmer MasterFlex滚压式泵进行实验以说明轴向和横向方向上的位移追踪。使用Sonix RP扫描仪以111fps的帧速率来收集M2D数据。在利用MasterFlex泵的适当速度设置的受控流体流量下收集ATS仿真中4mm流通道的图像以模拟颈动脉中的典型血流速率(例如336ml/min)。纤维素微球被稀释到水中以在数据收集期间产生来自流通道的线性散射(事实上纯水也被成像为确定通道边界的控制)。Experiments were performed using an ATS Model 524 flow simulation and a Cole-Parmer MasterFlex roller pump to illustrate displacement tracking in the axial and transverse directions. M2D data was collected using a Sonix RP scanner at a frame rate of 111fps. Images of the 4mm flow channel in the ATS simulation were collected at controlled fluid flow rates with the appropriate speed settings of the MasterFlex pump to simulate typical blood flow rates in the carotid artery (eg, 336ml/min). Cellulose microspheres were diluted into water to generate linear scattering from the flow channel during data collection (in fact pure water was also imaged as a control to determine channel boundaries).
应变计算:通过对使用2D斑点追踪算法获得的轴向和横向位移场使用MATLAB的梯度命令来执行应变和剪切应变计算。该应变和剪切应变计算之后是大小为3 3且标准差为1的简单高斯低通滤波器,即应变和剪切应变场的最小后置滤波。Strain calculations: Strain and shear strain calculations were performed by using MATLAB's gradient command on the axial and transverse displacement fields obtained using the 2D speckle tracking algorithm. This strain and shear strain calculation is followed by a simple Gaussian low-pass filter of magnitude 33 and
关于示例性成像方法的结果和讨论。Results and Discussion on Exemplary Imaging Methods .
示例性仿真结果。Exemplary simulation results.
在通道轴垂直于波束轴(即横向流)的情况下使用LA14-5探头来对4mm流通道进行成像。在图8A-8B和图9A-9B中示出结果得到的应变和剪切应变场的典型示例。图8A-8B分别示出4mm流通道纵向壁的轴向应变和轴向剪切应变。图9A-9B分别示出4mm流通道纵向壁的横向应变和横向剪切应变。可以看到表明位移场的表现良好的性质的平滑应变场。同时,可以认识到通道和周围仿组织材料之间的清楚划分。A LA14-5 probe was used to image a 4 mm flow channel with the channel axis perpendicular to the beam axis (ie, transverse flow). Typical examples of the resulting strain and shear strain fields are shown in FIGS. 8A-8B and 9A-9B . 8A-8B show the axial strain and axial shear strain, respectively, of the longitudinal wall of a 4 mm flow channel. Figures 9A-9B show the transverse strain and transverse shear strain, respectively, of the longitudinal wall of a 4 mm flow channel. A smooth strain field can be seen indicating the well-behaved nature of the displacement field. At the same time, a clear division between the channel and the surrounding tissue-mimicking material can be recognized.
由图10中的结果图示所估计的矢量流场的动力学,该图10示出对于若干个泵操作循环(即在ATS仿真中4mm流通道内)的(从由所追踪的通道壁位移计算的通道壁处的轴向分量获得的)周期性通道直径(虚线)和通道中对应平均横向流速(实线)的图。结果清楚地示出所观察流速的准周期性性质以及直径(通道中的压力)和流量之间的相位关系。要注意,流速中的小的负分量就在直径达到其最大值(即通道中的最小压力)之后出现。通道中流体的该“倒退”容易在B模式影像中观察到,但是壁运动更不明显地多(<150mm)并且仅在轴向位移场中看到。The dynamics of the estimated vector flow field is illustrated by the results in Figure 10, which shows the dynamics of the estimated vector flow field (calculated from the channel wall displacements tracked by A plot of the periodic channel diameter (dashed line) and the corresponding mean transverse flow velocity in the channel (solid line), obtained for the axial component at the channel wall. The results clearly show the quasi-periodic nature of the observed flow rates and the phase relationship between diameter (pressure in the channel) and flow. Note that the small negative component in the flow velocity occurs just after the diameter reaches its maximum value (ie the minimum pressure in the channel). This "back-off" of fluid in the channel is easily observed in B-mode imaging, but wall motion is much less pronounced (<150mm) and seen only in the axial displacement field.
图11图示横向流沿着成像束轴(在横向距离-3.2mm处)的动力学行为。可以看到,横向位移场的平滑、表现良好的性质与图10中示出的准周期性图案一致。要注意,对图11示出的结果进行微小处理,即流体和周围组织的矢量位移估计的连续性和高SNR是适当地应用相位耦合的2D斑点追踪方法的直接结果。Figure 11 illustrates the dynamics of lateral flow along the imaging beam axis (at a lateral distance of -3.2mm). It can be seen that the smooth, well-behaved nature of the lateral displacement field is consistent with the quasi-periodic pattern shown in FIG. 10 . Note that the minor processing of the results shown in Fig. 11, ie the continuity and high SNR of the vector displacement estimates for fluid and surrounding tissue, is a direct result of properly applying the phase-coupled 2D speckle tracking method.
活体实验。Live experiment .
使用LA14-5探头以111fps来对健康志愿者的颈动脉的分段进行了成像。如在该仿真情况中那样,轴向和横向位移场在整个感兴趣的区域上是相接的并且被允许计算图12A-12B和13A-13B中示出的应变和剪切应变场的计算。图12A-12B分别示出颈动脉纵向管壁的轴向应变和轴向剪切应变。图13A-13B分别示出颈动脉纵向管壁的横向应变和横向剪切应变。可以在轴向应变和横向剪切应变图像中看到血管和壁/血管周组织之间的清楚划分。此外,可以从轴向剪切应变和横向应变图像认识到脉动效应。这些结果表明矢量运动场(轴向和横向)的可靠估计以及它们在获得实际应变和剪切应变场中的效用。Segments of the carotid arteries of healthy volunteers were imaged using the LA14-5 probe at 111 fps. As in this simulated case, the axial and transverse displacement fields were contiguous across the region of interest and allowed calculation of the strain and shear strain fields shown in Figures 12A-12B and 13A-13B. 12A-12B illustrate axial strain and axial shear strain, respectively, of the longitudinal wall of a carotid artery. 13A-13B show transverse strain and transverse shear strain, respectively, of the longitudinal wall of a carotid artery. A clear delineation between vessels and wall/perivascular tissue can be seen in the axial strain and transverse shear strain images. Furthermore, pulsation effects can be recognized from the axial shear strain and transverse strain images. These results demonstrate reliable estimation of vector motion fields (axial and transverse) and their utility in obtaining real strain and shear strain fields.
最后,我们示出健康志愿者的颈动脉周围的应变场的横截面视图。在图14A-14B以及图15A-15B中分别示出轴向和横向方向上的应变和剪切应变。图14A-14B分别示出颈动脉横截面管壁的轴向应变和轴向剪切应变。图15A-15B分别示出颈动脉横截面管壁的横向应变和横向剪切应变。检查图14A-14B,可以观察到轴向方向上的运动在壁处产生轴向方向上的应变(图14A)以及横向方向的剪切分量(图14B)。在这种情况下应变的方向描绘扩张的血管。类似地,横向方向上的运动产生横向方向上的应变(图15A)以及轴向方向的剪切分量(如图15B中那样)。应变和剪切应变场的影像已清楚地示出壁运动的动力学(这在本申请中不可存在)。除了壁动力学之外,应变图像提供了一种识别血管在轴向方向和横向方向上的边界的工具。通常难以从B模式图像确定血管在轴向方向和横向方向上的边界。Finally, we show a cross-sectional view of the strain field around the carotid artery of healthy volunteers. Strain and shear strain in the axial and transverse directions are shown in FIGS. 14A-14B and 15A-15B , respectively. 14A-14B show the axial strain and axial shear strain, respectively, of the wall of a carotid artery cross-section. 15A-15B show transverse strain and transverse shear strain, respectively, of the wall of a carotid artery cross-section. Examining FIGS. 14A-14B , it can be observed that motion in the axial direction produces a strain in the axial direction ( FIG. 14A ) and a shear component in the transverse direction ( FIG. 14B ) at the wall. The direction of the strain in this case depicts the dilated vessel. Similarly, motion in the transverse direction produces strain in the transverse direction (Figure 15A) and a shear component in the axial direction (as in Figure 15B). Imaging of strain and shear strain fields has clearly shown the dynamics of wall motion (which could not exist in this application). In addition to wall dynamics, strain images provide a tool to identify the boundaries of blood vessels in the axial and transverse directions. It is often difficult to determine the boundaries of vessels in the axial and transverse directions from B-mode images.
作为该示例的结果,健康志愿者的颈动脉活体成像和流仿真已经在实验上表明一种用于对流通道附近的应变场和位移进行成像的方法。结果示出,在足够高帧速率的情况下,斑点追踪方法产生了对通道中的流量和组织运动二者的表现良好的位移估计。这些位移场非常适合于利用最小滤波的应变和剪切应变计算。此外,已经表明在该仿真实验中流速和压力的时间波形遵循滚压式泵的周期性运动。此外,通道中轴向壁位移(指示压力)和平均横向流速具有清楚的相位关系。这指示所使用的方法在获得适合于用于脉管力学的固流界面建模的全动力学运动场中是有用的。As a result of this example, in vivo imaging of carotid arteries in healthy volunteers and flow simulations have experimentally demonstrated a method for imaging strain fields and displacements in the vicinity of flow channels. The results show that, at sufficiently high frame rates, the speckle tracking method produces well-behaved displacement estimates for both flow and tissue motion in the channel. These displacement fields are well suited for strain and shear strain calculations with minimal filtering. Furthermore, it has been shown that the time waveforms of flow velocity and pressure follow the periodic motion of the roller pump in this simulation experiment. Furthermore, there is a clear phase relationship between the axial wall displacement (indicative of pressure) and the mean lateral flow velocity in the channel. This indicates that the method used is useful in obtaining fully dynamic motion fields suitable for solid-fluid interface modeling for vascular mechanics.
已经整体合并所有专利、专利文档以及这里引用的参考文献,就像单独合并每一个一样。已经参考说明性实施例提供了本公开,并且不意味着以限制的意义来解释本公开。如先前所述的那样,本领域技术人员将会认识到其他各种说明性应用可以使用这里描述的技术以便利用这里所述的装置和方法的有益特征。参考该说明之后,说明性实施例的各种修改以及本公开的附加实施例将变得显而易见。All patents, patent documents, and references cited herein are incorporated in their entirety as if each were individually incorporated. This disclosure has been provided with reference to illustrative embodiments and is not meant to be construed in a limiting sense. As previously stated, those skilled in the art will recognize a variety of other illustrative applications that may use the techniques described herein in order to take advantage of the beneficial features of the apparatus and methods described herein. Various modifications of the illustrative embodiments, as well as additional embodiments of the disclosure, will become apparent upon reference to the description.
Claims (52)
Applications Claiming Priority (3)
| Application Number | Priority Date | Filing Date | Title |
|---|---|---|---|
| US201161475550P | 2011-04-14 | 2011-04-14 | |
| US61/475550 | 2011-04-14 | ||
| PCT/US2012/033584WO2012142455A2 (en) | 2011-04-14 | 2012-04-13 | Vascular characterization using ultrasound imaging |
Publications (2)
| Publication Number | Publication Date |
|---|---|
| CN103747742Atrue CN103747742A (en) | 2014-04-23 |
| CN103747742B CN103747742B (en) | 2016-04-06 |
Family
ID=45976565
Family Applications (1)
| Application Number | Title | Priority Date | Filing Date |
|---|---|---|---|
| CN201280028868.1AActiveCN103747742B (en) | 2011-04-14 | 2012-04-13 | Use the vascular characterization of ultra sonic imaging |
Country Status (8)
| Country | Link |
|---|---|
| US (2) | US9610061B2 (en) |
| EP (2) | EP2696771B8 (en) |
| KR (1) | KR102006035B1 (en) |
| CN (1) | CN103747742B (en) |
| AU (1) | AU2012242639B2 (en) |
| CA (1) | CA2832689A1 (en) |
| IL (1) | IL228703B (en) |
| WO (1) | WO2012142455A2 (en) |
Cited By (15)
| Publication number | Priority date | Publication date | Assignee | Title |
|---|---|---|---|---|
| WO2016106959A1 (en)* | 2014-12-30 | 2016-07-07 | 华中科技大学 | Multi-parameter model guided-method for iteratively extracting movement parameter of angiography image of blood vessel |
| CN109661684A (en)* | 2016-09-06 | 2019-04-19 | 苏黎世联合高等工业学校 | Ray-tracing procedure for real interactive ultrasonic simulation |
| CN111728642A (en)* | 2017-06-06 | 2020-10-02 | 深圳迈瑞生物医疗电子股份有限公司 | Method, device and system for imaging in ultrasonic scanning |
| CN112168210A (en)* | 2019-07-03 | 2021-01-05 | 深圳迈瑞生物医疗电子股份有限公司 | Medical image processing terminal, ultrasonic diagnostic equipment and fetal image processing method |
| CN112244887A (en)* | 2019-07-06 | 2021-01-22 | 西南林业大学 | Carotid artery vessel wall motion trajectory extraction device and method based on B-ultrasonic image |
| CN112345646A (en)* | 2020-10-30 | 2021-02-09 | 安徽理工大学 | Method for reconstructing microdefect in slender rod |
| CN113768533A (en)* | 2020-06-10 | 2021-12-10 | 无锡祥生医疗科技股份有限公司 | Ultrasonic developing apparatus and ultrasonic developing method |
| CN113967036A (en)* | 2017-04-28 | 2022-01-25 | 深圳迈瑞生物医疗电子股份有限公司 | Ultrasonic imaging device and method for detecting vascular wall shear index by utilizing ultrasonic |
| CN114098817A (en)* | 2021-11-18 | 2022-03-01 | 西安建筑科技大学 | High frame rate ultrasonic image blood vessel wall motion detail tracking method, system, equipment and readable storage medium |
| CN114642449A (en)* | 2020-12-18 | 2022-06-21 | 深圳迈瑞生物医疗电子股份有限公司 | Blood flow imaging method and ultrasound imaging device |
| CN114680817A (en)* | 2020-12-29 | 2022-07-01 | 深圳开立生物医疗科技股份有限公司 | Intraluminal image reconstruction method, device, equipment and storage medium |
| CN114847889A (en)* | 2022-04-20 | 2022-08-05 | 河南省肿瘤医院 | Pulse reproduction method, device, storage medium, terminal equipment and system |
| CN116936033A (en)* | 2023-09-18 | 2023-10-24 | 海杰亚(北京)医疗器械有限公司 | Percutaneous ablation operation planning method, percutaneous ablation operation planning device, percutaneous ablation operation planning medium and percutaneous ablation operation planning equipment |
| RU2825826C1 (en)* | 2023-08-31 | 2024-08-30 | Государственное бюджетное учреждение здравоохранения города Москвы Научно-практический клинический центр диагностики и телемедицинских технологий Департамента здравоохранения города Москвы" (ГБУЗ "НПКЦ ДиТ ДЗМ") | Method of detecting blood flow signals during ultrasonic imaging |
| CN120392039A (en)* | 2025-07-03 | 2025-08-01 | 北京紫云智能科技有限公司 | Traumatic bleeding detection method and system based on infrared thermal imaging and ultrasound multimodality |
Families Citing this family (77)
| Publication number | Priority date | Publication date | Assignee | Title |
|---|---|---|---|---|
| ES2465915T3 (en) | 2007-11-26 | 2014-06-09 | C.R. Bard, Inc. | Integrated system for intravascular catheter placement |
| US9521961B2 (en) | 2007-11-26 | 2016-12-20 | C. R. Bard, Inc. | Systems and methods for guiding a medical instrument |
| US8781555B2 (en) | 2007-11-26 | 2014-07-15 | C. R. Bard, Inc. | System for placement of a catheter including a signal-generating stylet |
| US9532724B2 (en) | 2009-06-12 | 2017-01-03 | Bard Access Systems, Inc. | Apparatus and method for catheter navigation using endovascular energy mapping |
| EP2912999B1 (en) | 2010-05-28 | 2022-06-29 | C. R. Bard, Inc. | Apparatus for use with needle insertion guidance system |
| WO2011156624A2 (en) | 2010-06-09 | 2011-12-15 | Regents Of The University Of Minnesota | Dual mode ultrasound transducer (dmut) system and method for controlling delivery of ultrasound therapy |
| KR101906838B1 (en) | 2010-10-13 | 2018-10-11 | 마우이 이미징, 인코포레이티드 | Concave ultrasound transducers and 3d arrays |
| AU2012242639B2 (en) | 2011-04-14 | 2016-09-01 | Regents Of The University Of Minnesota | Vascular characterization using ultrasound imaging |
| JP6438769B2 (en) | 2012-02-21 | 2018-12-19 | マウイ イマギング,インコーポレーテッド | Determination of material hardness using multiple aperture ultrasound. |
| WO2013148673A1 (en) | 2012-03-26 | 2013-10-03 | Maui Imaging, Inc. | Systems and methods for improving ultrasound image quality by applying weighting factors |
| JP6270843B2 (en) | 2012-08-10 | 2018-01-31 | マウイ イマギング,インコーポレーテッド | Calibration of multiple aperture ultrasonic probes |
| US20140064513A1 (en) | 2012-09-06 | 2014-03-06 | MUSIC Group IP Ltd. | System and method for remotely controlling audio equipment |
| EP2919658B1 (en)* | 2012-11-19 | 2024-03-20 | Lightlab Imaging, Inc. | Interface devices, systems and methods for multimodal probes |
| US9259287B2 (en)* | 2013-04-02 | 2016-02-16 | Siemens Aktiengesellschaft | Patient specific planning and simulation of ablative procedures |
| WO2014200417A1 (en)* | 2013-06-10 | 2014-12-18 | Medscienta Ab | Method and system for determining a property of a non-homogeneous material |
| CN105793729B (en) | 2013-07-23 | 2018-07-31 | 明尼苏达大学评议会 | Ultrasound image formation and/or reconstruction using multi-frequency waveforms |
| US9883848B2 (en) | 2013-09-13 | 2018-02-06 | Maui Imaging, Inc. | Ultrasound imaging using apparent point-source transmit transducer |
| US10390796B2 (en)* | 2013-12-04 | 2019-08-27 | Siemens Medical Solutions Usa, Inc. | Motion correction in three-dimensional elasticity ultrasound imaging |
| WO2015109121A1 (en) | 2014-01-15 | 2015-07-23 | The Regents Of The University Of California | Physical deformable lung phantom with subject specific elasticity |
| US20150216500A1 (en)* | 2014-01-31 | 2015-08-06 | Seiko Epson Corporation | Ultrasonic measurement apparatus and ultrasonic measurement method |
| CN106030657B (en)* | 2014-02-19 | 2019-06-28 | 皇家飞利浦有限公司 | Motion-adaptive visualization in medical 4D imaging |
| US10492763B2 (en) | 2014-04-23 | 2019-12-03 | Exact Imaging Inc. | Medical image processing systems and methods thereof |
| CN106794007B (en) | 2014-08-18 | 2021-03-09 | 毛伊图像公司 | Network-based ultrasound imaging system |
| EP3243442B1 (en)* | 2015-01-08 | 2020-11-11 | FUJIFILM Corporation | Photoacoustic measuring device and photoacoustic measuring system |
| KR102387708B1 (en) | 2015-01-30 | 2022-04-19 | 삼성메디슨 주식회사 | Ultrasound System And Method For Providing Guide To Improve HPRF Doppler Image |
| KR102681141B1 (en) | 2015-03-30 | 2024-07-02 | 마우이 이미징, 인코포레이티드 | Ultrasonic imaging systems and methods for detecting object motion |
| JP6266160B2 (en) | 2015-04-03 | 2018-01-24 | コーニンクレッカ フィリップス エヌ ヴェKoninklijke Philips N.V. | Ultrasound system and method for identifying blood vessels |
| WO2017027789A1 (en)* | 2015-08-12 | 2017-02-16 | Sonectics Ultrasound, Inc. | Method and system for measuring pressure using ultrasound |
| CN105233429A (en)* | 2015-11-10 | 2016-01-13 | 中国科学院深圳先进技术研究院 | Method and system for carrying out automatic tracking and positioning as well as real-time intelligent stimulation on target object on the basis of ultrasound imaging |
| JP6597410B2 (en)* | 2016-03-04 | 2019-10-30 | セイコーエプソン株式会社 | Biological information measuring device and biological information measuring method |
| GB201604873D0 (en) | 2016-03-22 | 2016-05-04 | Imp Innovations Ltd | Fluid flow analysis |
| US11020563B2 (en) | 2016-07-14 | 2021-06-01 | C. R. Bard, Inc. | Automated catheter-to-vessel size comparison tool and related methods |
| WO2018050817A1 (en)* | 2016-09-16 | 2018-03-22 | Institut National De La Sante Et De La Recherche Medicale (Inserm) | Method for imaging a sample with blood and associated devices |
| US10692188B2 (en)* | 2016-12-03 | 2020-06-23 | Tose'e Sanaye Tasvirbardari Parto Negar Persia Company Ltd. | Peak detection in a two dimensional image |
| US10152798B2 (en)* | 2017-04-10 | 2018-12-11 | Wisconsin Alumni Research Foundation | Systems, methods and, media for determining object motion in three dimensions using speckle images |
| US11398023B2 (en)* | 2017-05-04 | 2022-07-26 | Koninklijke Philips N.V. | System and method for concurrent visualization and quantification of wall shear stress in blood vessels |
| US11701092B2 (en)* | 2017-05-10 | 2023-07-18 | Regents Of The University Of Michigan | Automated ultrasound apparatus and methods to non-invasively monitor fluid responsiveness |
| EP3431005A1 (en)* | 2017-07-19 | 2019-01-23 | Koninklijke Philips N.V. | Inflammation estimation from x-ray image data |
| US11317873B2 (en) | 2017-08-16 | 2022-05-03 | Seiko Epson Corporation | Biological analysis device, biological analysis method, and program |
| US11116414B2 (en) | 2017-08-16 | 2021-09-14 | Seiko Epson Corporation | Biological analysis device, biological analysis method, and program |
| US11253205B2 (en) | 2017-08-16 | 2022-02-22 | Seiko Epson Corporation | Pulse pressure and blood pressure analysis device, pulse pressure and blood pressure analysis method, and program |
| JP7087301B2 (en)* | 2017-08-16 | 2022-06-21 | セイコーエプソン株式会社 | Bioanalyzers, bioanalysis methods and programs |
| ES2951074T3 (en)* | 2017-09-23 | 2023-10-17 | Amid S R L | Method and device for cardiac electrical synchronization |
| US11458337B2 (en) | 2017-11-28 | 2022-10-04 | Regents Of The University Of Minnesota | Adaptive refocusing of ultrasound transducer arrays using image data |
| EP3505059B1 (en)* | 2017-12-28 | 2025-08-27 | Leica Instruments (Singapore) Pte. Ltd. | Apparatus and method for measuring blood flow direction using a fluorophore |
| US11596812B2 (en) | 2018-04-06 | 2023-03-07 | Regents Of The University Of Minnesota | Wearable transcranial dual-mode ultrasound transducers for neuromodulation |
| US11647989B2 (en)* | 2018-09-11 | 2023-05-16 | Philips Image Guided Therapy Corporation | Devices, systems, and methods for multimodal ultrasound imaging |
| US10992079B2 (en) | 2018-10-16 | 2021-04-27 | Bard Access Systems, Inc. | Safety-equipped connection systems and methods thereof for establishing electrical connections |
| US12105052B2 (en)* | 2018-11-09 | 2024-10-01 | Georgia Tech Research Corporation | Systems and methods for ultrasound imaging and focusing |
| EP3685756A1 (en)* | 2019-01-24 | 2020-07-29 | Koninklijke Philips N.V. | Methods and systems for investigating blood vessel characteristics |
| US11759166B2 (en) | 2019-09-20 | 2023-09-19 | Bard Access Systems, Inc. | Automatic vessel detection tools and methods |
| US11497465B2 (en)* | 2019-10-25 | 2022-11-15 | Bard Peripheral Vascular, Inc. | Method for treatment of a vascular lesion |
| KR20220007999A (en) | 2020-07-13 | 2022-01-20 | 삼성전자주식회사 | Electronic device including ultrasonic device and method for obtaining ppg signal thereof |
| US11877810B2 (en) | 2020-07-21 | 2024-01-23 | Bard Access Systems, Inc. | System, method and apparatus for magnetic tracking of ultrasound probe and generation of 3D visualization thereof |
| EP4185209A1 (en) | 2020-08-04 | 2023-05-31 | Bard Access Systems, Inc. | System and method for optimized medical component insertion monitoring and imaging enhancement |
| WO2022035760A1 (en) | 2020-08-10 | 2022-02-17 | Bard Access Systems, Inc. | System and method for generating vessel representations in mixed reality/virtual reality |
| US11890139B2 (en) | 2020-09-03 | 2024-02-06 | Bard Access Systems, Inc. | Portable ultrasound systems |
| US11992363B2 (en) | 2020-09-08 | 2024-05-28 | Bard Access Systems, Inc. | Dynamically adjusting ultrasound-imaging systems and methods thereof |
| EP4188230B1 (en)* | 2020-09-09 | 2025-06-25 | Becton, Dickinson and Company | Apparatus and method for tracking blood vessel cross-section |
| CN216257185U (en) | 2020-09-10 | 2022-04-12 | 巴德阿克塞斯系统股份有限公司 | Ultrasound Probes and Ultrasound Systems |
| WO2022067101A1 (en) | 2020-09-25 | 2022-03-31 | Bard Access Systems, Inc. | Minimum catheter length tool |
| WO2022072727A2 (en) | 2020-10-02 | 2022-04-07 | Bard Access Systems, Inc. | Ultrasound systems and methods for sustained spatial attention |
| EP4228516A1 (en) | 2020-10-15 | 2023-08-23 | Bard Access Systems, Inc. | Ultrasound imaging system for generation of a three-dimensional ultrasound image |
| KR102561391B1 (en)* | 2020-10-21 | 2023-07-31 | 국립암센터 | Method for analyzing ultrasound data obtained from multiple layers |
| KR20230124893A (en)* | 2020-10-21 | 2023-08-28 | 마우이 이미징, 인코포레이티드 | Systems and methods for tissue characterization using multi-aperture ultrasound |
| CN216933458U (en) | 2020-11-24 | 2022-07-12 | 巴德阿克塞斯系统股份有限公司 | Object recognition and needle guidance system |
| CN114569155A (en) | 2020-12-01 | 2022-06-03 | 巴德阿克塞斯系统股份有限公司 | Ultrasound imaging system and method for obtaining ultrasound image by the same |
| CN114569156A (en) | 2020-12-01 | 2022-06-03 | 巴德阿克塞斯系统股份有限公司 | Ultrasound imaging system and method for identifying one or more of a plurality of blood vessels |
| EP4258997A1 (en) | 2020-12-14 | 2023-10-18 | Bard Access Systems, Inc. | Securement of hands-free ultrasound probe |
| CN217960146U (en) | 2021-04-15 | 2022-12-06 | 巴德阿克塞斯系统股份有限公司 | Ultrasound imaging system |
| CN116058873A (en) | 2021-11-03 | 2023-05-05 | 巴德阿克塞斯系统股份有限公司 | Interoperation optimization function through Doppler and image-based vessel discrimination |
| US12433567B2 (en) | 2022-03-16 | 2025-10-07 | Bard Access Systems, Inc. | Ultrasound imaging system |
| US12102481B2 (en) | 2022-06-03 | 2024-10-01 | Bard Access Systems, Inc. | Ultrasound probe with smart accessory |
| US20240009486A1 (en)* | 2022-07-06 | 2024-01-11 | X Development Llc | Quantitative method for target and dose tracking in response to transcranial neuro-modulation |
| US12137989B2 (en) | 2022-07-08 | 2024-11-12 | Bard Access Systems, Inc. | Systems and methods for intelligent ultrasound probe guidance |
| CN115192137A (en)* | 2022-07-21 | 2022-10-18 | 无锡贝恩外科器械有限公司 | Ultrasonic operation system capable of identifying blood vessels |
| WO2025043022A1 (en)* | 2023-08-21 | 2025-02-27 | The University Of North Carolina At Chapel Hill | Methods, systems, and computer readable media for using acoustic radiation force impulse (arfi) ultrasound to evaluate quality of stored blood |
Citations (4)
| Publication number | Priority date | Publication date | Assignee | Title |
|---|---|---|---|---|
| CN101179998A (en)* | 2005-05-20 | 2008-05-14 | 株式会社日立医药 | Image diagnosis apparatus |
| US20080221448A1 (en)* | 2007-03-07 | 2008-09-11 | Khuri-Yakub Butrus T | Image-guided delivery of therapeutic tools duing minimally invasive surgeries and interventions |
| CN101563626A (en)* | 2006-11-03 | 2009-10-21 | 皇家飞利浦电子股份有限公司 | Dual-path processing for optimal speckle tracking |
| US7686764B2 (en)* | 2003-06-25 | 2010-03-30 | Panasonic Corporation | Ultrasound diagnostic apparatus for calculating positions to determine IMT and lumen boundaries |
Family Cites Families (71)
| Publication number | Priority date | Publication date | Assignee | Title |
|---|---|---|---|---|
| JPH02268727A (en)* | 1989-04-10 | 1990-11-02 | Kowa Co | Ophthalmological measurement method and device |
| DE19581718T5 (en) | 1994-08-05 | 2013-11-07 | Siemens Medical Solutions USA, Inc. (n.d. Ges. d. Staates Delaware) | Method and apparatus for transmit beamformer system |
| US5694936A (en) | 1994-09-17 | 1997-12-09 | Kabushiki Kaisha Toshiba | Ultrasonic apparatus for thermotherapy with variable frequency for suppressing cavitation |
| US5906580A (en) | 1997-05-05 | 1999-05-25 | Creare Inc. | Ultrasound system and method of administering ultrasound including a plurality of multi-layer transducer elements |
| US6547731B1 (en) | 1998-05-05 | 2003-04-15 | Cornell Research Foundation, Inc. | Method for assessing blood flow and apparatus thereof |
| US6511426B1 (en) | 1998-06-02 | 2003-01-28 | Acuson Corporation | Medical diagnostic ultrasound system and method for versatile processing |
| WO2000057495A1 (en) | 1999-03-22 | 2000-09-28 | Transurgical, Inc. | Ultrasonic transducer, transducer array, and fabrication method |
| US20040015079A1 (en) | 1999-06-22 | 2004-01-22 | Teratech Corporation | Ultrasound probe with integrated electronics |
| JP2003513691A (en) | 1999-10-25 | 2003-04-15 | シーラス、コーポレイション | Use of focused ultrasound to seal blood vessels |
| US6618493B1 (en)* | 1999-11-26 | 2003-09-09 | Ge Medical Systems Global Technology Company, Llc | Method and apparatus for visualization of motion in ultrasound flow imaging using packet data acquisition |
| US6277075B1 (en)* | 1999-11-26 | 2001-08-21 | Ge Medical Systems Global Technology Company, Llc | Method and apparatus for visualization of motion in ultrasound flow imaging using continuous data acquisition |
| DE60012305T2 (en)* | 1999-12-07 | 2005-08-18 | Koninklijke Philips Electronics N.V. | ULTRASONIC IMAGE PROCESSING SYSTEM AND SYSTEM FOR PRESENTING A COMPOSIT BILTH SEQUENCE OF A TYPE OF ARTERY |
| WO2001045550A2 (en) | 1999-12-23 | 2001-06-28 | Therus Corporation | Ultrasound transducers for imaging and therapy |
| US6508767B2 (en) | 2000-02-16 | 2003-01-21 | Koninklijke Philips Electronics N.V. | Ultrasonic harmonic image segmentation |
| US6454715B2 (en) | 2000-04-11 | 2002-09-24 | Scimed Life Systems, Inc. | Methods and apparatus for blood speckle detection in an intravascular ultrasound imaging system |
| US6318179B1 (en)* | 2000-06-20 | 2001-11-20 | Ge Medical Systems Global Technology Company, Llc | Ultrasound based quantitative motion measurement using speckle size estimation |
| US6540677B1 (en) | 2000-11-17 | 2003-04-01 | Bjorn A. J. Angelsen | Ultrasound transceiver system for remote operation through a minimal number of connecting wires |
| US6770031B2 (en) | 2000-12-15 | 2004-08-03 | Brigham And Women's Hospital, Inc. | Ultrasound therapy |
| AUPR534401A0 (en) | 2001-05-30 | 2001-06-21 | Sleishman, Donald Eric | Twin pedal assembly for a bass drum |
| US6494839B1 (en) | 2001-08-06 | 2002-12-17 | Koninklijke Philips Electronics N.V. | Ultrasonic diagnostic imaging system transmitter for sum and difference frequency imaging |
| US7819826B2 (en) | 2002-01-23 | 2010-10-26 | The Regents Of The University Of California | Implantable thermal treatment method and apparatus |
| US9592409B2 (en) | 2002-04-30 | 2017-03-14 | The Regents Of The University Of California | Methods for modifying electrical currents in neuronal circuits |
| US8086296B2 (en) | 2002-04-30 | 2011-12-27 | Brainsonix Corporation | Methods for modifying electrical currents in neuronal circuits |
| US6705993B2 (en) | 2002-05-10 | 2004-03-16 | Regents Of The University Of Minnesota | Ultrasound imaging system and method using non-linear post-beamforming filter |
| US6780182B2 (en) | 2002-05-23 | 2004-08-24 | Adiana, Inc. | Catheter placement detection system and operator interface |
| US7175599B2 (en) | 2003-04-17 | 2007-02-13 | Brigham And Women's Hospital, Inc. | Shear mode diagnostic ultrasound |
| US20050102009A1 (en) | 2003-07-31 | 2005-05-12 | Peter Costantino | Ultrasound treatment and imaging system |
| US20050070796A1 (en) | 2003-09-30 | 2005-03-31 | Fuji Photo Film Co., Ltd. | Ultrasonic diagnosing apparatus |
| US20050249667A1 (en) | 2004-03-24 | 2005-11-10 | Tuszynski Jack A | Process for treating a biological organism |
| US20080027320A1 (en) | 2004-05-18 | 2008-01-31 | Siemens Medical Solutions Usa, Inc. | Multidimensional transducer systems and methods for intra patient probes |
| US20050267453A1 (en) | 2004-05-27 | 2005-12-01 | Wong Serena H | High intensity focused ultrasound for imaging and treatment of arrhythmias |
| JP5107709B2 (en) | 2004-08-13 | 2012-12-26 | コーニンクレッカ フィリップス エレクトロニクス エヌ ヴィ | Adapting radiotherapy treatment plans |
| WO2006026459A2 (en) | 2004-08-26 | 2006-03-09 | Finsterwald P Michael | Biological cell acoustic enhancement and stimulation |
| JP5094402B2 (en) | 2004-10-06 | 2012-12-12 | ガイデッド セラピー システムズ, エル.エル.シー. | Method and system for ultrasonic tissue processing |
| JP5080989B2 (en) | 2005-02-23 | 2012-11-21 | コーニンクレッカ フィリップス エレクトロニクス エヌ ヴィ | Imaging of the object of interest |
| US20070016040A1 (en) | 2005-06-24 | 2007-01-18 | Henry Nita | Methods and apparatus for intracranial ultrasound delivery |
| US20070129652A1 (en) | 2005-11-15 | 2007-06-07 | Henry Nita | Methods and apparatus for intracranial ultrasound therapies |
| US8002705B1 (en) | 2005-07-22 | 2011-08-23 | Zonaire Medical Systems, Inc. | Continuous transmit focusing method and apparatus for ultrasound imaging system |
| US7621873B2 (en) | 2005-08-17 | 2009-11-24 | University Of Washington | Method and system to synchronize acoustic therapy with ultrasound imaging |
| CN101252970B (en) | 2005-08-30 | 2011-06-15 | 皇家飞利浦电子股份有限公司 | Combined Imaging and Therapy Transducer with Therapy Transducer Amplifier |
| EP1775752A3 (en) | 2005-10-15 | 2007-06-13 | Burth, Dirk, Dr. | Etching process for manufacturing an electron exit window |
| EP1952175B1 (en) | 2005-11-02 | 2013-01-09 | Visualsonics, Inc. | Digital transmit beamformer for an arrayed ultrasound transducer system |
| US7766833B2 (en) | 2005-11-23 | 2010-08-03 | General Electric Company | Ablation array having independently activated ablation elements |
| US20080015440A1 (en)* | 2006-07-13 | 2008-01-17 | The Regents Of The University Of Colorado | Echo particle image velocity (EPIV) and echo particle tracking velocimetry (EPTV) system and method |
| CN101754784B (en) | 2007-06-25 | 2013-11-20 | 国际心脏公司 | Image guided plaque ablation |
| US8197410B2 (en) | 2007-09-07 | 2012-06-12 | Kabushiki Kaisha Toshiba | Ultrasonic diagnostic apparatus, ultrasonic image processing apparatus and ultrasonic image processing method |
| US8235902B2 (en) | 2007-09-11 | 2012-08-07 | Focus Surgery, Inc. | System and method for tissue change monitoring during HIFU treatment |
| US20100274161A1 (en) | 2007-10-15 | 2010-10-28 | Slender Medical, Ltd. | Implosion techniques for ultrasound |
| KR20110091832A (en) | 2008-06-06 | 2011-08-12 | 얼테라, 인크 | Tissue Imaging and Treatment Systems |
| ES2736276T3 (en) | 2008-07-14 | 2019-12-27 | Arizona Board Of Regents For And On Behalf Of Arizona State Univ | Cellular activity modulation devices using ultrasound |
| US20100286520A1 (en) | 2009-05-11 | 2010-11-11 | General Electric Company | Ultrasound system and method to determine mechanical properties of a target region |
| CA2779842C (en) | 2009-11-04 | 2021-06-22 | Arizona Board Of Regents For And On Behalf Of Arizona State University | Devices and methods for modulating brain activity |
| US20120283502A1 (en) | 2011-03-21 | 2012-11-08 | Mishelevich David J | Ultrasound neuromodulation treatment of depression and bipolar disorder |
| US20120053391A1 (en) | 2010-01-18 | 2012-03-01 | Mishelevich David J | Shaped and steered ultrasound for deep-brain neuromodulation |
| US20140343463A1 (en) | 2013-05-20 | 2014-11-20 | David J. Mishelevich | Ultrasound neuromodulation treatment of clinical conditions |
| US8427154B2 (en) | 2010-04-12 | 2013-04-23 | Rares Salomir | Method and apparatus for magnetic resonance guided high intensity focused ultrasound focusing under simultaneous temperature monitoring |
| WO2011156624A2 (en) | 2010-06-09 | 2011-12-15 | Regents Of The University Of Minnesota | Dual mode ultrasound transducer (dmut) system and method for controlling delivery of ultrasound therapy |
| US8281236B2 (en) | 2010-09-08 | 2012-10-02 | Microsoft Corporation | Removing style corruption from extensible markup language documents |
| US8753278B2 (en)* | 2010-09-30 | 2014-06-17 | Siemens Medical Solutions Usa, Inc. | Pressure control in medical diagnostic ultrasound imaging |
| AU2012242639B2 (en) | 2011-04-14 | 2016-09-01 | Regents Of The University Of Minnesota | Vascular characterization using ultrasound imaging |
| US8727415B2 (en) | 2011-06-30 | 2014-05-20 | Lund Motion Products, Inc. | Vehicle bed extender |
| WO2013059833A1 (en) | 2011-10-21 | 2013-04-25 | Neurotrek, Inc. | Method and system for direct communication |
| SG11201401833UA (en) | 2011-10-28 | 2014-05-29 | Decision Sciences Int Corp | Spread spectrum coded waveforms in ultrasound imaging |
| CN102800071B (en) | 2012-06-20 | 2015-05-20 | 南京航空航天大学 | Method for reconstructing super resolution of sequence image POCS |
| CN102788836B (en) | 2012-07-26 | 2015-06-24 | 中国科学院电工研究所 | Magneto-acoustic microscopic imaging method and imaging system |
| US10814131B2 (en) | 2012-11-26 | 2020-10-27 | Thync Global, Inc. | Apparatuses and methods for neuromodulation |
| CN105793729B (en) | 2013-07-23 | 2018-07-31 | 明尼苏达大学评议会 | Ultrasound image formation and/or reconstruction using multi-frequency waveforms |
| KR101485591B1 (en) | 2014-03-05 | 2015-01-22 | 재단법인 실감교류인체감응솔루션연구단 | Device, computer-readable recording medium and method for generating touch feeling by non-invasive brain stimulation using ultrasonic waves |
| US20170080255A1 (en) | 2014-03-15 | 2017-03-23 | Cerevast Medical Inc. | Thin and wearable ultrasound phased array devices |
| US11596812B2 (en) | 2018-04-06 | 2023-03-07 | Regents Of The University Of Minnesota | Wearable transcranial dual-mode ultrasound transducers for neuromodulation |
| US20200121960A1 (en) | 2018-09-28 | 2020-04-23 | Regents Of The University Of Minnesota | Reversible thermal neuromodulation using focused ultrasound |
- 2012
- 2012-04-13AUAU2012242639Apatent/AU2012242639B2/enactiveActive
- 2012-04-13EPEP12715304.7Apatent/EP2696771B8/enactiveActive
- 2012-04-13WOPCT/US2012/033584patent/WO2012142455A2/enactiveApplication Filing
- 2012-04-13USUS13/446,635patent/US9610061B2/enactiveActive
- 2012-04-13KRKR1020137030014Apatent/KR102006035B1/enactiveActive
- 2012-04-13CACA2832689Apatent/CA2832689A1/enactivePending
- 2012-04-13EPEP18193572.7Apatent/EP3495022B1/enactiveActive
- 2012-04-13CNCN201280028868.1Apatent/CN103747742B/enactiveActive
- 2013
- 2013-10-03ILIL228703Apatent/IL228703B/enactiveIP Right Grant
- 2017
- 2017-03-31USUS15/475,739patent/US11547384B2/enactiveActive
Patent Citations (4)
| Publication number | Priority date | Publication date | Assignee | Title |
|---|---|---|---|---|
| US7686764B2 (en)* | 2003-06-25 | 2010-03-30 | Panasonic Corporation | Ultrasound diagnostic apparatus for calculating positions to determine IMT and lumen boundaries |
| CN101179998A (en)* | 2005-05-20 | 2008-05-14 | 株式会社日立医药 | Image diagnosis apparatus |
| CN101563626A (en)* | 2006-11-03 | 2009-10-21 | 皇家飞利浦电子股份有限公司 | Dual-path processing for optimal speckle tracking |
| US20080221448A1 (en)* | 2007-03-07 | 2008-09-11 | Khuri-Yakub Butrus T | Image-guided delivery of therapeutic tools duing minimally invasive surgeries and interventions |
Non-Patent Citations (3)
| Title |
|---|
| AAGE GRONNINGSAETER, ET AL: "《Vessel Wall Detection and Blood Noise Reduction》", 《IEEE TRANSACTIONS ON ULTRASONICS, FERROELECTRICS, AND FREQUENCY CONTROL》* |
| EMA,D S. EBBINI: "《Phase-Coupled Two-Dimensional Speckle》", 《工EEE TRANSACT工ONS ON ULTRASON工CS,FERROELECTR工CS, AND FREQUENCY CONTROL》* |
| G.E TRAHEY ET AL: "《Angle independent ultrasonic blood flow》", 《ULTRASONICS》* |
Cited By (23)
| Publication number | Priority date | Publication date | Assignee | Title |
|---|---|---|---|---|
| WO2016106959A1 (en)* | 2014-12-30 | 2016-07-07 | 华中科技大学 | Multi-parameter model guided-method for iteratively extracting movement parameter of angiography image of blood vessel |
| CN109661684B (en)* | 2016-09-06 | 2023-03-28 | 维塔医疗股份公司 | Ray tracing method for real interactive ultrasonic simulation |
| CN109661684A (en)* | 2016-09-06 | 2019-04-19 | 苏黎世联合高等工业学校 | Ray-tracing procedure for real interactive ultrasonic simulation |
| CN113967036A (en)* | 2017-04-28 | 2022-01-25 | 深圳迈瑞生物医疗电子股份有限公司 | Ultrasonic imaging device and method for detecting vascular wall shear index by utilizing ultrasonic |
| CN111728642A (en)* | 2017-06-06 | 2020-10-02 | 深圳迈瑞生物医疗电子股份有限公司 | Method, device and system for imaging in ultrasonic scanning |
| CN111728642B (en)* | 2017-06-06 | 2021-03-19 | 深圳迈瑞生物医疗电子股份有限公司 | Method, device and system for imaging in ultrasonic scanning |
| US11717270B2 (en) | 2017-06-06 | 2023-08-08 | Shenzhen Mindray Bio-Medical Electronics Co., Ltd. | Method, apparatus and system for imaging in ultrasonic scanning |
| CN112168210A (en)* | 2019-07-03 | 2021-01-05 | 深圳迈瑞生物医疗电子股份有限公司 | Medical image processing terminal, ultrasonic diagnostic equipment and fetal image processing method |
| CN112168210B (en)* | 2019-07-03 | 2024-04-16 | 深圳迈瑞生物医疗电子股份有限公司 | Medical image processing terminal, ultrasonic diagnostic apparatus, and fetal image processing method |
| CN112244887A (en)* | 2019-07-06 | 2021-01-22 | 西南林业大学 | Carotid artery vessel wall motion trajectory extraction device and method based on B-ultrasonic image |
| CN113768533A (en)* | 2020-06-10 | 2021-12-10 | 无锡祥生医疗科技股份有限公司 | Ultrasonic developing apparatus and ultrasonic developing method |
| CN113768533B (en)* | 2020-06-10 | 2024-05-14 | 无锡祥生医疗科技股份有限公司 | Ultrasonic developing device and ultrasonic developing method |
| CN112345646A (en)* | 2020-10-30 | 2021-02-09 | 安徽理工大学 | Method for reconstructing microdefect in slender rod |
| CN112345646B (en)* | 2020-10-30 | 2022-03-08 | 安徽理工大学 | Method for reconstructing microdefect in slender rod |
| CN114642449A (en)* | 2020-12-18 | 2022-06-21 | 深圳迈瑞生物医疗电子股份有限公司 | Blood flow imaging method and ultrasound imaging device |
| CN114680817A (en)* | 2020-12-29 | 2022-07-01 | 深圳开立生物医疗科技股份有限公司 | Intraluminal image reconstruction method, device, equipment and storage medium |
| CN114098817A (en)* | 2021-11-18 | 2022-03-01 | 西安建筑科技大学 | High frame rate ultrasonic image blood vessel wall motion detail tracking method, system, equipment and readable storage medium |
| CN114847889A (en)* | 2022-04-20 | 2022-08-05 | 河南省肿瘤医院 | Pulse reproduction method, device, storage medium, terminal equipment and system |
| RU2825826C1 (en)* | 2023-08-31 | 2024-08-30 | Государственное бюджетное учреждение здравоохранения города Москвы Научно-практический клинический центр диагностики и телемедицинских технологий Департамента здравоохранения города Москвы" (ГБУЗ "НПКЦ ДиТ ДЗМ") | Method of detecting blood flow signals during ultrasonic imaging |
| CN116936033A (en)* | 2023-09-18 | 2023-10-24 | 海杰亚(北京)医疗器械有限公司 | Percutaneous ablation operation planning method, percutaneous ablation operation planning device, percutaneous ablation operation planning medium and percutaneous ablation operation planning equipment |
| CN116936033B (en)* | 2023-09-18 | 2023-11-17 | 海杰亚(北京)医疗器械有限公司 | Percutaneous ablation operation planning method, percutaneous ablation operation planning device, percutaneous ablation operation planning medium and percutaneous ablation operation planning equipment |
| CN120392039A (en)* | 2025-07-03 | 2025-08-01 | 北京紫云智能科技有限公司 | Traumatic bleeding detection method and system based on infrared thermal imaging and ultrasound multimodality |
| CN120392039B (en)* | 2025-07-03 | 2025-09-09 | 北京紫云智能科技有限公司 | Traumatic bleeding detection method and system based on infrared thermal imaging and ultrasound multimodality |
Also Published As
| Publication number | Publication date |
|---|---|
| AU2012242639A1 (en) | 2013-10-17 |
| WO2012142455A3 (en) | 2013-08-01 |
| US20120283564A1 (en) | 2012-11-08 |
| CN103747742B (en) | 2016-04-06 |
| KR102006035B1 (en) | 2019-07-31 |
| US11547384B2 (en) | 2023-01-10 |
| EP2696771A2 (en) | 2014-02-19 |
| KR20140027989A (en) | 2014-03-07 |
| EP2696771B8 (en) | 2018-11-28 |
| EP2696771B1 (en) | 2018-09-12 |
| EP3495022A2 (en) | 2019-06-12 |
| EP3495022B1 (en) | 2023-06-07 |
| US20170296140A1 (en) | 2017-10-19 |
| AU2012242639B2 (en) | 2016-09-01 |
| CA2832689A1 (en) | 2012-10-18 |
| IL228703A0 (en) | 2013-12-31 |
| IL228703B (en) | 2018-03-29 |
| US9610061B2 (en) | 2017-04-04 |
| NZ615910A (en) | 2015-11-27 |
| WO2012142455A2 (en) | 2012-10-18 |
| EP3495022A3 (en) | 2019-10-02 |
Similar Documents
| Publication | Publication Date | Title |
|---|---|---|
| US11547384B2 (en) | Vascular characterization using ultrasound imaging | |
| Feigin et al. | A deep learning framework for single-sided sound speed inversion in medical ultrasound | |
| US12127880B2 (en) | Ultrasound based three-dimensional lesion verification within a vasculature | |
| CN105793729B (en) | Ultrasound image formation and/or reconstruction using multi-frequency waveforms | |
| JP7132925B2 (en) | Ultrasound imaging system using neural networks for deriving imaging data and tissue information | |
| KR101651830B1 (en) | Feedback in medical ultrasound imaging for high intensity focused ultrasound | |
| CN112568988A (en) | Multi-frequency mapping catheter and mapping method | |
| CN103429164B (en) | Ultrasonic diagnostic device, image processing device, and image processing method | |
| JP7371105B2 (en) | Methods and systems for investigating vascular properties | |
| CN113316420B (en) | Method and system for monitoring cardiac function | |
| CN101111195A (en) | Method and system for deriving heart rate without using electrocardiogram in non-3D imaging applications | |
| JP7044862B6 (en) | Imaging methods, controllers, and imaging systems for monitoring patients after EVAR | |
| JP2023521817A (en) | System and method for non-invasive pressure measurement | |
| Cinthio et al. | Intra-observer variability of longitudinal displacement and intramural shear strain measurements of the arterial wall using ultrasound noninvasively in vivo | |
| Ciompi et al. | Reconstruction and analysis of intravascular ultrasound sequences | |
| Csány et al. | A real-time data-based scan conversion method for single element ultrasound transducers | |
| Czernuszewicz et al. | Acoustic radiation force impulse ultrasound | |
| NZ615910B2 (en) | Vascular characterization using ultrasound imaging | |
| Sheina et al. | Power Spectra of Doppler Response Signals from Biological Objects Using Synthetic Aperture Ultrasound | |
| Sheina et al. | Power spectra of ultrasonic doppler response from biological objects using synthetic aperture technique | |
| Ho | Time-Resolved Wall Shear Rate Mapping using High-Frame-Ultrasound Imaging | |
| Ebbini et al. | Dereverberation of ultrasound echo data in vascular imaging applications | |
| Healthcare | UITC ABSTRACTS 2017 | |
| Moshavegh | Automatic Ultrasound Scanning | |
| Bu | Higher-order ultrasonic strain imaging for assessment of regional myocardial function |
Legal Events
| Date | Code | Title | Description |
|---|---|---|---|
| C06 | Publication | ||
| PB01 | Publication | ||
| C10 | Entry into substantive examination | ||
| SE01 | Entry into force of request for substantive examination | ||
| C14 | Grant of patent or utility model | ||
| GR01 | Patent grant |