CN103267905A - A Method for Extracting Electromagnetic Background Noise Based on Hierarchical-Clustering Algorithm - Google Patents
A Method for Extracting Electromagnetic Background Noise Based on Hierarchical-Clustering AlgorithmDownload PDFInfo
- Publication number
- CN103267905A CN103267905ACN2013101466822ACN201310146682ACN103267905ACN 103267905 ACN103267905 ACN 103267905ACN 2013101466822 ACN2013101466822 ACN 2013101466822ACN 201310146682 ACN201310146682 ACN 201310146682ACN 103267905 ACN103267905 ACN 103267905A
- Authority
- CN
- China
- Prior art keywords
- field strength
- background noise
- value
- electromagnetic background
- cluster
- Prior art date
- Legal status (The legal status is an assumption and is not a legal conclusion. Google has not performed a legal analysis and makes no representation as to the accuracy of the status listed.)
- Granted
Links
Images
Landscapes
- Monitoring And Testing Of Transmission In General (AREA)
- Geophysics And Detection Of Objects (AREA)
Abstract
Description
Translated fromChinese技术领域technical field
本发明涉及无线电管理技术领域,具体涉及一种基于分层-聚类算法的电磁背景噪声提取方法,可应用于无线电监测中电磁背景噪声测量、频谱占用度统计和电磁环境分析与评估等。The invention relates to the technical field of radio management, in particular to a method for extracting electromagnetic background noise based on a hierarchical-clustering algorithm, which can be applied to electromagnetic background noise measurement, spectrum occupancy statistics, electromagnetic environment analysis and evaluation, etc. in radio monitoring.
背景技术Background technique
电磁背景噪声测量是无线电管理部门日常无线电监测中的重要测试内容,也是确定频谱占用度统计门限的主要参考。目前我国大多数无线电监测站对电磁背景噪声值的测量主要以监测接收机显示出的频谱曲线或者经验值来确定。而在频谱占用度统计中,按照国家无线电管理局下发的《关于下发<无线电频谱监测统计报告暂行规定>的通知》,要求统计上报各固定监测站的各频段占用度时,将信号门限电平值定为背景噪声值+5dB。这种依靠人工(或经验)读取底噪值的做法使得占用度统计结果受人为因素影响较大,不便于对电磁环境状况进行准确定量分析和评估。The measurement of electromagnetic background noise is an important test content in the daily radio monitoring of the radio management department, and it is also the main reference for determining the statistical threshold of spectrum occupancy. At present, the measurement of the electromagnetic background noise value by most radio monitoring stations in my country is mainly determined by the spectrum curve displayed by the monitoring receiver or the empirical value. In the spectrum occupancy statistics, according to the "Notice on Issuing <Interim Regulations on Radio Spectrum Monitoring Statistical Reports>" issued by the State Radio Administration, when it is required to report the occupancy of each frequency band of each fixed monitoring station, the signal gate The limit level value is set as the background noise value +5dB. This method of relying on manual (or empirical) reading of the noise floor makes the occupancy statistical results greatly affected by human factors, which is not convenient for accurate quantitative analysis and evaluation of the electromagnetic environment.
在ITU-R P.372建议书《无线电噪声》中,将无线电噪声定义为一种在射频范围内具有明显不传送信息的分量的时变电磁现象,这些分量可叠加在有用信号上,或和有用信号相组合。无线电噪声是来自于多个发射源的无线电发射总和,并且这些发射不是来自无线电通信发射机。在给定测量地点,如果没有单一的噪声源占主导,那么无线电噪声在幅值上服从正态分布,此时无线电噪声可以看做高斯白噪声。该建议书根据美国上世纪70年的测量数据,采用线性插值的方法表示300KHz-250MHz频率范围内的噪声值与多种环境之间的关系。如以噪声系数Fam表示的估算公式为:In Recommendation ITU-R P.372, Radio Noise, radio noise is defined as a time-varying electromagnetic phenomenon in the radio-frequency range that has significantly non-informative components that can be superimposed on the wanted signal, or and Combination of useful signals. Radio noise is the sum of radio emissions from multiple sources that do not originate from radiocommunication transmitters. At a given measurement site, if no single noise source dominates, then the radio noise follows a normal distribution in amplitude, and at this time the radio noise can be regarded as Gaussian white noise. Based on the measurement data of the United States in the 1970s, the proposal uses a linear interpolation method to express the relationship between the noise value in the frequency range of 300KHz-250MHz and various environments. For example, the estimation formula represented by the noise factor Fam is:
Fam=c-d log f (1)Fam = cd log f (1)
其中f为噪声频率,c和d为环境类型常数且取值如表1所示:Where f is the noise frequency, c and d are environment type constants and their values are shown in Table 1:
表1常用c和d的取值Table 1 Commonly used values of c and d
2006/2007年在欧洲开展的测量工作通常证实了上述噪声数值。对于理想接地平面上的短(h≤λ)垂直单极天线而言,噪声场强的垂直部分可表示为:Measurements carried out in Europe in 2006/2007 generally confirmed the above noise values. For a short (h≤λ) vertical monopole antenna on an ideal ground plane, the vertical component of the noise field strength can be expressed as:
En=Fam+20logfMHz+B-95.5 dB(μV/m) (2)En =Fam +20logfMHz +B-95.5 dB(μV/m) (2)
其中En表示接收带宽范围内的噪声场强值,fMHz表示中心频率,B表示接收系统噪声功率带宽(Hz),h为天线高度,λ为电波波长。Where En represents the noise field strength value within the receiving bandwidth range, fMHz represents the center frequency, B represents the noise power bandwidth of the receiving system (Hz), h is the antenna height, and λ is the radio wave wavelength.
ITU-R P.372建议书将无线电噪声规定为各种来源的非欲收辐射的总和,且专门排除了来自单一的可识别源头的发射,这种情况并不适用于实际环境特别是城市和居民区中噪声发射设备的密度高的情况。在采用了新的(产生无线电噪声的)电气和电子设备以及无线电通信系统(例如超宽带(UWB)、电力线通信(PLC)和计算机)后,ITU-R P.372建议书中规定的无线电噪声电平可能会提高,因此,ITU-R SM.1573建议书给出了一种实际无线电应用中测量和评估无线电噪声的方法。该ITU-R SM.1573建议书将无线电噪声分为高斯白噪声、脉冲噪声和单载波噪声三种分量,用均方根值来表征高斯白噪声分量。Recommendation ITU-R P.372 defines radio noise as the sum of unwanted radiation from various sources, and specifically excludes emissions from a single identifiable source, which is not applicable in practical environments, especially urban and High density of noise emitting devices in residential areas. Radio noise as defined in Recommendation ITU-R P.372 after the introduction of new (radio noise-generating) electrical and electronic equipment and radiocommunication systems such as ultra-wideband (UWB), power line communications (PLC) and computers Levels may be increased, therefore, Recommendation ITU-R SM.1573 gives a method for measuring and evaluating radio noise in practical radio applications. The Recommendation ITU-R SM.1573 divides radio noise into three components: Gaussian white noise, impulse noise and single carrier noise, and uses the root mean square value to characterize the Gaussian white noise component.
对于高斯白噪声的测量通常采用“20%方法”。首先对所研究的频段进行扫描,选取某一不存在发射的频点(可使用某一不存在指配的频率或服从以高斯幅值分布的背景噪声为主的一段频率),记录测量周期内(一般为24小时以上)的电平值,只采用电平最低的20%的样本而舍弃另外80%的样本,而后使用剩余20%样本的均值或中值估计噪声电平。For the measurement of Gaussian white noise, the "20% method" is usually used. First scan the frequency band under study, select a frequency point where there is no emission (you can use a frequency that does not exist assigned or a frequency that is dominated by background noise with a Gaussian amplitude distribution), and record (generally more than 24 hours), only use the 20% samples with the lowest level and discard the other 80% samples, and then use the mean or median of the remaining 20% samples to estimate the noise level.
ITU-R SM.1573建议书提供的方法一般需要人工参与或数据库支持选择空闲频率,而且在样本剔除的过程中也可能消除一些含有噪声的样本,往往导致得到过低的噪声电平,需要对结果加以修正或验证截止值。The method provided by Recommendation ITU-R SM.1573 generally requires manual participation or database support to select idle frequencies, and some samples containing noise may also be eliminated in the process of sample elimination, which often results in too low noise levels. Results were trimmed or validated with a cutoff value.
发明内容Contents of the invention
为了克服现有电磁背景噪声测量方法存在噪声电平较低、智能化程度不高等不足,本发明提供了一种基于分层-聚类算法的电磁背景噪声提取方法。所述提取方法将无线电监测中频谱场强分布点划分为若干聚类簇,通过提取最底层场强分布聚类簇及其中心场强值,实现背景噪声场强值与信号场强值的自动分离;本发明综合考虑昼夜、人为用频行为等因素导致的在电磁背景噪声时变特性波动,客观反映电磁背景噪声实时变化规律,所述提取方法具体包括如下步骤:In order to overcome the shortcomings of the existing electromagnetic background noise measurement method, such as low noise level and low intelligence, the present invention provides a method for extracting electromagnetic background noise based on a hierarchical-clustering algorithm. The extraction method divides the spectrum field strength distribution points in radio monitoring into several clusters, and by extracting the bottommost field strength distribution clusters and their center field strength values, the automatic detection of background noise field strength values and signal field strength values is realized. Separation; the present invention comprehensively considers the time-varying characteristic fluctuations in the electromagnetic background noise caused by factors such as day and night, human frequency behavior, and objectively reflects the real-time variation law of the electromagnetic background noise. The extraction method specifically includes the following steps:
第一步,构建频谱监测扫描获取的频谱-场强数据集;The first step is to construct the spectrum-field strength data set obtained by spectrum monitoring scan;
第二步,基于无线电业务对所述频谱-场强数据集进行数据子集划分和场强分层;In the second step, data subset division and field strength stratification are performed on the spectrum-field strength data set based on the radio service;
第三步,基于分层-聚类算法确定聚类簇中心场强值;The third step is to determine the field strength value of the cluster center based on the hierarchical-clustering algorithm;
第四步,对所述聚类簇的中心场强值进行排序,取最小值得到电磁背景噪声样本值;The fourth step is sorting the central field strength values of the clusters, and taking the minimum value to obtain the electromagnetic background noise sample value;
第五步,重复第一步~第四步,形成电磁背景噪声样本序列;The fifth step is to repeat the first step to the fourth step to form a sample sequence of electromagnetic background noise;
第六步,确定单位时间内电磁背景噪声电平。The sixth step is to determine the electromagnetic background noise level per unit time.
本发明优点在于:The present invention has the advantage that:
1.将以往凭人工或凭经验方式读取电磁背景噪声的定性方法,转变为基于严格数学模型的定量求解方法,提升了电磁背景噪声测量的科学性和自动化程度;1. Transform the qualitative method of reading electromagnetic background noise manually or empirically into a quantitative solution method based on strict mathematical models, which improves the scientificity and automation of electromagnetic background noise measurement;
2.有效弥补ITU-R P.372方法给出的噪声曲线不考虑实际无线电系统发射因素,因而易导致估计噪声值较真实值偏低的不足;2. Effectively make up for the fact that the noise curve given by the ITU-R P.372 method does not consider the actual radio system emission factors, which easily leads to the fact that the estimated noise value is lower than the real value;
3.通过分层-聚类算法自动选择满足簇类分布特性的电磁背景噪声样本值,克服了ITU-RSM.1753方法依靠人工选择空闲频点场强作为噪声样本值的方式,提高电磁背景噪声计算的准确性。3. Automatically select the electromagnetic background noise sample value that satisfies the cluster distribution characteristics through the hierarchical-clustering algorithm, which overcomes the method of ITU-RSM. Calculated accuracy.
附图说明Description of drawings
图1A为88-108MHz(FM广播)频段某次扫描获取的监测频谱图;Figure 1A is a monitoring spectrum diagram acquired by a certain scan in the 88-108MHz (FM broadcasting) frequency band;
图1B为88-108MHz(FM广播)基于分层-聚类算法得到的频谱-场强数据集分簇结果;Figure 1B is the clustering result of the spectrum-field strength data set obtained based on the hierarchical-clustering algorithm for 88-108MHz (FM broadcast);
图1C为88-108MHz(FM广播)连续8天电磁背景噪声变化曲线;Figure 1C is the 88-108MHz (FM broadcast) electromagnetic background noise change curve for 8 consecutive days;
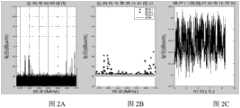
图2A为403-470MHz频段某次扫描获取的监测频谱图;Fig. 2A is the monitoring spectrum diagram obtained by a certain scan in the 403-470MHz frequency band;
图2B为403-470MHz频段基于分层-聚类算法得到的频谱-场强数据集分簇结果;Figure 2B is the spectrum-field strength data set clustering result obtained based on the hierarchical-clustering algorithm in the 403-470MHz frequency band;
图2C为403-470MHz频段连续8天电磁背景噪声变化曲线;Figure 2C is the change curve of electromagnetic background noise in the 403-470MHz frequency band for 8 consecutive days;
图3A为890-915MHz频段某次扫描获取的监测频谱图;Fig. 3A is the monitoring spectrum diagram obtained by a certain scan in the 890-915MHz frequency band;
图3B为890-915MHz频段基于分层-聚类算法得到的频谱-场强数据集分簇结果;Figure 3B is the clustering result of the spectrum-field strength data set obtained based on the hierarchical-clustering algorithm in the 890-915MHz frequency band;
图3C为890-915MHz频段连续8天电磁背景噪声变化曲线;Figure 3C is the change curve of electromagnetic background noise in the 890-915MHz frequency band for 8 consecutive days;
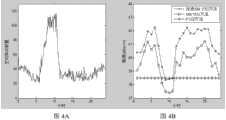
图4A为88-108MHz频段扫描中最底层频点数量变化;Figure 4A shows the changes in the number of bottom frequency points in the 88-108MHz frequency band scan;
图4B为88-108MHz频段分层-聚类算法与其它方法结果比较。Figure 4B is a comparison of the results of the hierarchical-clustering algorithm in the 88-108MHz frequency band with other methods.
具体实施方式Detailed ways
下面结合附图对本发明进一步说明。The present invention will be further described below in conjunction with the accompanying drawings.
本发明提供一种基于分层-聚类算法的电磁背景噪声提取方法,所述提取方法具体包括如下步骤:The present invention provides a method for extracting electromagnetic background noise based on a hierarchical-clustering algorithm. The extraction method specifically includes the following steps:
第一步,构建频谱-场强数据集。The first step is to construct the spectrum-field strength dataset.
由于空间电磁频谱具有时域、空域和频域等多维分布属性,决定了频谱监测数据必然构成具有上述多维特征的数据集,称为频谱-场强数据集。同时由于监测信号频谱的量值与监测设备的参数设置密切关系,故频谱-场强数据集必然含有反映监测设备设置的参数。监测扫描过程中随时间累积形成的频谱-场强数据用矩阵元素集M表示,频谱-场强数据可用式(3)和式(4)表示如下:Since the space electromagnetic spectrum has multi-dimensional distribution properties such as time domain, space domain and frequency domain, it is determined that the spectrum monitoring data must constitute a data set with the above multi-dimensional characteristics, which is called the spectrum-field strength data set. At the same time, because the magnitude of the monitoring signal spectrum is closely related to the parameter settings of the monitoring equipment, the spectrum-field strength data set must contain parameters reflecting the settings of the monitoring equipment. The spectrum-field strength data accumulated over time during the monitoring and scanning process is represented by a matrix element set M, and the spectrum-field strength data can be expressed by equations (3) and (4) as follows:
其中,in,
各参数的含义如下:The meaning of each parameter is as follows:
M:频谱监测数据的矩阵元素集;M: set of matrix elements for spectrum monitoring data;
频谱监测数据矩阵元素,sk表示频谱监测位置; Spectrum monitoring data matrix element, sk represents the spectrum monitoring position;
P(f,t):频谱监测设备测量信号功率密度;P(f,t): Spectrum monitoring equipment measures signal power density;
Fstart,Tstart:频谱监测设备扫描起始频率和时间;Fstart , Tstart : Spectrum monitoring equipment scan start frequency and time;
Fstop,Tstop:频谱监测设备扫描终止频率和时间;Fstop , Tstop : Spectrum monitoring equipment scan stop frequency and time;
fi,tj:频谱监测设备设定频率值和时间段;fi , tj : Spectrum monitoring equipment set frequency value and time period;
Br,Tr:频谱监测设备扫描频率分辨率和时间分辨率;Br , Tr : frequency resolution and time resolution of spectrum monitoring equipment scanning;
Bs,T:频谱监测设备测量频率宽度和测量时间;Bs , T: spectrum monitoring equipment measurement frequency width and measurement time;
Bd,Td:频谱监测设备视频带宽及其扫描时间;Bd , Td : video bandwidth of spectrum monitoring equipment and its scanning time;
Ts,Ta:频谱监测设备扫描时间段和驻留时间段;Ts , Ta : Spectrum monitoring equipment scan time period and dwell time period;
Nf,Nt,Nk:信道、采样时刻和监测点的数量;Nf , Nt , Nk : number of channels, sampling moments and monitoring points;
第二步,对频谱-场强数据集进行数据子集与场强层次划分。In the second step, the spectrum-field strength data set is divided into data subsets and field strength levels.
将频谱-场强数据集按照无线电业务所在的频段划分为n个数据子集,根据监测频谱的频谱-场强分布,每个数据子集又分为k个场强层次(C1,C2,…,Ck),可视为初始聚类簇,在每个场强层次中随机选取一个场强值作为各聚类簇的初始中心场强值。k的值由监测频谱的动态范围决定(k≥1),即:Divide the spectrum-field strength data set into n data subsets according to the frequency band where the radio service is located. According to the spectrum-field strength distribution of the monitored spectrum, each data subset is further divided into k field strength levels (C1 , C2 ,...,Ck ), can be regarded as the initial cluster, and a field strength value is randomly selected in each field strength level as the initial central field strength value of each cluster. The value of k is determined by the dynamic range of the monitored spectrum (k≥1), namely:
其中d为确定场强层次个数的信号场强电平间隔值,一般取5dB;max表示取最大值,min表示取最小值,ROUND表示做四舍五入取整运算。Where d is the signal field strength level interval value for determining the number of field strength levels, generally 5dB; max means take the maximum value, min means take the minimum value, and ROUND means do rounding and rounding operations.
第三步,基于分层-聚类算法确定聚类簇中心场强值。The third step is to determine the field strength value of the cluster center based on the hierarchical-clustering algorithm.
在场强层次的个数k确定的情况下,采用k-means聚类算法寻找各聚类簇的中心场强值,具体为:When the number k of the field strength level is determined, the k-means clustering algorithm is used to find the center field strength value of each cluster, specifically:
(1)按照距离最近原则,将每个数据子集内除初始中心场强值外的剩余场强分布点分别指派给最近的初始中心场强值,形成一个聚类簇;(1) According to the principle of the closest distance, assign the remaining field strength distribution points in each data subset except the initial central field strength value to the nearest initial central field strength value to form a cluster;
(2)计算每个聚类簇的中心场强值。(2) Calculate the central field strength value of each cluster.
(3)将重新计算得到的中心场强值再作为初始中心场强值,返回步骤(1),直到数据子集内的距离平方函数达到最小值。所述距离平方函数定义如下:(3) Use the recalculated central field strength value as the initial central field strength value, and return to step (1) until the distance square function in the data subset reaches the minimum value. The distance square function is defined as follows:
式中,D表示数据子集内所有场强分布点到其各自聚类簇中心的距离平方和,Ci表示第i个聚类簇,p表示聚类簇Ci所包含的场强分布点,mi表示聚类簇Ci的中心场强值,k表示聚类簇个数。In the formula, D represents the sum of the squares of distances from all field strength distribution points in the data subset to their respective cluster centers, Ci represents the i-th cluster, and p represents the field strength distribution points contained in the cluster Ci , mi represents the central field strength value of cluster Ci , and k represents the number of clusters.
在k-means聚类算法迭代过程中,可能出现在初始设置的聚类簇的中心场强值外没有场强分布点的情况,这时k-means聚类算法输出该聚类簇的元素为0,且将初始设置的中心场强值作为该聚类簇的中心场强值。In the iterative process of the k-means clustering algorithm, there may be no field strength distribution points outside the central field strength value of the initially set cluster, and then the k-means clustering algorithm outputs the elements of the cluster as 0, and the initially set center field strength value is used as the center field strength value of the cluster.
第四步,选取底层数据簇并确定电磁背景噪声样本值。The fourth step is to select the underlying data cluster and determine the sample value of the electromagnetic background noise.
通过前三步计算,将频谱-场强数据集中的每个数据子集分为以各聚类簇中心场强值为层中心的k个场强层次,通过将k个场强层次的中心场强值做排序处理,选取最小值(代表最底层中心电平值)为t时刻电磁背景噪声样本值nt。Through the calculation of the first three steps, each data subset in the spectrum-field strength data set is divided into k field strength levels with the center field strength value of each cluster cluster as the center of the layer, and by dividing the center fields of the k field strength levels The strong values are sorted, and the minimum value (representing the bottom center level value) is selected as the electromagnetic background noise sample value nt at time t.
nt=min{m1,m2,...,mk} (7)nt =min{m1 ,m2 ,...,mk } (7)
其中,mi表示聚类簇Ci的中心场强值。Among them, mi represents the central field strength value of the cluster Ci .
第五步,基于频谱监测扫描数据重复第一步~第四步,可形成测量时间T内的电磁背景噪声样本序列N。In the fifth step, the first step to the fourth step are repeated based on the frequency spectrum monitoring scanning data to form the electromagnetic background noise sample sequence N within the measurement time T.
N={n1,n2,...,nt,...,nT} (8)。N={n1 ,n2 ,...,nt ,...,nT } (8).
第六步,确定单位时间内电磁背景噪声。The sixth step is to determine the electromagnetic background noise per unit time.
为得到指定单位时间(典型为小时)内的电磁背景噪声电平,按照“20%方法”原理,将单位时间内电磁背景噪声样本序列按照取值大小排序,剔除较大的80%样本值,取较小的20%样本均值作为该时间内的电磁背景噪声估计值。该估计值通常可作为频谱占用度统计时确定门限值的依据。In order to obtain the electromagnetic background noise level within a specified unit time (typically hours), according to the "20% method" principle, the electromagnetic background noise sample sequence per unit time is sorted according to the value size, and the larger 80% sample value is eliminated. Take the smaller 20% sample mean value as the estimated value of the electromagnetic background noise during this time. The estimated value can usually be used as a basis for determining the threshold value when counting the spectrum occupancy.
实施例Example
应用本发明提供的方法,对88-108MHz(FM广播)进行电磁背景噪声测量,测量数据来自对某地区连续9天(2011年10月13日2:30至2011年10月21日16:31)的实地频谱监测,监测天线架设在某楼顶(东经39°54′15″,北纬116°24′27″,距地面高约40米)。监测设备包括Agilent 9340B频谱分析仪、数据记录和存储计算机以及CS-AOS30-3000V有源全向天线。监测频段设置为30-3000MHz,频率扫描分辨率为100kHz,每次扫描采样的频率点数为29800个,在频谱监测时间内连续测量得到1815个时间点的“频谱-场强”数据样本。88-108MHz(FM广播)电磁背景噪声提取可分为以下步骤:Apply the method provided by the present invention to measure the electromagnetic background noise of 88-108MHz (FM radio). ), the monitoring antenna was erected on the roof of a building (39°54′15″ east longitude, 116°24′27″ north latitude, about 40 meters above the ground). Monitoring equipment includes Agilent 9340B spectrum analyzer, data recording and storage computer, and CS-AOS30-3000V active omnidirectional antenna. The monitoring frequency band is set to 30-3000MHz, the frequency scanning resolution is 100kHz, the number of frequency points sampled in each scanning is 29800, and the "spectrum-field strength" data samples of 1815 time points are continuously measured during the spectrum monitoring time. 88-108MHz (FM radio) electromagnetic background noise extraction can be divided into the following steps:
第一步,从监测数据中抽取88-108MHz(FM广播)监测数据集其中sk(k=1)表示本实验监测位置,即东经39°54′15″,北纬116°24′27″,离地高度40米,fi∈[88,108]MHz,tj∈[1,1815]。数据集时域分布原始频谱图如图1A所示。The first step is to extract the 88-108MHz (FM radio) monitoring data set from the monitoring data Among them, sk (k=1) indicates the monitoring position of this experiment, that is, 39°54′15″ east longitude, 116°24′27″ north latitude, 40 meters above the ground, fi ∈ [88,108] MHz, tj ∈ [1 ,1815]. The original spectrogram of the time domain distribution of the data set is shown in Figure 1A.
第二步,对第一步中得到的频谱-场强数据集进行数据子集和场强层次划分,分层间隔值d取5dB,根据(5)式场强分层方法得到7个场强层次;In the second step, the spectrum-field strength data set obtained in the first step is divided into data subsets and field strength levels, and the layer interval value d is 5dB, and 7 field strengths are obtained according to the field strength layering method in (5) level;
第三步,k-means聚类算法寻找7个聚类簇的中心场强值,并根据式(6)确定每个聚类簇的样本值,得到88-108MHz频谱场强分层-聚类分布如图1B所示。In the third step, the k-means clustering algorithm finds the central field strength values of 7 clusters, and determines the sample value of each cluster according to formula (6), and obtains the 88-108MHz spectrum field strength stratification-clustering The distribution is shown in Figure 1B.
第四步,将第三步中得到的7个聚类簇中心场强值按从大到小顺序排列,如图1C所示,依据(7)式取最小值作为背景噪声样本序列;The fourth step is to arrange the field strength values of the seven cluster centers obtained in the third step in order from large to small, as shown in Figure 1C, and take the minimum value according to formula (7) as the background noise sample sequence;
第五步,对1815个频谱扫描数据样本重复按照第一步到第四步的方法进行处理,从而得到88-108MHz(FM广播)频段持续8天的背景噪声样本序列;对背景噪声样本序列中所包含的样本个数以天为单位求均值,可得到处于噪声簇类频点的数量变化情况,如图4A所示;The fifth step is to repeat the processing of the 1815 spectrum scanning data samples according to the first step to the fourth step, so as to obtain the background noise sample sequence of the 88-108MHz (FM broadcast) frequency band for 8 days; for the background noise sample sequence The number of included samples is averaged in units of days, and the change in the number of frequency points in the noise cluster can be obtained, as shown in Figure 4A;
第六步,按照“20%方法”原理,将每小时内监测扫描的电磁背景噪声样本序列按照取值大小排序,剔除较大的80%样本值,取较小的20%样本均值作为该时段内电磁背景噪声估计值。首先求取每天24小时对应的电磁背景噪声估计值,再求取连续8天电磁背景噪声估计值以天为单位的均值,即可得到本次测量24小时内电磁背景噪声变化曲线,如图4B所示。The sixth step, according to the principle of "20% method", sort the electromagnetic background noise sample sequence monitored and scanned every hour according to the value size, remove the larger 80% sample value, and take the smaller 20% sample mean value as the period An estimate of the internal electromagnetic background noise. First calculate the estimated value of the electromagnetic background noise corresponding to 24 hours a day, and then calculate the average value of the estimated value of the electromagnetic background noise for 8 consecutive days in units of days, to obtain the change curve of the electromagnetic background noise within 24 hours of this measurement, as shown in Figure 4B shown.
采用上述同样处理方法,可以得到403-470MHz频段和890-915MHz(GSM上行业务)的电磁背景噪声的分层聚类计算结果和电磁背景噪声变化曲线。分别如图2A~图2C和图3A~图3C所示。Using the same processing method as above, the hierarchical clustering calculation results of the electromagnetic background noise in the 403-470MHz frequency band and 890-915MHz (GSM uplink service) and the change curve of the electromagnetic background noise can be obtained. They are shown in Figures 2A to 2C and Figures 3A to 3C respectively.
为便于分析比较,图4B中同时给出了ITU-P.372中给出了相同频段背景噪声曲线,以及基于相同测试数据和ITU-SM.1573方法得到的电磁背景噪声曲线。由图4B可以看出,采用本发明提出的方法,能够克服ITU-R P.372建议对电磁背景噪声估计过于理想以及ITU-RSM.1753建议对电磁背景噪声估计过低的缺陷。For the convenience of analysis and comparison, the background noise curve of the same frequency band given in ITU-P.372 and the electromagnetic background noise curve obtained based on the same test data and ITU-SM.1573 method are also given in Fig. 4B. It can be seen from Fig. 4B that the method proposed by the present invention can overcome the defects that the ITU-R P.372 proposal estimates the electromagnetic background noise too ideally and the ITU-RSM.1753 proposal estimates the electromagnetic background noise too low.
Claims (4)
Translated fromChinesePriority Applications (1)
| Application Number | Priority Date | Filing Date | Title |
|---|---|---|---|
| CN201310146682.2ACN103267905B (en) | 2013-04-25 | 2013-04-25 | A kind of electromagnetic background noise extracting method based on layering-clustering algorithm |
Applications Claiming Priority (1)
| Application Number | Priority Date | Filing Date | Title |
|---|---|---|---|
| CN201310146682.2ACN103267905B (en) | 2013-04-25 | 2013-04-25 | A kind of electromagnetic background noise extracting method based on layering-clustering algorithm |
Publications (2)
| Publication Number | Publication Date |
|---|---|
| CN103267905Atrue CN103267905A (en) | 2013-08-28 |
| CN103267905B CN103267905B (en) | 2015-11-18 |
Family
ID=49011544
Family Applications (1)
| Application Number | Title | Priority Date | Filing Date |
|---|---|---|---|
| CN201310146682.2AActiveCN103267905B (en) | 2013-04-25 | 2013-04-25 | A kind of electromagnetic background noise extracting method based on layering-clustering algorithm |
Country Status (1)
| Country | Link |
|---|---|
| CN (1) | CN103267905B (en) |
Cited By (11)
| Publication number | Priority date | Publication date | Assignee | Title |
|---|---|---|---|---|
| CN104868960A (en)* | 2015-04-30 | 2015-08-26 | 中国电子科技集团公司第七研究所 | Method and system for predicting background interference noise level |
| CN105182070A (en)* | 2015-08-13 | 2015-12-23 | 西华大学 | Signal detection method |
| CN105897488A (en)* | 2016-06-13 | 2016-08-24 | 中南大学 | Visualization method of radio signal data |
| CN108362372A (en)* | 2017-12-21 | 2018-08-03 | 武汉船舶通信研究所(中国船舶重工集团公司第七二二研究所) | Low frequency noise measurement system |
| CN110333398A (en)* | 2019-07-10 | 2019-10-15 | 北京航空航天大学 | A Noise Threshold Calculation Method of Electromagnetic Spectrum |
| CN110376444A (en)* | 2019-07-22 | 2019-10-25 | 湘潭大学 | A kind of average electromagnetic radiation prediction technique based on Gauss model |
| CN110832558A (en)* | 2017-08-02 | 2020-02-21 | 欧姆龙株式会社 | Sensor management unit, sensed data distribution system, sensed data evaluation method, and sensed data evaluation program |
| CN111782596A (en)* | 2020-06-09 | 2020-10-16 | 北京有生志广科技有限公司 | Radio monitoring data processing method based on high-performance hybrid calculation |
| CN112034036A (en)* | 2020-10-16 | 2020-12-04 | 中国铁道科学研究院集团有限公司 | Steel rail magnetic leakage signal filtering method and device |
| CN112331208A (en)* | 2020-09-30 | 2021-02-05 | 音数汇元(上海)智能科技有限公司 | Personal safety monitoring method and device, electronic equipment and storage medium |
| CN113899948A (en)* | 2021-12-08 | 2022-01-07 | 成都中星世通电子科技有限公司 | System and method for quickly extracting electromagnetic spectrum target characteristic data |
Citations (3)
| Publication number | Priority date | Publication date | Assignee | Title |
|---|---|---|---|---|
| US20030059837A1 (en)* | 2000-01-07 | 2003-03-27 | Levinson Douglas A. | Method and system for planning, performing, and assessing high-throughput screening of multicomponent chemical compositions and solid forms of compounds |
| CN101247376A (en)* | 2007-02-15 | 2008-08-20 | 北京三星通信技术研究有限公司 | OFDM Channel Estimation Method Combined with Wavelet Transform Domain Denoising |
| CN102484488A (en)* | 2009-09-04 | 2012-05-30 | 日本电气株式会社 | Radio communication device and radio communication method with carrier phase noise canceling function |
- 2013
- 2013-04-25CNCN201310146682.2Apatent/CN103267905B/enactiveActive
Patent Citations (3)
| Publication number | Priority date | Publication date | Assignee | Title |
|---|---|---|---|---|
| US20030059837A1 (en)* | 2000-01-07 | 2003-03-27 | Levinson Douglas A. | Method and system for planning, performing, and assessing high-throughput screening of multicomponent chemical compositions and solid forms of compounds |
| CN101247376A (en)* | 2007-02-15 | 2008-08-20 | 北京三星通信技术研究有限公司 | OFDM Channel Estimation Method Combined with Wavelet Transform Domain Denoising |
| CN102484488A (en)* | 2009-09-04 | 2012-05-30 | 日本电气株式会社 | Radio communication device and radio communication method with carrier phase noise canceling function |
Cited By (17)
| Publication number | Priority date | Publication date | Assignee | Title |
|---|---|---|---|---|
| CN104868960A (en)* | 2015-04-30 | 2015-08-26 | 中国电子科技集团公司第七研究所 | Method and system for predicting background interference noise level |
| CN105182070A (en)* | 2015-08-13 | 2015-12-23 | 西华大学 | Signal detection method |
| CN105182070B (en)* | 2015-08-13 | 2017-12-05 | 西华大学 | A kind of signal detecting method |
| CN105897488A (en)* | 2016-06-13 | 2016-08-24 | 中南大学 | Visualization method of radio signal data |
| CN105897488B (en)* | 2016-06-13 | 2019-04-09 | 中南大学 | A Visualization Method of Radio Signal Data |
| CN110832558A (en)* | 2017-08-02 | 2020-02-21 | 欧姆龙株式会社 | Sensor management unit, sensed data distribution system, sensed data evaluation method, and sensed data evaluation program |
| CN110832558B (en)* | 2017-08-02 | 2022-04-26 | 欧姆龙株式会社 | Sensor management unit, sensed data distribution system, sensed data evaluation method, and storage medium |
| CN108362372A (en)* | 2017-12-21 | 2018-08-03 | 武汉船舶通信研究所(中国船舶重工集团公司第七二二研究所) | Low frequency noise measurement system |
| CN110333398A (en)* | 2019-07-10 | 2019-10-15 | 北京航空航天大学 | A Noise Threshold Calculation Method of Electromagnetic Spectrum |
| CN110376444A (en)* | 2019-07-22 | 2019-10-25 | 湘潭大学 | A kind of average electromagnetic radiation prediction technique based on Gauss model |
| CN110376444B (en)* | 2019-07-22 | 2021-06-22 | 湘潭大学 | A Prediction Method of Average Electromagnetic Radiation Based on Gaussian Model |
| CN111782596A (en)* | 2020-06-09 | 2020-10-16 | 北京有生志广科技有限公司 | Radio monitoring data processing method based on high-performance hybrid calculation |
| CN111782596B (en)* | 2020-06-09 | 2023-10-10 | 北京有生志广科技有限公司 | Radio monitoring data processing method based on high-performance hybrid computing |
| CN112331208A (en)* | 2020-09-30 | 2021-02-05 | 音数汇元(上海)智能科技有限公司 | Personal safety monitoring method and device, electronic equipment and storage medium |
| CN112034036A (en)* | 2020-10-16 | 2020-12-04 | 中国铁道科学研究院集团有限公司 | Steel rail magnetic leakage signal filtering method and device |
| CN112034036B (en)* | 2020-10-16 | 2023-11-17 | 中国铁道科学研究院集团有限公司 | Rail magnetic leakage signal filtering method and device |
| CN113899948A (en)* | 2021-12-08 | 2022-01-07 | 成都中星世通电子科技有限公司 | System and method for quickly extracting electromagnetic spectrum target characteristic data |
Also Published As
| Publication number | Publication date |
|---|---|
| CN103267905B (en) | 2015-11-18 |
Similar Documents
| Publication | Publication Date | Title |
|---|---|---|
| CN103267905B (en) | A kind of electromagnetic background noise extracting method based on layering-clustering algorithm | |
| US12095518B2 (en) | Systems, methods, and devices for electronic spectrum management | |
| CN111585671B (en) | Electromagnetic interference monitoring and identification method of power LTE wireless private network | |
| Weidling et al. | A framework for RF spectrum measurements and analysis | |
| US20130090874A1 (en) | Electromagnetic spectrum aerial surveying | |
| Romano et al. | Precipitation pattern analysis in the Tiber River basin (central Italy) using standardized indices. | |
| Cotton | Spectrum occupancy measurements of the 3550–3650 megahertz maritime radar band near San Diego, California | |
| CN106100762B (en) | A kind of weak signal of communication detection method of cyclo-stationary spectrum analysis | |
| CN104868960A (en) | Method and system for predicting background interference noise level | |
| Giesbrecht et al. | An empirical study of the probability density function of HF noise | |
| CN108270495B (en) | Background noise extraction method and system | |
| CN118937811A (en) | A lightning comprehensive early warning method and system | |
| CN119291305B (en) | Rapid test method for voltage standing wave ratio frequency response curve of radio frequency device | |
| Giugliano et al. | Past and future climate analysis at regional scale: the case study of the Campania Region, Italy | |
| Jan et al. | Study of the nonlinear character of ionospheric signals possessing critical frequency (fo F2) at Pakistan air space | |
| CN109684308A (en) | Electromagnetic environment parameter consistency cleaning method and device based on pattern search | |
| Brooker | Finding a good aircraft noise annoyance curve. | |
| Xu et al. | A Study of WLAN RSSI Based Distance Measurement Using EEMD | |
| Yang et al. | A dynamic threshold computing method based on SOM Neural Network in Frequency Occupancy analysis | |
| Wagstaff et al. | Man-made noise measurement programme (AYA4119) | |
| Aggarwal et al. | A Feasibility Study For Real-Time Narrowband RFI Filtering In The GMRT Wideband Backend |
Legal Events
| Date | Code | Title | Description |
|---|---|---|---|
| C06 | Publication | ||
| PB01 | Publication | ||
| C10 | Entry into substantive examination | ||
| SE01 | Entry into force of request for substantive examination | ||
| C14 | Grant of patent or utility model | ||
| GR01 | Patent grant |