CN103093447A - Cutting and splicing method of concentration of pictures of computer - Google Patents
Cutting and splicing method of concentration of pictures of computerDownload PDFInfo
- Publication number
- CN103093447A CN103093447ACN2013100223293ACN201310022329ACN103093447ACN 103093447 ACN103093447 ACN 103093447ACN 2013100223293 ACN2013100223293 ACN 2013100223293ACN 201310022329 ACN201310022329 ACN 201310022329ACN 103093447 ACN103093447 ACN 103093447A
- Authority
- CN
- China
- Prior art keywords
- picture
- circle
- area
- pictures
- display panel
- Prior art date
- Legal status (The legal status is an assumption and is not a legal conclusion. Google has not performed a legal analysis and makes no representation as to the accuracy of the status listed.)
- Granted
Links
Images


Landscapes
- Image Analysis (AREA)
Abstract
Translated fromChinese
Description
Translated fromChinese技术领域technical field
本发明涉及一种计算机图片集中图片剪切拼接方法,属于计算机图像、多媒体信息技术等领域。The invention relates to a method for cutting and splicing pictures in a computer picture collection, belonging to the fields of computer graphics, multimedia information technology and the like.
背景技术Background technique
随着手持照相设备的日益普及,人们拍照更加方便,获取的图片更加丰富,继而对图片集自动管理技术的需求更加突显。作为一种重要的图片集摘要和展示技术,图片拼贴近年来正受到越来越多的重视。图片拼贴的主要目的在于提供一个紧致、丰富而美观的图片集摘要图。由于手动制作这样的拼贴摘要图需要用到一些专业的图片编辑技巧同时耗时颇多,自动化的拼贴摘要图生成技术近年来成为了一个研究热点。With the increasing popularity of hand-held camera devices, it is more convenient for people to take pictures, and the pictures they get are more abundant, and then the demand for automatic management technology of picture collections is more prominent. As an important image collection summarization and presentation technique, image collage has been receiving more and more attention in recent years. The main purpose of a photo collage is to provide a compact, rich and aesthetically pleasing summary of a photo collection. Since manual production of such a collage summary map requires some professional image editing skills and is time-consuming, automated collage summary map generation technology has become a research hotspot in recent years.
传统的图片拼贴方法一般基于构造一个优化框架,将拼贴结果的好坏以某种客观标准加以量化,此优化方程通常具有复杂的非线性形式。由于每张图片的状态决定于若干参数,总共可能产生成百上千个参数需要优化。在如此复杂的非线性优化方程中求解如此规模的优化解通常是低效的,同时也很容易陷入局部最优解。尽管一些提升求解效率的方法已先后被提出,但此类方法仍有其固有的局限性。一方面,每张图片的最优状态参数往往与其它若干图片的状态紧耦合,导致某张图片状态的更新全局性或局部地影响到其它图片,从而导致拼贴的可扩展性很差。另一方面,各张图片通常都统一对待,图片的缩放因子很少被当成重要的影响因素,而若把不同图片的重要度信息加入考虑,将能提供更好的图片集摘要,同时有助于用户根据自己的喜好控制最终的拼贴结果。Traditional image collage methods are generally based on constructing an optimization framework to quantify the quality of the collage results with some objective standard, and this optimization equation usually has a complex nonlinear form. Since the state of each picture depends on several parameters, there may be hundreds or thousands of parameters that need to be optimized. Solving an optimization solution of such scale in such a complex nonlinear optimization equation is usually inefficient, and it is also easy to get stuck in a local optimum. Although some methods to improve the solution efficiency have been proposed successively, such methods still have their inherent limitations. On the one hand, the optimal state parameters of each picture are often tightly coupled with the states of several other pictures, resulting in the update of the state of a certain picture globally or locally affecting other pictures, resulting in poor scalability of the collage. On the other hand, each picture is usually treated uniformly, and the zoom factor of the picture is rarely regarded as an important influencing factor. If the importance information of different pictures is taken into consideration, it will be able to provide a better summary of the picture collection, and at the same time help Allow users to control the final collage result according to their own preferences.
发明内容Contents of the invention
发明目的:本发明提供一种计算机中图片剪切拼接方法,可以突出各个图片中的人物主体,更完整地保留图片的核心信息。Purpose of the invention: The present invention provides a method for cutting and splicing pictures in a computer, which can highlight the main body of the characters in each picture and retain the core information of the pictures more completely.
技术方案:本发明公开了一种计算机中图片剪切拼接方法,其核心在于确定图片在最终合成的图片中的显示空间以及其显示内容,包括以下步骤:Technical solution: the invention discloses a method for cutting and splicing pictures in a computer, the core of which is to determine the display space and display content of the picture in the final synthesized picture, including the following steps:
步骤1,重要度评估:衡量图片集中每幅图片的颜色特征,通过统计图片中颜色的多样性获得每幅图片的颜色复杂度SC;采用土方移动距离方法计算图片集中各个图片之间的EMD距离(EarthMover’s Distance,简称EMD距离),将每幅图片与其他图片的EMD距离最小值作为该图片与图片集中其他图片的相似度SD,将SC和SD的加权和作为该图片的重要度SI。
步骤2,展示面板子区域划分得到每幅图片的显示空间:选取与图片集中图片数量相同的一组圆,其中各个圆的初始半径之间的比例与所述每幅图片的重要度之间的比例相同,通过圆填充方法(Circle Packing)填充展示面板,填充完成后由圆的外切多边形划分得到展示面板子区域,从而确定每幅图片在展示面板上的显示空间Qp。Step 2: Divide the sub-regions of the display panel to obtain the display space of each picture: select a group of circles with the same number of pictures in the picture collection, and the ratio between the initial radii of the circles and the importance of each picture The proportions are the same, and the display panel is filled by the circle packing method (Circle Packing). After the filling is completed, the sub-area of the display panel is divided by the circumscribed polygon of the circle, so as to determine the display space Qp of each picture on the display panel.
步骤3,显示参数优化:确定每幅图片的朝向角θ,摆放位置、缩放尺度,以使各幅图片在获得的有限的面板子区域空间内最大化地呈现其重要区域,获得图片在面板上的显示内容。首先在给定范围内设定每一幅图片的朝向角θ;计算每个图片的重要度图(Saliency Map),用于表示图片中像素的重要程度。将含有人脸图像的图片中人脸图像区域内每个像素的重要度值置为最大值;将每个图片中高于预设重要度阈值的像素组成连通区域,按照连通区域面积由大至小排序后,将面积排序前1/3的连通区域划分至一个多边形区域内,该多边形区域即是该图片的ROI区域Qr(Region of Interest,简称ROI关注区域)。然后根据图片设定的朝向角θ、图片的ROI区域Qr以及步骤2中确定的图片对应的显示空间Qp,确定信息损失最小的图片摆放位置和缩放尺度。Step 3, display parameter optimization: determine the orientation angle θ of each picture, place it, and scale it, so that each picture can maximize its important area in the limited panel sub-area space obtained, and obtain the picture in the panel displayed on the screen. First, set the orientation angle θ of each picture within a given range; calculate the importance map (Saliency Map) of each picture, which is used to represent the importance of pixels in the picture. Set the importance value of each pixel in the face image area in the picture containing the face image to the maximum value; the pixels higher than the preset importance threshold in each picture form a connected area, and the area of the connected area is from large to small After sorting, divide the
步骤4,无缝混合渲染,基于概率混合模型对展示面板子区域之间的边界区域进行无缝混合渲染,从而完成计算机图片集中图片剪切拼接。
步骤1中,通过图片的复杂度和辨识度来评判图片的重要性。In
所述步骤1具体包括以下步骤:Described
步骤11,为衡量图片的复杂度,本方法选取最简单的颜色特征加以衡量。本方法用HSV(H,Hue,色调通道;S,Saturation,饱和度;V,Value,亮度)颜色空间上的直方图统计信息定义颜色的复杂度。H通道上的颜色复杂度定义如下:Step 11, in order to measure the complexity of the picture, this method selects the simplest color feature to measure. This method uses the histogram statistics on the HSV (H, Hue, hue channel; S, Saturation, saturation; V, Value, brightness) color space to define the complexity of the color. The color complexity on the H channel is defined as follows:
其中mH代表H通道上统计直方图的分区数,在本文实验中设为16;

S通道上的复杂度值
其中mS为S通道上统计直方图的分区数,在本文实验中设为16;

V通道上的复杂度值
其中mV为V通道上统计直方图的分区数,在本文实验中设为16;


最后的颜色复杂度即为:The final color complexity is:
步骤12,本方法采用土方移动距离(Earth Mover’s Distances,简称EMD距离,该度量的详细描述参见YOSSI RUBNER等发表于International Journal ofComputerVision的论文《The Earth Mover’s Distance as a Metric for Image Retrieval》)来计算图片之间的两两相似度。EMD距离用两幅图片在某一特征下的统计直方图的对齐代价E(GI,GI′,{fij})作为衡量图片相似程度的标准,该过程如下描述:Step 12, this method uses Earth Mover's Distances (EMD distance for short, for a detailed description of this measure, refer to the paper "The Earth Mover's Distance as a Metric for Image Retrieval" published by YOSSI RUBNER et al. in the International Journal of Computer Vision) to calculate the image pairwise similarity between them. The EMD distance uses the alignment cost E(GI , GI ′, {fij }) of the statistical histograms of two pictures under a certain feature as the standard to measure the similarity of the pictures. The process is described as follows:
最小化:
满足前提:fij≥0其中i∈[1,24],j∈[1,24],Satisfy the premise: fij ≥ 0 where i∈[1, 24], j∈[1, 24],
其中GI={gi,i=1,…,24},GI,={g′j,j=1,…,24},where GI ={gi , i=1,...,24}, GI ,={g'j ,j=1,...,24},
EMD距离用两幅图片在一特征下的统计直方图的对齐代价作为衡量图片相似程度,EMD距离采用以下公式计算:The EMD distance uses the alignment cost of the statistical histogram of two pictures under a feature as a measure of the similarity of the pictures. The EMD distance is calculated using the following formula:
GI={gi,i=1,…,24},GI,={g′j,j=1,…,24} (8),GI ={gi , i=1,...,24}, GI ,={g'j , j=1,...,24} (8),
公式(8)中GI和GI,分别为图片I和图片I′对应的HSV颜色空间直方图特征向量,其中H通道分成16个子块,S通道和V通道都划分成4个子块,三个通道共同组成一个24维的颜色特征向量GI和GI′,其中的gi和g′j代表子通道中划分的子块。公式(9)计算获得图片I和图片I′的EMD距离,中fij表示gi和g′j两子块之间的流(flow),dij表示gi和g′j两子块之间的L1距离。GI and GI in formula (8) are the HSV color space histogram feature vectors corresponding to picture I and picture I′ respectively, where the H channel is divided into 16 sub-blocks, the S channel and V channel are divided into 4 sub-blocks, and the three channels together form a 24-dimensional color feature vector GI and GI ′, where gi and g′j represent sub-blocks divided in sub-channels. Formula (9) calculates the EMD distance between picture I and picture I′, where fij represents the flow between two sub-blocks gi and g′j , and dij represents the flow between two sub-blocks gi and g′j The L1 distance between them.
本方法应用快速EMD计算方法(该算法可参见Ofir Pele,Michael Werman发表于ICCV的论文《Fast and Robust Earth Mover’s Distances》)得到图片集中每一幅图片与图片集中其他图片间EMD距离并选取其中的最小值作为该图片的辨识度SD。This method uses the fast EMD calculation method (for this algorithm, please refer to the paper "Fast and Robust Earth Mover's Distances" published by Ofir Pele and Michael Werman in ICCV) to obtain the EMD distance between each picture in the picture set and other pictures in the picture set, and select the The minimum value is taken as the recognition degreeSD of the picture.
步骤13,最后图片的重要度SI定义为:Step 13, the importance SI of the final picture is defined as:
SI=SC+ωSD (10);SI =SC +ωSD (10);
其中ω用于控制两者之间的影响权重,ω取值范围为0~1之间的实数,在本方法中ω均取0.3。Among them, ω is used to control the influence weight between the two, and the value range of ω is a real number between 0 and 1. In this method, ω takes 0.3.
步骤2中,利用步骤1中获得的每幅图片的重要度信息确定一系列半径与重要度信息相关联的圆,然后通过圆填充(Circle Packing)算法实现显示区域划分以确定图片在最终结果里的显示区域。圆填充算法的目标是针对一系列不同半径的圆,在允许均一缩放的条件下,将所有圆紧致的放入一特定形状的平面容器内,最后还可根据结果方便计算出包含每个单独圆的子区域划分。In step 2, use the importance information of each picture obtained in
步骤2具体包括以下步骤:Step 2 specifically includes the following steps:
步骤21,设定圆心的初始位置。对于给定的展示面板Ω和共有n幅图片的图片集,将展示面板中心置于一个二维右手坐标系(坐标系拥有X和Y两条坐标轴)的原点位置,然后在展示面板所在的坐标系范围内随机生成n个点作为圆心的初始位置,将圆心按照其X坐标的值由小到大进行排序,对于X坐标值相同的情况,Y坐标值小的圆心在前,由小到大对每个圆心分配一个标号i,i的取值范围为1~n的整数,圆心i对应圆Ci,圆的初始半径为Ri;
步骤22,设定圆的初始半径Ri。将图片集内的图片分别与一个标号的圆所对应,其对应的复杂度为比较步骤11中圆心两两之间的距离后获得距离最近的两个圆心之间的距离Dmin,则圆的初始半径Ri计算公式如下:Step 22, setting the initial radius Ri of the circle. Correspond the pictures in the picture set to a labeled circle respectively, and the corresponding complexity is After comparing the distances between the centers of the two circles in step 11, the distance Dmin between the two nearest centers is obtained, and the calculation formula for the initial radius Ri of the circle is as follows:
其中

步骤23,圆填充方法对展示面板Ω区域进行圆填充。获得圆的初始圆心位置和初始半径后,在保证圆与圆之间不相交并且所有圆在展示面板Ω的区域内的前提下,对所有圆进行同比例放大,放大完成后,动态调整圆心位置,重复执行放大调整过程,直至无法继续放大时,停止该过程,并获得在展示面板Ω区域内圆的紧致排列。
圆填充算法在步骤2中的主要作用就是在给定区域Ω中获得一个区域内圆都不重叠的紧致“布局”(Conguration),其中圆填充算法具体描述如下:The main function of the circle filling algorithm in step 2 is to obtain a compact "conguration" in which circles do not overlap in a given area Ω. The circle filling algorithm is specifically described as follows:
对于一个给定展示面板


最大化:kMaximize: k
满足前提:

获得的圆心位置集合用X=(x1,…,xn)表示,其中xi表示圆Ci的圆心坐标。本方法将X称为一个“布局”,如果所有圆满足上面提到的两个约束,则这个称X为一个“有效布局”。The set of obtained circle center positions is represented by X=(x1 , . . . , xn ), where xi represents the center coordinates of circle Ci . This method refers to X as a "layout", which is called a "valid layout" if all circles satisfy the two constraints mentioned above.
针对上述的优化过程,本方法采用一种基于权值图(Power diagram)的圆填充算法进行解决。For the above optimization process, this method uses a circle filling algorithm based on the weight diagram (Power diagram) to solve it.
权值图是一种带权沃罗诺伊图(Voronoi diagram,关于沃罗诺伊图的详细介绍可以参加Q Du等发表于SIAM的论文《Centroidalvoronoi tessellations:Applications andalgorithms》),
dω(x,xi)=||x-xi||2-ωi (12);dω (x, xi ) = ||xxi ||2 -ωi (12);
然后根据dω(x,xi)来对进行区域划分,定义与点xi相对应的区域Q(xi)如下:Then according to dω (x, xi ), the region is divided, and the area Q(xi ) corresponding to point xi is defined as follows:
所有的Q(xi)集合构成的点集合X的一个权值图。A weight map of the point set X composed of all Q(xi ) sets.
给定一个区域Ωi表示Q(xi)与Ω的交集:given a region Ωi represents the intersection of Q(xi ) and Ω:
Ωi=Q(xi)∩Ω (14);Ωi = Q(xi )∩Ω (14);
则所有Ωi组成的集合构成了一个在区域Ω内的点集合X的一个权值图,其中Ωi被称为与点xi相对应的“小室”(Cell)。Then the set of all Ωi constitutes a weight map of a point set X in the area Ω, where Ωi is called the "cell" (Cell) corresponding to the pointxi .
应用到本方法中,权值为ωi的点xi表示以点xi为圆心,
为了计算沃罗诺伊图,本方法采用Lloyd的方法(该方法具体可参见S Lloyd等发表于IEEE Transactions on Information Theory的论文《Least squares quantization in PCM》)动态调整圆心的位置,直至获得最大的缩放因子k,根据缩放因子k来获得一个在给定区域内对于给定数目圆在保证圆之间的半径比的前提下的紧致排列,圆填充至此停止。In order to calculate the Voronoi diagram, this method uses Lloyd's method (for details, please refer to the paper "Least squares quantization in PCM" published by S Lloyd et al. in IEEE Transactions on Information Theory) to dynamically adjust the position of the center of the circle until the maximum Scaling factor k, according to the scaling factor k to obtain a compact arrangement for a given number of circles in a given area under the premise of ensuring the radius ratio between the circles, the circle filling stops here.
步骤24,展示面板的子区域划分,得到每幅图片的显示空间。根据步骤23获得的圆在展示面板Ω内的最终位置,在任意两个相邻圆之间设置一条两个相邻圆的圆心连线的垂直平分线,一个圆周围所有垂直平分线交错形成的封闭多边形构成了展示面板的子区域,其中包含圆Ci的多边形Qp即是与其相关联的图片i所对应的显示空间。。Step 24, divide the sub-regions of the display panel to obtain the display space of each picture. According to the final position of the circle in the display panel Ω obtained in
步骤3,显示参数优化过程中,通过计算设定每幅图片的朝向角、摆放位置和缩放尺度使得每幅图片在步骤2中获得的显示空间内最大化地呈现其主要内容。步骤3具体包括以下步骤:Step 3, in the display parameter optimization process, set the orientation angle, placement position and zoom scale of each picture through calculation so that each picture can maximize its main content in the display space obtained in step 2. Step 3 specifically includes the following steps:
步骤31,设定图片朝向角。本方法赋予每幅图片一个随机的朝向角θ,θ满足[-θm,θm]范围内的平均分布,其中θm为最大允许偏转角,本方法设置θm为30°,从而使得图片展示具有视觉上的多样性,而不是单调死板。Step 31, setting the orientation angle of the picture. This method gives each picture a random orientation angle θ, θ satisfies the average distribution within the range of [-θm ,θm ], where θm is the maximum allowable deflection angle, and this method sets θm to 30°, so that the picture Displays are visually diverse, not monotonous.
步骤32,确定坐标和缩放尺寸。Step 32, determine the coordinates and scaling size.
首先,获得图片重要度图。通过程明明等提出的方法计算图片的重要度图(SaliencyMap)(该部分算法可以参见程明明等发表于CVPR的论文《Global Contrast based SalientRegionDetection》),借助重要度图中每个像素点对应的重要度值(Saliency)来反映每个像素的重要度,重要度值越大,表明该像素能够在最终拼接结果中显示的概率越大;为了保证人们通常更加敏感的人脸能得到充分显示,使用OpenCV中的人脸检测算法(该算法可参见PaulViola和MichaelJones发表于CVPR的《RapidObjectDetectionusingaBoostedCascadeofSimpleFeature》)检测人脸区域,将该区域内重要度图的重要度值置为最大。First, obtain the image importance map. Calculate the importance map (SaliencyMap) of the image through the method proposed by Cheng Mingming et al. (For this part of the algorithm, please refer to the paper "Global Contrast based SalientRegionDetection" published by Cheng Mingming et al. in CVPR), with the help of the importance of each pixel in the importance map Saliency value (Saliency) to reflect the importance of each pixel, the greater the importance value, the greater the probability that the pixel can be displayed in the final stitching result; in order to ensure that people's usually more sensitive faces can be fully displayed, use The face detection algorithm in OpenCV (for this algorithm, please refer to "Rapid Object Detection using a Boosted Cascade of Simple Feature" published by PaulViola and Michael Jones in CVPR) detects the face area, and sets the importance value of the importance map in the area to the maximum.
然后,获得图片ROI区域。对获得的重要度图基于阈值进行二值化处理,阈值为0~1之间的实数,本方法设定为0.618,然后经过侵蚀与扩张操作(侵蚀与扩张均属于形态学的基本处理手段,具体方法可参见JY Gil,R Kimmel发表于Pattern Analysis andMachine Intelligence的论文《Efficient dilation,erosion,opening,and closing algorithms》)获得若干个连通区域,按照连通区域面积由大至小排序后,通过Sklansky,J.提出的最小凸包算法(该部分方法可参见Sklansky,J.发表于Pattern Recognition Letters上的论文《Finding the Convex Hull of a Simple Polygon》)用一个凸多边形包围面积排序前三分之一的单连通区域,所得多边形Qr即为图片ROI区域。Then, the image ROI area is obtained. The obtained importance map is binarized based on the threshold value. The threshold value is a real number between 0 and 1. This method is set to 0.618, and then undergoes erosion and expansion operations (both erosion and expansion belong to the basic processing methods of morphology. For specific methods, please refer to the paper "Efficient dilation, erosion, opening, and closing algorithms" published by JY Gil and R Kimmel in Pattern Analysis and Machine Intelligence) to obtain several connected regions, sort them according to the area of connected regions from large to small, and pass Sklansky, The minimum convex hull algorithm proposed by J. (for this part of the method, please refer to the paper "Finding the Convex Hull of a Simple Polygon" published by Sklansky, J. on Pattern Recognition Letters) uses a convex polygon to enclose the first third of the sorted area The single connected area, the obtained polygon Qr is the image ROI area.
最后,确定图片坐标和缩放尺度。Qr和Qp分别表示图片ROI区域多边形和图片所对应的展示画板显示空间。首先,将Qr的重心Pr于Qp的中心位置,朝向角θ之前已经确定,该图片恰好完全覆盖展示空间时的缩放尺度即为缩放尺度的初始值。以Pr为原点构建平行于画板坐标系的笛卡尔坐标系O。然后,定义O中各象限内的信息丢失值S为在Qr内但不在Qp内的像素的重要度值的平均值。Stl,Str,Sbr和Sb1分别表示左上,右上,右下和左下四个象限内的信息丢失值。一个启发式的移动方向向量v由以下公式确定:Finally, determine the image coordinates and zoom scale. Qr and Qp represent the polygon of the ROI area of the picture and the display space of the display board corresponding to the picture, respectively. First, the center of gravity Pr of Qr is placed at the center of Qp , and the orientation angle θ has been determined before. The zoom scale when the picture just completely covers the display space is the initial value of the zoom scale. Construct a Cartesian coordinate system O parallel to the drawing board coordinate system with Pr as the origin. Then, define the information loss value S in each quadrant in O as the average value of the importance values of the pixels inQr but not inQp . Stl , Str , Sbr and Sb1 represent the information loss values in the upper left, upper right, lower right and lower left quadrants, respectively. A heuristic moving direction vector v is determined by the following formula:
v=((Stl+Sb1)-(Str+Sbr),(Stl+Str)-(Sbl+Sbr)) (15);v=((Stl +Sb1 )-(Str +Sbr ), (Stl +Str )-(Sbl +Sbr )) (15);
将v归一化为单位向量
其中r为每次图片的最大移动距离。据此分布取10个候选位置,并将图片移动到信息丢失值S最少的候选位置。在此新的位置上,将按照确定缩放尺度初始值的方法确定新的缩放尺度。Where r is the maximum moving distance of each picture. According to this distribution, take 10 candidate positions, and move the picture to the candidate position with the least information loss value S. At this new position, the new zoom scale will be determined in the same way as the initial value of the zoom scale.
以上搜索移动缩放步骤迭代进行若干次,当收敛或超过某一预定最大迭代次数限制(本方法设置为30次)后,停止迭代,此时信息损失值最小,图片坐标和缩放尺度确定完成。搜索算法保证了图片能够在有限的分配所得子区域上展示其主要信息。The above search, move and zoom steps are iterated several times, and when the convergence or exceeds a predetermined maximum number of iterations (this method is set to 30 times), the iteration is stopped. At this time, the information loss value is the smallest, and the image coordinates and zoom scale are determined. The search algorithm ensures that the image can display its main information on the limited allocated sub-areas.
步骤4具体包括以下步骤:
对展示面板上的每一个像素点,均关联一组概率{Prob1(p),Prob2(p),…,Probn(p)},其中n为图片总数,Probi(p)表示第i幅图片在该像素点处对应像素能够显示的概率。Qpi和Qri分别第i幅图片对应的展示面板展示空间和其ROI区域。混合可以使得Qri中不在Qpi中的部分也能得到一定程度上的展现,Probi(p)计算公式如下:For each pixel on the display panel, a set of probabilities {Prob1 (p), Prob2 (p), ..., Probn (p)} are associated, where n is the total number of pictures, and Probi (p) represents the The probability that the corresponding pixel of the i picture at the pixel point can be displayed. Qpi and Qri are the display panel display space and its ROI area corresponding to the i-th picture, respectively. Mixing can make the parts of Qri that are not in Qpi also be displayed to a certain extent. The calculation formula ofProbi (p) is as follows:
其中,e为自然对数的底,值为2.71828……,d(p,Qpi)表示点p到显示空间,Qpi的最近欧式距离,d(p,Qri)表示点p到ROI区域Qri的最近欧式距离,σ为贡献率概率概率分布的标准差,计算得σ≈0.39894223。Among them, e is the base of natural logarithm, the value is 2.71828..., d(p, Qpi ) indicates the closest Euclidean distance from point p to display space, Qpi , d(p, Qri ) indicates point p to ROI area The nearest Euclidean distance of Qri , σ is the standard deviation of the probability distribution of the contribution rate, calculated as σ≈0.39894223.
展示面板每个像素点的关联概率用以上规则计算得到后,再平均的分发到其4邻域上,以使得邻近的像素具有接近的概率值再将每个像素的一组关联概率归一化,其后得到的概率图即作为混合操作的Alpha通道值用于最终拼贴图片的合成。After the association probability of each pixel of the display panel is calculated by the above rules, it is evenly distributed to its 4 neighbors, so that adjacent pixels have close probability values, and then a set of association probabilities of each pixel is normalized , the resulting probability map is used as the alpha channel value of the blending operation for the synthesis of the final collage image.
有益效果:本发明包括以下优点:Beneficial effect: the present invention comprises the following advantages:
(1)更灵活的显示区域支持。支持任意边界形状的拼贴结果,同时支持在拼贴结果上进行子图片的放缩、旋转和两两交换位置等个性化定制操作。(1) More flexible display area support. It supports collage results with arbitrary boundary shapes, and supports personalized customization operations such as scaling, rotating and exchanging positions of sub-pictures on the collage results.
(2)更高的可扩展性同时兼备低耦合性。这一特性得益于以下三个方面:首先,本文采用的子区域划分算法高效鲁棒,能够在平均1秒内处理30张以上图片的子区域划分。其次,每张图片的状态参数——位置、朝向角、缩放尺度和层次的优化互相关性弱,每个参数均可在一个独立的阶段优化求解。最后,每张图片的状态参数优化均于邻近图片的状态解耦合,从而可并行地进行。(2) Higher scalability and low coupling at the same time. This feature benefits from the following three aspects: First, the sub-region division algorithm used in this paper is efficient and robust, and can process sub-region division of more than 30 images within 1 second on average. Second, the state parameters of each image—position, orientation angle, zoom scale, and level—are weakly correlated with optimization, and each parameter can be optimally solved in an independent stage. Finally, the optimization of state parameters for each picture is decoupled from the states of neighboring pictures, so that it can be performed in parallel.
(3)较快的处理速度和更高的鲁棒性。得益于(2)中的低耦合性以及区域划分算法的高效性,本方法的速度不慢于已有方法的最快速度,快于大部分已有方法。同时,相比于微软的AutoCollage,本方法可以做任意数量的图片集拼接,而AutoCollage要求图片集的图片数量最少为7张图片。(3) Faster processing speed and higher robustness. Thanks to the low coupling in (2) and the high efficiency of the region division algorithm, the speed of this method is not slower than the fastest speed of the existing methods, and is faster than most of the existing methods. At the same time, compared with Microsoft's AutoCollage, this method can stitch any number of picture sets, and AutoCollage requires a minimum of 7 pictures in the picture set.
(4)更能满足人们对人物照片的客观需求。对于有人的图片,本发明会通过人脸检测设置显示人脸为最高优先级,从而有效的避免了人脸被其他照片的显示区域遮挡的情况,这也很大程度上避免了微软的AutoCollage中出现的人脸显示不全的情况;对于风景、物体、动物等无人的图片,本发明可以以较大的概率保证前景部分能得到显示,而前景部分很大程度会是照片内容的主要区域,从而获得很好的显示结果。(4) It can better meet people's objective needs for photos of people. For pictures with people, the present invention will display the human face as the highest priority through face detection, thereby effectively avoiding the situation that the human face is blocked by the display area of other photos, which also largely avoids Incomplete display of human faces occurs; for pictures without people such as landscapes, objects, animals, etc., the present invention can ensure that the foreground part can be displayed with a higher probability, and the foreground part will be the main area of the photo content to a large extent. Thus, a good display result can be obtained.
(5)更好的显示效果。本发明在图片排放的过程中,图片的朝向通过在一定角度范围内的随机选择朝向,因此最终的显示结果较现有的方法更加自然,同时角度范围的合理设定可以避免整个结果给人以杂乱的感觉。(5) Better display effect. In the process of displaying pictures in the present invention, the orientation of the pictures is randomly selected within a certain angle range, so the final display result is more natural than the existing method, and at the same time, the reasonable setting of the angle range can avoid the whole result giving people a false impression. messy feeling.
附图说明Description of drawings
下面结合附图和具体实施方式对本发明做更进一步的具体说明,本发明的上述或其他方面的优点将会变得更加清楚。The present invention will be further described below in conjunction with the accompanying drawings and specific embodiments, and the advantages of the above and other aspects of the present invention will become clearer.
图1为本发明方法的流程图。Fig. 1 is the flowchart of the method of the present invention.
图2为本发明中圆填充(Circle Packing)算法在一个矩形区域内划分5个区域的过程。Fig. 2 is the process of dividing five areas in a rectangular area by the Circle Packing algorithm in the present invention.
图3为本发明中显示区域优化的工作流程示意图。Fig. 3 is a schematic diagram of the workflow of display area optimization in the present invention.
图4为本发明方法实施的实例流程图。Fig. 4 is an example flowchart of the implementation of the method of the present invention.
图5用户调查的反馈结果图。Fig. 5 Feedback result map of user survey.
图6为动物图片集的实施例最终生成结果。Fig. 6 is the final generation result of the embodiment of the animal picture set.
图7为动画海报图片集的实施例最终生成结果。Fig. 7 is the final generation result of the embodiment of the animation poster picture set.
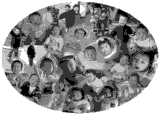
图8为小孩图片集的实施例最终生成结果。Fig. 8 is the final generation result of the embodiment of the children's picture set.
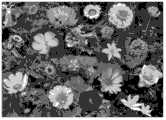
图9为花卉图片集的实施例最终生成结果。Fig. 9 is the final generation result of the embodiment of the flower picture set.
图10为菱形展示面板的实施例最终生成结果。Fig. 10 is the final generated result of the embodiment of the rhombus display panel.
图11为椭圆形展示面板的实施例最终生成结果。Fig. 11 is the final generated result of the embodiment of the elliptical display panel.
图12a为足球运动员图片集的AutoCollage最终生成结果。Figure 12a is the final AutoCollage generated result of the football player picture set.
图12b为足球运动员图片集的本实施例最终生成结果。Fig. 12b is the final generation result of this embodiment of the football player picture set.
图13a为玩偶图片集的AutoCollage最终生成结果。Figure 13a is the final AutoCollage generated result of the doll picture set.
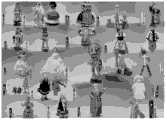
图13b为玩偶图片集的本实施例最终生成结果。Fig. 13b is the final generation result of this embodiment of the doll picture set.
具体实施方式:Detailed ways:
本方法的流程如图1所示首先评估各幅图片的重要程度,然后将次重要度值映射为圆填充算法的输入参数——圆的初始半径值;然后根据圆填充算法得到区域的划分结果,图2中展示了一个已知初始半径比例的5个圆,逐步增大圆的缩放因子,在经过多次计算后获得一个缩放因子的最大值k,然后根据圆的外切多边形来获得展示面板的区域划分;使用一种启发式的搜索算法迭代进行搜索优化各幅图片在所分配到的显示空间内的显示参数,图3展示了一次搜索优化过程;最后是同无缝混合技术处理图片间的重叠算法,最终获得图片集拼贴展示结果。图4展示了一个拥有5幅图片的图片集进行剪切拼接的具体流程及每部操作完成后的子结果。The flow of this method is shown in Figure 1. First, evaluate the importance of each picture, and then map the secondary importance value to the input parameter of the circle filling algorithm - the initial radius value of the circle; then obtain the division result of the area according to the circle filling algorithm , Figure 2 shows 5 circles with a known initial radius ratio, gradually increase the scaling factor of the circle, obtain a maximum value k of the scaling factor after multiple calculations, and then obtain the display panel according to the circumscribed polygon of the circle area division; use a heuristic search algorithm to iteratively search and optimize the display parameters of each picture in the allocated display space, Figure 3 shows a search optimization process; finally process the image space with the seamless blending technology The overlapping algorithm finally obtains the collage display result of the picture collection. Figure 4 shows the specific process of cutting and splicing a picture set with 5 pictures and the sub-results after each operation is completed.
具体地说,如图1所示,本发明公开了一种计算机中图像剪切拼接方法:Specifically, as shown in Figure 1, the present invention discloses a method for cutting and splicing images in a computer:
步骤1,重要度评估:衡量图片集中每幅图片的颜色特征,通过统计图片中颜色的多样性获得每幅图片的颜色复杂度SC;采用土方移动距离方法计算图片集中各个图片之间的EMD距离,将每幅图片与其他图片的EMD距离最小值作为该图片与图片集中其他图片的相似度SD,将SC和SD的加权和作为该图片的重要度SI;
步骤2,展示面板子区域划分得到每幅图片的显示空间:选取与图片集中图片数量相同的一组圆,其中各个圆的初始半径之间的比例与所述每幅图片的重要度之间的比例相同,通过圆填充方法填充展示面板,填充完成后由圆的外切多边形划分得到展示面板子区域,从而确定每幅图片在展示面板上的显示空间Qp;Step 2: Divide the sub-regions of the display panel to obtain the display space of each picture: select a group of circles with the same number of pictures in the picture collection, and the ratio between the initial radii of the circles and the importance of each picture The ratio is the same, the display panel is filled by the circle filling method, and the sub-area of the display panel is obtained by dividing the circumscribed polygon of the circle after filling, so as to determine the display space Qp of each picture on the display panel;
步骤3,显示参数优化:确定每幅图片的朝向角θ,摆放位置、缩放尺度;计算每个图片的重要度图,将含有人脸图像的图片中人脸图像区域内每个像素的重要度值置为最大值;将每个图片中高于预设重要度阈值的像素组成连通区域,按照连通区域面积由大至小排序后,将面积排序前1/3的连通区域划分至一个多边形区域内,该多边形区域即是该图片的ROI区域Qr;Step 3, display parameter optimization: determine the orientation angle θ of each picture, the placement position, and the zoom scale; calculate the importance map of each picture, and calculate the importance of each pixel in the face image area in the picture containing the face image The degree value is set to the maximum value; the pixels higher than the preset importance threshold in each picture form a connected area, and after sorting the area of the connected area from large to small, divide the top 1/3 of the connected area into a polygonal area Inside, the polygonal area is the ROI area Qr of the picture;
步骤4,无缝混合渲染,基于概率混合模型对展示面板子区域之间的边界区域进行无缝混合渲染,从而完成计算机图片集中图片剪切拼接。
步骤1中,通过图片的复杂度和与其他图片的相似度来评判图片的重要性。In
步骤1具体包括以下步骤:
步骤11,使用HSV颜色空间上的直方图统计信息定义颜色的复杂度,H通道上的颜色复杂度
其中mH代表H通道上统计直方图的分区数,在本文实验中设为16;


S通道上的复杂度值采用以下公式计算:Complexity value on S channel Calculated using the following formula:
其中mS为S通道上统计直方图的分区数,在本文实验中设为16;


V通道上的复杂度值
其中mV为V通道上统计直方图的分区数,在本文实验中设为16;


最后的颜色复杂度即为:The final color complexity is:
步骤12,EMD距离用两幅图片在一特征下的统计直方图的对齐代价作为衡量图片相似程度,EMD距离采用以下公式计算:Step 12, the EMD distance uses the alignment cost of the statistical histograms of two pictures under a feature as a measure of the similarity of the pictures, and the EMD distance is calculated using the following formula:
HI={hi,i=1,…,24},HI,={h′j,j=1,…,24} (8)。HI ={hi , i=1,...,24}, HI ,={h'j ,j=1,...,24} (8).
公式(8)中HI和HI,分别为图片I和图片I′对应的HSV颜色空间直方图特征向量,其中H通道分成16个子块,S通道和V通道都划分成4个子块,三个通道共同组成一个24维的颜色特征向量HI和HI′,其中hi和h′j代表表示子通道中划分的子块,i为子块hi的维度标号和j为子块h′j中的维度标号;公式(9)计算获得图片I和图片I′的EMD距离,其中fij表示hi和h′j两子块之间的流,dij表示hi和h′j两子块之间的L1距离。HI and HI in formula (8) are the HSV color space histogram feature vectors corresponding to picture I and picture I′ respectively, where H channel is divided into 16 sub-blocks, S channel and V channel are divided into 4 sub-blocks, three channels together form a 24-dimensional color feature vector HI and HI ′, where hi and h′j represent the sub-blocks divided in the sub-channel, i is the dimension label of the sub-block hi and j is the sub-block h ′ is the dimension label inj ; formula (9) calculates the EMD distance between picture I and picture I′, where fij represents the flow between hi and h′j sub-blocks, dij represents hi and h′j The L1 distance between two subblocks.
根据得到两两图片间EMD距离,从中选取最小值作为一图片与图片集中其他图片之间的相似度SD;According to the EMD distance obtained between two pictures, select the minimum value as the similarity SD between a picture and other pictures in the picture collection;
步骤13,最后图片的重要度定义为:Step 13, the importance of the final picture is defined as:
SI=SC+ωSD (10)SI =SC +ωSD (10)
ω相似度SD用于控制两者之间的影响权重,ω取值0.3。The ω similarity SD is used to control the influence weight between the two, and the value of ω is 0.3.
步骤2中,利用步骤1中获得的每幅图片的重要度信息确定一系列初始半径与重要度信息相关联的圆,然后通过圆填充算法实现显示区域划分。具体包括以下步骤:In step 2, the importance information of each picture obtained in
步骤21,设定圆心的初始位置。对于给定的展示面板Ω和共有n幅图片的图片集,将展示面板中心置于一个二维右手坐标系(坐标系拥有X和Y两条坐标轴)的原点位置,然后在展示面板所在的坐标系范围内随机生成n个点作为圆心的初始位置,将圆心按照其X坐标的值由小到大进行排序,对于X坐标值相同的情况,Y坐标值小的圆心在前,由小到大对每个圆心分配一个编号i,i的取值范围为1~n的整数,圆心i对应圆Ci,圆的初始半径用Ri表示。
步骤22,设定圆的初始半径。将图片集内的图片分别与一个标号的圆所对应,其对应的复杂度为
其中

步骤23,圆填充方法对展示面板区域进行圆填充。如图2所示获得圆的初始圆心位置和初始半径后,在保证圆与圆之间不相交并且所有圆在展示面板的区域内的前提下,对所有圆进行同比例放大,放大完成后,动态调整圆心位置,重复执行放大调整过程,直至无法继续放大时,停止该过程,获得在展示面板区域内圆的紧致排列,此时对应的圆统一缩放因子k=186.625,圆C1~圆C5的最终位置如图2所示。
步骤24,展示面板的子区域划分,得到每幅图片的显示空间。根据步骤23获得的显示区域内圆的紧致排列结果,一个圆与其邻接圆之间的公切线可以构成该圆的外切多边形,针对圆与邻接圆之间不相切的情况,本方法选取与两个圆连线相垂直平分线来参与多边形的构成。所获得的多边形构成了展示面板的子区域划分,如图2中虚线划分所示,其中包含圆Ci的多边形Qp即是与其相关联的图片所对应的显示空间。Step 24, divide the sub-regions of the display panel to obtain the display space of each picture. According to the result of compact arrangement of circles in the display area obtained in
步骤3中,如图3所示确定图片朝向角、坐标和缩放尺度等显示参数,使每幅图片能在其对应的展示面板有限大小的显示区域内最大化的呈现其重要内容。In step 3, as shown in Figure 3, determine the display parameters such as the orientation angle, coordinates, and zoom scale of the picture, so that each picture can maximize its important content within the limited display area of its corresponding display panel.
如图3所示,步骤3具体包括以下步骤:As shown in Figure 3, step 3 specifically includes the following steps:
步骤31,设定图片朝向角。本方法赋予每幅图片一个随机的朝向角θ,θ满足[-θm,θm]范围内的平均分布,其中θm为最大允许偏转角,本方法设置θm为30°,如图3所示,图3中“设定图片朝向”一步中设定图片的朝向角θ设置为30°。Step 31, setting the orientation angle of the picture. This method gives each picture a random orientation angle θ, θ satisfies the average distribution within the range of [-θm ,θm ], where θm is the maximum allowable deflection angle, and this method sets θm to 30°, as shown in Figure 3 As shown in Figure 3, set the orientation angle θ of the image to 30° in the step of "Setting the orientation of the image".
步骤32,确定坐标和缩放尺寸。Step 32, determine the coordinates and scaling size.
首先,获得图片重要度图。如图4中“图片重要度计算”一步所示,通过程明明等提出的方法计算图片的重要度图,获得的图片对应重要度图如图4中“重要度图”子区域所示,然后使用OpenCV中的人脸检测算法检测人脸区域,将该区域内重要度图的重要度值置为最大。First, obtain the image importance map. As shown in the "image importance calculation" step in Figure 4, the importance map of the picture is calculated by the method proposed by Cheng Mingming et al. Use the face detection algorithm in OpenCV to detect the face area, and set the importance value of the importance map in the area to the maximum.
然后,获得图片ROI区域。对获得的重要度图基于阈值0.618进行二值化处理,然后经过侵蚀与扩张操作获得若干个连通区域,按照连通区域面积由大至小排序后,如图4中“计算ROI区域近似多边形”所示,通过Sklansky,J.提出的最小凸包算法用一个凸多边形包围面积排序前三分之一的单连通区域,所得多边形Qr即为图片ROI区域,多边形如图4中“ROI区域”子区域内所示。Then, the image ROI area is obtained. Binarize the obtained importance map based on the threshold value of 0.618, and then obtain several connected regions through erosion and expansion operations, and sort them according to the area of the connected regions from large to small, as shown in "Calculation of ROI region approximation polygon" in Figure 4 As shown, through the minimum convex hull algorithm proposed by Sklansky, J., a convex polygon is used to enclose the first third of the singly connected regions in the sorted area, and the obtained polygon Qr is the image ROI region. The polygon is shown in the "ROI region" subsection in Figure 4 shown in the area.
最后,确定图片坐标和缩放尺度。如图3所示Qr和Qp分别表示图片ROI区域多边形和图片所对应的展示画板显示空间。首先,将Qr的重心Pr于Qp的中心位置,朝向角θ之前已经确定,该图片恰好完全覆盖展示空间时的缩放尺度即为缩放尺度的初始值。以Pr为原点构建平行于画板坐标系的笛卡尔坐标系O。然后,定义O中各象限内的信息丢失值S为在Qr内但不在Qp内的像素的重要度值的平均值。Stl,Str,Sbr和Sb1分别表示左上,右上,右下和左下四个象限内的信息丢失值。一个启发式的移动方向向量v由以下公式确定:Finally, determine the image coordinates and zoom scale. As shown in FIG. 3 , Qr and Qp represent the polygon of the ROI region of the picture and the display space of the display board corresponding to the picture, respectively. First, the center of gravity Pr of Qr is placed at the center of Qp , and the orientation angle θ has been determined before. The zoom scale when the picture just completely covers the display space is the initial value of the zoom scale. Construct a Cartesian coordinate system O parallel to the drawing board coordinate system with Pr as the origin. Then, define the information loss value S in each quadrant in O as the average value of the importance values of the pixels inQr but not inQp . Stl , Str , Sbr and Sb1 represent the information loss values in the upper left, upper right, lower right and lower left quadrants, respectively. A heuristic moving direction vector v is determined by the following formula:
v=((Stl+Sb1)-(Str+Sbr),(Stl+Str)-(Sbl+Sbr)) (12);v=((Stl +Sb1 )-(Str +Sbr ), (Stl +Str )-(Sbl +Sbr )) (12);
将v归一化为单位向量
其中r为每次图片的最大移动距离。据此分布取10个候选位置,并将图片移动到信息丢失值S最少的候选位置。在此新的位置上,将按照确定缩放尺度初始值的方法确定新的缩放尺度。Where r is the maximum moving distance of each picture. According to this distribution, take 10 candidate positions, and move the picture to the candidate position with the least information loss value S. At this new position, the new zoom scale will be determined in the same way as the initial value of the zoom scale.
以上搜索移动缩放步骤迭代进行若干次,当收敛或超过某一预定最大迭代次数限制(本方法设置为30次)后,停止迭代,图片坐标和缩放尺度确定完成。The above steps of searching, moving and zooming are iterated several times, and when convergence or exceeding a predetermined maximum number of iterations (this method is set to 30 times), the iteration is stopped, and the image coordinates and zoom scale are determined.
步骤4中,如图4“基于重要度图信息的无缝混合渲染”一步所示,将图片的重要度信息结合进入混合过程,得到最终剪切拼接结果。In
对展示面板上的每一个像素点,均关联一组概率{Prob1(p),Prob2(p),…,Probn(p)},其中n为图片总数,Probi(p)表示第i幅图片在该像素点处对应像素能够显示的概率。Qpi和Qri分别第i幅图片对应的展示面板展示空间和其ROI区域。混合可以使得Qri中不在Qpi中的部分也能得到一定程度上的展现,Probi(p)计算公式如下:For each pixel on the display panel, a set of probabilities {Prob1 (p), Prob2 (p), ..., Probn (p)} are associated, where n is the total number of pictures, and Probi (p) represents the The probability that the corresponding pixel of the i picture at the pixel point can be displayed. Qpi and Qri are the display panel display space and its ROI area corresponding to the i-th picture, respectively. Mixing can make the parts of Qri that are not in Qpi also be displayed to a certain extent. The calculation formula ofProbi (p) is as follows:
实施例Example
本实施例用于测试的硬件环境是:Intel-Core2Duo4.2GHz处理器,4G内存。软件环境是

本实施例根据输入图片集的图片数量的不同,拼贴的时间消耗在几秒到几十秒不等,主要的计算时间消耗在人脸检测和重要度图计算部分。同时还将本方法的实验结果与Photo Gallery套件中的“自动拼贴”功能(AutoCollage)获得的结果进行了用户调查。124位计算机系的同学参与了双盲的用户调查,在没有其他外界干预的前提下靠自己的判断来选择更符合自己审美的结果。图5显示了用户调查的反馈结果,调查结果已经进行了归一化处理,用百分比来展示用户的偏好,左侧黑色柱体表示选择本实施例生成结果的用户占总人数的百分比,右侧白色柱体表示选择AutoCollage生成结果的用户占总人数的百分比。具体参见,动物(图6本实施例动物图片集的实施例最终生成结果示意图)、玩偶(图13a为玩偶图片集的AutoCollage最终生成结果示意图,图13b为玩偶图片集的本实施例最终生成结果示意图)、足球运动员(图12a为足球运动员图片集的AutoCollage最终生成结果示意图,图12b为足球运动员图片集的本实施例最终生成结果示意图)、酒杯、动画海报(图7本实施例动画海报图片集的实施例最终生成结果示意图、猫狗、小孩(图8为小孩图片集的实施例最终生成结果示意图)、花卉(图9为花卉图片集的实施例最终生成结果示意图)、灰衣女生;对应的结果比依次为:61.3%:38.7%,66.1%:33.9%,80.8%:19.2%,69.6%:30.4%,77.8%:22.2%,59.5%:40.5%,69.8%:30.2%,75.4%:24.6%,58.0%:42.0%。In this embodiment, depending on the number of pictures in the input picture set, the collage time consumption ranges from several seconds to tens of seconds, and the main calculation time is consumed in face detection and importance map calculation. At the same time, the experimental results of this method and the A user survey was conducted on the results obtained by the "Auto Collage" function (AutoCollage) in the Photo Gallery suite. 124 students from the Department of Computer Science participated in the double-blind user survey, relying on their own judgment to choose the result that is more in line with their own aesthetics without other external intervention. Figure 5 shows the feedback results of the user survey. The survey results have been normalized, and the user preferences are displayed in percentages. The black column on the left indicates the percentage of the total number of users who choose the results generated by this embodiment, and the right The white column indicates the percentage of users who choose AutoCollage to generate results. For details, see, animals (Figure 6 is a schematic diagram of the final generation result of the animal picture collection in this embodiment), dolls (Figure 13a is a schematic diagram of the final generation result of AutoCollage for the doll picture collection, and Figure 13b is the final generation result of the doll picture collection in this embodiment Schematic diagram), football player (Figure 12a is a schematic diagram of the final AutoCollage generated result of the football player picture collection, and Figure 12b is a schematic diagram of the final generated result of the football player picture collection in this embodiment), wine glasses, animated posters (Figure 7 is the animation poster picture of this embodiment Schematic diagram of the final generation result of the embodiment of the set, cats and dogs, children (Figure 8 is a schematic diagram of the final generation result of the embodiment of the child picture collection), flowers (Figure 9 is a schematic diagram of the final generation result of the embodiment of the flower picture collection), girls in gray clothes; The corresponding result ratios are: 61.3%: 38.7%, 66.1%: 33.9%, 80.8%: 19.2%, 69.6%: 30.4%, 77.8%: 22.2%, 59.5%: 40.5%, 69.8%: 30.2%, 75.4 %: 24.6%, 58.0%: 42.0%.
图5为用户调查结果用户调查结果显示,所有9组结果对于AutoCollage生成的结果都有不同程度的优势,第三组足球运动员的结果比较达到了80.8%比19.2%。两种方法最终获得的图片比对如图12a、图12b,以及图13a、图13b所示。用户调查的结果也表明了大部分用户倾向于选择本方法生成的图片集拼接结果。在用户的调查问卷上,还设置有“选择理由”这一条选答项,从回答该问题的用户意见来看,大部分选择本方法的理由都是集中在以下两个:Figure 5 shows the user survey results. The user survey results show that all 9 groups of results have different degrees of advantages over the results generated by AutoCollage, and the comparison of the results of the third group of football players reached 80.8% vs. 19.2%. The comparison of the pictures finally obtained by the two methods is shown in Fig. 12a, Fig. 12b, and Fig. 13a, Fig. 13b. The results of the user survey also show that most users tend to choose the splicing result of the image collection generated by this method. In the user questionnaire, there is also an optional answer item of "reason for choice". Judging from the opinions of users who answered this question, most of the reasons for choosing this method are concentrated in the following two:
1,本方法生成的图片排列错落有致,相对于AutoCollage生成结果死板的排列更加自然、随意,令人赏心悦目。这一点从图12a和图12b以及图13a和图13b的比较可以看出,AutoCollage的结果排布是每一行的子区域基本在同一条水平线上,而本方法的排布由于圆填充方法进行区域划分获得了更加灵活的区域排布;1. The arrangement of the pictures generated by this method is well arranged, which is more natural, random and pleasing to the eye than the rigid arrangement of the results generated by AutoCollage. This point can be seen from the comparison of Figure 12a and Figure 12b and Figure 13a and Figure 13b. The result of AutoCollage is that the sub-regions of each row are basically on the same horizontal line, and the arrangement of this method is due to the circle filling method. The division has obtained a more flexible area arrangement;
2,本方法生成的图片中人脸或者物体遮挡的情况均好于AutoCollage的生成结果。人脸的遮挡对比可以在图12a和图12b的例子中得以体现;2. The occlusion of faces or objects in the pictures generated by this method is better than that of AutoCollage. The occlusion comparison of human faces can be reflected in the examples in Figure 12a and Figure 12b;
图10和图11为在给定展示面板形状分别为菱形和椭圆形时,本实施例获得的最终结果,而AutoCollage仅支持三种尺寸下的矩形展示面板。Fig. 10 and Fig. 11 show the final results obtained in this embodiment when the given display panel shapes are rhombus and ellipse respectively, while AutoCollage only supports rectangular display panels in three sizes.
由于用户调查时无法让用户现场感受本方法与AutoCollage的图片集拼贴生成速度,本方法的处理速度优势和其他仅通过最后拼贴结果无法获得的优势也就没办法通过用户调查来获得体现。Since the user survey cannot allow users to experience the collage generation speed of this method and AutoCollage's photo collection on the spot, the processing speed advantage of this method and other advantages that cannot be obtained only through the final collage result cannot be reflected through user surveys.
Claims (5)
Translated fromChinese


Priority Applications (1)
| Application Number | Priority Date | Filing Date | Title |
|---|---|---|---|
| CN201310022329.3ACN103093447B (en) | 2013-01-18 | 2013-01-18 | Cutting and splicing method of concentration of pictures of computer |
Applications Claiming Priority (1)
| Application Number | Priority Date | Filing Date | Title |
|---|---|---|---|
| CN201310022329.3ACN103093447B (en) | 2013-01-18 | 2013-01-18 | Cutting and splicing method of concentration of pictures of computer |
Publications (2)
| Publication Number | Publication Date |
|---|---|
| CN103093447Atrue CN103093447A (en) | 2013-05-08 |
| CN103093447B CN103093447B (en) | 2015-06-03 |
Family
ID=48205981
Family Applications (1)
| Application Number | Title | Priority Date | Filing Date |
|---|---|---|---|
| CN201310022329.3AExpired - Fee RelatedCN103093447B (en) | 2013-01-18 | 2013-01-18 | Cutting and splicing method of concentration of pictures of computer |
Country Status (1)
| Country | Link |
|---|---|
| CN (1) | CN103093447B (en) |
Cited By (11)
| Publication number | Priority date | Publication date | Assignee | Title |
|---|---|---|---|---|
| CN103927115A (en)* | 2014-03-17 | 2014-07-16 | 联想(北京)有限公司 | Information processing method and electronic equipment |
| CN105577891A (en)* | 2014-10-11 | 2016-05-11 | 北大方正集团有限公司 | Mobile phone screen setting method and device |
| CN105913377A (en)* | 2016-03-24 | 2016-08-31 | 南京大学 | Image splicing method for reserving image correlation information |
| CN105957012A (en)* | 2016-05-31 | 2016-09-21 | 青岛海信移动通信技术股份有限公司 | Picture splicing method and mobile terminal |
| CN106210560A (en)* | 2016-07-17 | 2016-12-07 | 合肥赑歌数据科技有限公司 | Video-splicing method based on manifold |
| CN106227825A (en)* | 2016-07-22 | 2016-12-14 | 努比亚技术有限公司 | A kind of image display apparatus and method |
| CN106570824A (en)* | 2016-10-12 | 2017-04-19 | 网易(杭州)网络有限公司 | Splicing method and device for scattered graphs |
| CN108154515A (en)* | 2017-12-27 | 2018-06-12 | 三星电子(中国)研发中心 | Picture shows method and apparatus |
| CN109584365A (en)* | 2018-11-29 | 2019-04-05 | 中国科学院地理科学与资源研究所 | A kind of Voronoi diagram geological layering model building method calculated with Yu Haiyang's land reclamation engineering earth volume cost |
| CN111553842A (en)* | 2020-04-24 | 2020-08-18 | 京东方科技集团股份有限公司 | Spliced picture display method and device, electronic equipment and storage medium |
| US11830235B2 (en) | 2019-01-09 | 2023-11-28 | Samsung Electronics Co., Ltd | Image optimization method and system based on artificial intelligence |
Citations (4)
| Publication number | Priority date | Publication date | Assignee | Title |
|---|---|---|---|---|
| CN101111841A (en)* | 2005-01-28 | 2008-01-23 | 皇家飞利浦电子股份有限公司 | Dynamic Photo Collage |
| US20080075390A1 (en)* | 2006-09-22 | 2008-03-27 | Fuji Xerox Co., Ltd. | Annealing algorithm for non-rectangular shaped stained glass collages |
| US20090015869A1 (en)* | 2005-03-22 | 2009-01-15 | Su Mien Quek | Image collage builder |
| US20110096075A1 (en)* | 2009-10-22 | 2011-04-28 | ScrapWalls, LLC | Method, system and computer program product for creating shape collages |
- 2013
- 2013-01-18CNCN201310022329.3Apatent/CN103093447B/ennot_activeExpired - Fee Related
Patent Citations (4)
| Publication number | Priority date | Publication date | Assignee | Title |
|---|---|---|---|---|
| CN101111841A (en)* | 2005-01-28 | 2008-01-23 | 皇家飞利浦电子股份有限公司 | Dynamic Photo Collage |
| US20090015869A1 (en)* | 2005-03-22 | 2009-01-15 | Su Mien Quek | Image collage builder |
| US20080075390A1 (en)* | 2006-09-22 | 2008-03-27 | Fuji Xerox Co., Ltd. | Annealing algorithm for non-rectangular shaped stained glass collages |
| US20110096075A1 (en)* | 2009-10-22 | 2011-04-28 | ScrapWalls, LLC | Method, system and computer program product for creating shape collages |
Non-Patent Citations (1)
| Title |
|---|
| 钱亮于,高世伟,柴珠利: "基于EMD度量的图像匹配技术", 《计算机工程与设计》, vol. 29, no. 11, 30 June 2008 (2008-06-30)* |
Cited By (16)
| Publication number | Priority date | Publication date | Assignee | Title |
|---|---|---|---|---|
| CN103927115B (en)* | 2014-03-17 | 2017-03-22 | 联想(北京)有限公司 | Information processing method and electronic equipment |
| CN103927115A (en)* | 2014-03-17 | 2014-07-16 | 联想(北京)有限公司 | Information processing method and electronic equipment |
| CN105577891B (en)* | 2014-10-11 | 2018-12-21 | 北大方正集团有限公司 | Mobile phone screen setting method, device and mobile phone terminal |
| CN105577891A (en)* | 2014-10-11 | 2016-05-11 | 北大方正集团有限公司 | Mobile phone screen setting method and device |
| CN105913377A (en)* | 2016-03-24 | 2016-08-31 | 南京大学 | Image splicing method for reserving image correlation information |
| CN105913377B (en)* | 2016-03-24 | 2018-10-16 | 南京大学 | A kind of picture joining method retaining picture correlation information |
| CN105957012A (en)* | 2016-05-31 | 2016-09-21 | 青岛海信移动通信技术股份有限公司 | Picture splicing method and mobile terminal |
| CN106210560A (en)* | 2016-07-17 | 2016-12-07 | 合肥赑歌数据科技有限公司 | Video-splicing method based on manifold |
| CN106227825A (en)* | 2016-07-22 | 2016-12-14 | 努比亚技术有限公司 | A kind of image display apparatus and method |
| CN106570824A (en)* | 2016-10-12 | 2017-04-19 | 网易(杭州)网络有限公司 | Splicing method and device for scattered graphs |
| CN108154515A (en)* | 2017-12-27 | 2018-06-12 | 三星电子(中国)研发中心 | Picture shows method and apparatus |
| CN109584365A (en)* | 2018-11-29 | 2019-04-05 | 中国科学院地理科学与资源研究所 | A kind of Voronoi diagram geological layering model building method calculated with Yu Haiyang's land reclamation engineering earth volume cost |
| CN109584365B (en)* | 2018-11-29 | 2022-05-10 | 中国科学院地理科学与资源研究所 | A Voronoi Diagram Geological Hierarchical Model Construction Method for Earthwork Cost Accounting of Ocean Reclamation and Land Reclamation Engineering |
| US11830235B2 (en) | 2019-01-09 | 2023-11-28 | Samsung Electronics Co., Ltd | Image optimization method and system based on artificial intelligence |
| CN111553842A (en)* | 2020-04-24 | 2020-08-18 | 京东方科技集团股份有限公司 | Spliced picture display method and device, electronic equipment and storage medium |
| CN111553842B (en)* | 2020-04-24 | 2024-03-12 | 京东方科技集团股份有限公司 | Spliced picture display method and device, electronic equipment and storage medium |
Also Published As
| Publication number | Publication date |
|---|---|
| CN103093447B (en) | 2015-06-03 |
Similar Documents
| Publication | Publication Date | Title |
|---|---|---|
| CN103093447B (en) | Cutting and splicing method of concentration of pictures of computer | |
| US20200374600A1 (en) | Method for Embedding Advertisement in Video and Computer Device | |
| CN104834898B (en) | A kind of quality classification method of personage's photographs | |
| Feixas et al. | A unified information-theoretic framework for viewpoint selection and mesh saliency | |
| Hartmann | Streetgan: Towards road network synthesis with generative adversarial networks | |
| Lo et al. | Assessment of photo aesthetics with efficiency | |
| CN105913377B (en) | A kind of picture joining method retaining picture correlation information | |
| US20150310305A1 (en) | Learning painting styles for painterly rendering | |
| CN115661628A (en) | A Fish Detection Method Based on Improved YOLOv5S Model | |
| Song et al. | Mesh saliency via weakly supervised classification-for-saliency CNN | |
| Dong et al. | Image retargeting by texture-aware synthesis | |
| CN107944428A (en) | A kind of indoor scene semanteme marking method based on super-pixel collection | |
| CN107392085A (en) | The method for visualizing convolutional neural networks | |
| CN102129576B (en) | Method for extracting duty ratio parameter of all-sky aurora image | |
| CN101329768A (en) | Method of Synthesizing Cartoon Animation Based on Background View | |
| Hua et al. | SHREC’17: RGB-D to CAD retrieval with ObjectNN dataset | |
| CN106340024B (en) | A kind of image partition method, application and calculate equipment | |
| Li et al. | Single annotated pixel based weakly supervised semantic segmentation under driving scenes | |
| Duan et al. | Boosting associated pairing comparison features for pedestrian detection | |
| Wu et al. | A hybrid image retargeting approach via combining seam carving and grid warping | |
| CN116434220B (en) | Three-dimensional object classification method and system based on descriptor and AdaBoost algorithm | |
| Liu et al. | Energy-based global ternary image for action recognition using sole depth sequences | |
| Zhang et al. | Multiple feature distinctions based saliency flow model | |
| Micusik et al. | Multi-label image segmentation via max-sum solver | |
| Rinnewitz et al. | Automatic creation and application of texture patterns to 3D polygon maps |
Legal Events
| Date | Code | Title | Description |
|---|---|---|---|
| C06 | Publication | ||
| PB01 | Publication | ||
| C10 | Entry into substantive examination | ||
| SE01 | Entry into force of request for substantive examination | ||
| C14 | Grant of patent or utility model | ||
| GR01 | Patent grant | ||
| CF01 | Termination of patent right due to non-payment of annual fee | ||
| CF01 | Termination of patent right due to non-payment of annual fee | Granted publication date:20150603 Termination date:20180118 |