CN102973279A - Near-infrared brain-machine interface signal detection method integrating independent component analysis and least square method - Google Patents
Near-infrared brain-machine interface signal detection method integrating independent component analysis and least square methodDownload PDFInfo
- Publication number
- CN102973279A CN102973279ACN2012105519561ACN201210551956ACN102973279ACN 102973279 ACN102973279 ACN 102973279ACN 2012105519561 ACN2012105519561 ACN 2012105519561ACN 201210551956 ACN201210551956 ACN 201210551956ACN 102973279 ACN102973279 ACN 102973279A
- Authority
- CN
- China
- Prior art keywords
- lambda
- brain
- detector
- epsiv
- wavelength
- Prior art date
- Legal status (The legal status is an assumption and is not a legal conclusion. Google has not performed a legal analysis and makes no representation as to the accuracy of the status listed.)
- Granted
Links
- 238000001514detection methodMethods0.000titleclaimsabstractdescription40
- 238000000034methodMethods0.000titleclaimsabstractdescription21
- 238000012880independent component analysisMethods0.000titleclaimsabstractdescription19
- 210000004556brainAnatomy0.000claimsabstractdescription56
- 230000003287optical effectEffects0.000claimsabstractdescription27
- 108010054147HemoglobinsProteins0.000claimsabstractdescription25
- 102000001554HemoglobinsHuman genes0.000claimsabstractdescription25
- 230000008859changeEffects0.000claimsabstractdescription19
- 108010064719OxyhemoglobinsProteins0.000claimsabstractdescription15
- 230000000004hemodynamic effectEffects0.000claimsdescription23
- 239000011159matrix materialSubstances0.000claimsdescription23
- 230000008033biological extinctionEffects0.000claimsdescription12
- 239000000523sampleSubstances0.000claimsdescription10
- 238000005259measurementMethods0.000claimsdescription5
- 210000004761scalpAnatomy0.000claimsdescription5
- 238000000926separation methodMethods0.000claimsdescription5
- 210000003128headAnatomy0.000claimsdescription4
- 239000000203mixtureSubstances0.000claimsdescription3
- 230000002490cerebral effectEffects0.000claims2
- 230000002452interceptive effectEffects0.000claims2
- 230000035479physiological effects, processes and functionsEffects0.000claims2
- 238000006243chemical reactionMethods0.000claims1
- 238000002360preparation methodMethods0.000claims1
- 230000001932seasonal effectEffects0.000claims1
- 230000003925brain functionEffects0.000abstractdescription13
- 230000000763evoking effectEffects0.000abstractdescription9
- 230000000694effectsEffects0.000abstractdescription6
- 238000000605extractionMethods0.000abstractdescription4
- 230000000875corresponding effectEffects0.000description16
- 230000005284excitationEffects0.000description14
- 210000005013brain tissueAnatomy0.000description8
- 210000003710cerebral cortexAnatomy0.000description5
- 230000001186cumulative effectEffects0.000description5
- 238000011160researchMethods0.000description5
- 238000005516engineering processMethods0.000description4
- 238000004497NIR spectroscopyMethods0.000description3
- 238000004891communicationMethods0.000description3
- 230000010355oscillationEffects0.000description3
- 238000004458analytical methodMethods0.000description2
- 210000001175cerebrospinal fluidAnatomy0.000description2
- 230000006870functionEffects0.000description2
- 210000004884grey matterAnatomy0.000description2
- 210000003205muscleAnatomy0.000description2
- 230000029058respiratory gaseous exchangeEffects0.000description2
- 210000003625skullAnatomy0.000description2
- 210000004885white matterAnatomy0.000description2
- 239000006096absorbing agentSubstances0.000description1
- 238000010521absorption reactionMethods0.000description1
- 238000000862absorption spectrumMethods0.000description1
- QVGXLLKOCUKJST-UHFFFAOYSA-Natomic oxygenChemical compound[O]QVGXLLKOCUKJST-UHFFFAOYSA-N0.000description1
- 239000008280bloodSubstances0.000description1
- 210000004369bloodAnatomy0.000description1
- 230000007177brain activityEffects0.000description1
- 239000002131composite materialSubstances0.000description1
- 230000002596correlated effectEffects0.000description1
- 238000009795derivationMethods0.000description1
- 238000011161developmentMethods0.000description1
- 238000010586diagramMethods0.000description1
- 238000000537electroencephalographyMethods0.000description1
- 230000037149energy metabolismEffects0.000description1
- 230000010247heart contractionEffects0.000description1
- 238000002582magnetoencephalographyMethods0.000description1
- 238000000691measurement methodMethods0.000description1
- 210000001640nerve endingAnatomy0.000description1
- 210000002569neuronAnatomy0.000description1
- 229910052760oxygenInorganic materials0.000description1
- 239000001301oxygenSubstances0.000description1
- 210000000578peripheral nerveAnatomy0.000description1
- 230000001766physiological effectEffects0.000description1
- 238000002600positron emission tomographyMethods0.000description1
- 230000008569processEffects0.000description1
- 230000004044responseEffects0.000description1
- 238000004611spectroscopical analysisMethods0.000description1
- 230000002269spontaneous effectEffects0.000description1
- 230000002123temporal effectEffects0.000description1
- 210000001519tissueAnatomy0.000description1
Images
Landscapes
- Measurement Of The Respiration, Hearing Ability, Form, And Blood Characteristics Of Living Organisms (AREA)
Abstract
Translated fromChinese


Description
Translated fromChinese技术领域technical field
本发明涉及独立成分分析联合最小二乘法的近红外脑机接口的信号检测方法,属于血红蛋白浓度检测技术领域。The invention relates to a signal detection method of a near-infrared brain-computer interface based on an independent component analysis combined with a least square method, and belongs to the technical field of hemoglobin concentration detection.
背景技术Background technique
脑机接口是一种由人脑与计算机或其它电子设备建立起来的,基于大脑功能的电生理测量,而不依赖于外周神经和肌肉组织这些常规的人脑信息输出通道,实现人与外界信息交流和控制的全新通讯系统。通过分析脑信号将用户的运动等意图转换为语言、设备的控制输入量等,使用户直接通过脑信号与外面的环境进行实时的交互,从而绕开了人类神经末梢和肌肉等通常的信息通道,建立能直接“让思想变成行动”的对外信息交流和控制新途径。Brain-computer interface is a kind of electrophysiological measurement based on brain function, which is established by human brain and computer or other electronic equipment, without relying on the conventional human brain information output channels such as peripheral nerves and muscle tissues, to realize the communication between human and the outside world. New communication system for communication and control. By analyzing the brain signal, the user's movement and other intentions are converted into language, equipment control input, etc., so that the user can directly interact with the external environment through the brain signal in real time, thus bypassing the usual information channels such as human nerve endings and muscles. , Establish a new way of external information exchange and control that can directly "turn ideas into actions".
目前,脑机接口研究的基本方法是提取并识别特定意识活动的脑功能状态特征信息,现有的主要技术包括脑电图、脑磁图、正电子放射层扫描术、功能磁共振。基于神经元的活动、局部能量代谢与局部血液动力学之间存在着一定的关系,通过测量脑组织对近红外光波的吸收特性,能够提供基于氧合血红蛋白和还原血红蛋白浓度等信息的血液动力学变化。因此,利用近红外光谱技术测量该区域光学参数、血氧及血液动力学参数信息,可以获取大脑皮质在肢体运动、视觉、听觉、触觉以及语言等刺激激励时的功能响应,用于脑机接口的研究。功能近红外光谱技术可以安全、便携、经济以及非侵入式的检测脑活动等特性,基于较高的时间分辨率和合理的空间分辨率,在脑机接口研究中具有一定的发展潜力。At present, the basic method of brain-computer interface research is to extract and identify the characteristic information of brain function status of specific conscious activities. The main existing technologies include electroencephalography, magnetoencephalography, positron emission tomography, and functional magnetic resonance. Based on the relationship between neuron activity, local energy metabolism and local hemodynamics, by measuring the absorption characteristics of brain tissue to near-infrared light waves, hemodynamics based on information such as oxygenated hemoglobin and reduced hemoglobin concentrations can be provided Variety. Therefore, by using near-infrared spectroscopy to measure the optical parameters, blood oxygen and hemodynamic parameters in this area, the functional response of the cerebral cortex to stimuli such as limb movement, vision, hearing, touch and language can be obtained for brain-computer interface Research. Functional near-infrared spectroscopy technology can detect brain activity in a safe, portable, economical and non-invasive manner. Based on high temporal resolution and reasonable spatial resolution, it has certain development potential in the research of brain-computer interface.
然而,通过近红外光谱技术进行诱发激励时脑功能活动的检测,会受到人体的生理活动如心脏跳动、呼吸、低频振荡、超低频振荡的影响,称之为生理干扰。这种生理干扰不但出现在头皮、颅骨和脑脊液等外层脑组织中,也出现在脑灰质和脑白质等深层脑组织中,这些原因会使得近红外脑机接口检测获得的氧合血红蛋白浓度变化和还原血红蛋白浓度变化量不准确,进而严重影响脑功能活动信号的准确提取。However, the detection of brain function activities when induced by near-infrared spectroscopy technology will be affected by the physiological activities of the human body, such as heart beating, breathing, low-frequency oscillations, and ultra-low-frequency oscillations, which are called physiological interference. This physiological interference not only occurs in outer brain tissues such as scalp, skull, and cerebrospinal fluid, but also in deep brain tissues such as gray matter and white matter. These reasons will cause changes in the concentration of oxyhemoglobin detected by the near-infrared brain-computer interface. Inaccurate changes in concentration and reduced hemoglobin concentration will seriously affect the accurate extraction of brain function activity signals.
发明内容Contents of the invention
本发明是为了解决近红外脑机接口检测中由于人体生理干扰造成检测获得的氧合血红蛋白浓度变化和还原血红蛋白浓度变化量不准确,而影响脑功能活动信号准确提取的问题,提供了一种独立成分分析联合最小二乘法的近红外脑机接口的信号检测方法。The present invention aims to solve the problem that in the detection of the near-infrared brain-computer interface, the concentration change of oxyhemoglobin and the concentration change of reduced hemoglobin obtained by the detection are inaccurate due to the physiological interference of the human body, which affects the accurate extraction of brain function activity signals, and provides an independent Signal detection method for near-infrared brain-computer interface based on component analysis combined with least squares method.
本发明所述独立成分分析联合最小二乘法的近红外脑机接口的信号检测方法,它包括以下步骤:The signal detection method of the near-infrared brain-computer interface of the independent component analysis combined least square method of the present invention, it comprises the following steps:
步骤一:采用近红外探头靠近待检测头部的头皮表面,使得该近红外探头发射的近红外光入射至待测脑组织,该近红外探头由双波长光源S、检测器D1和检测器D2构成,其中双波长光源S到检测器D1之间的直线距离为r1,5mm≤r1≤15mm,双波长光源S到检测器D2之间的直线距离为r2,30mm≤r2≤45mm;检测器D1用于感应外层脑组织的血液动力学变化,检测器D2用于感应大脑皮质的血液动力学变化;Step 1: Use a near-infrared probe close to the scalp surface of the head to be detected, so that the near-infrared light emitted by the near-infrared probe is incident on the brain tissue to be tested. The near-infrared probe is composed of a dual-wavelength light source S, a detector D1 and a detector D2 Composition, wherein the straight-line distance between the dual-wavelength light source S and the detector D1 is r1 , 5mm≤r1 ≤15mm, and the straight-line distance between the dual-wavelength light source S and the detector D2 is r2 , 30mm≤r2 ≤45mm ; The detector D1 is used to sense the hemodynamic changes of the outer brain tissue, and the detector D2 is used to sense the hemodynamic changes of the cerebral cortex;
步骤二:通过检测器D1记录大脑安静状态下的漫反射光强和大脑处于诱发激励状态下的漫反射光强,获得大脑安静状态下双波长光源S波长为λ1时、对应的漫反射光的光密度变化量的时间序列

通过检测器D2记录大脑安静状态下的漫反射光强和大脑处于诱发激励状态下的漫反射光强,获得大脑安静状态下双波长光源S波长为λ1时、对应的漫反射光的光密度变化量的时间序列

k为获得时间序列的点数,k=1,2,...,M,M为正整数;k is the number of points to obtain the time series, k=1, 2,..., M, M is a positive integer;
步骤三:根据步骤二中获得的时间序列

其中,εHHb(λ1)为双波长光源S的波长为λ1时还原血红蛋白的消光系数,Wherein, εHHb (λ1 ) is the extinction coefficient of reduced hemoglobin when the wavelength of the dual-wavelength light source S is λ1 ,
εHHb(λ2)为双波长光源S的波长为λ2时还原血红蛋白的消光系数,εHHb (λ2 ) is the extinction coefficient of reduced hemoglobin when the wavelength of the dual-wavelength light source S is λ2 ,
为双波长光源S的波长为λ1时氧合血红蛋白的消光系数, is the extinction coefficient of oxyhemoglobin when the wavelength of the dual-wavelength light source S isλ1 ,

DPF为差分路径因子;DPF is the differential path factor;
根据步骤二中获得的时间序列

步骤四:用x1(k)表示步骤三中的Δ[HbO2]F(k)或Δ[HHb]F(k),将x1(k)作为脑机接口检测中的测量通道信号,x1(k)扩展至加噪模型为:Step 4: Use x1 (k) to represent Δ[HbO2 ]F (k) or Δ[HHb]F (k) in step 3, and use x1 (k) as the measurement channel signal in the brain-computer interface detection, The extension of x1 (k) to the noise-added model is:
x1(k)=s(k)+n(k),x1 (k)=s(k)+n(k),
其中s(k)为脑机接口信号中的血液动力学信号,n(k)为生理干扰信号;Among them, s(k) is the hemodynamic signal in the brain-computer interface signal, and n(k) is the physiological interference signal;
用x2(k)表示步骤三中的Δ[HbO2]N(k)或Δ[HHb]N(k),作为脑机接口检测中的虚拟通道信号,则有观测矩阵x:Use x2 (k) to represent Δ[HbO2 ]N (k) or Δ[HHb]N (k) in step 3, as the virtual channel signal in BCI detection, then there is the observation matrix x:
其中,x1为整个观测的时间序列x1(k),是一维相量;Among them, x1 is the time series x1 (k) of the entire observation, which is a one-dimensional phasor;
x2为整个观测的时间序列x2(k),是一维相量,即检测器D2检测的生理干扰混合相量u;x2 is the time series x2 (k) of the entire observation, which is a one-dimensional phasor, that is, the physiological disturbance mixed phasor u detected by the detector D2;
s为血液动力学信号的整个时间序列;s is the entire time series of the hemodynamic signal;
n为整个观测的时间序列x1(k)中混叠的噪声,n is the noise aliased in the entire observed time series x1 (k),
a为检测器D2检测获得的干扰信号与检测器D1检测获得信号的比例权值;a is the proportional weight of the interference signal obtained by the detection of the detector D2 and the signal obtained by the detection of the detector D1;
A为混合矩阵,A is the mixing matrix,
r为分离的脑机接口信号和噪声组成的相量;r is the phasor composed of the separated BMI signal and noise;
步骤五、用独立成分分析ICA算法,在混合矩阵A和血液动力学信号的整个时间序列s未知的情况下,根据观测矩阵x确定分离矩阵W,使得变换后的输出Y=Wx;Step 5, using the independent component analysis ICA algorithm, in the case where the mixing matrix A and the entire time series s of the hemodynamic signal are unknown, the separation matrix W is determined according to the observation matrix x, so that the transformed output Y=Wx;
步骤六、根据步骤五中的Y=Wx推算出二维矩阵,两行分别表示为l和d,l和d分别与s和u满足线性相关条件,用bl(k)+c作为s(k)的最优估计,则残差e(k)为:Step 6, calculate the two-dimensional matrix according to Y=Wx in the step 5, and two rows are represented as l and d respectively, and l and d satisfy the linear correlation condition with s and u respectively, use bl(k)+c as s(k ), the residual e(k) is:
e(k)=x1(k)-bl(k)-c;e(k)=x1 (k)-bl(k)-c;
步骤七、利用最小二乘算法,采用残差e(k)的累计平方误差性能函数J作为代价函数:Step 7. Using the least squares algorithm, the cumulative square error performance function J of the residual e(k) is used as the cost function:
求取使J最小的系数b和c,再将求取的系数b和c带入步骤六中的bl(k)+c公式中,即可获得脑机接口信号中的血液动力学信号s(k)。Find the coefficients b and c that minimize J, and then bring the obtained coefficients b and c into the formula bl(k)+c in step 6 to obtain the hemodynamic signal s( k).
步骤二中光密度变化量的时间序列和光密度变化量的时间序列
其中:


步骤二中光密度变化量的时间序列

其中:


步骤七中残差e(k)的获得方法为:The method of obtaining the residual e(k) in step 7 is:
首先,通过最小二乘估计准则表示使残差e(k)的累计平方误差性能函数J最小,J表示为:First, the cumulative square error performance function J of the residual e(k) is expressed by the least square estimation criterion, and J is expressed as:
其次,求解最优系数b和c:Second, solve for the optimal coefficients b and c:
对J相对于b,c求导,并将求导结果置为0,即:Calculate the derivative of J relative to b and c, and set the result of the derivative to 0, that is:
则:but:
最后,求解脑机接口信号中的血液动力学信号s(k):Finally, solve for the hemodynamic signal s(k) in the BCI signal:
s(k)=bl(k)+c。s(k)=bl(k)+c.
本发明的优点:本发明是针对近红外脑机接口研究过程中大脑特定区域氧合血红蛋白浓度变化Δ[HbO2]和还原血红蛋白浓度变化Δ[HHb]易受到心跳、呼吸及人体自发低频振荡噪声干扰的状况,在多距测量方法的基础上,考虑近端检测器D1获得的血液动力学参数和远端检测器D2受到的生理干扰具有相关性,通过独立成分分析算法对远端和近端检测器测量结果进行分解,并通过对分解的独立成分分量建立线性映射来估计测量信号中的脑功能信号。独立成分分析能将复合信号分解为一系列的独立成分分量,并且分解的独立成分分量具有很好的独立性,适用于盲源信号的分析。本发明通过用独立成分分析算法分解远端检测器和近端检测器测得的外层组织血液动力学参数,从而获得表示大脑皮质血液动力学参数的估计,实现对脑功能信号的准确提取。Advantages of the present invention: the present invention is aimed at the concentration change Δ[HbO2 ] of oxygenated hemoglobin and the change Δ[HHb] of reduced hemoglobin concentration in a specific area of the brain during the research process of the near-infrared brain-computer interface, which is susceptible to heartbeat, breathing and human spontaneous low-frequency oscillation noise The state of interference, on the basis of the multi-distance measurement method, considering the correlation between the hemodynamic parameters obtained by the near-end detector D1 and the physiological interference received by the far-end detector D2, the far-end and near-end The detector measurements are decomposed, and the brain function signal in the measured signal is estimated by building a linear map of the decomposed independent component components. Independent component analysis can decompose a composite signal into a series of independent components, and the decomposed independent components have good independence, which is suitable for the analysis of blind source signals. The invention decomposes the hemodynamic parameters of the outer layer tissue measured by the far-end detector and the near-end detector by using an independent component analysis algorithm, thereby obtaining an estimate representing the hemodynamic parameters of the cerebral cortex, and realizing accurate extraction of brain function signals.
附图说明Description of drawings
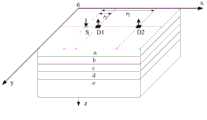
图1为近红外探头的检测状态示意图,其中a表示头皮,b表示颅骨,c表示脑脊液,d表示脑灰质,e表示脑白质。Figure 1 is a schematic diagram of the detection state of the near-infrared probe, where a represents the scalp, b represents the skull, c represents the cerebrospinal fluid, d represents the gray matter of the brain, and e represents the white matter of the brain.
具体实施方式Detailed ways
具体实施方式一:下面结合图1说明本实施方式,本实施方式所述独立成分分析联合最小二乘法的近红外脑机接口的信号检测方法,它包括以下步骤:Specific embodiment one: the present embodiment is described below in conjunction with FIG. 1 , the signal detection method of the near-infrared brain-computer interface of the independent component analysis combined with the least squares method described in the present embodiment, which includes the following steps:
步骤一:采用近红外探头靠近待检测头部的头皮表面,使得该近红外探头发射的近红外光入射至待测脑组织,该近红外探头由双波长光源S、检测器D1和检测器D2构成,其中双波长光源S到检测器D1之间的直线距离为r1,5mm≤r1≤15mm,双波长光源S到检测器D2之间的直线距离为r2,30mm≤r2≤45mm;检测器D1用于感应外层脑组织的血液动力学变化,检测器D2用于感应大脑皮质的血液动力学变化;Step 1: Use a near-infrared probe close to the scalp surface of the head to be detected, so that the near-infrared light emitted by the near-infrared probe is incident on the brain tissue to be tested. The near-infrared probe is composed of a dual-wavelength light source S, a detector D1 and a detector D2 Composition, wherein the straight-line distance between the dual-wavelength light source S and the detector D1 is r1 , 5mm≤r1 ≤15mm, and the straight-line distance between the dual-wavelength light source S and the detector D2 is r2 , 30mm≤r2 ≤45mm ; The detector D1 is used to sense the hemodynamic changes of the outer brain tissue, and the detector D2 is used to sense the hemodynamic changes of the cerebral cortex;
步骤二:通过检测器D1记录大脑安静状态下的漫反射光强和大脑处于诱发激励状态下的漫反射光强,获得大脑安静状态下双波长光源S波长为λ1时、对应的漫反射光的光密度变化量的时间序列

通过检测器D2记录大脑安静状态下的漫反射光强和大脑处于诱发激励状态下的漫反射光强,获得大脑安静状态下双波长光源S波长为λ1时、对应的漫反射光的光密度变化量的时间序列

k为获得时间序列的点数,k=1,2,...,M,M为正整数;k is the number of points to obtain the time series, k=1, 2,..., M, M is a positive integer;
步骤三:根据步骤二中获得的时间序列
其中,εHHb(λ1)为双波长光源S的波长为λ1时还原血红蛋白的消光系数,Wherein, εHHb (λ1 ) is the extinction coefficient of reduced hemoglobin when the wavelength of the dual-wavelength light source S is λ1 ,
εHHb(λ2)为双波长光源S的波长为λ2时还原血红蛋白的消光系数,εHHb (λ2 ) is the extinction coefficient of reduced hemoglobin when the wavelength of the dual-wavelength light source S is λ2 ,


DPF为差分路径因子;DPF is the differential path factor;
根据步骤二中获得的时间序列

步骤四:用x1(k)表示步骤三中的Δ[HbO2]F(k)或Δ[HHb]F(k),将x1(k)作为脑机接口检测中的测量通道信号,x1(k)扩展至加噪模型为:Step 4: Use x1 (k) to represent Δ[HbO2 ]F (k) or Δ[HHb]F (k) in step 3, and use x1 (k) as the measurement channel signal in the brain-computer interface detection, The extension of x1 (k) to the noise-added model is:
x1(k)=s(k)+n(k),x1 (k)=s(k)+n(k),
其中s(k)为脑机接口信号中的血液动力学信号,n(k)为生理干扰信号;Among them, s(k) is the hemodynamic signal in the brain-computer interface signal, and n(k) is the physiological interference signal;
用x2(k)表示步骤三中的Δ[HbO2]N(k)或Δ[HHb]N(k),作为脑机接口检测中的虚拟通道信号,则有观测矩阵x:Use x2 (k) to represent Δ[HbO2 ]N (k) or Δ[HHb]N (k) in step 3, as the virtual channel signal in BCI detection, then there is the observation matrix x:
其中,x1为整个观测的时间序列x1(k),是一维相量;Among them, x1 is the time series x1 (k) of the entire observation, which is a one-dimensional phasor;
x2为整个观测的时间序列x2(k),是一维相量,即检测器D2检测的生理干扰混合相量u;x2 is the time series x2 (k) of the entire observation, which is a one-dimensional phasor, that is, the physiological disturbance mixed phasor u detected by the detector D2;
s为血液动力学信号的整个时间序列;s is the entire time series of the hemodynamic signal;
n为整个观测的时间序列x1(k)中混叠的噪声,n is the noise aliased in the entire observed time series x1 (k),
a为检测器D2检测获得的干扰信号与检测器D1检测获得信号的比例权值;a is the proportional weight of the interference signal obtained by the detection of the detector D2 and the signal obtained by the detection of the detector D1;
A为混合矩阵,A is the mixing matrix,
r为分离的脑机接口信号和噪声组成的相量;r is the phasor composed of the separated BMI signal and noise;
步骤五、用独立成分分析ICA算法,在混合矩阵A和血液动力学信号的整个时间序列s未知的情况下,根据观测矩阵x确定分离矩阵W,使得变换后的输出Y=Wx;Step 5, using the independent component analysis ICA algorithm, in the case where the mixing matrix A and the entire time series s of the hemodynamic signal are unknown, the separation matrix W is determined according to the observation matrix x, so that the transformed output Y=Wx;
步骤六、根据步骤五中的Y=Wx推算出二维矩阵,两行分别表示为l和d,l和d分别与s和u满足线性相关条件,用bl(k)+c作为s(k)的最优估计,则残差e(k)为:Step 6, calculate the two-dimensional matrix according to Y=Wx in the step 5, and two rows are represented as l and d respectively, and l and d satisfy the linear correlation condition with s and u respectively, use bl(k)+c as s(k ), the residual e(k) is:
e(k)=x1(k)-bl(k)-c;e(k)=x1 (k)-bl(k)-c;
步骤七、利用最小二乘算法,采用残差e(k)的累计平方误差性能函数J作为代价函数:Step 7. Using the least squares algorithm, the cumulative square error performance function J of the residual e(k) is used as the cost function:
求取使J最小的系数b和c,再将求取的系数b和c带入步骤六中的bl(k)+c公式中,即可获得脑机接口信号中的血液动力学信号s(k)。Find the coefficients b and c that minimize J, and then bring the obtained coefficients b and c into the formula bl(k)+c in step 6 to obtain the hemodynamic signal s( k).
本实施方式中,x1(k)包含s(k)以及n(k),x2(k)为近距离光源检测器获得的血液动力学信息,主要为生理干扰信号且与x1(k)中噪声信号n(k)相关,从而获得观测矩阵x。In this embodiment, x1 (k) includes s(k) and n(k), and x2 (k) is the hemodynamic information obtained by the short-distance light source detector, which is mainly physiological interference signals and is related to x1(k) The middle noise signal n(k) is correlated to obtain the observation matrix x.
具体实施方式二:本实施方式对实施方式一的进一步说明,本实施方式所述双波长光源S发出的两种波长分别为λ1=760nm,λ2=850nm。Embodiment 2: This embodiment is a further description of Embodiment 1. The two wavelengths emitted by the dual-wavelength light source S in this embodiment are λ1 =760nm and λ2 =850nm respectively.
具体实施方式三:本实施方式对实施方式一或二的进一步说明,本实施方式所述双波长光源S到检测器D1之间的直线距离r1为10mm,双波长光源S到检测器D2之间的直线距离r2为40mm。Specific embodiment three: This embodiment is a further description of embodiment one or two. The straight-line distancer1 between the dual-wavelength light source S and the detector D1 in this embodiment is 10 mm, and the distance between the dual-wavelength light source S and the detector D2 is 10 mm. The linear distance r2 between them is 40mm.
本实施方式中设置的两个检测器间距约为近红外光探测深度的两倍,这样设置能够使检测器D2检测的近红外光可有效穿入大脑皮层,检测器D1检测的近红外光仅穿入头外层脑组织。然后将获得的光密度变化通过修正朗伯比尔定律转变为氧合血红蛋白浓度变化量的时间序列Δ[HbO2]N(k)、Δ[HbO2]F(k)和还原血红蛋白浓度变化量的时间序列Δ[HHb]N(k)、Δ[HHb]F(k)。将时间序列Δ[HbO2]N(k)、Δ[HbO2]F(k)或时间序列Δ[HHb]N(k)、Δ[HHb]F(k)构成二维观测矩阵x。通过独立成分分析算法根据观测矩阵x确定分离矩阵W,使得变换后的输出Y=Wx。矩阵Y的两行分别表示为l和d,l和d分别与s和u满足线性相关条件。将得到的分量l进行线性组合估计脑功能信号s,构建鳌头e(k)。通过最小二乘估计准则求解使残差e(k)的累计平方误差性能函数J最小,获得线性组合参数b和c,从而解得剔除生理干扰的脑机接口研究中的脑功能信号。The distance between the two detectors set in this embodiment is about twice the detection depth of the near-infrared light, so that the near-infrared light detected by the detector D2 can effectively penetrate into the cerebral cortex, and the near-infrared light detected by the detector D1 only Penetrates the outer layer of brain tissue. Then, the obtained optical density changes were transformed into the time series Δ[HbO2 ]N (k) and Δ[HbO2 ]F (k) of the changes in the concentration of oxygenated hemoglobin and the time series of changes in the concentration of reduced hemoglobin by amending Lambert-Beer's law. Time series Δ[HHb]N (k), Δ[HHb]F (k). The time series Δ[HbO2 ]N (k), Δ[HbO2 ]F (k) or the time series Δ[HHb]N (k), Δ[HHb]F (k) constitute a two-dimensional observation matrix x. The separation matrix W is determined according to the observation matrix x through an independent component analysis algorithm, so that the transformed output Y=Wx. The two rows of the matrix Y are denoted as l and d respectively, and l and d satisfy the linear correlation condition with s and u respectively. Linearly combine the obtained components l to estimate the brain function signal s, and construct the head e(k). The cumulative square error performance function J of the residual e(k) is minimized by the least square estimation criterion, and the linear combination parameters b and c are obtained, so as to solve the brain function signal in the brain-computer interface research that eliminates physiological interference.
具体实施方式四:本实施方式对实施方式一、二或三的进一步说明,本实施方式所述步骤二中光密度变化量的时间序列
其中:为双波长光源S波长为λ1时,大脑安静状态下检测器D1测得的出射光强;in: When the wavelength of the dual-wavelength light source S is λ1 , the output light intensity measured by the detector D1 under the quiet state of the brain;
为双波长光源S波长为λ1时,大脑安静状态下检测器D2测得的出射光强; When the wavelength of the dual-wavelength light source S is λ1 , the output light intensity measured by the detector D2 under the quiet state of the brain;


步骤二中光密度变化量的时间序列和光密度变化量的时间序列
其中:
为双波长光源S波长为λ2时,大脑处于诱发激励状态下检测器D1测得的出射光强; When the wavelength of the dual-wavelength light source S is λ2 , the output light intensity measured by the detector D1 under the brain in an induced excitation state;

为双波长光源S波长为λ2时,大脑处于诱发激励状态下检测器D2测得的出射光强。 is the output light intensity measured by the detector D2 when the wavelength of the dual-wavelength light source S isλ2 , and the brain is in the evoked excitation state.
在近红外波段氧合血红蛋白HbO2和还原血红蛋白HHb是吸收体,并且其吸收谱存在显著差异。因此,基于连续光谱技术的近红外脑功能检测是HbO2和HHb的浓度变化。Oxygenated hemoglobin HbO2 and reduced hemoglobin HHb are absorbers in the near-infrared band, and there are significant differences in their absorption spectra. Therefore, the detection of near-infrared brain function based on continuous spectroscopy technology is the concentration change ofHbO2 and HHb.
具体实施方式五:本实施方式对实施方式一、二、三或四的进一步说明,本实施方式所述步骤七中残差e(k)的获得方法为:Specific embodiment five: this embodiment is a further description of embodiment one, two, three or four, the method for obtaining the residual e(k) in step seven of this embodiment is:
首先,通过最小二乘估计准则表示使残差e(k)的累计平方误差性能函数J最小,J表示为:First, the cumulative square error performance function J of the residual e(k) is expressed by the least square estimation criterion, and J is expressed as:
其次,求解最优系数b和c:Second, solve for the optimal coefficients b and c:
对J相对于b,c求导,并将求导结果置为0,即:Derivate J with respect to b, c, and set the result of the derivation to 0, that is:
则:but:
最后,求解脑机接口信号中的血液动力学信号s(k):Finally, solve for the hemodynamic signal s(k) in the BCI signal:
s(k)=bl(k)+c。s(k)=bl(k)+c.
Claims (5)


Priority Applications (1)
| Application Number | Priority Date | Filing Date | Title |
|---|---|---|---|
| CN201210551956.1ACN102973279B (en) | 2012-12-18 | 2012-12-18 | Near-infrared brain-machine interface signal detection method integrating independent component analysis |
Applications Claiming Priority (1)
| Application Number | Priority Date | Filing Date | Title |
|---|---|---|---|
| CN201210551956.1ACN102973279B (en) | 2012-12-18 | 2012-12-18 | Near-infrared brain-machine interface signal detection method integrating independent component analysis |
Publications (2)
| Publication Number | Publication Date |
|---|---|
| CN102973279Atrue CN102973279A (en) | 2013-03-20 |
| CN102973279B CN102973279B (en) | 2014-09-17 |
Family
ID=47847832
Family Applications (1)
| Application Number | Title | Priority Date | Filing Date |
|---|---|---|---|
| CN201210551956.1AExpired - Fee RelatedCN102973279B (en) | 2012-12-18 | 2012-12-18 | Near-infrared brain-machine interface signal detection method integrating independent component analysis |
Country Status (1)
| Country | Link |
|---|---|
| CN (1) | CN102973279B (en) |
Cited By (12)
| Publication number | Priority date | Publication date | Assignee | Title |
|---|---|---|---|---|
| CN104182645A (en)* | 2014-09-01 | 2014-12-03 | 黑龙江省计算中心 | Empirical mode decomposition and sliding time window weighted least square method based brain-computer interface extraction method |
| CN104224165A (en)* | 2014-09-17 | 2014-12-24 | 哈尔滨工业大学 | Near-infrared brain function signal robust estimation method based on multi-distance measurement method and least absolute deviation criterion |
| CN105962950A (en)* | 2016-07-07 | 2016-09-28 | 哈尔滨工业大学 | Near-infrared Brain Function Signal Extraction Method Based on Least Squares Support Vector Machine |
| CN107080543A (en)* | 2017-04-27 | 2017-08-22 | 北京师范大学 | A kind of real-time Cerebral cortex blood oxygen signal harvester of new near-infrared |
| CN107174204A (en)* | 2017-05-12 | 2017-09-19 | 哈尔滨工业大学 | Near-infrared Brain function signal processing method based on total least square method |
| CN107928631A (en)* | 2017-12-21 | 2018-04-20 | 哈尔滨工业大学 | A Near Infrared Brain Function Signal Processing Method Based on Differential Path Factor Estimation |
| CN108464813A (en)* | 2018-01-30 | 2018-08-31 | 东南大学 | Using the functional functional near-infrared imaging system of high-low dual density optrode configuration |
| US20190046099A1 (en)* | 2016-02-17 | 2019-02-14 | Nuralogix Corporation | System and method for detecting physiological state |
| CN109567818A (en)* | 2018-11-20 | 2019-04-05 | 苏州大学 | The recognition methods that a variety of walking step states adjustment based on hemoglobin information is intended to |
| CN110613462A (en)* | 2019-09-11 | 2019-12-27 | 河南大学 | Tissue oxygen saturation detection method and device free from individual difference |
| CN112987919A (en)* | 2021-02-07 | 2021-06-18 | 江苏集萃脑机融合智能技术研究所有限公司 | Brain-computer interface system based on indirect time-of-flight measurement technology and implementation method |
| CN115708678A (en)* | 2022-11-21 | 2023-02-24 | 昆明理工大学 | Brain-computer interface experimental method based on functional near infrared |
Families Citing this family (1)
| Publication number | Priority date | Publication date | Assignee | Title |
|---|---|---|---|---|
| CA3079625C (en) | 2017-10-24 | 2023-12-12 | Nuralogix Corporation | System and method for camera-based stress determination |
Citations (11)
| Publication number | Priority date | Publication date | Assignee | Title |
|---|---|---|---|---|
| CN1626032A (en)* | 2003-12-12 | 2005-06-15 | 中国科学院自动化研究所 | Time series analysis method of nuclear magnetic resonance for brain functions based on constrained optimization |
| JP2006280421A (en)* | 2005-03-31 | 2006-10-19 | Shimadzu Corp | Brain function information monitoring device |
| CN1878505A (en)* | 2003-11-12 | 2006-12-13 | 株式会社日立医药 | Biological light measuring apparatus |
| CN101287410A (en)* | 2005-10-12 | 2008-10-15 | 学校法人东京电机大学 | Brain function analysis method and brain function analysis program |
| US20100081903A1 (en)* | 2008-09-30 | 2010-04-01 | Drexel University | Functional near-infrared spectroscopy as a monitor for depth of anesthesia |
| JP2010148674A (en)* | 2008-12-25 | 2010-07-08 | Shimadzu Corp | Optical brain function measuring apparatus |
| CN101940475A (en)* | 2010-09-03 | 2011-01-12 | 深圳市纽泰克电子有限公司 | Method for improving detection accuracy of blood oxygen saturation |
| WO2012005303A1 (en)* | 2010-07-06 | 2012-01-12 | 株式会社日立メディコ | Biological photometric device and biological photometry method using same |
| CN102512142A (en)* | 2011-12-22 | 2012-06-27 | 哈尔滨工业大学 | Recursive Least Squares Adaptive Filtering Near-infrared Brain Functional Activity Signal Extraction Method Based on Multi-distance Measurement Method |
| CN102525422A (en)* | 2011-12-26 | 2012-07-04 | 哈尔滨工业大学 | Brain function signal extraction method based on empirical mode decomposition optimization algorithm of multi-distance measurement method |
| WO2012135413A1 (en)* | 2011-03-29 | 2012-10-04 | Drexel University | Real time artifact removal |
- 2012
- 2012-12-18CNCN201210551956.1Apatent/CN102973279B/ennot_activeExpired - Fee Related
Patent Citations (11)
| Publication number | Priority date | Publication date | Assignee | Title |
|---|---|---|---|---|
| CN1878505A (en)* | 2003-11-12 | 2006-12-13 | 株式会社日立医药 | Biological light measuring apparatus |
| CN1626032A (en)* | 2003-12-12 | 2005-06-15 | 中国科学院自动化研究所 | Time series analysis method of nuclear magnetic resonance for brain functions based on constrained optimization |
| JP2006280421A (en)* | 2005-03-31 | 2006-10-19 | Shimadzu Corp | Brain function information monitoring device |
| CN101287410A (en)* | 2005-10-12 | 2008-10-15 | 学校法人东京电机大学 | Brain function analysis method and brain function analysis program |
| US20100081903A1 (en)* | 2008-09-30 | 2010-04-01 | Drexel University | Functional near-infrared spectroscopy as a monitor for depth of anesthesia |
| JP2010148674A (en)* | 2008-12-25 | 2010-07-08 | Shimadzu Corp | Optical brain function measuring apparatus |
| WO2012005303A1 (en)* | 2010-07-06 | 2012-01-12 | 株式会社日立メディコ | Biological photometric device and biological photometry method using same |
| CN101940475A (en)* | 2010-09-03 | 2011-01-12 | 深圳市纽泰克电子有限公司 | Method for improving detection accuracy of blood oxygen saturation |
| WO2012135413A1 (en)* | 2011-03-29 | 2012-10-04 | Drexel University | Real time artifact removal |
| CN102512142A (en)* | 2011-12-22 | 2012-06-27 | 哈尔滨工业大学 | Recursive Least Squares Adaptive Filtering Near-infrared Brain Functional Activity Signal Extraction Method Based on Multi-distance Measurement Method |
| CN102525422A (en)* | 2011-12-26 | 2012-07-04 | 哈尔滨工业大学 | Brain function signal extraction method based on empirical mode decomposition optimization algorithm of multi-distance measurement method |
Non-Patent Citations (3)
| Title |
|---|
| 张红娟: "扩展独立成分分析的若干算法及其应用研究", 《中国博士学位论文全文数据库信息科技辑》* |
| 王斐等: "《脑-机接口研究进展》", 《智能系统学报》* |
| 胡汉彬: "功能近红外光谱成像研究及应用", 《中国科技技术大学 硕士学位论文》* |
Cited By (18)
| Publication number | Priority date | Publication date | Assignee | Title |
|---|---|---|---|---|
| CN104182645A (en)* | 2014-09-01 | 2014-12-03 | 黑龙江省计算中心 | Empirical mode decomposition and sliding time window weighted least square method based brain-computer interface extraction method |
| CN104224165A (en)* | 2014-09-17 | 2014-12-24 | 哈尔滨工业大学 | Near-infrared brain function signal robust estimation method based on multi-distance measurement method and least absolute deviation criterion |
| US10694988B2 (en)* | 2016-02-17 | 2020-06-30 | Nuralogix Corporation | System and method for detecting physiological state |
| US20190046099A1 (en)* | 2016-02-17 | 2019-02-14 | Nuralogix Corporation | System and method for detecting physiological state |
| US11497423B2 (en) | 2016-02-17 | 2022-11-15 | Nuralogix Corporation | System and method for detecting physiological state |
| CN105962950A (en)* | 2016-07-07 | 2016-09-28 | 哈尔滨工业大学 | Near-infrared Brain Function Signal Extraction Method Based on Least Squares Support Vector Machine |
| CN107080543A (en)* | 2017-04-27 | 2017-08-22 | 北京师范大学 | A kind of real-time Cerebral cortex blood oxygen signal harvester of new near-infrared |
| CN107174204A (en)* | 2017-05-12 | 2017-09-19 | 哈尔滨工业大学 | Near-infrared Brain function signal processing method based on total least square method |
| CN107928631A (en)* | 2017-12-21 | 2018-04-20 | 哈尔滨工业大学 | A Near Infrared Brain Function Signal Processing Method Based on Differential Path Factor Estimation |
| CN108464813A (en)* | 2018-01-30 | 2018-08-31 | 东南大学 | Using the functional functional near-infrared imaging system of high-low dual density optrode configuration |
| CN109567818A (en)* | 2018-11-20 | 2019-04-05 | 苏州大学 | The recognition methods that a variety of walking step states adjustment based on hemoglobin information is intended to |
| CN109567818B (en)* | 2018-11-20 | 2021-06-01 | 苏州大学 | Identification method of various walking gait adjustment intentions based on hemoglobin information |
| CN110613462B (en)* | 2019-09-11 | 2022-04-08 | 河南大学 | A method and device for detecting tissue oxygen saturation that is not affected by individual differences |
| CN110613462A (en)* | 2019-09-11 | 2019-12-27 | 河南大学 | Tissue oxygen saturation detection method and device free from individual difference |
| CN112987919A (en)* | 2021-02-07 | 2021-06-18 | 江苏集萃脑机融合智能技术研究所有限公司 | Brain-computer interface system based on indirect time-of-flight measurement technology and implementation method |
| CN112987919B (en)* | 2021-02-07 | 2023-11-03 | 江苏集萃脑机融合智能技术研究所有限公司 | Brain-computer interface system based on indirect time-of-flight measurement technology and implementation method |
| CN115708678A (en)* | 2022-11-21 | 2023-02-24 | 昆明理工大学 | Brain-computer interface experimental method based on functional near infrared |
| CN115708678B (en)* | 2022-11-21 | 2024-12-20 | 昆明理工大学 | Brain-computer interface experimental method based on functional near infrared |
Also Published As
| Publication number | Publication date |
|---|---|
| CN102973279B (en) | 2014-09-17 |
Similar Documents
| Publication | Publication Date | Title |
|---|---|---|
| CN102973279B (en) | Near-infrared brain-machine interface signal detection method integrating independent component analysis | |
| Barstow | Understanding near infrared spectroscopy and its application to skeletal muscle research | |
| CN104055524B (en) | Brain function based near infrared spectrum connects detection method and system | |
| Ferrari et al. | Near infrared brain and muscle oximetry: from the discovery to current applications | |
| Franceschini et al. | Near-infrared spiroximetry: noninvasive measurements of venous saturation in piglets and human subjects | |
| CN102512142B (en) | Recursive Least Squares Adaptive Filtering Near-infrared Brain Functional Activity Signal Extraction Method Based on Multi-distance Measurement Method | |
| CN101972148B (en) | Disturbance elimination method of near infrared brain function detection based on empirical mode decomposition | |
| US8897848B2 (en) | Apparatus and method for non-invasively determining oxygen saturation of venous blood and cardiac output using NIRS | |
| JP7719506B2 (en) | Systems and methods for performing transabdominal fetal oximetry or transabdominal fetal pulse oximetry | |
| CN113229831B (en) | Movement function monitoring and management method based on myoelectricity and myooxygen signals | |
| US20230172565A1 (en) | Systems, devices, and methods for developing a model for use when performing oximetry and/or pulse oximetry and systems, devices, and methods for using a fetal oximetry model to determine a fetal oximetry value | |
| CN102525422B (en) | Brain function signal extraction method based on empirical mode decomposition optimization algorithm of multi-distance measurement method | |
| CN109596552B (en) | A method for measuring tissue oxygen saturation using a single-distance light source-detector pair | |
| Holper et al. | Test–retest reliability of brain mitochondrial cytochrome-c-oxidase assessed by functional near-infrared spectroscopy | |
| CN108185992B (en) | Noninvasive optical brain tissue oxygen metabolism measurement method | |
| CN112914564A (en) | Infant blood oxygen saturation monitoring method and intelligent monitoring device | |
| Buyanov et al. | Continuous cerebral and tissue oximetry by three-wave NIRS device | |
| Zhang et al. | Reduction of global interference in functional multidistance near-infrared spectroscopy using empirical mode decomposition and recursive least squares: a Monte Carlo study | |
| Elwell et al. | Measurement of changes in cerebral haemodynamics during inspiration and expiration using near infrared spectroscopy | |
| Li et al. | Assessing working memory in real-life situations with functional near-infrared spectroscopy | |
| Halim et al. | Evaluation of Light Distribution and the Penetration Depth under Isometric Studies using fNIRS | |
| Premchand et al. | Synchronizing Motor Imagery Cue in fNIRS Brain-Computer Interface to reduce confounding effects of respiration | |
| Mykhailova et al. | Application of the photoplethysmography technique to complex wireless diagnostic the functional state of the human body | |
| Buyanov et al. | Cerebral Oxygenation Response to Orthostatic Hypotension with Electroencephalography and Near Infrared Spectroscopy | |
| Niwayama | Oximetry for Various Tissues Using Near-Infrared Spectroscopy |
Legal Events
| Date | Code | Title | Description |
|---|---|---|---|
| C06 | Publication | ||
| PB01 | Publication | ||
| C10 | Entry into substantive examination | ||
| SE01 | Entry into force of request for substantive examination | ||
| C14 | Grant of patent or utility model | ||
| GR01 | Patent grant | ||
| CF01 | Termination of patent right due to non-payment of annual fee | Granted publication date:20140917 Termination date:20141218 | |
| EXPY | Termination of patent right or utility model |