Movatterモバイル変換


[0]ホーム

URL:


CN102937676A - Method and system for implementing early warning of load harmonic injection pollution - Google Patents

Method and system for implementing early warning of load harmonic injection pollution
Download PDF

Info

Publication number
CN102937676A
CN102937676ACN2012104121805ACN201210412180ACN102937676ACN 102937676 ACN102937676 ACN 102937676ACN 2012104121805 ACN2012104121805 ACN 2012104121805ACN 201210412180 ACN201210412180 ACN 201210412180ACN 102937676 ACN102937676 ACN 102937676A
Authority
CN
China
Prior art keywords
harmonic
voltage
load
current
pollution
Prior art date
Legal status (The legal status is an assumption and is not a legal conclusion. Google has not performed a legal analysis and makes no representation as to the accuracy of the status listed.)
Granted
Application number
CN2012104121805A
Other languages
Chinese (zh)
Other versions
CN102937676B (en
Inventor
邵振国
Current Assignee (The listed assignees may be inaccurate. Google has not performed a legal analysis and makes no representation or warranty as to the accuracy of the list.)
Fuzhou University
Original Assignee
Fuzhou University
Priority date (The priority date is an assumption and is not a legal conclusion. Google has not performed a legal analysis and makes no representation as to the accuracy of the date listed.)
Filing date
Publication date
Application filed by Fuzhou UniversityfiledCriticalFuzhou University
Priority to CN201210412180.5ApriorityCriticalpatent/CN102937676B/en
Publication of CN102937676ApublicationCriticalpatent/CN102937676A/en
Application grantedgrantedCritical
Publication of CN102937676BpublicationCriticalpatent/CN102937676B/en
Activelegal-statusCriticalCurrent
Anticipated expirationlegal-statusCritical

Links

Images

Landscapes

Abstract

Translated fromChinese

本发明涉及一种负荷谐波注入污染预警的实现方法及其系统,该方法的特征在于:根据负荷电压、电流波形采样值分别计算基波电压V、基波电流I和相位角

Figure 2012104121805100004DEST_PATH_IMAGE002
,通过系统基波阻抗在线跟踪算法计算系统等效电阻
Figure DEST_PATH_IMAGE004
和系统等效电抗,从而能够计算每个负荷注入谐波电流各自引起的供电点谐波电压数值,进一步计算预警指标
Figure DEST_PATH_IMAGE008
Figure DEST_PATH_IMAGE010
,实现谐波污染用户注入污染评价及污染预警。

Figure 201210412180

The present invention relates to a method and system for realizing early warning of load harmonic injection pollution. The method is characterized in that the fundamental wave voltage V, fundamental wave current I and phase angle are respectively calculated according to the load voltage and current waveform sampling values

Figure 2012104121805100004DEST_PATH_IMAGE002
, calculate the equivalent resistance of the system through the online tracking algorithm of the system fundamental impedance
Figure DEST_PATH_IMAGE004
and system equivalent reactance , so that the value of the harmonic voltage at the power supply point caused by each load injection harmonic current can be calculated, and the early warning index can be further calculated
Figure DEST_PATH_IMAGE008
and
Figure DEST_PATH_IMAGE010
, to realize harmonic pollution user injection pollution evaluation and pollution warning.

Figure 201210412180

Description

Translated fromChinese
负荷谐波注入污染预警的实现方法及其系统Realization method and system of load harmonic injection pollution warning

技术领域technical field

本发明涉及电力电能质量监测技术领域,特别是一种负荷谐波注入污染预警的实现方法及其系统。The invention relates to the technical field of electric power quality monitoring, in particular to a method and system for realizing early warning of load harmonic injection pollution.

背景技术Background technique

目前的电能质量监测仪器监测用户用电电压和负荷电流,并以此评价用户对电网电能质量的影响,这种做法其实没有区分谐波污染来自于用户还是供电方,因而依靠目前的电能质量监测方法和装置不能真正检测到用户对系统的谐波干扰程度,在某些运行工况下可能遗漏潜在的污染用户。The current power quality monitoring instrument monitors the user's power voltage and load current, and evaluates the impact of the user on the power quality of the grid. This method does not distinguish whether the harmonic pollution comes from the user or the power supply side, so it relies on the current power quality monitoring. The method and device cannot truly detect the degree of user's harmonic interference to the system, and may miss potential polluting users under certain operating conditions.

目前已经具备成熟谐波监测装置,能够检测用户注入系统的谐波电流和供电点的谐波电压。供电点的谐波电压是系统中所有谐波污染用户共同作用的结果,显然不能用来描述某个监测用户对系统的影响程度。当系统运行方式变化时,用户注入系统同样大小的谐波电流在公共连接点上形成的谐波电压并不相等,需要结合监测系统参数来评价用户注入系统的污染大小。另外,即使被监测用户本身不产生谐波,但外界谐波源也会在该用户线路电流中产生谐波分量,所以单纯检测用户电流中是否含有谐波也无法正确评判用户是否对系统注入谐波污染。总之,单纯监测用户谐波电压和谐波电流无法度量用户对系统的谐波污染程度,无法据此实现用户电能质量水平的预警功能。At present, it has a mature harmonic monitoring device, which can detect the harmonic current injected into the system by the user and the harmonic voltage of the power supply point. The harmonic voltage at the power supply point is the result of the joint action of all harmonic pollution users in the system, and obviously cannot be used to describe the degree of influence of a monitoring user on the system. When the operating mode of the system changes, the harmonic voltage formed at the common connection point by the same magnitude of harmonic current injected into the system by users is not equal. It is necessary to combine the monitoring system parameters to evaluate the degree of pollution injected into the system by users. In addition, even if the monitored user does not generate harmonics, the external harmonic source will also generate harmonic components in the user's line current, so it is impossible to correctly judge whether the user injects harmonics into the system simply by detecting whether the user's current contains harmonics. wave pollution. In short, simply monitoring the user's harmonic voltage and harmonic current cannot measure the user's harmonic pollution to the system, and cannot realize the early warning function of the user's power quality level.

发明内容Contents of the invention

本发明的目的是提供一种负荷谐波注入污染预警的实现方法。该方法能实现用户注入污染的准确评估,并结合电网运行方式的监测对用户注入污染进行预警。The purpose of the present invention is to provide a method for realizing early warning of load harmonic injection pollution. This method can realize the accurate assessment of the user-injected pollution, and combine the monitoring of the operation mode of the power grid to give an early warning of the user-injected pollution.

本发明采用以下方案实现:一种负荷谐波注入污染预警的实现方法,其特征在于:根据负荷电压、电流波形采样值分别计算基波电压V、基波电流I和相位角                                               

Figure 2012104121805100002DEST_PATH_IMAGE002
,通过系统基波阻抗在线跟踪算法计算系统等效电阻
Figure 2012104121805100002DEST_PATH_IMAGE004
和系统等效电抗,从而能够计算每个负荷谐波电流注入各自引起的供电点谐波电压数值,进一步计算预警指标
Figure 2012104121805100002DEST_PATH_IMAGE008
Figure 2012104121805100002DEST_PATH_IMAGE010
,实现谐波污染用户注入污染评价及污染预警。The present invention adopts the following scheme to realize: a method for realizing early warning of load harmonic injection pollution, which is characterized in that: the fundamental voltage V, the fundamental current I and the phase angle are respectively calculated according to the sampling values of the load voltage and current waveform
Figure 2012104121805100002DEST_PATH_IMAGE002
, calculate the equivalent resistance of the system through the online tracking algorithm of the system fundamental impedance
Figure 2012104121805100002DEST_PATH_IMAGE004
and system equivalent reactance , so that the harmonic voltage value of the power supply point caused by the injection of each load harmonic current can be calculated, and the early warning index can be further calculated
Figure 2012104121805100002DEST_PATH_IMAGE008
and
Figure 2012104121805100002DEST_PATH_IMAGE010
, to realize harmonic pollution user injection pollution evaluation and pollution warning.

进一步的,所述系统基波阻抗在线跟踪采用以下方式实现:设系统电阻

Figure 816830DEST_PATH_IMAGE004
,系统电抗
Figure 733970DEST_PATH_IMAGE006
,系统等效电压
Figure 2012104121805100002DEST_PATH_IMAGE012
;采用快速傅立叶算法从负荷电压、电流波形采样值分别计算基波电压V、基波电压相位
Figure 2012104121805100002DEST_PATH_IMAGE014
、基波电流I以及基波电流相位
Figure 2012104121805100002DEST_PATH_IMAGE016
;分别针对两个相邻采样周期中的基波计算值,根据基尔霍夫电压定律,用两个时刻的基波电压相量的差值除以两个时刻的基波电流差值,计算得到系统等效电阻
Figure 949926DEST_PATH_IMAGE004
和系统等效电抗
Figure 345135DEST_PATH_IMAGE006
。Further, the online tracking of the fundamental wave impedance of the system is realized in the following manner: set the system resistance
Figure 816830DEST_PATH_IMAGE004
, system reactance
Figure 733970DEST_PATH_IMAGE006
, the system equivalent voltage
Figure 2012104121805100002DEST_PATH_IMAGE012
;Use fast Fourier algorithm to calculate the fundamental voltage V and fundamental voltage phase from load voltage and current waveform sampling values respectively
Figure 2012104121805100002DEST_PATH_IMAGE014
, the fundamental current I and the fundamental current phase
Figure 2012104121805100002DEST_PATH_IMAGE016
; According to the calculated value of the fundamental wave in two adjacent sampling periods, according to Kirchhoff's voltage law, the difference of the fundamental voltage phasor at two moments is divided by the difference of the fundamental wave current at two moments to calculate Get the system equivalent resistance
Figure 949926DEST_PATH_IMAGE004
and system equivalent reactance
Figure 345135DEST_PATH_IMAGE006
.

进一步的,在连续的跟踪过程中,以系统阻抗为状态量、以基波电压和基波电流为量测量建立量测方程,采用最小二乘法对量测量样本集进行状态量的估计,得到系统等效阻抗的估计值,具体计算过程如下:Furthermore, in the continuous tracking process, the measurement equation is established with the system impedance as the state quantity and the fundamental voltage and fundamental current as the measurement, and the least square method is used to estimate the state quantity of the quantity measurement sample set, and the system The estimated value of equivalent impedance, the specific calculation process is as follows:

t1时刻,应用基尔霍夫电压定律,可得到式(1),At timet1 , applying Kirchhoff’s voltage law, formula (1) can be obtained,

Figure 2012104121805100002DEST_PATH_IMAGE018
                  (1)
Figure 2012104121805100002DEST_PATH_IMAGE018
(1)

t2时刻,可得到式(2),At timet2 , formula (2) can be obtained,

Figure 2012104121805100002DEST_PATH_IMAGE020
                 (2)
Figure 2012104121805100002DEST_PATH_IMAGE020
(2)

如果t1t2为两个相邻的采样时刻,可近似认为

Figure 2012104121805100002DEST_PATH_IMAGE022
Figure 2012104121805100002DEST_PATH_IMAGE024
,(2)式减去(1)式,得:Ift1 andt2 are two adjacent sampling moments, it can be approximated as
Figure 2012104121805100002DEST_PATH_IMAGE022
=
Figure 2012104121805100002DEST_PATH_IMAGE024
, (2) minus (1), get:

Figure 2012104121805100002DEST_PATH_IMAGE026
            (3)
Figure 2012104121805100002DEST_PATH_IMAGE026
(3)

Figure 2012104121805100002DEST_PATH_IMAGE028
Figure 2012104121805100002DEST_PATH_IMAGE030
Figure 2012104121805100002DEST_PATH_IMAGE032
,考虑测量误差和计算误差,式(3)能写成式(4),其中W为误差。make
Figure 2012104121805100002DEST_PATH_IMAGE028
,
Figure 2012104121805100002DEST_PATH_IMAGE030
,
Figure 2012104121805100002DEST_PATH_IMAGE032
, considering the measurement error and calculation error, formula (3) can be written as formula (4), whereW is the error.

                          (4) (4)

假设已得到k组数据,以残差平方和最小为目标确定RsXs的最优估计值,求解(4)式,得Assuming thatk sets of data have been obtained, the optimal estimated values ofRs andXs are determined with the goal of minimizing the sum of squared residuals, and formula (4) is solved to obtain

Figure 2012104121805100002DEST_PATH_IMAGE036
              (5)
Figure 2012104121805100002DEST_PATH_IMAGE036
(5)

在原有的k组采样数据增加了一组采样数据时,有When a set of sampling data is added to the originalk sets of sampling data, there is

Figure 2012104121805100002DEST_PATH_IMAGE038
      (6)
Figure 2012104121805100002DEST_PATH_IMAGE038
(6)

其中,

Figure 2012104121805100002DEST_PATH_IMAGE040
Figure 2012104121805100002DEST_PATH_IMAGE042
,则
Figure 2012104121805100002DEST_PATH_IMAGE044
存在式(7)的关系。in,
Figure 2012104121805100002DEST_PATH_IMAGE040
,
Figure 2012104121805100002DEST_PATH_IMAGE042
,but
Figure 2012104121805100002DEST_PATH_IMAGE044
and There is a relation of formula (7).

Figure 2012104121805100002DEST_PATH_IMAGE048
         (7)
Figure 2012104121805100002DEST_PATH_IMAGE048
(7)

其中

Figure 2012104121805100002DEST_PATH_IMAGE050
。in
Figure 2012104121805100002DEST_PATH_IMAGE050
.

将由式(7)估计的系统阻抗代入式(3),得到t2时刻的节点电压状态估计值

Figure 2012104121805100002DEST_PATH_IMAGE052
;当
Figure 2012104121805100002DEST_PATH_IMAGE054
Figure 2012104121805100002DEST_PATH_IMAGE056
,当前估计值偏离实际值较大,说明此前的样本集不适合用来估计这个时刻的系统参数,清空量测量样本集,重新开始递推估计。Substitutingthe system impedance estimated by equation (7) into equation (3), the estimated value of the node voltage state at timet2 is obtained
Figure 2012104121805100002DEST_PATH_IMAGE052
;when
Figure 2012104121805100002DEST_PATH_IMAGE054
or
Figure 2012104121805100002DEST_PATH_IMAGE056
, the current estimated value deviates greatly from the actual value, indicating that the previous sample set is not suitable for estimating the system parameters at this moment, clear the amount measurement sample set, and restart the recursive estimation.

进一步的,所述计算预警指标

Figure 361106DEST_PATH_IMAGE008
Figure 183569DEST_PATH_IMAGE010
按以下方式实现:采用快速傅立叶算法从负荷电压、电流波形采样值分别计算各次谐波电压、谐波电压相位
Figure 2012104121805100002DEST_PATH_IMAGE060
、谐波电流
Figure 2012104121805100002DEST_PATH_IMAGE062
、谐波电流相位
Figure 2012104121805100002DEST_PATH_IMAGE064
;在计算得到系统等效阻抗的估计值以后,计算系统谐波等效阻抗
Figure 2012104121805100002DEST_PATH_IMAGE066
Figure 2012104121805100002DEST_PATH_IMAGE070
;用负荷电流中的谐波分量乘以系统谐波等效阻抗,得到该负荷在系统阻抗上引起的谐波电压
Figure 2012104121805100002DEST_PATH_IMAGE072
;将
Figure 524868DEST_PATH_IMAGE072
在节点谐波电压相量上投影,计算投影分量
Figure 2012104121805100002DEST_PATH_IMAGE074
;对所有的谐波电流进行重复以上计算,此后计算所有谐波电压
Figure 629965DEST_PATH_IMAGE072
、投影分量
Figure 623329DEST_PATH_IMAGE074
与供电点基波电压比值之和的均方根
Figure 377659DEST_PATH_IMAGE008
Figure 114671DEST_PATH_IMAGE010
作为预警指标。Further, the calculation of early warning indicators
Figure 361106DEST_PATH_IMAGE008
and
Figure 183569DEST_PATH_IMAGE010
It can be realized in the following way: use the fast Fourier algorithm to calculate the harmonic voltages of each order from the sampled values of the load voltage and current waveforms , harmonic voltage phase
Figure 2012104121805100002DEST_PATH_IMAGE060
, Harmonic current
Figure 2012104121805100002DEST_PATH_IMAGE062
, Harmonic current phase
Figure 2012104121805100002DEST_PATH_IMAGE064
; After calculating the estimated value of the equivalent impedance of the system, calculate the equivalent impedance of the harmonics of the system
Figure 2012104121805100002DEST_PATH_IMAGE066
, ,
Figure 2012104121805100002DEST_PATH_IMAGE070
;Use the harmonic components in the load current Multiply by the system harmonic equivalent impedance to get the harmonic voltage caused by the load on the system impedance
Figure 2012104121805100002DEST_PATH_IMAGE072
;Will
Figure 524868DEST_PATH_IMAGE072
Project on nodal harmonic voltage phasors to compute projected components
Figure 2012104121805100002DEST_PATH_IMAGE074
;Repeat the above calculation for all harmonic currents, and then calculate all harmonic voltages
Figure 629965DEST_PATH_IMAGE072
, projection component
Figure 623329DEST_PATH_IMAGE074
The root mean square of the sum of the ratios to the fundamental voltage of the power supply point
Figure 377659DEST_PATH_IMAGE008
and
Figure 114671DEST_PATH_IMAGE010
as an early warning indicator.

    本发明的另一目的是提供一种依据上述方法实现负荷谐波注入污染预警的系统。Another object of the present invention is to provide a system for realizing early warning of load harmonic injection pollution according to the above method.

本发明采用以下方案实现:一种负荷谐波注入污染预警系统,其特征在于:包括滤波及信号采集模块、第一处理器、第二处理器、触摸屏液晶显示单元以及以太网传输单元;所述的滤波及信号采集模块采集负荷电压、电流波形的采样值,送入所述第一处理器,该第一处理器根据权利要求1所述的方法进行计算预警指标

Figure 5583DEST_PATH_IMAGE010
;并根据第二处理器的控制指令在所述触摸屏液晶显示单元显示或通过所述以太网传输单元上传数据。The present invention adopts the following scheme to realize: a load harmonic injection pollution early warning system, characterized in that it includes a filtering and signal acquisition module, a first processor, a second processor, a touch screen liquid crystal display unit and an Ethernet transmission unit; The filtering and signal acquisition module collects the sampling values of load voltage and current waveform, and sends them to the first processor, and the first processor calculates the early warning index according to the method described in claim 1 and
Figure 5583DEST_PATH_IMAGE010
and displaying on the touch screen liquid crystal display unit or uploading data through the Ethernet transmission unit according to the control instruction of the second processor.

进一步的,所述的第一处理器是TMS320F28335处理器。Further, the first processor is a TMS320F28335 processor.

进一步的,所述的第二处理器是STM32F407VGT6处理器。Further, the second processor is an STM32F407VGT6 processor.

进一步的,所述滤波及信号采集模块能实现在线12通道电压、电流信号的高速采集。Further, the filtering and signal acquisition module can realize high-speed acquisition of online 12-channel voltage and current signals.

进一步的,所述的以太网传输单元是以太网DP83848模块。 Further, the Ethernet transmission unit is an Ethernet DP83848 module. the

本发明的方法及系统可以实现用户注入污染的准确评估,并结合电网运行方式的监测对用户注入污染进行预警。其最大的优点是能够根据系统运行方式的变化动态调整评价用户谐波污染的门槛值,而不单纯根据谐波电压和电流大小来评价用户污染的严重程度,其结论更合理可靠,可以鉴别出潜在的污染用户。The method and system of the invention can realize the accurate assessment of user injection pollution, and provide early warning of user injection pollution in combination with the monitoring of the grid operation mode. Its greatest advantage is that it can dynamically adjust the threshold value for evaluating user harmonic pollution according to changes in system operation mode, instead of evaluating the severity of user pollution based solely on the magnitude of harmonic voltage and current. The conclusion is more reasonable and reliable, and can identify potential polluting users.

附图说明Description of drawings

图1是本发明实施例的方法流程示意图。Fig. 1 is a schematic flow chart of the method of the embodiment of the present invention.

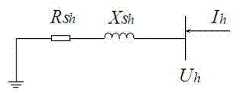
图2是本发明实施例的系统等效图。Fig. 2 is a system equivalent diagram of the embodiment of the present invention.

图3是本发明实施例的谐波计算等效图。Fig. 3 is an equivalent diagram of harmonic calculation in an embodiment of the present invention.

图4是本发明实施例系统架构示意图。Fig. 4 is a schematic diagram of the system architecture of the embodiment of the present invention.

具体实施方式Detailed ways

下面结合附图及实施例对本发明做进一步说明。The present invention will be further described below in conjunction with the accompanying drawings and embodiments.

本实施例子的方法根据负荷电压、电流波形采样值分别计算基波电压V、基波电流I和相位角,通过系统基波等效阻抗在线跟踪算法计算系统等效电阻

Figure 522332DEST_PATH_IMAGE004
和系统等效电抗,从而能够计算每个负荷由于谐波电流注入各自引起的供电点谐波电压数值,并计算预警指标
Figure 438653DEST_PATH_IMAGE008
,实现谐波污染用户注入污染评价及污染预警。The method in this implementation example calculates the fundamental wave voltage V, the fundamental wave current I and the phase angle respectively according to the sampled values of the load voltage and current waveform , calculate the equivalent resistance of the system through the online tracking algorithm of the equivalent impedance of the fundamental wave of the system
Figure 522332DEST_PATH_IMAGE004
and system equivalent reactance , so that it is possible to calculate the harmonic voltage value of the power supply point caused by each load due to the harmonic current injection, and calculate the early warning index
Figure 438653DEST_PATH_IMAGE008
and , to realize harmonic pollution user injection pollution evaluation and pollution warning.

具体的,如图1所示,该方法的计算主要包括:1、系统实时基波阻抗在线跟踪;2、预警指标

Figure 246389DEST_PATH_IMAGE008
的计算。Specifically, as shown in Figure 1, the calculation of this method mainly includes: 1. Online tracking of the system's real-time fundamental wave impedance; 2. Early warning indicators
Figure 246389DEST_PATH_IMAGE008
and calculation.

1.1            系统基波阻抗在线跟踪算法1.1 Online tracking algorithm of system fundamental wave impedance

设公共连接点的系统等效电路如图2所示,其中系统等效电阻

Figure 453696DEST_PATH_IMAGE004
,系统等效电抗,系统等效电压、相位角
Figure 639324DEST_PATH_IMAGE002
。设采集得到的公共连接点电压、负荷电流波形采样值分别为u(t)和i(t),采用快速傅立叶算法(FFT)从负荷电压、电流波形采样值分别计算基波电压V、基波电压相位
Figure 21020DEST_PATH_IMAGE014
、基波电流I、基波电流相位
Figure 458955DEST_PATH_IMAGE016
。The equivalent circuit of the system with a common connection point is shown in Figure 2, where the equivalent resistance of the system
Figure 453696DEST_PATH_IMAGE004
, the system equivalent reactance , the system equivalent voltage , phase angle
Figure 639324DEST_PATH_IMAGE002
. Assuming that the sampled values of common connection point voltage and load current waveform are respectivelyu (t ) andi (t ), fast Fourier algorithm (FFT) is used to calculate the fundamental voltageV and fundamental wave voltage phase
Figure 21020DEST_PATH_IMAGE014
, fundamental currentI , fundamental current phase
Figure 458955DEST_PATH_IMAGE016
.

在系统运行方式改变时,等效阻抗

Figure 879572DEST_PATH_IMAGE004
在变化,可以根据基波电压V、基波电压相位
Figure 465591DEST_PATH_IMAGE014
、基波电流I、基波电流相位
Figure 328505DEST_PATH_IMAGE016
计算
Figure 552813DEST_PATH_IMAGE004
Figure 614309DEST_PATH_IMAGE006
。分别针对两个相邻采样周期中的基波计算值,根据基尔霍夫电压定律,可以用两个时刻的基波电压相量的差值除以两个时刻的基波电流差值,计算得到系统等效阻抗。考虑到测量误差和计算误差,在连续的检测过程中,可以以系统阻抗为状态量、以基波电压和基波电流为量测量建立量测方程,采用最小二乘法对量测量样本集进行状态量的估计,得到系统等效阻抗的估计值。具体计算过程如式(1)至(7)所示。When the system operation mode changes, the equivalent impedance
Figure 879572DEST_PATH_IMAGE004
and In the change, it can be based on the fundamental voltageV , the fundamental voltage phase
Figure 465591DEST_PATH_IMAGE014
, fundamental currentI , fundamental current phase
Figure 328505DEST_PATH_IMAGE016
calculate
Figure 552813DEST_PATH_IMAGE004
and
Figure 614309DEST_PATH_IMAGE006
. For the calculated values of the fundamental wave in two adjacent sampling periods, according to Kirchhoff's voltage law, the difference of the fundamental voltage phasor at two moments can be divided by the difference of the fundamental wave current at two moments to calculate Get the equivalent impedance of the system. Considering the measurement error and calculation error, in the continuous detection process, the measurement equation can be established with the system impedance as the state quantity and the fundamental wave voltage and fundamental wave current as the quantity measurement, and the state measurement sample set can be carried out by the least square method. The estimated value of the equivalent impedance of the system is obtained. The specific calculation process is shown in formulas (1) to (7).

t1时刻,应用基尔霍夫电压定律,可得到式(1),At timet1 , applying Kirchhoff’s voltage law, formula (1) can be obtained,

Figure 898660DEST_PATH_IMAGE018
                  (1)
Figure 898660DEST_PATH_IMAGE018
(1)

同理,在t2时刻,可得到式(2),Similarly, at timet2 , formula (2) can be obtained,

Figure 248870DEST_PATH_IMAGE020
                 (2)
Figure 248870DEST_PATH_IMAGE020
(2)

如果t1t2为两个相邻的采样时刻,可近似认为

Figure 276869DEST_PATH_IMAGE022
Figure 458452DEST_PATH_IMAGE024
,(2)式减去(1)式,得Ift1 andt2 are two adjacent sampling moments, it can be approximated as
Figure 276869DEST_PATH_IMAGE022
=
Figure 458452DEST_PATH_IMAGE024
, (2) minus (1), get

            (3) (3)

Figure 51741DEST_PATH_IMAGE030
Figure 353409DEST_PATH_IMAGE032
,(上述公式中下标1、2分别表示t1t2时刻的参数,例如
Figure 713984DEST_PATH_IMAGE022
表示t1的相位角)考虑测量误差和计算误差,式(3)可以写成式(4),其中W为误差。make ,
Figure 51741DEST_PATH_IMAGE030
,
Figure 353409DEST_PATH_IMAGE032
, (the subscripts 1 and 2 in the above formula represent the parameters att1 andt2 respectively, for example
Figure 713984DEST_PATH_IMAGE022
Represents the phase angle oft1 ) Considering the measurement error and calculation error, formula (3) can be written as formula (4), whereW is the error.

Figure 101103DEST_PATH_IMAGE034
                          (4)
Figure 101103DEST_PATH_IMAGE034
(4)

假设已得到k组数据,以残差平方和最小为目标确定RsXs的最优估计值,求解(4)式,得Assuming thatk sets of data have been obtained, the optimal estimated values ofRs andXs are determined with the goal of minimizing the sum of squared residuals, and formula (4) is solved to obtain

Figure 907122DEST_PATH_IMAGE036
              (5)
Figure 907122DEST_PATH_IMAGE036
(5)

在原有的k组采样数据增加了一组采样数据以后,有After adding a set of sampling data to the originalk sets of sampling data, there is

Figure 797718DEST_PATH_IMAGE038
      (6)
Figure 797718DEST_PATH_IMAGE038
(6)

其中,

Figure 203609DEST_PATH_IMAGE042
,则
Figure 314784DEST_PATH_IMAGE044
存在式(7)的关系。in, ,
Figure 203609DEST_PATH_IMAGE042
,but
Figure 314784DEST_PATH_IMAGE044
and There is a relation of formula (7).

Figure 293421DEST_PATH_IMAGE048
         (7)
Figure 293421DEST_PATH_IMAGE048
(7)

其中

Figure 389553DEST_PATH_IMAGE050
。in
Figure 389553DEST_PATH_IMAGE050
.

将由式(7)估计的系统阻抗代入式(3),得到t2时刻的节点电压状态估计值。当

Figure 904028DEST_PATH_IMAGE054
Figure 42886DEST_PATH_IMAGE056
,当前估计值偏离实际值较大,说明此前的样本集不适合用来估计这个时刻的系统参数,清空量测量样本集,重新开始递推估计。Substitutingthe system impedance estimated by equation (7) into equation (3), the estimated value of the node voltage state at timet2 is obtained . when
Figure 904028DEST_PATH_IMAGE054
or
Figure 42886DEST_PATH_IMAGE056
, the current estimated value deviates greatly from the actual value, indicating that the previous sample set is not suitable for estimating the system parameters at this moment, clear the amount measurement sample set, and restart the recursive estimation.

1.2            预警指标

Figure 626314DEST_PATH_IMAGE008
Figure 876029DEST_PATH_IMAGE010
的计算方法1.2 Early warning indicators
Figure 626314DEST_PATH_IMAGE008
and
Figure 876029DEST_PATH_IMAGE010
calculation method

采用快速傅立叶算法从负荷电压、电流波形采样值分别计算各次谐波电压

Figure 798986DEST_PATH_IMAGE058
、谐波电压相位
Figure 108745DEST_PATH_IMAGE060
、谐波电流
Figure 179469DEST_PATH_IMAGE062
、谐波电流相位
Figure 232876DEST_PATH_IMAGE064
。在计算得到系统等效阻抗的估计值以后,可以计算系统等效谐波阻抗
Figure 511804DEST_PATH_IMAGE066
Figure 992463DEST_PATH_IMAGE070
。用负荷电流中的谐波分量乘以系统等效谐波阻抗,得到该负荷在系统阻抗上引起的谐波电压
Figure 142002DEST_PATH_IMAGE072
。将
Figure 773972DEST_PATH_IMAGE072
在节点电压的谐波相量上投影,计算投影分量t。对所有的谐波电流进行重复以上计算,此后计算所有谐波电压
Figure 470849DEST_PATH_IMAGE072
、投影分量与供电点基波电压比值之和的均方根
Figure 352535DEST_PATH_IMAGE008
Figure 440576DEST_PATH_IMAGE010
作为预警指标。为了与谐波国标限值比较,预警指标还按照实际系统短路容量、供电容量和协议容量进行归算。具体计算过程如下所述。Use fast Fourier algorithm to calculate each harmonic voltage from load voltage and current waveform sampling values
Figure 798986DEST_PATH_IMAGE058
, harmonic voltage phase
Figure 108745DEST_PATH_IMAGE060
, Harmonic current
Figure 179469DEST_PATH_IMAGE062
, Harmonic current phase
Figure 232876DEST_PATH_IMAGE064
. After calculating the estimated value of the equivalent impedance of the system, the equivalent harmonic impedance of the system can be calculated
Figure 511804DEST_PATH_IMAGE066
, ,
Figure 992463DEST_PATH_IMAGE070
. Harmonic components in the load current Multiply by the equivalent harmonic impedance of the system to get the harmonic voltage caused by the load on the system impedance
Figure 142002DEST_PATH_IMAGE072
. Will
Figure 773972DEST_PATH_IMAGE072
Project on the harmonic phasors of the nodal voltages, computing the projected componentst . Repeat the above calculation for all harmonic currents, after that calculate all harmonic voltages
Figure 470849DEST_PATH_IMAGE072
, projection component The root mean square of the sum of the ratio of the fundamental wave voltage to the power supply point
Figure 352535DEST_PATH_IMAGE008
and
Figure 440576DEST_PATH_IMAGE010
as an early warning indicator. In order to compare with the harmonic national standard limits, the early warning indicators are also calculated according to the actual system short-circuit capacity, power supply capacity and agreement capacity. The specific calculation process is as follows.

设公共连接点的谐波等效网络如图3所示,其中系统谐波阻抗

Figure 707610DEST_PATH_IMAGE066
。实际测量得到的公共连接点谐波电压是供电系统中所有谐波源的全部作用效果。为了单独衡量监测用户对供电系统谐波污染的程度,由图3计算负荷谐波电流在公共连接点形成的谐波电压分量
Figure DEST_PATH_IMAGE078
,并比较
Figure 247492DEST_PATH_IMAGE058
Figure 506436DEST_PATH_IMAGE058
,进一步计算预警指标
Figure 260765DEST_PATH_IMAGE008
Figure 433995DEST_PATH_IMAGE010
。The harmonic equivalent network of the common connection point is shown in Figure 3, where the system harmonic impedance
Figure 707610DEST_PATH_IMAGE066
. Harmonic voltage of the common connection point obtained by actual measurement It is the total effect of all harmonic sources in the power supply system. In order to separately measure and monitor the user's degree of harmonic pollution to the power supply system, the harmonic voltage component formed by the load harmonic current at the common connection point is calculated from Figure 3
Figure DEST_PATH_IMAGE078
, and compare
Figure 247492DEST_PATH_IMAGE058
and
Figure 506436DEST_PATH_IMAGE058
, to further calculate the early warning indicators
Figure 260765DEST_PATH_IMAGE008
and
Figure 433995DEST_PATH_IMAGE010
.

国标《电能质量 公用电网谐波GB T 14549》定义电压总谐波畸变率如式(8)所示。The national standard "Power Quality Public Grid Harmonics GB T 14549" defines the total harmonic distortion rate of voltage as shown in formula (8).

Figure DEST_PATH_IMAGE080
                                        (8)
Figure DEST_PATH_IMAGE080
(8)

预警指标

Figure 957380DEST_PATH_IMAGE008
的计算公式如式(9)所示。Early warning indicators
Figure 957380DEST_PATH_IMAGE008
The calculation formula of is shown in formula (9).

Figure DEST_PATH_IMAGE082
                                          (9)
Figure DEST_PATH_IMAGE082
(9)

预警指标

Figure 324908DEST_PATH_IMAGE010
的计算公式如式(10)所示。Early warning indicators
Figure 324908DEST_PATH_IMAGE010
The calculation formula of is shown in formula (10).

Figure DEST_PATH_IMAGE084
                                   (10)
Figure DEST_PATH_IMAGE084
(10)

以上两式中,节点谐波电压是根据实际系统等效阻抗计算得到的。In the above two formulas, the node harmonic voltage is calculated based on the equivalent impedance of the actual system.

当前国标中采用电网公司提供的固定短路容量参考值计算电压总谐波畸变率,式(9)采用在线检测的系统阻抗采计算电压总谐波畸变率

Figure 841657DEST_PATH_IMAGE008
能够反映供电节点上的实际谐波污染程度。In the current national standard, the fixed short-circuit capacity reference value provided by the power grid company is used to calculate the total harmonic distortion rate of voltage, and the formula (9) uses the system impedance of online detection to calculate the total harmonic distortion rate of voltage .
Figure 841657DEST_PATH_IMAGE008
It can reflect the actual harmonic pollution degree on the power supply node.

式(10)计算的

Figure 485128DEST_PATH_IMAGE010
Figure 757977DEST_PATH_IMAGE008
中由被监测用户注入污染导致的谐波电压畸变率,真正代表了该用户对系统的污染状况。Calculated by formula (10)
Figure 485128DEST_PATH_IMAGE010
yes
Figure 757977DEST_PATH_IMAGE008
The harmonic voltage distortion rate caused by the pollution injected by the monitored user truly represents the pollution status of the user to the system.

此外,本实施还提供一负荷谐波注入污染预警系统,该系统结构原理图如图4所示。该包括滤波及信号采集模块、第一处理器、第二处理器、触摸屏液晶显示单元以及以太网传输单元;所述的滤波及信号采集模块采集负荷电压、电流波形的采样值,送入所述第一处理器,该第一处理器根据权利要求1所述的方法进行计算预警指标

Figure 565713DEST_PATH_IMAGE010
;并根据第二处理器的控制指令在所述触摸屏液晶显示单元显示或通过所述以太网传输单元上传数据。In addition, this implementation also provides a load harmonic injection pollution warning system, the system structure schematic diagram is shown in Figure 4. This includes a filter and signal acquisition module, a first processor, a second processor, a touch screen liquid crystal display unit, and an Ethernet transmission unit; the filter and signal acquisition module collects sampled values of load voltage and current waveform, and sends them to the The first processor, the first processor calculates the early warning indicator according to the method according to claim 1 and
Figure 565713DEST_PATH_IMAGE010
and displaying on the touch screen liquid crystal display unit or uploading data through the Ethernet transmission unit according to the control instruction of the second processor.

本实施例中,所述滤波及信号采集模块是基于数字信号处理单元,可以实现在线12通道电压、电流信号的高速采集。In this embodiment, the filtering and signal acquisition module is based on a digital signal processing unit, which can realize high-speed acquisition of online 12-channel voltage and current signals.

上述的第一处理器采用TMS320F28335处理器,该处理器完成系统的主要算法。第二处理器采用STM32F407VGT6处理器,该处理器主要负责系统管理、显示、通讯等功能,根据带触摸屏液晶信号进行对应的显示、数据处理、系统参数设置、系统设备运行状态监测,并通过所述的以太网传输单元实现报表上传。本实施例中,该以太网传输单元是以太网DP83848模块。The above-mentioned first processor adopts TMS320F28335 processor, which completes the main algorithm of the system. The second processor adopts STM32F407VGT6 processor, which is mainly responsible for system management, display, communication and other functions, and performs corresponding display, data processing, system parameter setting, system equipment operation status monitoring according to the LCD signal with touch screen, and through the The Ethernet transmission unit realizes report uploading. In this embodiment, the Ethernet transmission unit is an Ethernet DP83848 module.

以上所述仅为本发明的较佳实施例,凡依本发明申请专利范围所做的均等变化与修饰,皆应属本发明的涵盖范围。 The above descriptions are only preferred embodiments of the present invention, and all equivalent changes and modifications made according to the scope of the patent application of the present invention shall fall within the scope of the present invention. the

Claims (9)

1. the implementation method of a Load harmonic injection pollution prewarning, is characterized in that: according to load voltage, current waveform sampled value, calculate respectively fundamental voltage V, fundamental current I and phasing degree, by system impedance of fundamental frequency on-line tracking computing system equivalent resistance
Figure 2012104121805100001DEST_PATH_IMAGE004
With the system equivalent reactance
Figure 2012104121805100001DEST_PATH_IMAGE006
Thereby, can calculate each Load harmonic electric current and inject the supply terminals harmonic voltage numerical value caused separately, further calculate warning index
Figure 2012104121805100001DEST_PATH_IMAGE008
With
Figure DEST_PATH_IMAGE010
, realize that the harmonic pollution user injects pollution evaluation and pollution prewarning.
2. Load harmonic according to claim 1 injects the implementation method of pollution prewarning, and it is characterized in that: described system impedance of fundamental frequency on-line tracing is realized in the following ways: the system equivalent resistance of setting up departments
Figure 323528DEST_PATH_IMAGE004
, the system equivalent reactance
Figure 240669DEST_PATH_IMAGE006
, the system equivalent voltage
Figure DEST_PATH_IMAGE012
Adopt fast fourier algorithm to calculate respectively fundamental voltage V, fundamental voltage phase place from load voltage, current waveform sampled value
Figure DEST_PATH_IMAGE014
, fundamental current I and fundamental current phase place
Figure DEST_PATH_IMAGE016
The first-harmonic calculated value in the cycle for two neighbouring samples respectively, according to Kirchhoff's second law, the fundamental current difference by the difference of the fundamental voltage phasor in two moment divided by two moment, calculate the system equivalent resistance
Figure 958089DEST_PATH_IMAGE004
With the system equivalent reactance
Figure 353298DEST_PATH_IMAGE006
.
3. Load harmonic according to claim 2 injects the implementation method of pollution prewarning, it is characterized in that: in continuous tracing process, take system impedance as quantity of state, take fundamental voltage and fundamental current and set up measurement equation as the measurement amount, adopt least square method to carry out the estimation of quantity of state to measurement amount sample set, obtain the estimated value of system equiva lent impedance, concrete computation process is as follows:
t1Constantly, the application Kirchhoff's second law, can obtain formula (1),
Figure DEST_PATH_IMAGE018
(1)
t2Constantly, can obtain formula (2),
Figure DEST_PATH_IMAGE020
(2)
Ift1Witht2Be two adjacent sampling instants, be similar to and think
Figure DEST_PATH_IMAGE022
=, (2) formula deducts (1) formula:
(3)
Order
Figure DEST_PATH_IMAGE028
,
Figure DEST_PATH_IMAGE030
,, consider measuring error and the error of calculation, formula (3) can be write an accepted way of doing sth (4), whereinWFor error;
Figure DEST_PATH_IMAGE034
(4)
Suppose to obtainkThe group metric data, the residual sum of squares (RSS) minimum of take is determined as target
Figure 541572DEST_PATH_IMAGE004
With
Figure 301718DEST_PATH_IMAGE006
The optimal estimation value, solve (4) formula,
Figure DEST_PATH_IMAGE036
(5)
OriginalkAfter the group sampled data has increased by one group of sampled data, have
Figure DEST_PATH_IMAGE038
(6)
Wherein,
Figure DEST_PATH_IMAGE040
,
Figure DEST_PATH_IMAGE042
,
Figure DEST_PATH_IMAGE044
With
Figure DEST_PATH_IMAGE046
There is the relation of formula (7),
Figure DEST_PATH_IMAGE048
(7)
Wherein
Figure DEST_PATH_IMAGE050
The system impedance substitution formula (3) that to be estimated by formula (7), obtaint2Node voltage state estimation value constantlyWhen
Figure DEST_PATH_IMAGE054
Or
Figure DEST_PATH_IMAGE056
, it is larger that current estimated value departs from actual value, illustrates that sample set before this is not suitable for, for estimating this systematic parameter constantly, emptying measurement amount sample set, restarts recursion and estimates.
4. Load harmonic according to claim 1 injects the implementation method of pollution prewarning, it is characterized in that: described calculating warning indexWith
Figure 144482DEST_PATH_IMAGE010
Realize in the following manner: adopt fast fourier algorithm to calculate respectively each harmonic voltage from load voltage, current waveform sampled value, the harmonic voltage phase place
Figure DEST_PATH_IMAGE060
, harmonic current
Figure DEST_PATH_IMAGE062
, the harmonic current phase place
Figure DEST_PATH_IMAGE064
After the estimated value that calculates the system equiva lent impedance, the impedance of computing system Equivalent Harmonic
Figure DEST_PATH_IMAGE066
,
Figure DEST_PATH_IMAGE068
,
Figure DEST_PATH_IMAGE070
By the harmonic component in load current
Figure 688727DEST_PATH_IMAGE062
Be multiplied by system harmonic impedance, obtain the harmonic voltage that this load causes on system power supply point
Figure DEST_PATH_IMAGE072
Will
Figure 619774DEST_PATH_IMAGE072
Projection on node harmonic voltage phasor, calculate projection components
Figure DEST_PATH_IMAGE074
All harmonic currents are carried out calculating more than repetition, after this calculate all harmonic voltages, projection components
Figure 547333DEST_PATH_IMAGE074
Root mean square with supply terminals fundamental voltage ratio sum
Figure 70719DEST_PATH_IMAGE008
With
Figure 500563DEST_PATH_IMAGE010
As warning index.
5. a Load harmonic injects the pollution prewarning system, it is characterized in that: comprise filtering and signal acquisition module, first processor, the second processor, touch-screen liquid crystal display and Ethernet transmission unit; Described filtering and signal acquisition module gather the sampled value of load voltage, current waveform, send into described first processor, and this first processor method according to claim 1 is calculated warning index
Figure 742189DEST_PATH_IMAGE008
With
Figure 954995DEST_PATH_IMAGE010
And show or by described Ethernet transmission unit uploading data at described touch-screen liquid crystal display according to the steering order of the second processor.
6. Load harmonic according to claim 5 injects the pollution prewarning system, and it is characterized in that: described first processor is the TMS320F28335 processor.
7. Load harmonic according to claim 5 injects the pollution prewarning system, and it is characterized in that: described the second processor is the STM32F407VGT6 processor.
8. Load harmonic according to claim 5 injects the pollution prewarning system, and it is characterized in that: described filtering and signal acquisition module can realize the high speed acquisition of online 12 channel voltages, current signal.
9. Load harmonic according to claim 5 injects the pollution prewarning system, and it is characterized in that: described Ethernet transmission unit is Ethernet DP83848 module.
CN201210412180.5A2012-10-252012-10-25Method and system for implementing early warning of load harmonic injection pollutionActiveCN102937676B (en)

Priority Applications (1)

Application NumberPriority DateFiling DateTitle
CN201210412180.5ACN102937676B (en)2012-10-252012-10-25Method and system for implementing early warning of load harmonic injection pollution

Applications Claiming Priority (1)

Application NumberPriority DateFiling DateTitle
CN201210412180.5ACN102937676B (en)2012-10-252012-10-25Method and system for implementing early warning of load harmonic injection pollution

Publications (2)

Publication NumberPublication Date
CN102937676Atrue CN102937676A (en)2013-02-20
CN102937676B CN102937676B (en)2014-12-10

Family

ID=47696586

Family Applications (1)

Application NumberTitlePriority DateFiling Date
CN201210412180.5AActiveCN102937676B (en)2012-10-252012-10-25Method and system for implementing early warning of load harmonic injection pollution

Country Status (1)

CountryLink
CN (1)CN102937676B (en)

Cited By (3)

* Cited by examiner, † Cited by third party
Publication numberPriority datePublication dateAssigneeTitle
CN103323672A (en)*2013-05-272013-09-25云南电力试验研究院(集团)有限公司电力研究院Online resonant early warning device and method for parallel-connection power capacitor
CN104764930A (en)*2015-03-102015-07-08清华大学Harmonic emission level evaluating method based on correlation property
CN111060750A (en)*2019-12-202020-04-24天津大学Method for estimating impedance of power system equivalent system

Citations (5)

* Cited by examiner, † Cited by third party
Publication numberPriority datePublication dateAssigneeTitle
US6397156B1 (en)*1998-11-172002-05-28Abb Inc.Impedance measurement system for power system transmission lines
CN101762741A (en)*2009-11-302010-06-30福建省电力试验研究院Monitoring and orientation system of pollution sources of electrical energy quality
CN102323494A (en)*2011-05-242012-01-18山东电力研究院 A Multi-Harmonic Source Identification Method
WO2012117551A1 (en)*2011-03-032012-09-07三菱電機株式会社Ac electric quantity measuring device and ac electric quantity measuring method
CN202886501U (en)*2012-10-252013-04-17福州大学Load harmonic injection pollution early warning system

Patent Citations (5)

* Cited by examiner, † Cited by third party
Publication numberPriority datePublication dateAssigneeTitle
US6397156B1 (en)*1998-11-172002-05-28Abb Inc.Impedance measurement system for power system transmission lines
CN101762741A (en)*2009-11-302010-06-30福建省电力试验研究院Monitoring and orientation system of pollution sources of electrical energy quality
WO2012117551A1 (en)*2011-03-032012-09-07三菱電機株式会社Ac electric quantity measuring device and ac electric quantity measuring method
CN102323494A (en)*2011-05-242012-01-18山东电力研究院 A Multi-Harmonic Source Identification Method
CN202886501U (en)*2012-10-252013-04-17福州大学Load harmonic injection pollution early warning system

Non-Patent Citations (2)

* Cited by examiner, † Cited by third party
Title
邵振国 等: "电能质量污染源定位及应用研究", 《华东电力》, vol. 37, no. 12, 31 December 2009 (2009-12-31), pages 2047 - 2050*
陈厦门 等: "复杂电网中谐波源搜索定位的仿真分析", 《电力与电工》, vol. 30, no. 1, 31 March 2010 (2010-03-31)*

Cited By (5)

* Cited by examiner, † Cited by third party
Publication numberPriority datePublication dateAssigneeTitle
CN103323672A (en)*2013-05-272013-09-25云南电力试验研究院(集团)有限公司电力研究院Online resonant early warning device and method for parallel-connection power capacitor
CN103323672B (en)*2013-05-272016-03-16云南电力试验研究院(集团)有限公司电力研究院A kind of online resonance prior-warning device of the parallel power condenser and method
CN104764930A (en)*2015-03-102015-07-08清华大学Harmonic emission level evaluating method based on correlation property
CN104764930B (en)*2015-03-102017-07-28清华大学Harmonic emission level estimation method based on correlation properties
CN111060750A (en)*2019-12-202020-04-24天津大学Method for estimating impedance of power system equivalent system

Also Published As

Publication numberPublication date
CN102937676B (en)2014-12-10

Similar Documents

PublicationPublication DateTitle
CN101661059B (en)Quantitative analysis method of harmonic voltage transmission level of nonlinear load of user terminal and device
WO2007107108A1 (en)A method for measuring the conductivity of the solution and a device thereof
CN106707007A (en)Working method of power transformation equipment insulation online monitoring system
CN108318852B (en) A test method for square wave influence of smart electric energy meter
CN105606900A (en)Single-phase harmonic impedance measuring method based on square wave signals
CN102508026B (en) A harmonic analysis method for a power quality harmonic analyzer
CN104035062B (en)A kind of high accuracy calibration method based on ATT7022E computation chip
CN201548627U (en) Common Coupling Node Harmonic Source Detection System
CN103383412A (en)Adaptive software and hardware frequency tracking and sampling method
CN111934760A (en)Signal processing transmission delay characteristic detection device and method and terminal equipment
CN102937676B (en)Method and system for implementing early warning of load harmonic injection pollution
CN102590598B (en) Ultrasonic signal zero-crossing prediction method based on multi-threshold comparison
CN110837000A (en) FPGA-based frequency measurement system
CN106526317A (en)Phasor measurement accuracy assessment method and assessment apparatus for synchronized phasor measurement unit
CN105223452B (en)Realize electric energy quality monitoring and the electric energy quality monitor and method of pollution sources positioning
CN101707396A (en)Lost sample data processing method based on mathematic models of current and voltage
CN202886501U (en)Load harmonic injection pollution early warning system
CN103344830B (en)A kind of switching-on phase detection method
CN201269907Y (en)Harmonic detector used between electrical power systems
CN104270632B (en)Measuring instrument and method for screen parameters of television set
KR101003462B1 (en) Modified zero crossing frequency detection device and method
CN103364664A (en)Electric energy integrated data processing method
CN103983852B (en)Harmonic analysis method of power quality harmonic analyzer
CN102004854A (en)Method for acquiring nonlinear load equivalent impedance parameters of distribution network in real time
CN104198813B (en) A device and method for measuring the impedance angle of an ultrasonic transducer by an orthogonal correlation method

Legal Events

DateCodeTitleDescription
C06Publication
PB01Publication
C10Entry into substantive examination
SE01Entry into force of request for substantive examination
C14Grant of patent or utility model
GR01Patent grant

[8]ページ先頭

©2009-2025 Movatter.jp