CN102379721A - Method for dynamically analyzing scatterer distribution change and application thereof - Google Patents
Method for dynamically analyzing scatterer distribution change and application thereofDownload PDFInfo
- Publication number
- CN102379721A CN102379721ACN2010102747764ACN201010274776ACN102379721ACN 102379721 ACN102379721 ACN 102379721ACN 2010102747764 ACN2010102747764 ACN 2010102747764ACN 201010274776 ACN201010274776 ACN 201010274776ACN 102379721 ACN102379721 ACN 102379721A
- Authority
- CN
- China
- Prior art keywords
- data
- distribution
- dynamically
- burning
- ultrasonic
- Prior art date
- Legal status (The legal status is an assumption and is not a legal conclusion. Google has not performed a legal analysis and makes no representation as to the accuracy of the status listed.)
- Pending
Links
- 238000000034methodMethods0.000titleclaimsabstractdescription65
- 238000009826distributionMethods0.000titleclaimsabstractdescription63
- 230000008859changeEffects0.000titleclaimsdescription6
- 238000002679ablationMethods0.000claimsdescription16
- 238000002604ultrasonographyMethods0.000claimsdescription8
- 238000003384imaging methodMethods0.000abstractdescription11
- 238000001514detection methodMethods0.000abstractdescription2
- 230000006870functionEffects0.000description30
- 238000010438heat treatmentMethods0.000description14
- 210000004185liverAnatomy0.000description8
- 238000012545processingMethods0.000description8
- 238000004458analytical methodMethods0.000description5
- XLYOFNOQVPJJNP-UHFFFAOYSA-NwaterSubstancesOXLYOFNOQVPJJNP-UHFFFAOYSA-N0.000description4
- 238000004364calculation methodMethods0.000description3
- 238000012544monitoring processMethods0.000description3
- IJGRMHOSHXDMSA-UHFFFAOYSA-NAtomic nitrogenChemical compoundN#NIJGRMHOSHXDMSA-UHFFFAOYSA-N0.000description2
- 230000000694effectsEffects0.000description2
- 238000010223real-time analysisMethods0.000description2
- 238000005070samplingMethods0.000description2
- LFQSCWFLJHTTHZ-UHFFFAOYSA-NEthanolChemical compoundCCOLFQSCWFLJHTTHZ-UHFFFAOYSA-N0.000description1
- 238000011298ablation treatmentMethods0.000description1
- 238000013459approachMethods0.000description1
- 238000003759clinical diagnosisMethods0.000description1
- 230000001427coherent effectEffects0.000description1
- 238000010219correlation analysisMethods0.000description1
- 230000007850degenerationEffects0.000description1
- 238000011161developmentMethods0.000description1
- 239000007788liquidSubstances0.000description1
- 238000012986modificationMethods0.000description1
- 230000004048modificationEffects0.000description1
- 229910052757nitrogenInorganic materials0.000description1
- 230000003287optical effectEffects0.000description1
- 238000005457optimizationMethods0.000description1
- 235000015277porkNutrition0.000description1
- 230000008569processEffects0.000description1
- 238000011002quantificationMethods0.000description1
- 238000011897real-time detectionMethods0.000description1
- 238000002271resectionMethods0.000description1
- 230000004044responseEffects0.000description1
- 239000000126substanceSubstances0.000description1
- 238000011282treatmentMethods0.000description1
Images

Landscapes
- Ultra Sonic Daignosis Equipment (AREA)
Abstract
Description
Translated fromChinese【技术领域】【Technical field】
本发明是关于一种动态分析超音波散射子的方法及其应用,尤其是一种利用机率密度函数搭配移动窗口技巧的动态分析散射子的方法及其应用。The invention relates to a method for dynamically analyzing ultrasonic scatterers and its application, in particular to a method for dynamically analyzing scatterers using a probability density function combined with a moving window technique and its application.
【背景技术】【Background technique】
近年来非侵入式治疗已受到相当的重视,其中高能聚焦式超音波所引发的局部热烧灼治疗是辅助性外科切除患部相当有潜力的新工具。但临床医生仅通过传统超音波B模式(B-mode)影像不易判断出烧灼区域及烧灼程度,因而增添医疗过程的危险性。In recent years, non-invasive treatment has received considerable attention, and local thermal ablation treatment induced by high-energy focused ultrasound is a promising new tool for assisted surgical resection of the affected part. However, it is difficult for clinicians to judge the burning area and degree of burning only through traditional ultrasonic B-mode images, thus increasing the risk of medical procedures.
目前有学者研究整合式的超音波温度影像与弹性影像用于高能聚焦式超音波热烧灼的监控,但由于其相关分析算法速度耗时,因此限制其实时化分析的功能。At present, some scholars have studied the integrated ultrasonic temperature image and elastic image for the monitoring of high-energy focused ultrasonic thermal ablation. However, due to the time-consuming speed of its correlation analysis algorithm, its real-time analysis function is limited.
美国专利申请号20080154131,揭示一种增加烧灼区域可见度的方法,包括取得烧灼区域的输入影像数据,其中影像数据包含逆散射子(backscatterer)的浓度,并依据影像数据使用一动态增益曲线以得到一输出信号以增加烧灼区域可见度。然而,其仍无法做到动态分析监控烧灼区域。U.S. Patent Application No. 20080154131 discloses a method for increasing the visibility of a burnt area, including obtaining input image data of the burnt area, wherein the image data includes the concentration of backscatterers, and using a dynamic gain curve according to the image data to obtain a Output signal to increase the visibility of the cauterized area. However, it is still not possible to dynamically analyze and monitor the burn area.
综合上述,目前亟需一种可实时检测及分析监控烧灼区域的方法。Based on the above, there is an urgent need for a method that can detect, analyze and monitor the burning area in real time.
【发明内容】【Content of invention】
本发明的目的之一为提供动态分析散射子的方法,其可通过利用机率密度函数搭配移动窗口技巧,实时分析超音波数据散射子分布的变化。本发明的运算量相当低,因此可以达成实时化的成像。One of the objectives of the present invention is to provide a method for dynamically analyzing scatterers, which can analyze changes in the distribution of scatterers in ultrasonic data in real time by using a probability density function combined with a moving window technique. The calculation amount of the present invention is quite low, so real-time imaging can be achieved.
依据本发明的一实施例,一种动态分析散射子分布变化的方法,包含下列步骤:依序取得一样品之一第一超音波数据及一第二超音波数据,其中第一超音波数据及第二超音波数据分别具有多个相对应的坐标点及由多个散射子所形成的多个斑点;定义一窗口的尺寸;搭配移动窗口技巧,利用一机率密度函数计算每一坐标点的统计参数,统计参数表示每一坐标点在移动窗口内的斑点信号大小的统计分布;以及比较第一和第二超音波数据中每一相对应的坐标点的统计参数,以动态分析样品的散射子分布和浓度改变情形。According to an embodiment of the present invention, a method for dynamically analyzing changes in the distribution of scatterers includes the following steps: sequentially obtain a first ultrasonic data and a second ultrasonic data of a sample, wherein the first ultrasonic data and The second ultrasonic data has a plurality of corresponding coordinate points and a plurality of spots formed by a plurality of scatterers; define the size of a window; use a probability density function to calculate the statistics of each coordinate point with the moving window technique Parameters, the statistical parameters represent the statistical distribution of the speckle signal size of each coordinate point in the moving window; and compare the statistical parameters of each corresponding coordinate point in the first and second ultrasonic data to dynamically analyze the scatterers of the sample Distribution and concentration changes.
本发明的另一目的,是利用上述散射子分布的变化以进行实时动态检测烧灼区域及分析烧灼程度,并可用以动态控制烧灼强度。依据本发明的另一实施例,一种实时动态检测和分析烧灼区域的方法,包含:依序取得一烧灼区域之一第一超音波数据及一第二超音波数据,其中第一超音波数据及第二超音波数据分别具有多个相对应的坐标点及由多个散射子所形成的多个斑点;定义一窗口的尺寸;搭配移动窗口技巧,利用一机率密度函数计算每一坐标点的统计参数,统计参数表示每一坐标点在对应移动窗口内的斑点信号大小的统计分布;以及比较第一和第二超音波数据中每一相对应的坐标点的统计参数,实时动态分析造影区域的散射子分布和浓度改变情形以检测确切烧灼区域及动态分析烧灼程度。Another object of the present invention is to use the changes in the distribution of the above-mentioned scatterers to dynamically detect the burning area and analyze the degree of burning in real time, and can be used to dynamically control the burning intensity. According to another embodiment of the present invention, a method for real-time dynamic detection and analysis of a burnt area includes: sequentially obtaining a first ultrasonic data and a second ultrasonic data of a burnt area, wherein the first ultrasonic data and the second ultrasonic data respectively have a plurality of corresponding coordinate points and a plurality of spots formed by a plurality of scatterers; define the size of a window; and use a probability density function to calculate the value of each coordinate point with the moving window technique Statistical parameters, the statistical parameters represent the statistical distribution of the speckle signal size of each coordinate point in the corresponding moving window; and compare the statistical parameters of each corresponding coordinate point in the first and second ultrasound data, and dynamically analyze the contrast area in real time The scatterer distribution and concentration changes can be used to detect the exact burn area and dynamically analyze the burn degree.
依据本发明的再一实施例,一种动态控制烧灼强度的方法,包含:以一烧灼装置烧灼之一烧灼区域;依序取得烧灼区域之一第一超音波数据及一第二超音波数据,其中第一超音波数据及第二超音波数据分别具有多个相对应的坐标点及由多个散射子所形成的多个斑点;定义一窗口的尺寸;搭配移动窗口技巧,利用一机率密度函数计算每一坐标点的统计参数,统计参数表示每一坐标点在对应移动窗口内的斑点信号大小的统计分布;比较第一和第二超音波数据中每一相对应的坐标点的统计参数,以动态分析烧灼区域的散射子分布改变情形及烧灼程度;以及依据烧灼区域的烧灼程度动态控制烧灼装置的强度。According to yet another embodiment of the present invention, a method for dynamically controlling ablation intensity includes: using a cautery device to ablate a cautery area; sequentially obtaining a first ultrasonic data and a second ultrasonic data of the ablation area, The first ultrasonic data and the second ultrasonic data respectively have a plurality of corresponding coordinate points and a plurality of spots formed by a plurality of scatterers; define the size of a window; use a probability density function with moving window technique Calculate the statistical parameters of each coordinate point, the statistical parameters represent the statistical distribution of the speckle signal size of each coordinate point in the corresponding moving window; compare the statistical parameters of each corresponding coordinate point in the first and second ultrasonic data, Dynamically analyze the distribution change of the scatters in the burning area and the burning degree; and dynamically control the intensity of the burning device according to the burning degree of the burning area.
本发明上述及其它态样、特性及优势可由附图及实施例的说明而可更加了解。The above and other aspects, characteristics and advantages of the present invention can be better understood from the accompanying drawings and descriptions of the embodiments.
【附图说明】【Description of drawings】
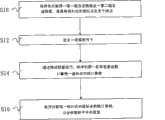
图1为流程图显示依据本发明一实施例的动态分析散射子分布变化的方法。FIG. 1 is a flowchart showing a method for dynamically analyzing changes in the distribution of scatterers according to an embodiment of the present invention.
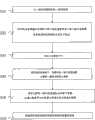
图2为流程图显示依据本发明一实施例的动态检测烧灼区域及分析烧灼程度的方法。FIG. 2 is a flowchart showing a method for dynamically detecting a burning area and analyzing a burning degree according to an embodiment of the present invention.
图3为流程图显示依据本发明一实施例的动态控制烧灼强度的方法。FIG. 3 is a flowchart showing a method for dynamically controlling cauterization intensity according to an embodiment of the present invention.
图4为图式显示Nakagami参数m的统计分布。Figure 4 is a graph showing the statistical distribution of the Nakagami parameter m.
图5为折线图显示窗口大小与分辨率的关系。Figure 5 is a line graph showing the relationship between window size and resolution.
附件1及2为图标显示本发明一实施例的实验结果。
【主要组件符号说明】[Description of main component symbols]
S10-S16 动态分析散射子分布变化的方法步骤S10-S16 Method steps for dynamically analyzing changes in the distribution of scatterers
S20-S26 动态检测烧灼区域及分析烧灼程度的方法步骤S20-S26 Method steps for dynamically detecting burn area and analyzing burn degree
S30-S39 动态控制烧灼强度的方法步骤S30-S39 Method steps for dynamically controlling burn intensity
【具体实施方式】【Detailed ways】
本发明的目的之一是利用机率密度函数(probability density function,PDF)搭配移动窗口(Moving Window)技巧分析超音波数据的二维或三维散射子分布。One of the objectives of the present invention is to analyze the two-dimensional or three-dimensional scatter sub-distribution of ultrasonic data by using the probability density function (PDF) combined with the moving window (Moving Window) technique.
其中,机率密度函数(probability density function,PDF)为描述随机变量的机率分布。在统计理论之中,连续随机变量的机率密度函数用以描述在一观察空间之内的一特定点其发生随机变量的相对可能性。Among them, the probability density function (probability density function, PDF) is the probability distribution describing the random variable. In statistical theory, the probability density function of a continuous random variable is used to describe the relative probability of a random variable occurring at a specific point within an observation space.
在移动窗口部分,本发明依超音波影像系统的分辨率先定义一窗口大小,接着移动窗口,并利用机率密度函数计算窗口范围内的统计参数,以计算窗口区域内的斑点信号大小的统计分布,进而分析散射子分布變異。In the moving window part, the present invention first defines a window size according to the resolution of the ultrasonic imaging system, then moves the window, and uses the probability density function to calculate the statistical parameters in the window range to calculate the statistical distribution of the speckle signal size in the window area, Then analyze the variation of scatterer distribution.
以下更加详述本发明的实施方式。请参照图1,其为流程图显示依据本发明一实施例的动态分析散射子分布变化的方法,包括:首先在步骤S10,依序取得一样品之一第一超音波数据及一第二超音波数据,其中第一超音波数据及第二超音波数据分别具有多个相对应的坐标点及由多个散射子所形成的多个斑点。Embodiments of the present invention are described in more detail below. Please refer to FIG. 1 , which is a flowchart showing a method for dynamically analyzing changes in the distribution of scattering sub-distributions according to an embodiment of the present invention, including: first at step S10, sequentially obtaining a first ultrasonic data and a second ultrasonic data of a sample The acoustic wave data, wherein the first ultrasonic wave data and the second ultrasonic wave data respectively have a plurality of corresponding coordinate points and a plurality of spots formed by a plurality of scatterers.
超音波数据(指的是第一超音波数据及第二超音波数据)具有一定的分辨率,而相对应的坐标点通常指的是产生超音波数据的超音波系统所具有的分辨率,较佳为依据分辨率的每一像素作为每一坐标点以进行后续的数据处理。然而,为增加系统运算速度,亦有可能依固定间隔的坐标点进行运算。The ultrasonic data (referring to the first ultrasonic data and the second ultrasonic data) has a certain resolution, and the corresponding coordinate points usually refer to the resolution of the ultrasonic system that generates the ultrasonic data. Preferably, each pixel according to the resolution is used as each coordinate point for subsequent data processing. However, in order to increase the operating speed of the system, it is also possible to perform calculations based on coordinate points at fixed intervals.
超音波数据是由斑点所构成。斑点为影像中多个亮暗不定的点,其形成为当超音波在身体组织中传递,在产生散射的地方,也就是散射子(Scatterer),由于散射子的大小比超音波的波长短得许多,而不均匀处数量众多时就会产生散射现象。当超音波遇到散射子时,其散射出来的声波是往四面八方传递,而沿着原来入射方向反向折回(backscattering)的散射波,便是构成超音波影像的主要信号。斑点的成因则是由于超音波影像的分辨率有限无法具有无限小的取样体积,因此,在一个取样体积中,通常包含了数十个以上的散射子,这使得原本系统的声波打到单一散射子的响应,要考虑到在同一取样体积中的其它散射子,并把这些散射子的散射效应加总起来呈现。Ultrasonic data is made up of spots. Spots are multiple bright and dark points in the image, which are formed when the ultrasonic wave is transmitted in the body tissue, where the scattering occurs, that is, the scatterer (Scatterer), because the size of the scatterer is much shorter than the wavelength of the ultrasonic wave Many, when the number of inhomogeneities is large, scattering will occur. When the ultrasonic wave encounters a scatterer, the scattered sound wave is transmitted in all directions, and the scattered wave backscattering along the original incident direction is the main signal that constitutes the ultrasonic image. The reason for the speckle is that the resolution of the ultrasonic image is limited and it is impossible to have an infinitely small sampling volume. Therefore, in a sampling volume, there are usually more than dozens of scatterers, which makes the sound wave of the original system hit a single scatterer. The response of a scatterer takes into account other scatterers in the same sample volume and presents the sum of the scattering effects of these scatterers.
超音波数据的原始数据为射频(radio frequency,RF)数据,经后续基频解调(baseband demodulation)可产生包络数据(envelop data),并可进一步处理为影像数据。由于包络数据的数据量较射频数据小,因此本发明所用的超音波数据主要利用包络数据进行处理,然而亦可使用射频数据或影像数据转换为包络数据以进行后续处理。此外,超音波数据可为二维或是三维的超音波影像。The original data of ultrasonic data is radio frequency (radio frequency, RF) data, which can generate envelope data (envelop data) after subsequent baseband demodulation (baseband demodulation), and can be further processed into image data. Since the data volume of the envelope data is smaller than that of the radio frequency data, the ultrasonic data used in the present invention is mainly processed by the envelope data, but the radio frequency data or image data can also be converted into the envelope data for subsequent processing. In addition, the ultrasound data can be a two-dimensional or three-dimensional ultrasound image.
接着在步骤S12,定义一窗口(window)的尺寸。步骤S12为进行移动窗口技巧的准备步骤。其中,窗口的大小及形状会直接影响后续机率密度函数的分辨率及准确度。其中使用小的窗口可改善分辨率,但是包含的封包信息太少会影响利用机率密度函数所估算窗口区域的统计参数的准确度。大的窗口则会使分辨率下降。所以为了同时兼顾影像分辨率与统计参数的准确度,必须先找出适当的窗口大小,在本发明之后续实施例之中,会举例说明最佳化窗口的大小及形状。Next in step S12, the size of a window is defined. Step S12 is a preparatory step for performing the moving window technique. Among them, the size and shape of the window will directly affect the resolution and accuracy of the subsequent probability density function. Using a small window can improve the resolution, but too little packet information will affect the accuracy of statistical parameters of the window area estimated by the probability density function. Larger windows will degrade the resolution. Therefore, in order to take into account both the image resolution and the accuracy of statistical parameters, an appropriate window size must be found first. In subsequent embodiments of the present invention, examples will be given to illustrate the optimized window size and shape.
接着在步骤S14,利用一机率密度函数计算每一坐标点的统计参数,统计参数表示每一坐标点在对应移动窗口内的斑点信号大小的统计分布。统计参数可为一个或多个,例如平均值、标准差值等等。步骤S14即为搭配移动窗口技巧,利用机率密度函数计算窗口数据内的统计参数,也就是每一坐标点在窗口内的斑点信号大小的统计分布。常见的机率密度函数可包括:Nakagami分布、Rayleigh模式、Gaussian模式、Blackman模式及K分布模式等。Then in step S14, a probability density function is used to calculate the statistical parameter of each coordinate point, and the statistical parameter represents the statistical distribution of the speckle signal size of each coordinate point within the corresponding moving window. There may be one or more statistical parameters, such as mean value, standard deviation value, and so on. Step S14 is to use the moving window technique to calculate the statistical parameters in the window data by using the probability density function, that is, the statistical distribution of the speckle signal size of each coordinate point in the window. Common probability density functions may include: Nakagami distribution, Rayleigh model, Gaussian model, Blackman model and K distribution model, etc.
散射子依排列性质可分为随机排列的散射子(incoherent scatterer)及周期排列的散射子(coherent scatterer),其可能因为光、热、音波或其它能量而相互转换,进而影响其散射值、其分布排列与浓度以及斑点的信号大小。来自组织的超音波逆散射信号,其机率密度函数与组织内部散射子的个数与排列有关。换言的,描述回波信号的逆散射统计分布可应用至组织特性定量,并在临床诊断具有极大的发展空间与潜力。The scatterers can be divided into randomly arranged scatterers (incoherent scatterer) and periodically arranged scatterers (coherent scatterer) according to the nature of the arrangement, which may be converted to each other due to light, heat, sound waves or other energies, thereby affecting its scattering value, its Distribution arrangement and concentration and signal size of spots. The probability density function of ultrasonic inverse scattering signal from tissue is related to the number and arrangement of scatterers inside the tissue. In other words, the inverse scattering statistical distribution describing the echo signal can be applied to the quantification of tissue properties, and has great development space and potential in clinical diagnosis.
最后在步骤S16,比较第一和第二超音波数据中每一相对应的坐标点的统计参数,以动态分析散射子分布和浓度的改变。统计参数的比对方法最简易的方式为相减,然而亦可使用其它增益的方式,以达到更高的对比。此外,亦可设定一统计参数参考值,将每一坐标点的统计参数与统计参数参考值相比较,藉此比较差异。此外在一实施例之中,可利用每一相对应的坐标点的统计参数的比较结果形成统计差数差异影像(differential image),以利动态分析散射子分布变化的区域。Finally, in step S16, the statistical parameters of each corresponding coordinate point in the first and second ultrasonic data are compared, so as to dynamically analyze changes in the distribution and concentration of scatterers. The easiest way to compare statistical parameters is subtraction, but other gain methods can also be used to achieve higher comparison. In addition, a statistical parameter reference value can also be set, and the statistical parameter of each coordinate point is compared with the statistical parameter reference value, so as to compare the differences. In addition, in an embodiment, the comparison result of the statistical parameters of each corresponding coordinate point can be used to form a statistical difference image (differential image), so as to dynamically analyze the region where the distribution of scattering sub-distributions changes.
本发明的实时动态分析散射子的方法是利用机率密度函数搭配移动窗口分析超音波包络数据,由于本发明可以分析适当大小的移动窗口之内的数据量以及包络数据量较射频数据小,因此可控制并维持低计算量,因此可以达成实时分析(每秒30数据框以上)的运算。The method for real-time dynamic analysis of scatterers of the present invention is to use the probability density function with a moving window to analyze the ultrasonic envelope data, because the present invention can analyze the amount of data within the moving window of an appropriate size and the amount of envelope data is smaller than the radio frequency data, Therefore, the computation load can be controlled and kept low, so that real-time analysis (more than 30 data frames per second) can be achieved.
对于熟知本项技术人士而言,上述的范例及方法步骤可通过客制化的电路或硬件执行,亦可通过具有处理器的系统(例如一般用途或是特殊用途的计算机)以适当的程序代码执行。上述搭配移动窗口技巧的机率密度函数计算功能可通过中央处理器(Central Processing Unit,CPU)或是图形处理器(Graphics Processing Unit,GPU)实时实现。应注意的是,本发明的部分或是全部步骤可以以不同顺序或是实质上同时处理(也就是平行处理)的不同实施方式执行。此外,上述功能可以用多种程序语言实现,例如但不限于C++或Java。熟知本项技术人士可了解这些程序代码可储存或转存于一或多种有形的、机器可读的媒介,例如内存、主机或是远程硬盘、光盘(CD或DVD),或其它媒介,以便由具有处理器的系统存取以执行储存的程序代码。For those skilled in the art, the above-mentioned examples and method steps can be implemented by customized circuits or hardware, or by a system with a processor (such as a general-purpose or special-purpose computer) with appropriate program code implement. The above-mentioned probability density function calculation function combined with the moving window technique can be realized in real time through a central processing unit (Central Processing Unit, CPU) or a graphics processing unit (Graphics Processing Unit, GPU). It should be noted that some or all of the steps of the present invention may be performed in a different order or in a different embodiment with substantially simultaneous processing (ie, parallel processing). In addition, the above functions can be realized by various programming languages, such as but not limited to C++ or Java. Those skilled in the art can understand that these program codes can be stored or transferred in one or more tangible, machine-readable media, such as memory, host or remote hard disk, optical disc (CD or DVD), or other media, so that The stored program code is accessed by a system having a processor for execution.
如上所述,散射子的排列及散射性质可能由于受热或烧灼而有所改变,因此请参照图2,其为流程图显示依据本发明一实施例的动态检测及分析烧灼区域的方法。在步骤S20,依序取得一烧灼区域之一第一超音波数据及一第二超音波数据,其中第一超音波数据及第二超音波数据分别具有多个相对应的坐标点及由多个散射子所形成的多个斑点;步骤S22定义一窗口的尺寸;步骤S24,搭配移动窗口技巧,利用一机率密度函数计算每一坐标点的统计参数,统计参数表示每一坐标点在窗口内的斑点信号大小的统计分布;以及步骤S26,比较第一和第二超音波数据中每一相对应的坐标点的统计参数,通过动态分析造影区域中的散射子分布改变情形来检测确切烧灼区域及进一步分析烧灼程度,并可用以形成一统计参数差异影像,以利比较。其中,烧灼区域不论是否有气泡产生,皆可利用本发明检测烧灼区域及分析烧灼程度。此外烧灼区域可能由化学药品(例如酒清、液态氮等)、超音波或激光等因子所造成。As mentioned above, the arrangement and scattering properties of scatterers may be changed due to heating or burning, so please refer to FIG. 2 , which is a flow chart showing a method for dynamically detecting and analyzing a burnt area according to an embodiment of the present invention. In step S20, a first ultrasonic data and a second ultrasonic data of a burning area are sequentially obtained, wherein the first ultrasonic data and the second ultrasonic data respectively have a plurality of corresponding coordinate points and consist of a plurality of A plurality of spots formed by scatterers; Step S22 defines the size of a window; Step S24, with the technique of moving the window, utilizes a probability density function to calculate the statistical parameters of each coordinate point, and the statistical parameters represent the position of each coordinate point in the window The statistical distribution of the size of the speckle signal; and step S26, comparing the statistical parameters of each corresponding coordinate point in the first and second ultrasonic data, and detecting the exact burning area and Further analysis of the burning degree can be used to form a statistical parameter difference image for comparison. Wherein, regardless of whether there are bubbles in the burning area, the present invention can be used to detect the burning area and analyze the degree of burning. In addition, the burning area may be caused by factors such as chemicals (such as alcohol, liquid nitrogen, etc.), ultrasound or laser.
此外,本发明亦可用于非侵入式组织烧灼的监控,以达到受控的加热区域及加热程度,进而减少医疗过程所产生的危险性。请参照图3,其为流程图显示依据本发明一实施例的动态控制烧灼强度的方法,包含步骤S30,以一烧灼装置烧灼的一烧灼区域;步骤S32,依序取得烧灼区域的一第一超音波数据及一第二超音波数据,其中第一超音波数据及第二超音波数据分别具有多个相对应的坐标点及由多个散射子所形成的多个斑点;步骤S34,定义一窗口的尺寸;步骤S36,利用一机率密度函数计算每一坐标点的一统计参数,统计参数表示每一坐标点的窗口之内的斑点信号大小的统计分布;步骤S38:比较第一和第二超音波每一相对应的坐标点的统计参数,以分析烧灼区域的散射子分布改变情形及烧灼程度;以及步骤40,依据烧灼区域的烧灼程度控制烧灼装置的强度。其中烧灼装置可为侵入式和非侵入式,其中非侵入式的烧灼装置例如可为一高能聚焦超音波(High-intensity focusedultrasound therapy,HIFU)或一激光。In addition, the present invention can also be used in the monitoring of non-invasive tissue ablation, so as to achieve controlled heating area and heating degree, thereby reducing the danger of medical procedures. Please refer to FIG. 3 , which is a flowchart showing a method for dynamically controlling the cautery intensity according to an embodiment of the present invention, including step S30, using a cauterization device to cauterize a cautery area; step S32, obtaining a first one of the cautery area in sequence Ultrasonic data and a second ultrasonic data, wherein the first ultrasonic data and the second ultrasonic data respectively have a plurality of corresponding coordinate points and a plurality of spots formed by a plurality of scatterers; step S34, define a The size of the window; step S36, utilize a probability density function to calculate a statistical parameter of each coordinate point, the statistical parameter represents the statistical distribution of the speckle signal size in the window of each coordinate point; Step S38: compare the first and the second Statistical parameters of each corresponding coordinate point of the ultrasonic waves to analyze changes in the distribution of scattering sub-distributions and the degree of ablation in the ablation area; and step 40, controlling the intensity of the ablation device according to the ablation degree of the ablation area. The cautery device can be invasive or non-invasive, and the non-invasive cautery device can be, for example, a high-intensity focused ultrasound (HIFU) or a laser.
以下通过具体实施例配合附图详加说明,可更容易了解本发明的目的、技术内容、特点及所达成的功效,并据以实施,但不能以此限定本发明的保护范围。In the following, detailed descriptions will be made through specific embodiments with accompanying drawings, so that the purpose, technical content, characteristics and achieved effects of the present invention can be more easily understood and implemented accordingly, but the protection scope of the present invention cannot be limited thereby.
Nakagami机率密度函数Nakagami probability density function
在Nakagami机率密度函数下,超音波逆散射(back-scattered)封包统计分布模型服从以下公式Under the Nakagami probability density function, the ultrasonic back-scattered packet statistical distribution model obeys the following formula
其中,Γ(.)和U(.)分别为伽马函数(gamma function)和单位阶跃函数(unit step function)。另外定义E(.)为统计的平均值,R为逆散射包络数据大小,再利用下面的公式计算出尺度参数(scaling parameter)Ω和Nakagami参数m。Among them, Γ(.) and U(.) are the gamma function and the unit step function, respectively. In addition, define E(.) as the statistical average value, R as the size of the inverse scattering envelope data, and then use the following formula to calculate the scaling parameter (scaling parameter) Ω and Nakagami parameter m.
Nakagami参数m是形状参数。由图4可看出,当m值从0变化至1时,包络数据的统计分布会由pre-Rayleigh分布趋近于Rayleigh分布;如果m值大于1,则表示逆散射统计倾向post-Rayleigh分布。不同的m值会对应到不同的散射子情况。简单的数学运算和多样化的特性使得可以利用Nakagami分布模型做为描述超音波逆散射统计的模型。目前已有学者提出Nakagami超音波参数影像理论,其成像方式乃利用Nakagami机率密度函数中的参数m作为影像上的像素进而成像,然而在本发明中尺度参数(scalingparameter)Ω亦可用于成像用途。The Nakagami parameter m is a shape parameter. It can be seen from Figure 4 that when the m value changes from 0 to 1, the statistical distribution of the envelope data will approach the Rayleigh distribution from the pre-Rayleigh distribution; if the m value is greater than 1, it means that the inverse scattering statistics tend to be post-Rayleigh distributed. Different values of m correspond to different scatter subcases. Simple mathematical operations and diverse characteristics make it possible to use the Nakagami distribution model as a model to describe the statistics of ultrasonic backscattering. At present, scholars have proposed the Nakagami ultrasonic parameter imaging theory, and its imaging method is to use the parameter m in the Nakagami probability density function as the pixel on the image for imaging. However, in the present invention, the scaling parameter (scaling parameter) Ω can also be used for imaging purposes.
Nakagami影像成像方法Nakagami imaging method
首先爲座標定义窗口尺寸,其次利用此窗口内的包络数据计算局部逆散射分布,进而得到该窗口区域的Nakagami参数m,再将此m填回窗口中心位置的座標點。窗口每次移动一个像素的距离,就重复上述动作,最后便可得到影像上每个画素对应的m值,即得到所谓的Nakagami影像。First define the window size for the coordinates, and then use the envelope data in this window to calculate the local inverse scattering distribution, and then get the Nakagami parameter m of the window area, and then fill this m back to the coordinate point of the center of the window. Each time the window moves a distance of one pixel, the above actions are repeated, and finally the m value corresponding to each pixel on the image can be obtained, that is, the so-called Nakagami image is obtained.
窗口尺寸的最佳化Optimization of window size
在的前学者所提出的理论中,其挑选的窗口形状为正方形,并且选定视定窗口边长为3倍的脉冲长度。然而在本发明之中,因超音波影像系统的轴向与横向分辨率并不相同,以轴向和横向分辨率为基准,我们使用的窗口大小,其长宽则分别为轴向(axial)-6dB分辨率与横向(lateral)-6dB分辨率的倍数,而非单纯地使用正方形窗口,如图5所示,当倍率=4时,可以同时兼顾影像分辨率与m的准确度,因此以下估计局部Nakagami m参数时,所使用的窗口长度与宽度分别为4倍轴向分辨率和4倍横向分辨率。而在以下的实验分析中,依使用的系统分辨率,用来计算Nakagami影像的窗口其长宽分别为1.786和3.4576mm。In the theory proposed by former scholars, the selected window shape is square, and the selected pulse length is 3 times the side length of the fixed window. However, in the present invention, because the axial and lateral resolutions of the ultrasonic imaging system are not the same, based on the axial and lateral resolutions, the length and width of the window size we use are axial (axial) respectively. Multiples of -6dB resolution and lateral (lateral) -6dB resolution, instead of simply using a square window, as shown in Figure 5, when the magnification = 4, both the image resolution and the accuracy of m can be taken into account, so the following When estimating the local Nakagami m parameters, the length and width of the window used are 4 times the axial resolution and 4 times the lateral resolution, respectively. In the following experimental analysis, according to the system resolution used, the length and width of the window used to calculate the Nakagami image are 1.786 and 3.4576mm respectively.
烧灼及超音波影像撷取Burning and Ultrasonic Image Capture
首先取去气水注入水槽中,并将水温控制在30度C,之后再把新鲜猪肝放入水槽内预热,等到猪肝温度到达30度C后,便将之固定在平台上。接着设定HIFU的加热电功率为25w、40w两种功率,准备进行间接加热烧灼。间接加热时间为1.8秒,然后停止1.2秒,在这1.2秒的间撷取一张用以后续分析的包络数据及B-mode影像。如此一个循环共持续3秒。而总加热时间共有20个循环,共60秒。之后让猪肝降温120秒(40个循环),每隔一个循环撷取一张包络数据及B-mode影像。而总实验时间为180秒,共60个循环。Firstly, degassed water is poured into the water tank, and the water temperature is controlled at 30 degrees C. Then, the fresh pork liver is put into the water tank to preheat. When the temperature of the pig liver reaches 30 degrees C, it is fixed on the platform. Then set the heating electric power of HIFU to 25w and 40w to prepare for indirect heating and cautery. The indirect heating time is 1.8 seconds, and then stops for 1.2 seconds. During this 1.2 seconds, an envelope data and B-mode image for subsequent analysis are captured. Such a cycle lasts a total of 3 seconds. The total heating time is 20 cycles totaling 60 seconds. After that, let the pig liver cool down for 120 seconds (40 cycles), and capture an envelope data and B-mode image every other cycle. The total experimental time is 180 seconds, and there are 60 cycles in total.
Nakagami影像与B-mode影像的比较Comparison of Nakagami image and B-mode image
(一)功率为25w的结果(1) The result of a power of 25w
加热过程中观察猪肝被烧灼区域,发现若单只以B-mode影像不能够完全判断出猪肝被高能聚焦式超音波烧灼的位置,其原因乃是烧灼过程中若无明显气泡产生,则B-mode影像难以评估烧灼位置。如附件一所示,图(a)、(b)为25w烧灼60秒的前后B-mode影像,在影像上并无明显气泡产生,故难以观察出烧灼位置。图(c)、(d)则为25w烧灼60秒的前后Nakagami影像,从红色方框所圈出的区域有明显颜色变化,可以看出Nakagami影像弥补了B-mode影像因为无气泡产生而无法看出烧灼区域的问题。图(e)为烧灼前后的Nakagami影像相减后的结果,可以直接显示出烧灼后Nakagami参数有变化的地方,与真实猪肝烧灼后的照片(图(f))中烧灼变性区域位置一致,大小接近。Observing the burned area of the pig liver during the heating process, it is found that if the B-mode image alone cannot completely judge the position of the pig liver burned by the high-energy focused ultrasonic wave, the reason is that if no obvious bubbles are generated during the burning process, then B-mode imaging is difficult to assess the location of the burn. As shown in Attachment 1, pictures (a) and (b) are B-mode images before and after 25w ablation for 60 seconds. There are no obvious bubbles in the images, so it is difficult to observe the ablation position. Figures (c) and (d) are the Nakagami images before and after 25w burning for 60 seconds. From the area circled by the red box, there is an obvious color change. It can be seen that the Nakagami image makes up for the lack of B-mode images due to no bubbles. See problems with burned areas. Picture (e) is the result of Nakagami image subtraction before and after cautery, which can directly show the change of Nakagami parameters after cautery, which is consistent with the position of the cauterized degeneration area in the photo of real pig liver after cautery (picture (f)). The size is close.
(二)功率为40w的结果(2) The result of a power of 40w
加热过程中观察猪肝被烧灼区域,可以从B-mode影像上看出气泡的产生,如附件2的图(a)、(b),大致可得知进行加热区域范围,但无法得知因加热而变性区域的确切位置(见图(f)及图(b)中红色箭头所标示的处)。而图(c)、(d)为40w烧灼60秒的前后Nakagami影像,从影像上变化的区域亦可以看出加热区域。图(e)为烧灼前后的Nakagami影像相减后的结果,可以直接显示出烧灼后Nakagami参数有变化的地方,与真实猪肝烧灼后的照片(图(f))相较,可知其可更明确的显示出因加热而变性的区域位置和大小。Observe the burnt area of the pig liver during the heating process, and you can see the generation of bubbles from the B-mode image, as shown in Figures (a) and (b) of
因此,Nakagami超音波参数影像可以用来辅助B-mode影像因为加热时无气泡产生使得B-mode影像无法观察出烧灼位置的问题,且能较明确显示出因烧灼而变性区域的位置,并且对比度较B-mode影像来得好。对于有气泡产生的情形之中更可以明显从影像上看出加热区域,并且对比度也仍然比B-mode影像来得好。Therefore, the Nakagami ultrasonic parameter image can be used to assist the B-mode image because no bubbles are generated during heating, so that the B-mode image cannot observe the problem of the burning position, and it can clearly show the position of the denatured area due to burning, and the contrast Better than B-mode video. In the case of bubbles, the heating area can be clearly seen in the image, and the contrast is still better than the B-mode image.
综合上述,本发明主要通过搭配移动窗口技巧,利用机率密度函数分析超音波数据的散射子分布。本发明是依超音波影像系统的分辨率定义窗口大小,接着移动窗口,并利用机率密度函数计算窗口范围内的统计意义,以计算窗口区域内的斑点信号大小的统计分布,进而分析散射子分布,并可运用于非侵入式的实时烧灼区域的检测与监控,并可用以控制烧灼强度。To sum up the above, the present invention mainly uses the probability density function to analyze the scatter sub-distribution of ultrasonic data by using the moving window technique. The present invention defines the window size according to the resolution of the ultrasonic imaging system, then moves the window, and uses the probability density function to calculate the statistical significance within the window range, so as to calculate the statistical distribution of the speckle signal size in the window area, and then analyze the scattering sub-distribution , and can be applied to non-invasive real-time detection and monitoring of burning area, and can be used to control burning intensity.
以上所述的实施例仅是为说明本发明的技术思想及特点,其目的在使熟习此项技艺的人士能够了解本发明之内容并据以实施,当不能以的限定本发明的专利范围,即大凡依本发明所揭示的精神所作的均等变化或修饰,仍应涵盖在本发明的专利范围内。The above-described embodiments are only for illustrating the technical ideas and characteristics of the present invention, and its purpose is to enable those skilled in the art to understand the content of the present invention and implement it accordingly, and should not limit the patent scope of the present invention. That is, all equivalent changes or modifications made according to the spirit disclosed in the present invention should still be covered within the patent scope of the present invention.
Claims (25)
Translated fromChinesePriority Applications (1)
| Application Number | Priority Date | Filing Date | Title |
|---|---|---|---|
| CN2010102747764ACN102379721A (en) | 2010-08-30 | 2010-08-30 | Method for dynamically analyzing scatterer distribution change and application thereof |
Applications Claiming Priority (1)
| Application Number | Priority Date | Filing Date | Title |
|---|---|---|---|
| CN2010102747764ACN102379721A (en) | 2010-08-30 | 2010-08-30 | Method for dynamically analyzing scatterer distribution change and application thereof |
Publications (1)
| Publication Number | Publication Date |
|---|---|
| CN102379721Atrue CN102379721A (en) | 2012-03-21 |
Family
ID=45819840
Family Applications (1)
| Application Number | Title | Priority Date | Filing Date |
|---|---|---|---|
| CN2010102747764APendingCN102379721A (en) | 2010-08-30 | 2010-08-30 | Method for dynamically analyzing scatterer distribution change and application thereof |
Country Status (1)
| Country | Link |
|---|---|
| CN (1) | CN102379721A (en) |
Cited By (5)
| Publication number | Priority date | Publication date | Assignee | Title |
|---|---|---|---|---|
| CN106691499A (en)* | 2015-07-17 | 2017-05-24 | 安克生医股份有限公司 | Method of using scatterer distribution statistics to analyze ultrasonic echo signal |
| EP3179269A1 (en) | 2015-12-08 | 2017-06-14 | AmCad BioMed Corporation | Analysis methods of ultrasound echo signals based on statistics of scatterer distributions |
| US10105123B2 (en) | 2015-12-08 | 2018-10-23 | Amcad Biomed Corporation | Analysis methods of ultrasound echo signals based on statistics of scatterer distributions |
| CN109567929A (en)* | 2018-08-20 | 2019-04-05 | 云南大学 | The microwave ablation monitoring of parameter Difference Imaging is levied in a kind of ultrasound harmonic wave weighting surely |
| CN110368023A (en)* | 2019-08-01 | 2019-10-25 | 无锡海斯凯尔医学技术有限公司 | Signal processing method, device, equipment and storage medium |
Citations (3)
| Publication number | Priority date | Publication date | Assignee | Title |
|---|---|---|---|---|
| US20070106157A1 (en)* | 2005-09-30 | 2007-05-10 | University Of Washington | Non-invasive temperature estimation technique for hifu therapy monitoring using backscattered ultrasound |
| US20080114242A1 (en)* | 2006-11-10 | 2008-05-15 | National Taiwan University | Ultrasonic imaging technique for differentiating the distribution of scatterers within a tissue |
| US20080154131A1 (en)* | 2006-12-20 | 2008-06-26 | General Electric Company | Methods for enhancement of visibility of ablation regions |
- 2010
- 2010-08-30CNCN2010102747764Apatent/CN102379721A/enactivePending
Patent Citations (3)
| Publication number | Priority date | Publication date | Assignee | Title |
|---|---|---|---|---|
| US20070106157A1 (en)* | 2005-09-30 | 2007-05-10 | University Of Washington | Non-invasive temperature estimation technique for hifu therapy monitoring using backscattered ultrasound |
| US20080114242A1 (en)* | 2006-11-10 | 2008-05-15 | National Taiwan University | Ultrasonic imaging technique for differentiating the distribution of scatterers within a tissue |
| US20080154131A1 (en)* | 2006-12-20 | 2008-06-26 | General Electric Company | Methods for enhancement of visibility of ablation regions |
Cited By (5)
| Publication number | Priority date | Publication date | Assignee | Title |
|---|---|---|---|---|
| CN106691499A (en)* | 2015-07-17 | 2017-05-24 | 安克生医股份有限公司 | Method of using scatterer distribution statistics to analyze ultrasonic echo signal |
| EP3179269A1 (en) | 2015-12-08 | 2017-06-14 | AmCad BioMed Corporation | Analysis methods of ultrasound echo signals based on statistics of scatterer distributions |
| US10105123B2 (en) | 2015-12-08 | 2018-10-23 | Amcad Biomed Corporation | Analysis methods of ultrasound echo signals based on statistics of scatterer distributions |
| CN109567929A (en)* | 2018-08-20 | 2019-04-05 | 云南大学 | The microwave ablation monitoring of parameter Difference Imaging is levied in a kind of ultrasound harmonic wave weighting surely |
| CN110368023A (en)* | 2019-08-01 | 2019-10-25 | 无锡海斯凯尔医学技术有限公司 | Signal processing method, device, equipment and storage medium |
Similar Documents
| Publication | Publication Date | Title |
|---|---|---|
| US9050022B2 (en) | Method for dynamically analyzing distribution variation of scatterers and application using the same | |
| Ma et al. | Multiple delay and sum with enveloping beamforming algorithm for photoacoustic imaging | |
| Varray et al. | CREANUIS: a non-linear radiofrequency ultrasound image simulator | |
| US11284813B2 (en) | Real-time display of tissue deformation by interactions with an intra-body probe | |
| CN103153174B (en) | For determining the character determining device of Properties of Objects | |
| CN102949208A (en) | Method and device for monitoring temperature of treatment site by using ultrasound, and system for treatment and diagnosis using ultrasound | |
| CN106456124B (en) | Ultrasound imaging system and method for tracking specular reflectors | |
| Tsui et al. | Ultrasound temperature estimation based on probability variation of backscatter data | |
| Liu et al. | Cavitation-enhanced ultrasound thermal therapy by combined low-and high-frequency ultrasound exposure | |
| CN102379721A (en) | Method for dynamically analyzing scatterer distribution change and application thereof | |
| US8328721B2 (en) | Ultrasonic determination of optical absorption coefficients | |
| EP2595544B1 (en) | Image information acquiring apparatus, image information acquiring method and image information acquiring program | |
| Suomi et al. | The effect of temperature dependent tissue parameters on acoustic radiation force induced displacements | |
| Han et al. | Fast lesion mapping during HIFU treatment using harmonic motion imaging guided focused ultrasound (HMIgFUS) in vitro and in vivo | |
| US20210330226A1 (en) | Imaging method and imaging system | |
| JP2019520889A (en) | Use of reflected shear waves to monitor the growth of damage in thermal ablation | |
| CN102125444B (en) | Ultrasonic diagnosis apparatus and ultrasonic image processing apparatus | |
| US11191522B2 (en) | Ultrasound shear wave elastography featuring therapy monitoring | |
| Lin et al. | Detecting changes in ultrasound backscattered statistics by using Nakagami parameters: Comparisons of moment-based and maximum likelihood estimators | |
| CN103961808A (en) | B ultrasonic image-based space-time quantization monitoring system and method for realizing ultrasonic cavitation during HIFU (High Intensity Focused Ultrasound) treatment | |
| Mobasheri et al. | Radio frequency ultrasound time series signal analysis to evaluate high-intensity focused ultrasound lesion formation status in tissue | |
| Gao et al. | Cardiac‐gated spectroscopic photoacoustic imaging for ablation‐induced necrotic lesion visualization | |
| CN111727013B (en) | Imaging method and imaging system | |
| Song et al. | Dynamic mode decomposition for transient cavitation bubbles imaging in pulsed high-intensity focused ultrasound therapy | |
| US10149721B2 (en) | Ultrasonic volume flow measurement for ablation planning |
Legal Events
| Date | Code | Title | Description |
|---|---|---|---|
| C06 | Publication | ||
| PB01 | Publication | ||
| C10 | Entry into substantive examination | ||
| SE01 | Entry into force of request for substantive examination | ||
| C02 | Deemed withdrawal of patent application after publication (patent law 2001) | ||
| WD01 | Invention patent application deemed withdrawn after publication | Application publication date:20120321 |