CN102037343B - Flow cytometer apparatus for three dimensional diffraction imaging and related methods - Google Patents
Flow cytometer apparatus for three dimensional diffraction imaging and related methodsDownload PDFInfo
- Publication number
- CN102037343B CN102037343BCN200980114507.7ACN200980114507ACN102037343BCN 102037343 BCN102037343 BCN 102037343BCN 200980114507 ACN200980114507 ACN 200980114507ACN 102037343 BCN102037343 BCN 102037343B
- Authority
- CN
- China
- Prior art keywords
- particles
- flow cytometer
- fluid
- cytometer system
- scattered light
- Prior art date
- Legal status (The legal status is an assumption and is not a legal conclusion. Google has not performed a legal analysis and makes no representation as to the accuracy of the status listed.)
- Expired - Fee Related
Links
- 238000000034methodMethods0.000titleclaimsabstractdescription77
- 238000003384imaging methodMethods0.000titledescription25
- 239000002245particleSubstances0.000claimsabstractdescription148
- 239000012530fluidSubstances0.000claimsabstractdescription82
- 230000001427coherent effectEffects0.000claimsabstractdescription56
- 238000009826distributionMethods0.000claimsabstractdescription55
- 238000004458analytical methodMethods0.000claimsabstractdescription20
- 239000000284extractSubstances0.000claimsabstractdescription13
- 238000009652hydrodynamic focusingMethods0.000claimsabstractdescription8
- 238000005286illuminationMethods0.000claimsabstractdescription8
- 210000004027cellAnatomy0.000claimsdescription133
- 238000000684flow cytometryMethods0.000claimsdescription17
- 210000003470mitochondriaAnatomy0.000claimsdescription13
- 210000000805cytoplasmAnatomy0.000claimsdescription12
- 230000005284excitationEffects0.000claimsdescription8
- 230000015572biosynthetic processEffects0.000claimsdescription3
- 239000000203mixtureSubstances0.000claimsdescription2
- 239000013598vectorSubstances0.000description42
- 239000004005microsphereSubstances0.000description28
- 238000000149argon plasma sinteringMethods0.000description22
- 238000004364calculation methodMethods0.000description21
- 238000005259measurementMethods0.000description20
- 239000011159matrix materialSubstances0.000description19
- 230000006870functionEffects0.000description18
- 238000004422calculation algorithmMethods0.000description17
- 210000004748cultured cellAnatomy0.000description17
- 238000010586diagramMethods0.000description17
- 210000004940nucleusAnatomy0.000description16
- 230000003287optical effectEffects0.000description16
- 102100033045G-protein coupled receptor 4Human genes0.000description10
- 101000871138Homo sapiens G-protein coupled receptor 4Proteins0.000description10
- 230000000875corresponding effectEffects0.000description10
- 238000012549trainingMethods0.000description10
- 230000000694effectsEffects0.000description9
- 230000008569processEffects0.000description9
- 238000004088simulationMethods0.000description9
- 238000012706support-vector machineMethods0.000description9
- 230000001086cytosolic effectEffects0.000description7
- XLYOFNOQVPJJNP-UHFFFAOYSA-NwaterSubstancesOXLYOFNOQVPJJNP-UHFFFAOYSA-N0.000description7
- 239000004793PolystyreneSubstances0.000description6
- 238000004590computer programMethods0.000description6
- 238000013461designMethods0.000description6
- 210000003743erythrocyteAnatomy0.000description6
- 238000000605extractionMethods0.000description6
- 239000000499gelSubstances0.000description6
- 229920002223polystyrenePolymers0.000description6
- 238000012545processingMethods0.000description6
- 238000013459approachMethods0.000description5
- 210000003719b-lymphocyteAnatomy0.000description5
- 230000008901benefitEffects0.000description5
- 239000011521glassSubstances0.000description5
- 239000000463materialSubstances0.000description5
- 201000001441melanomaDiseases0.000description5
- 210000003463organelleAnatomy0.000description5
- 238000003909pattern recognitionMethods0.000description5
- PEDCQBHIVMGVHV-UHFFFAOYSA-NGlycerineChemical compoundOCC(O)COPEDCQBHIVMGVHV-UHFFFAOYSA-N0.000description4
- 206010028980NeoplasmDiseases0.000description4
- VYPSYNLAJGMNEJ-UHFFFAOYSA-NSilicium dioxideChemical compoundO=[Si]=OVYPSYNLAJGMNEJ-UHFFFAOYSA-N0.000description4
- 230000030833cell deathEffects0.000description4
- 230000001413cellular effectEffects0.000description4
- 238000007635classification algorithmMethods0.000description4
- 238000004624confocal microscopyMethods0.000description4
- 230000005672electromagnetic fieldEffects0.000description4
- 238000002073fluorescence micrographMethods0.000description4
- 230000000877morphologic effectEffects0.000description4
- 238000011160researchMethods0.000description4
- 239000000741silica gelSubstances0.000description4
- 229910002027silica gelInorganic materials0.000description4
- 230000006907apoptotic processEffects0.000description3
- 230000004900autophagic degradationEffects0.000description3
- 230000006399behaviorEffects0.000description3
- 210000000170cell membraneAnatomy0.000description3
- 230000002596correlated effectEffects0.000description3
- 238000010191image analysisMethods0.000description3
- 230000007246mechanismEffects0.000description3
- 230000002438mitochondrial effectEffects0.000description3
- 108090000623proteins and genesProteins0.000description3
- 238000012546transferMethods0.000description3
- XUMBMVFBXHLACL-UHFFFAOYSA-NMelaninChemical compoundO=C1C(=O)C(C2=CNC3=C(C(C(=O)C4=C32)=O)C)=C2C4=CNC2=C1CXUMBMVFBXHLACL-UHFFFAOYSA-N0.000description2
- 238000010521absorption reactionMethods0.000description2
- 230000009286beneficial effectEffects0.000description2
- 201000011510cancerDiseases0.000description2
- 230000008859changeEffects0.000description2
- 238000004163cytometryMethods0.000description2
- 238000011161developmentMethods0.000description2
- 230000004069differentiationEffects0.000description2
- 238000005315distribution functionMethods0.000description2
- 239000000975dyeSubstances0.000description2
- 230000005684electric fieldEffects0.000description2
- 238000005516engineering processMethods0.000description2
- 238000011156evaluationMethods0.000description2
- 239000003365glass fiberSubstances0.000description2
- 235000011187glycerolNutrition0.000description2
- 210000005260human cellAnatomy0.000description2
- 239000007788liquidSubstances0.000description2
- 230000008099melanin synthesisEffects0.000description2
- 238000000386microscopyMethods0.000description2
- 238000012986modificationMethods0.000description2
- 230000004048modificationEffects0.000description2
- 230000017074necrotic cell deathEffects0.000description2
- 238000010606normalizationMethods0.000description2
- 210000000633nuclear envelopeAnatomy0.000description2
- 238000005457optimizationMethods0.000description2
- 230000010287polarizationEffects0.000description2
- 239000002861polymer materialSubstances0.000description2
- 229920001296polysiloxanePolymers0.000description2
- 230000033458reproductionEffects0.000description2
- 238000010186stainingMethods0.000description2
- 229910001220stainless steelInorganic materials0.000description2
- 239000010935stainless steelSubstances0.000description2
- 238000012360testing methodMethods0.000description2
- 229910052724xenonInorganic materials0.000description2
- FHNFHKCVQCLJFQ-UHFFFAOYSA-Nxenon atomChemical compound[Xe]FHNFHKCVQCLJFQ-UHFFFAOYSA-N0.000description2
- 102000003688G-Protein-Coupled ReceptorsHuman genes0.000description1
- 108090000045G-Protein-Coupled ReceptorsProteins0.000description1
- 101000857682Homo sapiens Runt-related transcription factor 2Proteins0.000description1
- 229920000663Hydroxyethyl cellulosePolymers0.000description1
- 239000004354Hydroxyethyl celluloseSubstances0.000description1
- 206010034972Photosensitivity reactionDiseases0.000description1
- 241000276498Pollachius virensSpecies0.000description1
- 238000001919Rayleigh scattering spectroscopyMethods0.000description1
- 102100025368Runt-related transcription factor 2Human genes0.000description1
- 239000000980acid dyeSubstances0.000description1
- 238000013019agitationMethods0.000description1
- 238000003782apoptosis assayMethods0.000description1
- 238000013528artificial neural networkMethods0.000description1
- 230000005540biological transmissionEffects0.000description1
- 230000000903blocking effectEffects0.000description1
- 210000004369bloodAnatomy0.000description1
- 239000008280bloodSubstances0.000description1
- 210000000601blood cellAnatomy0.000description1
- 238000000339bright-field microscopyMethods0.000description1
- 210000003855cell nucleusAnatomy0.000description1
- 239000006285cell suspensionSubstances0.000description1
- 210000003850cellular structureAnatomy0.000description1
- 238000012512characterization methodMethods0.000description1
- 238000006243chemical reactionMethods0.000description1
- 239000003153chemical reaction reagentSubstances0.000description1
- 238000010226confocal imagingMethods0.000description1
- 210000004292cytoskeletonAnatomy0.000description1
- 238000007405data analysisMethods0.000description1
- 210000001787dendriteAnatomy0.000description1
- 230000001419dependent effectEffects0.000description1
- 230000009977dual effectEffects0.000description1
- 238000002474experimental methodMethods0.000description1
- 238000000799fluorescence microscopyMethods0.000description1
- 239000007850fluorescent dyeSubstances0.000description1
- 239000008187granular materialSubstances0.000description1
- 235000019447hydroxyethyl celluloseNutrition0.000description1
- 239000004615ingredientSubstances0.000description1
- 230000003834intracellular effectEffects0.000description1
- 230000006623intrinsic pathwayEffects0.000description1
- 230000002427irreversible effectEffects0.000description1
- 208000032839leukemiaDiseases0.000description1
- 210000003712lysosomeAnatomy0.000description1
- 230000001868lysosomic effectEffects0.000description1
- 210000004962mammalian cellAnatomy0.000description1
- 238000004519manufacturing processMethods0.000description1
- 239000003550markerSubstances0.000description1
- 230000036564melanin contentEffects0.000description1
- 210000002752melanocyteAnatomy0.000description1
- 239000012528membraneSubstances0.000description1
- 239000011859microparticleSubstances0.000description1
- 238000012821model calculationMethods0.000description1
- 230000004660morphological changeEffects0.000description1
- 108020004707nucleic acidsProteins0.000description1
- 102000039446nucleic acidsHuman genes0.000description1
- 150000007523nucleic acidsChemical class0.000description1
- 239000013307optical fiberSubstances0.000description1
- 238000000399optical microscopyMethods0.000description1
- 230000036211photosensitivityEffects0.000description1
- 238000000053physical methodMethods0.000description1
- 230000005522programmed cell deathEffects0.000description1
- 230000002062proliferating effectEffects0.000description1
- 239000004065semiconductorSubstances0.000description1
- 230000003595spectral effectEffects0.000description1
- 238000004611spectroscopical analysisMethods0.000description1
- 230000003068static effectEffects0.000description1
- 238000007619statistical methodMethods0.000description1
- 238000003860storageMethods0.000description1
- 239000000126substanceSubstances0.000description1
- 239000000725suspensionSubstances0.000description1
- 230000008961swellingEffects0.000description1
- 230000009897systematic effectEffects0.000description1
- 230000002123temporal effectEffects0.000description1
- 230000009466transformationEffects0.000description1
- 230000001960triggered effectEffects0.000description1
- 210000003934vacuoleAnatomy0.000description1
- 230000035899viabilityEffects0.000description1
Images


Classifications
- G—PHYSICS
- G01—MEASURING; TESTING
- G01N—INVESTIGATING OR ANALYSING MATERIALS BY DETERMINING THEIR CHEMICAL OR PHYSICAL PROPERTIES
- G01N15/00—Investigating characteristics of particles; Investigating permeability, pore-volume or surface-area of porous materials
- G01N15/10—Investigating individual particles
- G01N15/14—Optical investigation techniques, e.g. flow cytometry
- G01N15/1429—Signal processing
- G01N15/1433—Signal processing using image recognition
- G—PHYSICS
- G01—MEASURING; TESTING
- G01N—INVESTIGATING OR ANALYSING MATERIALS BY DETERMINING THEIR CHEMICAL OR PHYSICAL PROPERTIES
- G01N15/00—Investigating characteristics of particles; Investigating permeability, pore-volume or surface-area of porous materials
- G01N15/10—Investigating individual particles
- G01N15/14—Optical investigation techniques, e.g. flow cytometry
- G01N15/1468—Optical investigation techniques, e.g. flow cytometry with spatial resolution of the texture or inner structure of the particle
- G01N15/147—Optical investigation techniques, e.g. flow cytometry with spatial resolution of the texture or inner structure of the particle the analysis being performed on a sample stream
- G—PHYSICS
- G01—MEASURING; TESTING
- G01N—INVESTIGATING OR ANALYSING MATERIALS BY DETERMINING THEIR CHEMICAL OR PHYSICAL PROPERTIES
- G01N15/00—Investigating characteristics of particles; Investigating permeability, pore-volume or surface-area of porous materials
- G01N15/02—Investigating particle size or size distribution
- G01N15/0205—Investigating particle size or size distribution by optical means
- G01N15/0211—Investigating a scatter or diffraction pattern
- G01N2015/0222—Investigating a scatter or diffraction pattern from dynamic light scattering, e.g. photon correlation spectroscopy
- G—PHYSICS
- G01—MEASURING; TESTING
- G01N—INVESTIGATING OR ANALYSING MATERIALS BY DETERMINING THEIR CHEMICAL OR PHYSICAL PROPERTIES
- G01N15/00—Investigating characteristics of particles; Investigating permeability, pore-volume or surface-area of porous materials
- G01N15/02—Investigating particle size or size distribution
- G01N15/0205—Investigating particle size or size distribution by optical means
- G01N2015/025—Methods for single or grouped particles
- G—PHYSICS
- G01—MEASURING; TESTING
- G01N—INVESTIGATING OR ANALYSING MATERIALS BY DETERMINING THEIR CHEMICAL OR PHYSICAL PROPERTIES
- G01N15/00—Investigating characteristics of particles; Investigating permeability, pore-volume or surface-area of porous materials
- G01N15/10—Investigating individual particles
- G01N15/14—Optical investigation techniques, e.g. flow cytometry
- G01N2015/1497—Particle shape
Landscapes
- Chemical & Material Sciences (AREA)
- Dispersion Chemistry (AREA)
- Physics & Mathematics (AREA)
- Health & Medical Sciences (AREA)
- Life Sciences & Earth Sciences (AREA)
- Analytical Chemistry (AREA)
- Biochemistry (AREA)
- General Health & Medical Sciences (AREA)
- General Physics & Mathematics (AREA)
- Immunology (AREA)
- Pathology (AREA)
- Engineering & Computer Science (AREA)
- Signal Processing (AREA)
- Investigating, Analyzing Materials By Fluorescence Or Luminescence (AREA)
- Investigating Or Analysing Materials By Optical Means (AREA)
- Computer Vision & Pattern Recognition (AREA)
Abstract
Translated fromChineseDescription
Translated fromChinese相关申请related application
本专利申请要求其优先权自2008年6月12日递交的,序号为61/060,993的美国临时专利申请计算,该申请公布的全部内容都包括在本专利申请之内。This patent application claims priority from US Provisional Patent Application Serial No. 61/060,993, filed June 12, 2008, the entire disclosure of which is incorporated into this patent application.
技术领域technical field
本发明涉及流式细胞仪系统,特别是涉及可测量衍射图像信号与三维结构参数的流式细胞仪系统。The invention relates to a flow cytometer system, in particular to a flow cytometer system capable of measuring diffraction image signals and three-dimensional structural parameters.
背景技术Background technique
在生命科学研究中流式细胞仪系统可用来对包含大量生物细胞和粒子的群落进行定量分析。考虑用一束光(通常为单波长)照射经过流体力学聚焦的一流体。该流体一般包括作为载体的鞘流与包含许多粒子的样品流。这种流体一般可使单个粒子流过照射光束。多个传感器可用来收集发自被照射粒子位置的信号。例如,可将一个传感器置于靠近照射光束的位置测量前向散射光和将一个或多个传感器置于与照射光束垂直的方向测量侧向散射光。被照射的粒子可含荧光分子,用一个或多个荧光传感器可测量粒子所产生的荧光信号。每个流过照射光束的悬浮粒子都会产生散射光,其内的荧光分子则可能会产生频率小于照射光频率的荧光信号。散射光与荧光均可被测量并分析。Flow cytometry systems are used in life science research to quantify communities containing large numbers of biological cells and particles. Consider illuminating a fluid that is hydrodynamically focused with a beam of light (usually a single wavelength). The fluid generally includes a sheath flow as a carrier and a sample flow containing many particles. Such fluids typically allow individual particles to flow through the illumination beam. Multiple sensors can be used to collect signals from the position of the illuminated particles. For example, one sensor can be placed close to the illuminating beam to measure forward scatter and one or more sensors can be placed perpendicular to the illuminating beam to measure side scatter. The particles to be irradiated may contain fluorescent molecules, and the fluorescent signals generated by the particles may be measured with one or more fluorescent sensors. Each suspended particle passing through the illuminating beam produces scattered light, and the fluorescent molecules within it may generate a fluorescent signal at a frequency lower than that of the illuminating light. Both scattered light and fluorescence can be measured and analyzed.
通过流式细胞仪测量到的信号可用来确定所测粒子的物理与化学结构特征。例如,前向散射光可与粒子体积相关联,侧向散射光则可与粒子形状与内部结构特征相关联。使用高速传感器可快速测量散射光和/或荧光信号并据此对包含许多细胞的群落进行快速数据分析。例如,细胞群落可在一由荧光信号,前向散射光信号和/或侧向散射光信号定义的多维特征空间内分类。Signals measured by flow cytometry can be used to characterize the physical and chemical structure of the measured particles. For example, forward scattered light can be correlated to particle volume, and side scattered light can be correlated to particle shape and internal structural features. Use high-speed sensors to rapidly measure scattered light and/or fluorescent signals and thereby perform rapid data analysis of populations containing many cells. For example, cell populations can be classified within a multi-dimensional feature space defined by fluorescence signals, forward scatter light signals and/or side scatter light signals.
近年来,利用如电荷耦合器件(CCD)相机测量明场、暗场和荧光图像数据的图像流式细胞仪已经出现。这种图像流式细胞仪利用光学显微镜技术测量被照射粒子的二维图像,分析速度可达每秒一千个细胞。但是这种技术依赖于传统的明场或荧光显微镜方法,所获取的图像为粒子三维结构以非相干方式的二维投影复制图(第三维被压缩至“景深”之内)。这种二维图像因其不包括三维信息,尽管可用各种模式识别算法分析,但以现有的模式识别算法进行自动分析还是非常复杂,需要大量人工介入操作,非常困难。在粒子静止条件下共聚焦成像技术可用于在第三维方向上获取许多幅景深非常小的非衍射二维图像,然后叠加重建三维结构。但这种技术一般需要许多幅图像,因而不能应用于粒子流动速度较快的图像流式细胞仪。此外,现有的流式细胞仪中粒子的流速较高,信号的信噪比较低,这些特点会限制可从散射光和/或荧光信号中提取的信息量。In recent years, image flow cytometers that utilize, for example, charge-coupled device (CCD) cameras to measure brightfield, darkfield, and fluorescence image data have emerged. This image flow cytometer uses light microscopy techniques to measure two-dimensional images of irradiated particles and can analyze them at speeds of up to a thousand cells per second. But this technique relies on conventional brightfield or fluorescence microscopy methods, which acquire images that are incoherent 2D projection reproductions of the particle's 3D structure (with the third dimension squeezed into the "depth of field"). Since this two-dimensional image does not include three-dimensional information, although it can be analyzed by various pattern recognition algorithms, automatic analysis with existing pattern recognition algorithms is still very complicated and requires a lot of manual intervention, which is very difficult. The confocal imaging technique can be used to acquire many non-diffracting two-dimensional images with very small depth of field in the third three-dimensional direction under the condition of static particles, and then superimpose and reconstruct the three-dimensional structure. However, this technique generally requires many images, so it cannot be applied to image flow cytometers with fast particle flow. Additionally, existing flow cytometers have high particle flow rates and low signal-to-noise ratios, which limit the amount of information that can be extracted from scattered light and/or fluorescent signals.
发明内容Contents of the invention
本发明的实现方法可为一种流式细胞仪系统其中包括由外层鞘流与内层样品流组成的可形成流体力学聚焦的流体控制器件。一个可照射位于内层样品流中单个粒子的相干光源。一个可用来探测被相干光源照射激发的粒子所产生的弹性散射光的空间分布的传感器。一个可用来从弹性散射光的空间分布提取该粒子的三维结构形态参数的分析模块。本发明的某些实现方法包括传感器可用来获得记录相干弹性散射光空间分布的衍射图像数据。The implementation method of the present invention can be a flow cytometer system, which includes a fluid control device that can form a hydrodynamic focus and is composed of an outer sheath flow and an inner sample flow. A coherent light source illuminates individual particles located in the inner sample stream. A sensor that detects the spatial distribution of elastically scattered light from particles excited by illumination with a coherent light source. An analysis module that can be used to extract the three-dimensional structure and morphology parameters of the particle from the spatial distribution of elastically scattered light. Certain implementations of the invention include that the sensor can be used to obtain diffraction image data recording the spatial distribution of coherent elastically scattered light.
在另外一些实现方法中,用一个非相干光源照射粒子并用一个传感器测量被非相干光源激发的粒子产生的包括明场,暗场和荧光信号的非相干图像数据。系统的分析模块可设计用来结合衍射图像与非相干图像数据分析位于样品流的粒子。In other implementations, an incoherent light source is used to illuminate the particles and a sensor is used to measure the particles excited by the incoherent light source to generate incoherent image data including bright field, dark field and fluorescence signals. The system's analysis module can be designed to combine diffraction image and incoherent image data to analyze particles in the sample stream.
在另外一些实现方法中,可设计使用分析模块分析弹性散射光的相干分布对粒子进行分类。可设计使用分析模块分析衍射图像数据并提取粒子结构的体积信息,例如一个生物细胞内的细胞质体积和/或细胞核体积和/或线粒体体积。In some other implementation methods, the analysis module can be designed to analyze the coherent distribution of elastically scattered light to classify particles. The analysis module can be designed to analyze the diffraction image data and extract the volume information of the particle structure, such as the volume of cytoplasm and/or the volume of nucleus and/or the volume of mitochondria in a biological cell.
在另外一些实现方法中,流体控制器件设计用来形成为层流状的流相干。流体控制器件可包括一流动室,其材料的折射率与层流中的鞘流的折射率非常接近。流动室至少有一边面形状为平面或接近平面。In other implementations, the fluid control device is designed to create laminar flow coherence. The fluid control device may include a flow chamber made of a material having a refractive index very close to that of the sheath flow in laminar flow. At least one side of the flow chamber is planar or nearly planar.
在另外一些实现方法中,传感器设计用来探测在某一角度范围内的散射光,其中心角度与自相干光源入照的光传播方向呈某一角度,如90度。In some other implementation methods, the sensor is designed to detect scattered light within a certain range of angles, and its central angle is at a certain angle, such as 90 degrees, to the propagation direction of light incident by the self-coherent light source.
在另外一些实现方法中,可根据包括计算获得的衍射图像数据和/或实验确定的细胞结构的数据库分析提取三维结构参数。In other implementations, three-dimensional structural parameters may be extracted from database analysis including computationally obtained diffraction image data and/or experimentally determined cellular structures.
根据本发明更进一步的一些实现方法,通过流式细胞仪分析粒子并决定其三维结构参数的方法包括由外层鞘流与内层样品流组成的可形成流体力学聚焦的流体。位于内层样品流的粒子由一相干光源照射。测量相干光源激发下的粒子所产生的弹性散射光并从中提取粒子的三维结构参数。According to some further implementation methods of the present invention, the method of analyzing particles and determining their three-dimensional structure parameters by flow cytometry includes a fluid that can form a hydrodynamic focus composed of an outer sheath flow and an inner sample flow. Particles located in the inner sample stream are illuminated by a coherent light source. Measure elastically scattered light generated by particles excited by coherent light sources and extract the three-dimensional structure parameters of particles from it.
本发明还有一些实现方法可提供计算程序产品,可用来分析流式细胞仪所测量的粒子并提取其三维结构参数。这种流式细胞仪系统具有包括由外层鞘流体与内层样品流体组成的可形成流体力学聚焦的一流体。一个用来照射粒子的相干光源,一个用来探测被相干光源照射激发的粒子所产生的弹性散射光的相干空间分布的传感器。计算程序产品包括可供计算机使用的存储可读程序编码的存储器。计算机可读的程序编码可用来读入由流式仪测量的弹性散射光的相干空间分布的衍射图像数据。Some implementation methods of the present invention can provide calculation program products, which can be used to analyze the particles measured by the flow cytometer and extract their three-dimensional structure parameters. The flow cytometer system has a fluid that can form a hydrodynamic focus and is composed of an outer sheath fluid and an inner sample fluid. A coherent light source for illuminating the particles, and a sensor for detecting the coherent spatial distribution of elastically scattered light produced by the particles excited by the coherent light source. A computing program product includes memory storing readable program code for use by a computer. Computer readable program code may be used to read diffraction image data of the coherent spatial distribution of elastically scattered light as measured by the flow cytometer.
附图说明Description of drawings
所有附图均包括在技术说明之内,也是技术说明的一部分,本发明的实现方法既由附图与说明示意,用来解释本发明的原理。All the accompanying drawings are included in the technical description, and are also a part of the technical description. The implementation method of the present invention is illustrated by the accompanying drawings and description, and is used to explain the principle of the present invention.
图1为本发明实施方法之一的一种流式细胞仪系统示意图。Fig. 1 is a schematic diagram of a flow cytometer system of one of the implementation methods of the present invention.
图2为本发明其他实施方法的另一种流式细胞仪系统的示意图。Fig. 2 is a schematic diagram of another flow cytometer system for other implementation methods of the present invention.
图3为本发明实施方法之一的一种包括可测量衍射与非相干图像器件和特征提取与分类器件的流式细胞仪系统方框图。Fig. 3 is a block diagram of a flow cytometer system including a device capable of measuring diffraction and incoherent images and a feature extraction and classification device according to one of the implementation methods of the present invention.
图4A为本发明其他实施方法的另一种流式细胞仪系统的示意图。FIG. 4A is a schematic diagram of another flow cytometry system for other embodiments of the present invention.
图4B为本发明其他实施方法的另一种流式细胞仪系统的示意图。Fig. 4B is a schematic diagram of another flow cytometer system according to other embodiments of the present invention.
图5为本发明实施方法的一种流式细胞仪系统的示意图。Fig. 5 is a schematic diagram of a flow cytometer system for implementing the method of the present invention.
图6A为本发明实施方法的一种液流控制器件的数字照片。Figure 6A is a digital photograph of a flow control device according to the method of the present invention.
图6B为本发明实施方法的一种流式细胞仪系统的示意图。Fig. 6B is a schematic diagram of a flow cytometer system for implementing the method of the present invention.
图6C为本发明实施方法的一种流式细胞仪系统的数字照片。Figure 6C is a digital photograph of a flow cytometry system embodying the methods of the present invention.
图6D为图6C所示流式细胞仪系统的示意图。Figure 6D is a schematic diagram of the flow cytometry system shown in Figure 6C.
图7为基于本发明实施方法的入射光与散射光分布的示意图。FIG. 7 is a schematic diagram of the distribution of incident light and scattered light based on the implementation method of the present invention.
图8A为一幅自直径为25微米的微球测得的衍射图,激发处于样品流中微球的激光波长为633纳米。Figure 8A is a diffraction pattern measured from a microsphere with a diameter of 25 microns, excited by a laser at a wavelength of 633 nm in the sample flow.
图8B为根据米理论模型计算的衍射图,其横轴代表散射角度θs,纵轴代表散射角度
图9为入射光波波前以及由于一生物细胞内部折射率分布不均匀所造成的散射光波前的示意图,其中包括细胞核,线粒体,g=格基结构,λ=波长,2a=线性尺度。Fig. 9 is a schematic diagram of the wavefront of incident light and the wavefront of scattered light caused by uneven refractive index distribution inside a biological cell, including nucleus, mitochondria, g=lattice structure, λ=wavelength, 2a=linear scale.
图10为包括7个NALM-6培养细胞三维结构参数的数据表。Fig. 10 is a data table including seven three-dimensional structural parameters of NALM-6 cultured cells.
图11为包括分布在不同二维特征空间内九个NALM-6培养细胞的数据,这些二维空间由散射光矩阵元素S11在散射角度θs=0时的值与其在不同测向散射光角度范围内积分值定义。Figure 11 shows the data of nine NALM-6 cultured cells distributed in different two-dimensional feature spaces. These two-dimensional spaces are determined by the value of the scattered light matrix element S11 at the scattering angle θs =0 and its value at different direction-finding scattered light angles. Integral value definition within the range.
图12为本发明一些实施方法的一种流式细胞仪系统的示意图。Figure 12 is a schematic diagram of a flow cytometry system according to some embodiments of the invention.
图13A-13C为显微目镜置于x=0时所获得的不同微球与细胞的明场数字图像,其中微球直径9.6微米(图13A),25微米(图13B)以及一个B16/GPR4细胞(图13C),短直线=20微米。Figures 13A-13C are bright-field digital images of different microspheres and cells obtained when the microscope eyepiece is placed at x=0, wherein the diameter of the microspheres is 9.6 microns (Figure 13A), 25 microns (Figure 13B) and a B16/GPR4 Cells (Fig. 13C), short line = 20 microns.
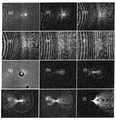
图14显示自一直径为25微米的聚苯乙烯微球(嵌于凝胶内)所获取的多幅数字衍射图与一幅非相干光源照射下获得的明场图(第一列,第三行)。在一波长λ=532微米的激光束照射条件下,衍射图于不同的x位置获取。第一列自左至右:x=0微米,100微米,200微米;第二列自左至右:x=300微米,400微米,500微米;第三列自左至右:x=0微米(明场图),-100微米,-200微米;第四列自左至右:x=-300微米,-400微米,-500微米。Figure 14 shows multiple digital diffraction images obtained from a polystyrene microsphere with a diameter of 25 μm (embedded in a gel) and a bright field image obtained under an incoherent light source (first column, third OK). Diffraction patterns were acquired at different x positions under the irradiation condition of a laser beam with a wavelength of λ=532 μm. The first column from left to right: x = 0 microns, 100 microns, 200 microns; the second column from left to right: x = 300 microns, 400 microns, 500 microns; the third column from left to right: x = 0 microns (bright field image), -100 microns, -200 microns; fourth column from left to right: x = -300 microns, -400 microns, -500 microns.
图15显示多幅获自嵌于凝胶内不同微粒的数字衍射图,左列为一直径为9.6微米的聚苯乙烯微球,中间及右列分别为属黑色素肿瘤培养细胞的两个不同细胞:B16/vector(#1细胞)和B16/GPR4(#2细胞)。第一列衍射图获取位置为x=200微米,第二列衍射图为x=-200微米。Figure 15 shows several digital diffraction patterns obtained from different microparticles embedded in the gel. The left column is a polystyrene microsphere with a diameter of 9.6 μm, and the middle and right columns are two different cells belonging to cultured melanoma cells : B16/vector (#1 cell) and B16/GPR4 (#2 cell). The first column of diffractograms was acquired at x=200 microns, and the second column of diffractograms at x=-200 microns.
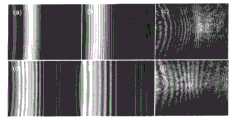
图16左列与中列显示多幅根据米理论模型计算的散射光角度分布投影获得的数字衍射图,左列图所用的最大投影半角Θ=24°,中列为最大投影半角Θ=16°。右列显示的为自嵌于凝胶内的聚苯乙烯微球测量的衍射图,测量位置x=200微米,第一列的微球直径为25微米,第二列直径为9.6微米。The left column and the middle column of Fig. 16 show several digital diffraction patterns obtained by projection of the angular distribution of scattered light calculated according to the Mie theory model. The maximum projection half-angle Θ=24° used in the left column, and the maximum projection half-angle Θ=16° in the middle column . The right column shows the diffraction patterns measured from polystyrene microspheres embedded in the gel at the measurement position x = 200 microns, the diameter of the microspheres in the first column is 25 microns, and that in the second column is 9.6 microns.
图17A-17B为自10,000个B16F10培养细胞测量的侧向散射光信号与前向散射光信号双参数点图,图17A为B16/GPR4培养细胞,图17B为B16/vector培养细胞。17A-17B are two-parameter dot plots of side scattered light signals and forward scattered light signals measured from 10,000 B16F10 cultured cells. FIG. 17A is B16/GPR4 cultured cells, and FIG. 17B is B16/vector cultured cells.
图18为一B16/GPR4细胞三维结构的二维剖面图。Figure 18 is a two-dimensional cross-sectional view of a three-dimensional structure of a B16/GPR4 cell.
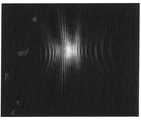
图19为流动状态下直径为9.6微米的微球所产生的数字衍射图像,激发光波长为532纳米,流速在1.6毫米/秒至1.8毫米/秒之间,曝光时间为50微秒。Figure 19 is a digital diffraction image produced by microspheres with a diameter of 9.6 microns in a flowing state, the excitation light wavelength is 532 nanometers, the flow rate is between 1.6 mm/s and 1.8 mm/s, and the exposure time is 50 microseconds.
图20为流动状态下直径为9.6微米的微球所产生的数字衍射图像,激发光波长为532纳米,流速为12毫米/秒,曝光时间为50微秒。Figure 20 is a digital diffraction image produced by microspheres with a diameter of 9.6 microns in a flowing state, the excitation light wavelength is 532 nanometers, the flow rate is 12 mm/s, and the exposure time is 50 microseconds.
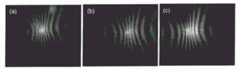
图21A为流动状态下直径为5.2微米的微球所产生的数字衍射图像,流速约为4.7毫米/秒。Figure 21A is a digital diffraction image produced by microspheres with a diameter of 5.2 microns in a flow state, with a flow rate of about 4.7 mm/s.
图21B为流动状态下直径为9.6微米的微球所产生的数字衍射图像,流速约为12毫米/秒之间。FIG. 21B is a digital diffraction image produced by microspheres with a diameter of 9.6 microns in a flow state, and the flow rate is about 12 mm/s.
图21C为流动状态下直径为25微米的微球所产生的数字衍射图像,流速约为7毫米/秒之间。Figure 21C is a digital diffraction image produced by microspheres with a diameter of 25 microns in a flow state, with a flow rate of about 7 mm/s.
具体实施方式Detailed ways
下面结合附图和具体实施方式为例对本发明做出详细说明。但本发明可通过许多种不同方式实施,因此本发明的实施不应限于这里所介绍的方式,这里介绍的实施方式只是用于完整地公布本发明,使其全部内容可为业内同行所知。The present invention will be described in detail below with reference to the accompanying drawings and specific embodiments as an example. However, the present invention can be implemented in many different ways, so the implementation of the present invention should not be limited to the methods introduced here, and the implementation methods introduced here are only used to fully disclose the present invention, so that its entire content can be known to those in the industry.
全文中同样的数字指同样的部件。在附图中,一些线段、层次、成份、部件或特征的粗细可能会为了清晰而加粗或加大。虚线除注明外表示备选特征。Like numbers refer to like parts throughout. In the drawings, the thickness of some line segments, layers, components, components or features may be bolded or increased for clarity. Dashed lines indicate optional features unless noted.
这里所用的术语仅是为了描述本发明的某种实施方式,并非具有限制意义。特别值得指出的是,本文中所用的“包括”一类词语用以表明一些所述的特征、数字、步骤、操作、部件、成份等的存在,但不排除其他以表明一些所述的特征、数字、步骤、操作、部件、成份等的存在。正如所述,“和/或”一词包含了任一和所有上述一或多部分的组合。正如所述,类似于“介于X和Y之间”和“介于大约X和Y之间”等词应解释为包含了X和Y。正如所述,类似于“介于大约X和Y之间”应解释为“介于大约X和大约Y之间”。正如所述,类似于“自大约X至Y”应解释为“自大约X至大约Y之间”。除另定义外,这里使用的所有词汇(包括技术和科学词汇)所具有的意义与任何一位本发明所属专业的同行通常理解的一致。更应进一步理解的是,在常用字典或词典中所定义的词汇在本文中使用时其意义应与上下文和相关专业的解释一致。除非明确定义时,一般不应对词汇作理想化或过于正式的解释。从所周知的功能或操作可能不会作仔细描述,以行文简洁。The terms used here are only used to describe certain embodiments of the present invention, and are not intended to be limiting. It is particularly worth noting that the words "comprising" used herein are used to indicate the existence of some of the described features, numbers, steps, operations, components, components, etc., but not to exclude others to indicate the presence of some of the described features, The existence of numbers, steps, operations, parts, ingredients, etc. As stated, the term "and/or" includes any and all combinations of one or more of the above. As stated, words like "between X and Y" and "between about X and Y" should be construed to include both X and Y. As stated, resemblance to "between about X and Y" should be interpreted as "between about X and about Y". As stated, phrases like "from about X to Y" should be interpreted as "from about X to about Y". Unless otherwise defined, all terms (including technical and scientific terms) used herein have the same meaning as commonly understood by one of ordinary skill in the art to which this invention belongs. It should be further understood that when used in this article, the meaning of words defined in commonly used dictionaries or dictionaries should be consistent with the context and interpretation of relevant professions. Unless clearly defined, terms should generally not be interpreted ideally or overly formally. Well-known functions or operations may not be described in detail for the sake of brevity.
应该理解的是,当提到某一部件与另一部件“相邻”、“相接”、“相连”、“接触”等等时,这两个部件可以是直接相邻、相接、相连或接触,也可是其间还有其他部件。与此对照,当提到某一部件与另一部件“直接相邻”、“直接相接”、“直接相连”、“直接接触”等等,这两个部件之间没有其他部件。业内人士应该理解,当提到一个结构或特征与另一特征相接时,该结构或特征可能会与相接特征存在相交部分。It should be understood that when an element is referred to as being "adjacent," "adjacent," "connected," "contacting," etc., another element, those two elements may be directly adjacent, connected, connected, etc. Or contact, but also there are other components in between. In contrast, when an element is referred to as being "directly adjacent to," "directly adjacent to," "directly connected to," "directly in contact with," etc., another element, there are no other elements between the two elements. Those skilled in the art should understand that when a structure or feature is referred to as being joined to another feature, the structure or feature may intersect with the joined feature.
在使用例如“在下面”、“处于下方”、“在上面”、“处于上方”之类空间相对关系词汇时,这些词汇应理解为是为了便于在附图中说明一个部件或特征与另外的部件或特征之间的关系。这类空间相对关系词汇应理解为是用来包括图中描述的装置或操作的所有方位。例如,如果图中装置是倒置的,则在相对于其它部件或特征时用“在下面”或“处于下方”所描述的某一部件或特征的方位应该为“在上面”或“处于上方”。一个典型的例子就是“在下面”可以包含“在下面”和“在上面”的方位意义。所描述的装置方位可能变化(旋转90度或其他方位),其空间相对位置的解释也应相对变化。除非明确定义时,类似的词汇如“向上的”、“向下的”、“竖直的”、“水平的”等相似词汇也应同样解释。When spatially relative terms such as "beneath", "beneath", "above", "above" are used, these terms should be understood to facilitate the relationship between one component or feature and another in the drawings. Relationships between components or features. Such spatially relative terms should be understood to encompass all orientations of the devices or operations depicted in the figures. For example, if the device in the figures is turned over, elements or features described as "below" or "beneath" relative to other elements or features would be oriented "on" or "over" . A typical example is that "below" can contain the directional meanings of "below" and "above". The orientation of the depicted device may vary (rotated 90 degrees or otherwise), and the interpretation of its spatial relative position should vary accordingly. Similar words such as "upward", "downward", "vertical", "horizontal", etc. shall be interpreted similarly unless expressly defined.
在使用“第一”、“第二”等词汇描绘某些部件时,这些部件不应被这些词汇限制。这些词汇只是用于区分不同的部件。所以,一个上述的“第一”部件也可称为“第二”部件而不会偏离本发明所述的原则。除非明确定义时,权力要求或附图中的操作(或步骤)的顺序并不限于所述的前后次序。When terms such as 'first' and 'second' are used to describe certain components, these components should not be limited by these terms. These terms are used only to distinguish the different components. Therefore, a "first" component described above could also be referred to as a "second" component without departing from the teachings of the present invention. The order of operations (or steps) in the claims or figures is not limited to the presented sequential order unless explicitly defined.
下面对本发明的描述会涉及到使用方框图和/或流程图说明的基于本发明的各种实施方式的方法,仪器(系统)和/或计算机程序产品。在方框图和/或流程图中的各个方框或不同方框的组合应理解为可通过计算机程序指令实现。这些计算机程序指令可输进一个通用或专用计算机和/或其他可编程的数据处理仪器而成为一台机器,使得这些指令可通过计算机处理器和/或其他可编程的数据处理仪器得到执行并实现方框图和/或流程图或其中方框的功能/行为。The following description of the present invention will refer to methods, apparatus (systems) and/or computer program products based on various embodiments of the present invention illustrated using block diagrams and/or flowcharts. Individual blocks or combinations of different blocks in the block diagrams and/or flowcharts should be understood to be implemented by computer program instructions. These computer program instructions can be input into a general-purpose or special-purpose computer and/or other programmable data processing equipment to become a machine, so that these instructions can be executed and realized by a computer processor and/or other programmable data processing equipment Block diagrams and/or flowcharts or the functionality/behavior of the blocks within them.
上述计算机程序指令还可储存于一个计算机可读的存储器并用于控制一台计算机和/或其他可编程的数据处理仪器实现某一特定方式的功能,例如储存于一个计算机可读的存储器内的指令生产一件产品用于实现方框图和/或流程图或其中方框的功能/行为。The above-mentioned computer program instructions can also be stored in a computer-readable memory and used to control a computer and/or other programmable data processing equipment to achieve a specific function, such as instructions stored in a computer-readable memory The production of a product to implement the functions/behaviors of a block diagram and/or flowchart or a block within it.
上述计算机程序指令还可输入至一台计算机和/或其他可编程的数据处理仪器并用于启动一系列计算机和/或其他可编程的数据处理仪器的运行步骤而形成通过计算机实现的过程,在过程之中指令得到执行而实现方框图和/或流程图或其中方框的功能/行为。The above-mentioned computer program instructions can also be input into a computer and/or other programmable data processing equipment and used to start a series of operating steps of the computer and/or other programmable data processing equipment to form a computer-implemented process, in the process The instructions therein are executed to realize the functions/behaviors of the block diagrams and/or flowcharts or the blocks therein.
因此本发明可以通过硬件和/或软件(包括固件、常驻软件、微代码等)实现。此外本发明的实现还可具有一储存于计算机可用或可读的存储介质内的计算机程序产品的形式,其中存储介质含有计算机可用或可读的程序代码并用于一个指令执行系统或与其相联。在本文中计算机可用或可读的介质可以是任何可含有、储存、通讯、传播或传输程序并用于一个指令执行系统、仪器或设备或与其相联的介质。Thus, the present invention can be implemented by hardware and/or software (including firmware, resident software, microcode, etc.). Furthermore, implementations of the present invention may also be in the form of a computer program product stored on a computer usable or readable storage medium containing program code for use in or in connection with an instruction execution system. In this context, a computer-usable or readable medium may be any medium that can contain, store, communicate, propagate or transmit programs and be used in or in connection with an instruction execution system, instrument or device.
计算机可用或可读的介质可以包括但不限于下列介质中的任何一种:电子介质、磁性介质、光学介质,电磁介质、红外介质或半导体系统、仪器、设备或传播介质。更为具体的计算机可读介质的例子包括(非完全名单):一个包含一或数条电线的电路连接、一个可携带的计算机盘、一个随机存取存储(RAM)、一个只读存储(ROM)、一个可擦可编程序只读存储(EPRM或闪存)、一根光纤和一个可携带只读存储光盘(CD-ROM)。应该指出,计算机可用或可读的介质甚至可以是纸或者其他适当的可印刷程序的介质,因为程序可通过例如光学扫描纸或其他介质的方式进行电子纪录后以适当方式加以编译和处理,然后根据需要储存在一个计算机存储器内。A computer usable or readable medium may include, but is not limited to, any of the following: electronic, magnetic, optical, electromagnetic, infrared, or semiconductor systems, instruments, devices, or propagation media. More specific examples of computer readable media include (not an exhaustive list): an electrical connection containing one or more wires, a portable computer disk, a random access memory (RAM), a read only memory (ROM ), an erasable programmable read-only memory (EPRM or flash), an optical fiber, and a portable CD-ROM. It should be noted that the computer-usable or readable medium may even be paper or other suitable medium on which the program can be printed, since the program can be electronically recorded by, for example, optically scanning paper or other medium, compiled and processed in a suitable manner, and then Stored in a computer memory as needed.
图像数据为使用如成像传感器所纪录的信号空间分布。因此,光学图像为由电磁场组成的光波信号的空间分布,一般可分为两类:1)基于相干光信号空间分布的衍射图像,2)基于非相干光信号空间分布的非相干图像。这两类图像的区别在于不同空间位置的电磁场之间的相干性。形成衍射图像的光波信号主要由存在于空间不同位置的高度相干场组成,而形成非相干图像的光波信号则主要由存在于空间不同位置的非相干场组成。传统光学显微镜即为一广为人知的非相干图像方法,包括通过被非相干光照射的粒子所产生的弹性散射光信号而形成的亮场图像和通过被非相干光照射的粒子所产生的荧光信号而形成的荧光图像。这些图像的非衍射性质使其只能在实际三维空间中复制具有三维结构的细胞的二维投影结构,细胞的第三维结构被压缩成为所谓的“影深”,无法获得真正的三维结构信息。与此形成对照,在粒子被例如激光束的相干光束照射或激发时,我们可以测量获得衍射图像并据此提取粒子的三维结构特征和信息。光学全息图即为衍射图像的一个例子,全息图片可通过用胶片纪录在激光束照射下的物体所产生的弹性散射光与作为参考光束的该激光束的一部分之间的干涉条纹而获得。全息图片在相同波长的激光束照射下可在不同观看角度上重现所记录物体的三维结构。随着图像处理技术的进步,现在我们已可不需使用参考光束干涉的方式而直接从散射光所形成的衍射图像获取三维结构特征。Image data is the spatial distribution of signals recorded using, for example, an imaging sensor. Therefore, an optical image is the spatial distribution of light wave signals composed of electromagnetic fields, which can generally be divided into two categories: 1) diffraction images based on the spatial distribution of coherent optical signals, and 2) incoherent images based on the spatial distribution of incoherent optical signals. The difference between these two types of images is the coherence between the electromagnetic fields at different spatial locations. The light wave signal forming a diffracted image is mainly composed of highly coherent fields existing in different positions in space, while the light wave signal forming an incoherent image is mainly composed of incoherent fields existing in different positions in space. Conventional optical microscopy is a well-known incoherent image method, including bright-field images formed by elastically scattered light signals generated by particles illuminated by incoherent light and fluorescence signals generated by particles illuminated by incoherent light. The resulting fluorescent image. The non-diffractive nature of these images makes it possible to only reproduce the 2D projection structure of cells with 3D structure in the actual 3D space. The 3D structure of cells is compressed into the so-called "shadow depth", and the real 3D structure information cannot be obtained. In contrast, when a particle is irradiated or excited by a coherent light beam, such as a laser beam, we can measure and obtain a diffraction image from which three-dimensional structural features and information of the particle can be extracted. An example of a diffraction image is an optical hologram, which is obtained by recording on film the interference fringes between elastically scattered light from an object illuminated by a laser beam and a portion of the laser beam as a reference beam. The holographic picture can reproduce the three-dimensional structure of the recorded object at different viewing angles under the same wavelength of laser beam irradiation. With the advancement of image processing technology, we can now obtain three-dimensional structural features directly from the diffraction image formed by scattered light without using reference beam interference.
现在根据图1至图21C讨论本发明的不同实施方式。Different embodiments of the invention are now discussed with reference to FIGS. 1 to 21C.
如图1所示,一种基于微流器件设计的流式细胞仪10包括一个流控装置100,测量相干光分布的成像传感器130,相干光分布的图像分析装置140。流控装置100又包括样品流入口102和鞘流入口104,分别提供沿着流体通道106在微流样品室108流动的样品流和鞘流。样品室108通过流体排出口110输出样品流与鞘流流体。流控装置100应具有可在流体室108内通过流体聚焦形成由样品流和鞘流组成的沿着流体通道106流动的层流的能力。样品流和鞘流在控制装置控制下分别流入入口102和104。在流体通道106内流体动力学聚焦条件下的样品流可以基本保证被测粒子以单列方式通过样品室108。样品流包括的所测粒子可以是包括人体细胞在内的生物细胞,也可是其他微粒。As shown in FIG. 1 , a
例如激光束120的相干光源输出光束可用来照射在流体室108内流动的样品流内的粒子。一个相干分布成像传感器130可用来探测由被测粒子产生的弹性散射光在空间的相干分布。一个相干图像分析装置140可用来从弹性散射光相干空间分布提取被测粒子三维结构特征和形态参数。An output beam of a coherent light source, such as laser beam 120 , may be used to illuminate particles within a sample stream flowing within fluid chamber 108 . A coherent distribution imaging sensor 130 can be used to detect the coherent distribution in space of the elastically scattered light generated by the measured particles. A coherent image analysis device 140 can be used to extract the three-dimensional structural features and shape parameters of the measured particles from the coherent spatial distribution of the elastic scattering light.
在这种实施方式中,当位于样品室108样品流内的粒子被相干光束照射时,粒子会在不同方向产生散射光。弹性散射光会形成复杂的空间分布模式,与粒子的大小、形状以及粒子内部的光折射率分布也即结构有关。根据本发明的实施方式,弹性散射光的空间分布或衍射图像数据可用成像传感器130在某一角度范围内测量,并据此获得被测粒子的三维结构参数。例如图像分析装置140可用来自衍射图像数据提取与粒子结构相关的体积与光折射率,如生物细胞内部的细胞核和/或线粒体的体积与光折射率。In such an embodiment, when particles located within the sample flow in the sample chamber 108 are illuminated by a coherent light beam, the particles will scatter light in different directions. Elastically scattered light will form a complex spatial distribution pattern, which is related to the size and shape of the particle and the light refractive index distribution inside the particle, that is, the structure. According to an embodiment of the present invention, the spatial distribution of elastically scattered light or diffraction image data can be measured by the imaging sensor 130 within a certain angle range, and the three-dimensional structural parameters of the measured particles can be obtained accordingly. For example, the image analysis device 140 can extract the volume and refractive index related to the particle structure from the diffraction image data, such as the volume and refractive index of the nucleus and/or mitochondria inside biological cells.
在更具体的实施方式中,流控装置100可以为一个层流控制装置,用来提供流速低于10毫米/秒的层流,这样可在曝光时间小于50微秒时位于样品室108和样品流内的被测粒子在曝光时间内的移动距离较小(如低于0.5微米)。在这种实施方式中,流控装置100可以增强信噪比,提高包括衍射图像在内的成像质量。In a more specific embodiment, the
在一些实施方式中,微流样品室108可使用光折射率与样品室108内的鞘流光折射率非常相近的材料制作,这些材料包括硅胶或其它高分子材料。在这种实施方式中,可以通过匹配激光束120入射至样品室108的部分与其内的流体的光折射率降低成像噪音背景。此外,例如图6所示,样品室108还可至少有一边面为平面形状使得激光束120可以自此面以垂直于平面的方向入射,从而进一步降低由于在样品室108入射面的光散射所造成的成像噪音背景,增强信噪比。In some embodiments, the microfluidic sample chamber 108 can be made of materials with a refractive index very similar to that of the sheath fluid in the sample chamber 108 , such materials include silica gel or other polymer materials. In such an embodiment, the imaging noise background may be reduced by matching the optical refractive index of the portion of the laser beam 120 incident on the sample chamber 108 with the fluid within. In addition, for example as shown in FIG. 6 , the sample chamber 108 can also have at least one side that is in a plane shape so that the laser beam 120 can be incident from this surface in a direction perpendicular to the plane, thereby further reducing the impact caused by light scattering on the incident surface of the sample chamber 108. The resulting imaging noise background enhances the signal-to-noise ratio.
本发明还有一种如图2至图3所示的微流器件型流式细胞仪系统200的实施方式。系统200包括一个非相干光源202,一个激光源204,一个样品室或微流装置206(细胞或其他粒子从其中流过)和一个分束元件208。自非相干光源202和激光源204产生的光束入射到微流装置206内的粒子。散射光与荧光信号在通过分束元件208时分开。粒子在激光源204产生的光束激发下所产生的弹性散射光信号通过一波长滤光片1后由一成像传感器220(如标注为CCD1的电荷耦合器件相机)作为衍射图像数据记录;而同一粒子在非相干光源202产生的光束激发下所产生的弹性散射光和/或荧光信号由另一成像传感器210(如标注为CCD2的电荷耦合器件相机)作为非衍射亮场或荧光图像数据记录,具体的图像数据种类可通过选用不同的波长滤光片2选择(见图2)。如图2所示,由非相干光源202产生的光束通过透镜1和透镜2、含有多个不同波长的滤光片的转轮FW以及一个聚光镜后聚焦至微流装置206内的粒子。粒子在非相干光源202激发下所产生的弹性散射光和/或荧光信号通过物镜260(例如聚焦平面在无穷远处的物镜)和分光片208后再通过筒镜和波长滤光片2后由非相干成像传感器210探测。粒子在激光源204激发下所产生的弹性散射光通过物镜260和分光片208后再通过另一个筒镜和波长滤光片1后由衍射成像传感器220探测。The present invention also has an embodiment of a microfluidic device-type
在微流器件型的实施方式中,传感器220获取的衍射图像是由某一角度范围内的散射光形成的,例如与激光源204产生的入射光方向成大约90度角度范围内的散射光方向。传感器210也可获取粒子由于非相干光源202激发所产生的非相干散射光形成的非衍射亮场或暗场图像和/或由非相干荧光信号形成的非衍射荧光图像。在本发明的一些实施方式中,衍射图像与非相干图像可以在基本相同的时间段内获取,并可结合起来对所测量的微流装置206内的粒子进行分析。业内专业人士都知道,非相干图像是为重现所测粒子的结构而形成,但其粒子结构细节的重现精度也即分辨率会由于非相干光残存的相干性而受到限制,也称为分辨率的衍射极限。在本发明的一些实施方式中,非相干图像和衍射图像可以合并在一起用于对粒子的分析。In an embodiment of the microfluidic device type, the diffraction image acquired by the
如图3所示,由传感器210获取的非相干图像和由传感器220获取的衍射图像可通过特征提取模块230分析。微流装置206内的粒子可根据分类模块240对图像数据分析后分类。分类方法可以有多种,例如可以根据细胞类粒子的体积或其他特征进行分类。在本发明的一些实施方式中,衍射图像模拟数据250可通过光学模型和已知的粒子结构获得,这些图像模拟数据可用来“训练”分类方法,使其可通过分类模块240分析并提取粒子的三维结构特征后对粒子分类。As shown in FIG. 3 , the incoherent image acquired by
在图4A至4B所示的一些实施方式中,可用另外一个激光源270提供粒子激发光束,然后在接近180度的背散射方向由传感器220测量有弹性散射光形成的衍射图像。如图4A至4B所示,激光源270的输出光束通过扩束器272,波片274以及衰减片276后再经过分光片208(从图2所示的方位旋转90度)入射至微流装置206内的粒子,产生沿背散射方向上的散射光。In some embodiments shown in FIGS. 4A-4B , another
以上描述很清楚地表明所述的相干激光源204和270以及非相干光源202均可分别用适当的光源器件实现。在一些实施方式中,非相干光源202可以是包括175瓦氙灯的库勒(Kohler)照明系统,而相干激光源204和270可以是波长在180纳米至3000纳米之间的同一或不同的激光系统。具体的激光波长可以是444纳米或532纳米或633纳米。物镜260可以是一个聚焦平面设计在无穷远处的物镜,其数值孔径和工作距离均较大,比如由Mituyo公司生产的型号为M Plan Apo HR 50x或100x的物镜。通过在物镜260后不同距离放置的不同筒镜,衍射图像和非相干图像可使用同一物镜260测量,如图2和图4A至图4B所示。例如其中的物镜放大倍数可以是50x,数值孔径为0.55和工作距离为13毫米。在这些条件下,在空气中所测量的衍射图像是由半角值为48.6度的角度范围内的散射光形成的。如果自光源202和204的入射光所产生的散射光束经过微流装置206的有机硅胶(其可见光范围内的折射率大约为1.40)壁出射,由于光束的折射则所收集的散射光束角度范围的半角值会降低为大约32度。传感器210和220可以使用光敏度较高的电子倍增电荷耦合器件(EMCCD)相机,可减低曝光时间,例如由AndorTechnology公司生产的型号为DU885K,像素数目为1004x1002的电子倍增电荷耦合器件相机。尽管如由Apogee公司生产的型号为Alta U2000相机一类的普通冷却电荷耦合器件相机也可用于图像测量,电子倍增电荷耦合器件相机采用电子倍增的机制在放大所测得光电信号后再进行模数转换,这样可在每个像素只有10个光子数量级的弱光条件下将信噪比提高3到10倍,从而使得将曝光时间自50微秒降低到10微秒或更低成为可能。曝光时间短的好处是可以允许细胞快速流动,从而提高测量处理细胞的速度。上文提到的电子倍增电荷耦合器件相机一般可有高达35兆赫兹的像素读出速率,在将像素进行4x4的合并后,图像读出速率可达每秒112幅。电子倍增电荷耦合器件相机的暗电流与读出噪音一般都较低,因此相机图像输出信号的动态范围较大(例如可达70分贝),可对之进行例如14或更高位数的信号数字化,有利于提高后面的衍射图像数据分析精度。我们应该在这里指出,上述的如角度值、像素数目、图像读出速率等具体数据值仅仅作为某些实施方式的范例,这些数据可采用其他的适当值。The above description clearly shows that the
据此,任何其他适当的流式细胞仪均可作为本发明所述的衍射图像数据测量的实施方式。例如本发明所述的衍射图像测量可通过不同的流式细胞仪系统设计在不同的角度范围内实现。此外,还可通过可靠的触发与延迟电路器件对图像数据测量进行准确地控制测量时间。图5所示的为一具有斜面的微流器件,可用于收集中心散射角度为45度的衍射图像。Accordingly, any other suitable flow cytometer can be used as an embodiment of the diffraction image data measurement described in the present invention. For example, the diffraction image measurement described in the present invention can be realized in different angle ranges by different flow cytometer system designs. In addition, the measurement time of the image data measurement can be accurately controlled through a reliable trigger and delay circuit device. Figure 5 shows a microfluidic device with a slope that can be used to collect diffraction images with a central scattering angle of 45 degrees.
在本发明一些实施方式中,粒子分类由图3所示的分类模块240根据衍射图像和/或非相干图像数据完成。例如粒子分类可以先使用具有已知粒子三维结构特征与参数以及所计算的衍射图像和/或非相干图像数据库训练分类算法,然后通过这些算法对粒子进行分类,对于生物细胞而言,所谓已知粒子三维结构特征与参数可以包括核体积、核形状、核光学折射率及其分布、核体积与细胞质体积之比、细胞形状、细胞质与核之折射率值的对比度、线粒体密度、线粒体与细胞质之折射率值的对比度和线粒体与核之折射率值的对比度。其他可以确定的细胞特征包括生存率、分子键联过程等。用于训练分类算法的数据库可以由非流式仪方法获得的数据组成,其中三维结构特征可用共聚焦显微镜测量方法确定,而衍射图像则可通过严格的基于麦克斯韦方程的弹性光散射模型计算获得(可参见(1)J.Q.Lu,P.Yang,X.H.Hu,″Simulations of Light Scattering from aBiconcave Red Blood Cell Using the FDTD method″,Journal of Biomedical Optics,10(2),024022(2005);(2)R.S.Brock,X.H.Hu,D.A.Weidner,J.R.Mourant,lQ.Lu,″Effect of Detailed Cell Structure on Light Scattering Distribution:FDTD studyof a B-cel1 with 3D Structure Reconstructed from Confocal Images″,Journal ofQuantitative Spectroscopy & Radiative Transfer,102,25-36(2006))。In some embodiments of the present invention, particle classification is performed by the
在本发明一些实施方式中,粒子的结构参数可以通过在置于偏离聚焦位置的成像系统所测得的图像数据分析获得,如下面的例4中所述。In some embodiments of the present invention, the structural parameters of the particles can be obtained by analyzing image data measured with an imaging system placed at an off-focus position, as described in Example 4 below.
尽管这里讨论的本发明实施方式是依据图1中基于微流器件设计的流式细胞仪10和流控装置100描述的,应该指出本发明还可采用其他流控技术。例如流控装置可以采用非微流器件方式加以实现。图12显示了一个基于“流中流”设计概念的流控装置300。流控装置300包括一个用于储存样品流302A的样品流池302、一个鞘流入口304以及包含三种不同流体通道306A、306B和306C的流体样品室305。流体样品室305可以是内部充满水的玻璃容器。Although the embodiments of the present invention discussed here are described in terms of the
样品流池302包括一个用于将样品流302A压入流体样品室305的活塞302B,使得样品流302A与自鞘流入口304处流入的鞘流会合。样品流302A进入流体通道306A、鞘流经入口304进入另一通道306B后与样品流302A在此处会合。样品流池302也包括一个保持样品粒子在样品流302A中悬浮的搅拌装置302C。流体样品室305包括流体通道306B和306C,其间有一隙域308。通过对流体流量以及流体通道306A和306B尺寸和位置的调节,可以使自通道306A流至通道306B的样品流与鞘流形成层流后经过隙域308流入通道306C,最后流至出口310。此时粒子P在流体动力学聚焦条件下由样品流302A夹载以单列方式通过隙域308,使用在合适的位置上的物镜260以及后接的相机(如电荷耦合器件相机)即可对位于流体样品室305内隙域308的粒子P进行单个粒子图像测量。样品流用以携带各种需要测量的粒子,例如这里所讨论的生物细胞(包括人体细胞和水生植物细胞)及其他微粒。The
在这种配置方式下,粒子P在流经隙域308时所发出的光信号被成像传感器接收,此时粒子P附近不存在类似于制作通道306A、306B和306C的光折射率不同的材料。In this configuration, the light signal emitted by the particle P when it flows through the
在本发明一些实施方式中,可用不锈钢细管作为通道306A引导样品流302A自的样品流池302流入通道306B,不锈钢细管内直径例如可为大约200微米,外直径可为大约300微米。图12所示的通道306B是由一个内部长度约为8毫米的玻璃管T2连接一个漏斗形的玻璃质方形管T1组成的,T1的内边长可约为80微米外边长可约为230微米。在由供给流体的针管泵所提供的适当的压强差条件下,样品流与鞘流在通道306B的玻璃管T2内形成层流。通过此层流,粒子可在流过隙域308时定位于直径最小约为100微米的样品流内,然后由通道306C收集排出。隙域308在流动方向的长度可约为5毫米。如果流体样品室305内的流体以及流过通道306A、306B和306C内的流体具有相同或相似的光折射率(例如样品流、鞘流和流体样品室305内的流体均为水或以水为主的液体),则在成像系统的视野内这三种流体之间的界面就不存在折射率差异或差异极小。比如工作距离为13毫米的物镜260可以用来选择视野,使得流体样品室305的玻璃外壳在视野之外,从而可在视野内消除具有不同折射率的界面,或使界面的折射率差异极小。In some embodiments of the present invention, a stainless steel thin tube may be used as the
应该指出流体样品室305与物镜260可用任何其他适当的方式实现。例如在通道306B中以层流形式流动的样品流和鞘流可以从流体样品室305的上端或侧面进入,而不是如图12所示的从下端进入。It should be noted that the
因此,通过减低或消除在粒子P附近区域内的界面折射率差异可提高物镜206(如图2、图3、图4A至图4B和图5中所示)测量到的图像质量。与设计为微流装置的样品室108相比,在粒子P附近隙域308不存在大的折射率差异。一或多数激光束可从流体样品室305的一个平侧面入射后激发粒子P,然后使用显微镜物镜260和其后的相机(如电荷耦合器件相机)从另个平侧面收集测量散射光。在一些实施方式中,物镜260及其位置可以选择使其视野不含流体样品室305的任何平侧面(一般与粒子P的距离可在10至15毫米之间)。基于“流中流”概念设计的通道306B和306C以及隙域308是用以减小或消除粒子P附近界面的折射率差异,同时还可提供与通常形式的流式细胞仪相似的层流条件,使得快速分析和/或利用多束激光入射光成为可能。Therefore, image quality measured by the objective lens 206 (as shown in FIGS. 2 , 3 , 4A-4B and 5 ) can be improved by reducing or eliminating the interfacial refractive index difference in the vicinity of the particle P. In contrast to the sample chamber 108 designed as a microfluidic device, there is no large refractive index difference in the
我们现在将讨论下述几个不带局限性的范例,用来描述本发明的其他实施方式。We will now discuss the following several non-limiting examples to illustrate other embodiments of the invention.
例一Example one
为了从相干散射光激发下的粒子所产生的弹性散射光信号中提取更多的结构信息,我们试制了一台微流器件型流式细胞仪原型机,以验证利用一台标准的电荷耦合器件相机(Alta 2000,Apogee)测量衍射图像的概念。该原型机如图6a至图6d所示,其性能可以达到表一所列的指标。In order to extract more structural information from the elastically scattered light signal generated by particles excited by coherent scattered light, we fabricated a prototype microfluidic device-based flow cytometer to verify the use of a standard charge-coupled device A camera (Alta 2000, Apogee) measures the concept of diffraction images. The prototype machine is shown in Figure 6a to Figure 6d, and its performance can reach the indicators listed in Table 1.
表一:双图象微流器件型流式细胞仪的期望指标Table 1: Expected indicators of a dual-image microfluidic device-based flow cytometer
*假设所使用的物镜输出光为聚焦至无穷远的平行光,放大倍数为50x,工作距离为5.2毫米,波长为633纳米时数值孔径为0.75。*Assume that the output light of the objective lens used is parallel light focused to infinity, the magnification is 50x, the working distance is 5.2 mm, and the numerical aperture is 0.75 at a wavelength of 633 nm.
^假设使用电子倍增电荷耦合器件(EMCCD)相机,其信号为像素深度(well depth),噪音由暗电流与读出噪音组成。^Assuming an electron multiplying charge-coupled device (EMCCD) camera, the signal is well depth, and the noise consists of dark current and readout noise.
如图6a所示,流控装置是由具有可以精确独立控制的移动活塞的针管以及与之相连的步进马达和齿轮组成。针管用以储存样品流和鞘流流体,通过推动活塞施加适当压强迫使此二种流体以层流方式流入一硅胶所制的微流器件。微流器件是通过将在波长为633纳米时折射率为1.41的硅胶液注入内含一细长玻璃纤维的模子后固化,然后在将玻璃纤维抽出后形成内壁光滑和直径可在20至200微米范围内的微通道而获得的。此微通道通过一个标准的流式细胞仪喷头与流控装置相连,微通道内所形成的层流长度可达80毫米。经过对数种不同的微流器件设计的测试,我们获得了在不同样品流直径与流速条件下形成层流的数据。与目前标准的流式细胞仪相比,使用硅胶类高分子材料所制的微流器件多种好处:层流长度大(80毫米相对于10毫米)、样品流速可以极低(0.01米/秒相对于10米/秒)以及鞘流与微通道材料之间的折射率差异较小(在使用由甘油和水调成的混合液为鞘流时0.02或更小相对于水与玻璃之间的0.2)。上述的后两个好处对图像流式细胞仪的设计大为有益:可以使用曝光时间长达50微秒的普通冷却电荷耦合器件相机测量图像数据(在流速为0.01米/秒时,粒子在曝光时间内的移动只有0.2微米),并可减少由于散射光在通过鞘流-硅胶管壁界面时产生的噪音信号。As shown in Figure 6a, the fluidic device consists of a needle tube with a moving piston that can be precisely and independently controlled, and a stepper motor and gears connected to it. The needle tube is used to store the sample flow and the sheath flow fluid, and the two fluids are forced to flow into a microfluidic device made of silica gel in a laminar flow mode by pushing the piston to apply appropriate pressure. The microfluidic device is cured by injecting a silicone liquid with a refractive index of 1.41 at a wavelength of 633 nanometers into a mold containing a slender glass fiber, and then pulling out the glass fiber to form a smooth inner wall and a diameter of 20 to 200 microns. obtained from a range of microchannels. The microchannel is connected to the flow control device through a standard flow cytometer nozzle, and the length of the laminar flow formed in the microchannel can reach 80 mm. After testing several different microfluidic device designs, we obtained data on the formation of laminar flow under different sample flow diameters and flow rates. Compared with current standard flow cytometers, microfluidic devices made of silica gel-based polymer materials have many advantages: large laminar flow length (80 mm vs. 10 mm), sample flow rate can be extremely low (0.01 m/s Relative to 10 m/s) and the difference in refractive index between the sheath flow and the microchannel material is small (0.02 or less relative to the difference between water and glass when using a mixture of glycerin and water as the sheath flow 0.2). The last two benefits mentioned above are of great benefit to the design of an image flow cytometer: image data can be measured using a common cooled charge-coupled device camera with an exposure time of up to 50 microseconds (at a flow velocity of 0.01 m/s, particles are exposed at The time shift is only 0.2 microns), and can reduce the noise signal generated by the scattered light passing through the sheath flow-silicone tube wall interface.
为了检验上述微流器件型流式细胞仪原型机,我们研制了可用来测量在波长为633纳米激光束激发下直径为25微米的聚苯乙烯微球产生的衍射图像的成像系统。成像系统由一个输出为聚焦至无穷远的平行光的物镜(M Plan Apo HR 50x,Mituyo)与以冷却电荷耦合器件相机组成用来测量衍射图像。具有氙灯的库勒照明系统作为非相干光源用来测量亮场图像及系统校准。测量衍射图像时需要挡住非相干光源的入射光束。在选用一个工作距离为13毫米,数值孔径为0.55的物镜测量衍射图像时,所对应的散射光角度收集范围为θs和Φss(见图7中的角度定义)分别为70度至110度之间,均相对于入射激光束的方向。通过可计算球的光散射角度分布的米(Mie)理论,我们根据聚苯乙烯微球在波长为633纳米时置于水中的相对折射率计算其应该产生的衍射图像并示于图8b,可与图8a所示的测量衍射图像数据比较。所计算的微球衍射图像的视野是根据所用物镜的数值孔径与工作距离决定的。可以看出,上述测量得到的和计算得到的衍射图像在其特征的光强干涉条纹方面吻合较好。通过进一步改进成像光学系统可以将图像数据中的背景噪音进一步减低。To examine the above-mentioned microfluidic device-based flow cytometer prototype, we developed an imaging system that can measure the diffraction images produced by polystyrene microspheres with a diameter of 25 μm when excited by a laser beam with a wavelength of 633 nm. The imaging system consists of an objective lens (M Plan Apo HR 50x, Mituyo) whose output is parallel light focused to infinity and a cooled charge-coupled device camera to measure diffraction images. A Cooler illumination system with a xenon lamp was used as an incoherent light source for measuring bright-field images and for system calibration. Blocking the incident beam of an incoherent light source is required when measuring a diffracted image. When an objective lens with a working distance of 13 mm and a numerical aperture of 0.55 is selected to measure the diffraction image, the corresponding scattered light angle collection ranges are θs and Φss (see the angle definition in Figure 7), which are respectively between 70 degrees and 110 degrees Both are relative to the direction of the incident laser beam. Through the Mie theory that can calculate the light scattering angle distribution of the ball, we calculate the diffraction image that should be produced by polystyrene microspheres based on the relative refractive index of polystyrene microspheres placed in water at a wavelength of 633 nm and are shown in Figure 8b, which can be Comparison with the measured diffraction image data shown in Fig. 8a. The field of view of the calculated microsphere diffraction image is determined according to the numerical aperture and working distance of the objective lens used. It can be seen that the measured and calculated diffraction images are in good agreement in terms of their characteristic light intensity interference fringes. The background noise in the image data can be further reduced by further improving the imaging optical system.
例二Example two
图9为一单色相干光束入射至一内部光折射率n(r,λ)不均匀的粒子时所产生散射光的示意图,r为位置坐标矢量,λ为入射及散射光波长(两者相同)。散射光场之间的空间相干性会导致具有特征性的散射光分布,可作为衍射(空间域)或散斑(空间域或时间域)图像测量。利用基于麦克斯韦方程或波动方程解的精确波动模型可以训练模式识别软件,并可能从代表弹性散射光的分布或衍射图像数据中提取散射粒子或细胞内部的光折射率分布和相关的三维结构信息。细胞内部的折射率分布函数n(r,λ)与其结构相关联(参见R.Baer,″Phase contrast and interference microscopy in cytology,″inPhysical Techniques in Biological Research,edited by AW.Pollister(AcademicPress,New York,1966),第三卷,第一章)。生物细胞与光散射相关的尺度可由以尺度参数α(=2πa/λ)表示,大多数生物细胞的值在自紫外至近红外光谱范围内界于1至100之间,这里2a为细胞平均直径(见图9)。精确地模拟光散射现象需要对能够代表真实细胞三维结构的粒子形状所产生的散射光电磁场进行数值计算,这里所谓真实细胞三维结构可用现有的方法例如共聚焦显微镜方法测量。在散射光场数值计算领域,最近的研究进展提供了可用于研究细胞结构和其散射光角度分布也即衍射图像之间相关性的一些工具。这些包括基于差分时间域(FDTD)算法的平行计算方法以及基于分离偶极子近似(DDA)的平行计算方法,这些平行算法可在低成本的平行计算机群集运行(参见J.Q.Lu,P.Yang,X.H Hu,″Simulations of Light Scattering froma Biconcave RedBlood Cell Using the FDTD method,″J.Biomed.Opt.,10,024022(2005);R.S.Brock,X.H.Hu,P.Yang,J.Q.Lu,″Evaluation of a parallel FDTD code and applicationto modeling of light scattering by deformed red blood cells,″Opt.Express,13,5279-5292(2005);M.A.Yurkin,K.A.Semyanov,P.A.Tarasov,A.V.Chernyshev,A.G.Hoekstra,V.P.Maltsev,″Experimental and theoretical study of lightscattering by individual mature red blood cells by use of scanning flow cytometryand a discrete dipole approximation,″Appl.Opt.,44,5249-56(2005);M.A.Yurkin,A.G.Hoekstra,R.S.Brock,J.Q.Lu,″Systematic comparison of the discrete dipoleapproximation and the finite difference time domain method for large dielectricscatterers,″Opt.Express,15,17902-17911(2007))。此外,根据共聚焦显微图像数据重建细胞三维结构的方法也已见报道(参见R.S.Brock,X.H.Hu,D.A.Weidner,J.R.Mourant,J.Q.Lu,″Effect of Detailed Cell Structure on Light ScatteringDistribution:FDTD study of a B-cell with 3D Structure Constructed from ConfocalImages,″J.Quant.Speclrosc.Radial.Transfer,102,25-36(2006);H.R.Hurwitz,J.Hozier,T.LeBien,J.Minowada,K.Gajl-Peczalska,I.Kubonishi,I.Kersey,″Characterization of a leukemic cell line of the pre-B phenotype,″Int.J.Cancer,23,174-180(1979))。Fig. 9 is a schematic diagram of scattered light generated when a monochromatic coherent light beam is incident on a particle with a non-uniform internal optical refractive index n(r, λ), where r is the position coordinate vector, and λ is the wavelength of the incident and scattered light (both are the same ). The spatial coherence between scattered light fields results in a characteristic scattered light distribution, which can be measured as a diffraction (spatial domain) or speckle (spatial or temporal domain) image. Utilizing accurate wave models based on solutions of Maxwell's equations or wave equations can train pattern recognition software and potentially extract the light-refractive index distribution and associated 3D structural information inside scattered particles or cells from distributions representing elastically scattered light or from diffraction image data. The refractive index distribution function n(r, λ) inside the cell is related to its structure (see R. Baer, "Phase contrast and interference microscopy in cytology," in Physical Techniques in Biological Research, edited by AW. Pollister (Academic Press, New York, 1966), Volume III, Chapter I). The scale of biological cells related to light scattering can be expressed by the scale parameter α (=2πa/λ), the value of most biological cells is between 1 and 100 in the spectral range from ultraviolet to near infrared, where 2a is the average cell diameter ( See Figure 9). Accurately simulating light-scattering phenomena requires numerical calculation of the scattered photoelectric field generated by particle shapes that represent the three-dimensional structure of real cells, which can be measured by existing methods such as confocal microscopy. In the field of numerical calculation of scattered light fields, recent research progress has provided some tools that can be used to study the correlation between cell structure and its angular distribution of scattered light, that is, the diffraction image. These include parallel computing methods based on differential time-domain (FDTD) algorithms and parallel computing methods based on the separated dipole approximation (DDA), which can be run on low-cost parallel computer clusters (cf. J.Q.Lu, P.Yang, X.H Hu, "Simulations of Light Scattering froma Biconcave RedBlood Cell Using the FDTD method," J.Biomed.Opt., 10, 024022 (2005); R.S.Brock, X.H.Hu, P.Yang, J.Q.Lu, "Evaluation of a parallel FDTD code and application to modeling of light scattering by deformed red blood cells, "Opt.Express, 13, 5279-5292 (2005); M.A.Yurkin, K.A.Semyanov, P.A.Tarasov, A.V.Chernyshev, A.G.Hoekstra, V.P.Maltsev and Experimental study of lightscattering by individual mature red blood cells by use of scanning flow cytometry and a discrete dipole approximation,"Appl.Opt., 44, 5249-56(2005); M.A.Yurkin, A.G.Hoekstra, R.S.Brock, J.Q.Lu, "Systematic of the discrete dipole approximation and the finite difference time domain method for large dielectric scatterers, "Opt. Express, 15, 17902-17911 (2007)). In addition, the method of reconstructing the three-dimensional structure of cells based on confocal microscopic image data has also been reported (see R.S.Brock, X.H.Hu, D.A. Weidner, J.R.Mourant, J.Q.Lu, "Effect of Detailed Cell Structure on Light Scattering Distribution: FDTD study of a B-cell with 3D Structure Constructed from ConfocalImages, "J.Quant.Speclrosc.Radial.Transfer, 102, 25-36 (2006); H.R.Hurwitz, J.Hozier, T.LeBien, J.Minowada, K.Gajl-Peczalska , I. Kubonishi, I. Kersey, "Characterization of a leukemic cell line of the pre-B phenotype," Int. J. Cancer, 23, 174-180 (1979)).
我们运用差分时间域平行计算方法模拟计算了根据源自人体B淋巴细胞的NALM-6培养细胞弹性散射光的相干空间分布,并与这些细胞的三维结构结合建立了一个可用于训练分类算法软件的数据库。NALM-6培养细胞的三维结构是在将细胞用一种核染料(Syto61,Invitrogen)染色并进行共聚焦显微成像后再重建的。图10显示了7个NALM-6细胞以及其三维结构参数的表格。在将细胞的三维结构输入差分时间域平行计算软件后即可计算获得不同的穆勒(Mueller)矩阵元,其中的S11矩阵元代表了散射光与非偏振入射光的强度比值。模拟计算结果是在采用下列假设后获得的:(1)细胞内核与细胞质区域各自是均匀的;(2)入射光在空气中的波长为0=1微米;(3)细胞质区域的光折射率为nc=1.3675+i1.0x10-5,细胞核区域的光折射率为nn=1.42或1.46(参见J.R.Mourant,M.Canpolat,C.Brocker,O.Esponda-Ramos,T.M.Johnson,A.Matanock,K.Stetter,J.P.Freyer,″Light scattering from cells:the contribution of the nucleus andthe effects of proliferative status,″J.Biomed.Opt.,5,131-7(2000));(4)每个细胞均悬浮于一均匀的宿主介质之中,其折射率为nh=1.35。差分时间域平行计算方法所采用的三维计算方格的单元边长设为x=λ/20,其中λ=λ0/nh。为了研究散射光分布与细胞取向的关系,每个细胞的模拟计算在均匀分布于4π球面度内的12个取向角度(θ0,Φ0)上分别进行。We simulated and calculated the coherent spatial distribution of elastically scattered light from NALM-6 cultured cells derived from human B lymphocytes by using the differential time-domain parallel computing method, and combined with the three-dimensional structure of these cells to establish a classification algorithm software that can be used to train database. The three-dimensional structure of NALM-6 cultured cells was reconstructed after the cells were stained with a nuclear dye (Syto61, Invitrogen) and imaged by confocal microscopy. Figure 10 shows a table of seven NALM-6 cells and their three-dimensional structural parameters. After the three-dimensional structure of the cell is input into the differential time-domain parallel computing software, different Mueller matrix elements can be calculated, and the S11 matrix element represents the intensity ratio of scattered light to unpolarized incident light. The simulation calculation results are obtained after adopting the following assumptions: (1) the cell nucleus and the cytoplasmic region are homogeneous; (2) the wavelength of the incident light in air is0 = 1 micron; (3) the light refractive index of the cytoplasmic region is nc =1.3675+i1.0x10-5 , the optical refractive index of the nucleus region nn =1.42 or 1.46 (see JRMourant, M.Canpolat, C.Brocker, O.Esponda-Ramos, TMJohnson, A.Matanock, K .Stetter, JPFreyer, "Light scattering from cells: the contribution of the nucleus and the effects of proliferative status," J.Biomed.Opt., 5, 131-7 (2000)); (4) each cell was suspended in a In a homogeneous host medium, the refractive index is nh =1.35. The unit side length of the three-dimensional calculation grid adopted by the differential time domain parallel calculation method is set to x=λ/20, where λ=λ0 /nh . In order to study the relationship between scattered light distribution and cell orientation, the simulation calculation of each cell was carried out at 12 orientation angles (θ0 , Φ0 ) uniformly distributed within 4π steradians.
图11通过3张标绘图显示了9个NALM-6培养细胞模拟计算散射光信号在二维特征空间内的分布,这里二维特征空间定义为每个细胞代表其前向散射在散射极角θs=0°时的矩阵元S11值相对于代表其侧向散射信号的在不同角度范围内的S11积分值。所显示的9个细胞包括了图10所示的7个,另外2个细胞是通过将#9与#10细胞的核折射率设为较高值获得的。图11的标绘图中代表同一细胞的不同符号点是在该细胞不同取向角度上计算获得的。首先我们可以看到代表同一细胞不同取向角度的符号点一般都集聚在同一小区域之内。这表明细胞光散射信号分布对细胞取向并不敏感。从图11中的两个标绘图中还可看到,代表分裂阶段具有分裂核的细胞(#9与#10细胞)的符号点集聚区与代表具有规则核形状的细胞(#1、3、7、2与8细胞)的符号点集聚区以及代表具有较大折射率核的#9与10细胞的符号点集聚区明显分开。这些计算结果证明通过对散射光的角度分布或衍射图像进行详细模拟分析可获得有关细胞结构以及折射率分布的丰富信息,而准确的光散射模型计算方法可用来建立数据库用于训练发展可快速提取三维结构特征和准确的图像模式识别软件。Figure 11 shows the distribution of the scattered light signal of nine NALM-6 cultured cells in the two-dimensional feature space through three plots, where the two-dimensional feature space is defined as each cell representing its forward scattering at the scattering polar angle θ The S11 value of the matrix element ats = 0° is relative to the S11 integral value representing its side scattering signal in different angle ranges. The 9 cells shown include the 7 shown in Figure 10, and the other 2 cells were obtained by setting the nuclear refractive index of #9 and #10 cells to a higher value. In the plot of Fig. 11, different symbol points representing the same cell are calculated at different orientation angles of the cell. First of all, we can see that the symbol points representing different orientation angles of the same cell are generally gathered in the same small area. This indicates that the cellular light scatter signal distribution is not sensitive to cell orientation. From the two plots in Figure 11, it can also be seen that the symbolic point clusters representing cells with split nuclei (#9 and #10 cells) in the division stage are different from those representing cells with regular nuclear shapes (#1, 3, 7, 2, and 8 cells) and those of #9 and 10 cells, which represent nuclei with larger refractive indices, are clearly separated. These calculation results prove that detailed simulation analysis of the angular distribution of scattered light or diffraction images can obtain rich information about cell structure and refractive index distribution, and the accurate light scattering model calculation method can be used to build a database for training development and can be quickly extracted 3D structural features and accurate image pattern recognition software.
例三Example three
我们随机选择了40个在不同生长周期阶段的NALM-6培养细胞用于建立可作为细胞分类训练的数据库。这些细胞在染色后使用一共聚焦显微镜型号LSM 510,Zeiss公司)获得其荧光显微图像数据。重建的细胞三维结构可有两种用途。其一是输入至差分时间域平行计算软件中模拟计算细胞在相干光束激发下的散射光角分布。其二为用来分析和定义细胞的多种结构特征类别,用于开发具有细胞分类功能的图像模式识别软件。单个生物细胞的光散射过程可考虑为一平面电磁波入射至一置于宿主介质的电介质粒子的问题。为说明散射光相对于入射光的偏振变化,通常使用的框架理论采用描述入射和散射光场的斯托克斯(Stokes)矢量与描述细胞光散射性质的穆勒矩阵形式。We randomly selected 40 NALM-6 cultured cells at different growth cycle stages to establish a database that can be used as a training cell classification. Fluorescent microscopic image data of these cells were obtained after staining using a confocal microscope (model LSM 510, Zeiss). The reconstructed three-dimensional structure of cells can be used in two ways. One is to input into the differential time-domain parallel computing software to simulate and calculate the angular distribution of scattered light of cells excited by coherent light beams. The second is to analyze and define a variety of structural feature categories of cells, which are used to develop image pattern recognition software with cell classification functions. The light scattering process of a single biological cell can be considered as a problem of a plane electromagnetic wave incident on a dielectric particle placed in the host medium. To account for the polarization change of scattered light relative to the incident light, a commonly used framework theory takes the form of a Stokes vector describing the incident and scattered light fields and a Mueller matrix describing the light-scattering properties of cells.
如图7所示,入射光710由其电磁场(E0,H0)代表,其中E表示电场强度矢量,H表示磁场强度矢量,其光波动矢量由k0代表;而散射光720则由电磁场(Es,Hs)代表,其光波动矢量由k(|k|=|k0|=2π/λ)代表。宿主介质可以是流式细胞仪中的层流体,其折射率由nh代表,而细胞三维结构则由其内部随空间位置变化的折射率分布n(r,λ)代表。由于散射光场强度矢量与入射光场强度矢量之间的线性关系,细胞光散射的效应可由一2x2复数矩阵代表,并可以此矩阵描述上述电场强度矢量沿散射平面分解的平行(由下标||表示)和垂直分量(由下标⊥表示)的关系,如下式所示,其中散射平面由k和k0矢量定义As shown in Figure 7, the incident light 710 is represented by its electromagnetic field (E0 , H0 ), where E represents the electric field intensity vector, H represents the magnetic field intensity vector, and its light fluctuation vector is represented by k0 ; while the scattered light 720 is represented by the electromagnetic field (Es , Hs ) is represented, and its light fluctuation vector is represented by k (|k|=|k0 |=2π/λ). The host medium can be a laminar fluid in a flow cytometer, whose refractive index is represented by nh , while the three-dimensional structure of the cell is represented by its internal refractive index distribution n(r, λ) that varies with spatial position. Due to the linear relationship between the scattered light field intensity vector and the incident light field intensity vector, the effect of cellular light scattering can be represented by a 2x2 complex matrix, and this matrix can describe the parallelism of the above-mentioned electric field intensity vector decomposed along the scattering plane (by the subscript | ) and the vertical component (represented by the subscript ⊥), as shown in the following formula, where the scattering plane is defined by the k and k0 vectors
上式中的z为位置坐标矢量r沿入射光束方向的分量、r为r的绝对值。由于以上的2x2矩阵元为复数并与场强度相关,一般还可定义一个4x4实数穆勒矩阵S,用以描述可直接测量的光强信号关系。穆勒矩阵的定义为In the above formula, z is the component of the position coordinate vector r along the direction of the incident light beam, and r is the absolute value of r. Since the above 2x2 matrix elements are complex numbers and are related to the field strength, generally a 4x4 real Mueller matrix S can also be defined to describe the directly measurable light intensity signal relationship. The Muller matrix is defined as
上式中的I、Q、U、V、为斯托克斯矢量元,下标0代表入射光束,下标s代表散射光束。所有矩阵元均为散射角度(θs,Φs)与细胞取向角度(θ0,Φ0)的函数。矩阵元S11可用来计算一束非偏振入射光在沿着θs和Φs方向散射时的几率,其他矩阵元则提供有关不同偏振状态散射光的信息。I, Q, U, V in the above formula are Stokes vector elements, the
当波长为的入射光场(E0,H0)以及基于细胞三维结构和内部细胞器折射率所赋值的n(r,λ)函数为已知时,穆勒矩阵元Sij可利用差分时间域数值方法或分离偶极子近似数值方法计算获得(参见J.Q.Lu,P.Yang,X.H Hu,″Simulations of Light Scatteringfrom a Biconcave Red Blood Cell Using the FDTD method,″J.Biomed.Opt.,10,024022(2005);R.S.Brock,X.H.Hu,P.Yang,J.Q.Lu,″Evaluation of a parallel FDTDcode and application to modeling of light scattering by deformed red blood cells,″Opt.Express,13,5279-5292(2005);R.S.Brock,X.H Hu,D.A.Weidner,J.R.Mourant,J.Q.Lu,″Effect of Detailed Cell Structure on Light Scattering Distribution:FDTD study of a B-cell with 3D Structure Constructed from Confocal Images,″J.Quant.Spectrasc.Radiat.Transfer,102,25-36(2006);H.Ding,J.Q.Lu,R.S.Brock,T.J.McConnell,J.F.Ojeda,K.M.Jacobs,X.H.Hu,″Angle-resolved MuellerMatrix Study of Light Scattering by B-Cells at Three Wavelengths of 442,633 and850nm,″J.Biomed.Opt.,12,034032(2007))。用以训练分类软件单元的数据库可包括但不限于以下数据,基于在波长为444、532和633纳米的相干光束激发下的NALM-6培养细胞所计算的S11、S12、S22和S34相对应的衍射图像及根据其共聚焦图像重建的三维结构。When the incident light field (E0 , H0 ) with a wavelength of and the n(r, λ) function assigned based on the three-dimensional structure of the cell and the refractive index of the internal organelle are known, the Mueller matrix element Sij can be used in the differential time domain Numerical method or separated dipole approximate numerical method is calculated (referring to JQLu, P.Yang, XH Hu, "Simulations of Light Scattering from a Biconcave Red Blood Cell Using the FDTD method," J.Biomed.Opt., 10,024022( 2005); RSBrock, XHHu, P.Yang, JQLu, "Evaluation of a parallel FDTDcode and application to modeling of light scattering by deformed red blood cells," Opt.Express, 13, 5279-5292 (2005); RSBrock, XH Hu , DA Weidner, JRMourant, JQLu, "Effect of Detailed Cell Structure on Light Scattering Distribution: FDTD study of a B-cell with 3D Structure Constructed from Confocal Images," J.Quant.Spectrasc.Radiat.Transfer, 102, 25-36( 2006); H.Ding, JQLu, RSBrock, TJMcConnell, JFOjeda, KMJacobs, XHHu,"Angle-resolved MuellerMatrix Study of Light Scattering by B-Cells at Three Wavelengths of 442,633 and850nm,"J.Biomed.Opt., 12 , 034032 (2007)). The database used to train the classification software unit may include, but is not limited to, data based on S11 , S12 , S22 , and S34 Corresponding diffraction images and the 3D structure reconstructed from their confocal images.
模拟衍射图像可以通过将计算获得的Sij(θs,Φs)投影至代表成像传感器的(x,y)平面而得到,准确计算模拟衍射图像应该使用细胞的实际三维结构作为散射粒子。细胞的三维结构可通过共聚焦图像重建,再对细胞内折射率分布赋值后作为数据输入到例如差分时间域数值或分离偶极子近似数值计算软件。比如细胞可在使用一种红色的核酸染料(Syto 61,Invitrogen)染色后进行共聚焦显微镜测量。所获得的每幅共聚焦图像在对其所有像素进行柱形统计图分析后根据其红色荧光发光强度分为三组:在宿主介质溶液内的像素(假设细胞已洗干净),在细胞质内的像素和在细胞核内的像素。在将每幅共聚焦图像内不同组像素之间的边界标出后即获得细胞核膜与细胞膜的轮廓线。将沿显微镜z轴不同高度测量的各幅共聚焦图像内的轮廓线相连,即可获得细胞核膜与细胞膜的三维形状并可按不同区域分别赋折射率值而得到n(r,λ)。折射率分布函数n(r,λ)的值可基于与穆勒矩阵元测量值的拟合而确定(参见A.Zharinov,P.Tarasov,A.Shvalov,K.Semyanov,D.R.van Bockstaele,V.P.Maltsev,″A study of light scatteringof mononuclear blood cells with scanning flow cytometry,″J.Quant.Spectrasc.Radiat.Transfer,102,121-128(2006);H.Ding,J.Q.Lu,R.S.Brock,T.J.McConnell,J.F.0jeda,K.M.Jacobs,X.H.Hu,″Angle-resolved Mueller Matrix Study of LightScattering by B-Cells at Three Wavelengths of 442,633 and 850nm,″J.Biomed.Opt.,12,034032(2007))。The simulated diffraction image can be obtained by projecting the calculatedSij (θs , Φs ) onto the (x, y) plane representing the imaging sensor, and the accurate calculation of the simulated diffraction image should use the actual three-dimensional structure of the cell as the scattering particles. The three-dimensional structure of the cell can be reconstructed from the confocal image, and then the intracellular refractive index distribution is assigned a value as data input to software such as differential time-domain numerical value or separated dipole approximate numerical calculation software. For example, cells can be measured by confocal microscopy after staining with a red nucleic acid dye (Syto 61, Invitrogen). Each obtained confocal image is divided into three groups according to its red fluorescence emission intensity after the histogram analysis of all pixels: pixels in the host medium solution (assuming that the cells have been washed), pixels in the cytoplasm pixels and pixels within the nucleus. After marking the boundaries between different groups of pixels in each confocal image, the contour lines of the nuclear membrane and the cell membrane were obtained. By connecting the contour lines in the confocal images measured at different heights along the z-axis of the microscope, the three-dimensional shapes of the nuclear membrane and the cell membrane can be obtained, and n(r, λ) can be obtained by assigning refractive index values to different regions. The value of the refractive index distribution function n(r, λ) can be determined based on a fit to the measured values of the Mueller matrix elements (cf. A. Zharinov, P. Tarasov, A. Shvalov, K. Semyanov, DR van Bockstaele, VP Maltsev, " A study of light scattering of mononuclear blood cells with scanning flow cytometry, "J.Quant.Spectrasc.Radiat.Transfer, 102, 121-128 (2006); H.Ding, JQLu, RSBrock, TJMcConnell, JF0jeda, KMJacobs, XHHu," Angle-resolved Mueller Matrix Study of Light Scattering by B-Cells at Three Wavelengths of 442, 633 and 850nm, "J. Biomed. Opt., 12, 034032 (2007)).
最近有关使用角度仪装置测量源于白血病人血样的NALM-6和HL-60培养细胞悬浮液样品的穆勒矩阵元的实验结果已见报告。实验结果表明尽管这两种细胞在显微镜下观察时展示及其相似的细胞与核的三维结构,在例如S12和S34的一些矩阵元的角度分布上,他们还是显示了较大的差异。研究结果表明引入细胞的线粒体,也许可以解释上述矩阵元的差异。为了开发准确适用的图像模式识别软件,我们对已有的NALM-6细胞结构重建方法作了改进,使用两种具有不同发光波长的荧光染料(Invitrogen或其他公司生产的Syto61和MitoTracker Orage染料试剂)在显微镜测量前对细胞核与线粒体同时染色。这样既可在重建三维结构和计算模拟衍射图像时包括这两种细胞器。Recent experimental results have been reported on the measurement of Mueller matrix elements of NALM-6 and HL-60 cultured cell suspension samples derived from leukemia patient blood samples using a goniometer setup. Experimental results showed that although these two types of cells exhibited extremely similar three-dimensional structures of cells and nuclei when observed under a microscope, they still showed large differences in the angular distribution of some matrix elements such as S12 and S34 . The findings suggest that introduction into cells of mitochondria may explain the above-mentioned differences in matrix elements. In order to develop accurate and applicable image pattern recognition software, we improved the existing NALM-6 cell structure reconstruction method by using two fluorescent dyes with different emission wavelengths (Syto61 and MitoTracker Orage dye reagents produced by Invitrogen or other companies) Nuclei were stained simultaneously with mitochondria prior to microscopic measurements. This allows both organelles to be included in the reconstruction of the 3D structure and in the calculation of simulated diffraction images.
尽管上述数值计算方法非常准确,但需要高强度计算,一般在具有16个工作站的平行计算机群集上运行1至2个小时才能获得一幅根据所输入的细胞结构计算的衍射图。根据测量得到的衍射图像数据通过逆运算决定形态结构与对应的折射率可能是一个非常慢的过程,所以用此方法分析包含大量细胞的种群并不可行。因此发展和使用一通过上述方法获得的数据库训练的模式识别或粒子分类软件是可以用来从双图像(即非相干图像与衍射图像)数据快速地提取多个三维结构特征与折射率并据此对粒子分类。模式识别或粒子分类软件可以包括两部分。第一部分可以从被非相干光源激发的染色细胞所产生的非相干亮场或荧光图像数据中提取细胞取向及二维结构特征作为地征标记,第二部分则从被相干光源激发的细胞所产生的衍射图像数据中提取三位结构特征用以建立多达20个分量的细胞分类矢量。分类矢量中的每个结构分量可与流动粒子的三维结构某一特征相关,对于生物细胞而言这些分量可包括核体积、核形状、核光学折射率分布、核体积与细胞质体积之比、细胞形状、细胞质与核之折射率值的对比度、线粒体密度、线粒体与细胞质之折射率值的对比度和线粒体与核之折射率值的对比度。分类软件单元第一部分所提取的地征标记将在第二部分的分析中作为限制条件以减小错误分类的可能性。分类软件的第二部分包括两个模块:(1)自一幅衍射图像中提取三维结构特征的特征提取模块;(2)产生一个分类矢量的分类模块。特征提取模块自衍射图像数据中提取选择多个三维结构特征用于对一个大细胞种群分类。一个为分类软件设计的特征提取模块范例可由下面基于支持矢量机算法的讨论给出(参见I.Guyon,J.Weston,S.Barnhill,V.Vapnik,″Gene selection for cancer classification using support vectormachines,″Mach.Learn.,46,389-422(2002)),应该指出,基于类似于神经网络算法和统计模式识别算法等其他适当方法都适用。支持矢量机算法是一种指导学习工具,可用以在由核函数定义的图像空间中对图像数据分类。它可通过一优化过程找出具有最大距离的超平面分离包括多类图像的训练数据库中的图像数据而解决分类问题。超平面的确立基于一组用于训练寻找边界的例证或支持矢量。优化过程则是通过反复计算一目标函数的变值作为判据检查其进展,目标函数也可通过不同的变值惩罚错误分类而应用于无法分类的数据。一旦使用训练数据建立超平面后,既可根据所测的NALM-6培养细胞的图像数据和其在高维的图像空间内对应位置与超平面的距离对细胞进行分类。支持矢量机算法已经成功地用于对复杂的生物系统进行多种类分类,例如根据基因矢量的肿瘤分类。在解决高维图像空间中的分类问题时,如果每种类内的样品数量较小,支持矢量机算法的效果一般优于其他算法。Although the above-mentioned numerical calculation method is very accurate, it requires high-intensity calculation, generally running for 1 to 2 hours on a parallel computer cluster with 16 workstations to obtain a diffraction pattern calculated according to the input cell structure. Determining the morphological structure and the corresponding refractive index by inverse calculation based on the measured diffraction image data may be a very slow process, so it is not feasible to analyze populations containing a large number of cells by this method. Therefore, the development and use of a pattern recognition or particle classification software trained by the database obtained by the above method can be used to quickly extract multiple three-dimensional structural features and refractive index from dual image (i.e., incoherent image and diffraction image) data and then Classify the particles. Pattern recognition or particle classification software can consist of two parts. The first part can extract cell orientation and two-dimensional structural features as landmarks from incoherent bright-field or fluorescence image data generated by stained cells excited by an incoherent light source, and the second part can be generated from cells excited by a coherent light source. Three-dimensional structural features are extracted from the diffraction image data to create cell classification vectors with up to 20 components. Each structural component in the classification vector can be related to a certain feature of the three-dimensional structure of the flow particle. For biological cells, these components can include nuclear volume, nuclear shape, nuclear optical refractive index distribution, ratio of nuclear volume to cytoplasmic volume, cell Shape, contrast of refractive index values of cytoplasm and nucleus, density of mitochondria, contrast of refractive index values of mitochondria and cytoplasm, and contrast of refractive index values of mitochondria and nucleus. The feature marks extracted by the first part of the classification software unit will be used as constraints in the analysis of the second part to reduce the possibility of misclassification. The second part of the classification software includes two modules: (1) a feature extraction module that extracts three-dimensional structural features from a diffraction image; (2) a classification module that generates a classification vector. The feature extraction module extracts and selects a plurality of three-dimensional structural features from the diffraction image data for classifying a large cell population. A feature extraction module example designed for classification software can be given by the following discussion based on the support vector machine algorithm (referring to I.Guyon, J.Weston, S.Barnhill, V.Vapnik, "Gene selection for cancer classification using support vectormachines," Mach. Learn., 46, 389-422 (2002)), it should be noted that other suitable methods based on algorithms like neural network algorithms and statistical pattern recognition algorithms are applicable. The Support Vector Machine algorithm is a guided learning tool that can be used to classify image data in an image space defined by a kernel function. It solves classification problems by an optimization process to find the hyperplane with the largest distance separating image data in a training database comprising images of multiple classes. The establishment of the hyperplane is based on a set of examples or support vectors used for training to find the boundaries. The optimization process checks its progress by repeatedly computing the variation of an objective function as a criterion. The objective function can also be applied to unclassifiable data by penalizing misclassification with different variation. Once the hyperplane is established using the training data, the cells can be classified according to the measured image data of NALM-6 cultured cells and the distance between their corresponding positions in the high-dimensional image space and the hyperplane. Support vector machine algorithms have been successfully used for multiclass classification of complex biological systems, such as tumor classification based on gene vectors. When solving classification problems in high-dimensional image space, if the number of samples in each class is small, the effect of support vector machine algorithm is generally better than other algorithms.
如上讨论,分类/模式识别软件可以产生一个包含多个分量的分类矢量,而其分量基于三位结构与分子特征。每一分量都会使用一个矢量机算法计算其与结构相关的数值。我们下面将讨论的分类矢量中一个与细胞核体积相关分量的计算步骤即可作为一个说明所提议的支持矢量机方法的例子。其他与三维结构特征相关的分量计算过程也类似,包括下面没提到的结构特征。下文所描述的步骤是设计用来自NALM-6培养细胞衍射图像数据计算获得与核体积相关的分量。其他细胞类型可用同样的方法根据相应的训练数据库处理。As discussed above, classification/pattern recognition software can generate a classification vector containing multiple components based on three-dimensional structure and molecular features. Each component calculates its structure-dependent value using a vector machine algorithm. The computation step of a nuclear volume-related component of the classification vector, which we discuss below, serves as an example illustrating the proposed SVM approach. The calculation process of other components related to three-dimensional structural features is similar, including structural features not mentioned below. The procedure described below is designed to compute components related to nuclear volume using diffraction image data from NALM-6 cultured cells. Other cell types can be processed in the same way against the corresponding training database.
1.核体积标度.用以自一幅衍射图像中决定改分量的支持矢量机算法的输出量并非核体积Vn;而是一个分类数值(CR)。如果一个CR值可等分为10段,即CR=0.1,0.2,0.3…1.0,则Vn值也等分为10段。假如Vn的最大值和最小值分别为200(立方微米)和2000(立方微米),则具有核体积小或等于200(立方微米)的细胞的CR值为0.1,而具有核体积大或等于2000(立方微米)的细胞的CR值则为1.0,具有其他核体积值Vn的细胞可在0.1至1.0之间以此类推等分。计算其它分类矢量分量的方法类似。1.Nuclear Volume Scale . The output of the SVM algorithm used to determine the component from a diffraction image is not the nuclear volume Vn; it is a categorical value (CR). If a CR value can be equally divided into 10 segments, that is, CR=0.1, 0.2, 0.3...1.0, then the Vn value can also be equally divided into 10 segments. If the maximum and minimum values of Vn are 200 (cubic micron) and 2000 (cubic micron), respectively, the CR value of the cell with a nuclear volume small or equal to 200 (cubic micron) is 0.1, while the cell with a nuclear volume large or equal to 2000 (cubic micron) cells have a CR value of 1.0, cells with other nuclear volume values Vn can be equally divided between 0.1 and 1.0 and so on. The calculation method of other classification vector components is similar.
2.训练数据库的类型标定.训练数据库中的每幅衍射图可与根据相应细胞的三维结构所得到的结构参数标定值,而细胞的三维结构是基于共聚焦图像数据重建的。衍射图的标定可用专门开发的软件工具自动进行。软件工具可对数据库内的图像参数进行统计分析而获得每个参数值的范围,从而对参数值决定适当分类标记并自动获得与该参数绝对值相对应的CR值。2.Type calibration of the training database . Each diffraction pattern in the training database can be compared with the structural parameter calibration value obtained according to the three-dimensional structure of the corresponding cell, and the three-dimensional structure of the cell is reconstructed based on the confocal image data. Calibration of diffractograms can be performed automatically with specially developed software tools. The software tool can perform statistical analysis on the image parameters in the database to obtain the range of each parameter value, so as to determine the appropriate classification mark for the parameter value and automatically obtain the CR value corresponding to the absolute value of the parameter.
3.图像空间中的图像矢量计算.每幅自Sij(θs,Φs)获得的衍射图像(256×256像素)可作为一通过适当的核函数而定义的图像空间中的图像矢量,其分量数为256×256。在最简单的情况下,图像空间可由像素坐标x和y也即不同的散射角度θs和Φs投射到代表成像传感器平面的坐标,其总维数为65536。在此图像空间中,图像矢量由代表其像素的(k,z)决定,其中k=256x′+y′,(x′,y′)为将原值为1至256之间的像素坐标值归一化后的值,而介于0与1之间的z(包含0和1)则是归一化后的Sij值。3.Image vector calculation in image space . Each diffraction image (256×256 pixels) obtained from Sij (θs , Φs ) can be used as an image vector in an image space defined by an appropriate kernel function, The number of its components is 256×256. In the simplest case, the image space can be projected from pixel coordinates x and y, that is, different scattering anglesθs andΦs , to coordinates representing the plane of the imaging sensor, with a total dimension of 65536. In this image space, the image vector is determined by (k, z) representing its pixel, where k=256x'+y', (x', y') is the pixel coordinate value whose original value is between 1 and 256 The value after normalization, and z between 0 and 1 (including 0 and 1) is the value ofSij after normalization.
4.分类算法.对基于支持矢量机方法的算法研究可先从由NALM-6培养细胞数据组成的数据库开始,将其内所有图像矢量投影至由选定的核函数所定义的图像空间中。支持矢量机算法即可通过学习过程建立一个超平面。然后据此将图像矢量分为不同的种类并如步骤2所定义的那样进行种类标定。在对训练数据库中的衍射图像的分类完成后,支持矢量机算法既可根据新图像矢量在图像空间中相对于已建立的超平面的距离进行分类。4.Classification algorithm . The algorithm research based on the support vector machine method can start from the database composed of NALM-6 cultured cell data, and project all image vectors in it into the image space defined by the selected kernel function. The support vector machine algorithm can establish a hyperplane through the learning process. Based on this, the image vectors are then divided into different categories and the category calibration is performed as defined in
5.产生分类矢量.多种工具可用于开发高效适用和针对与某个三维结构特征相关分量的支持矢量机分类算法。根据每一与三维结构特征相关的分量进行分类的结果可与自染色细胞所测量的分子特征结合,决定所分析的细胞种群中每个细胞的分类矢量。可开发不同的核函数以达到利用每个分类矢量分量优化分类结果的目的。核函数是用来将衍射图像自原始的成像传感器平面(x,y)坐标变换至另一称为图像空间的空间。通过一个好的核函数可以建立一个图像空间改进分类使得所有图像矢量在其中会按照不同种类各自集中于互不相交的区域。可用的核函数包括多项式或高斯函数以及小波变换,对这些函数进行分析可检查其在图像分类研究方面的效果。5.Generation of classification vectors . A variety of tools are available to develop support vector machine classification algorithms that are efficiently applicable and specific to components associated with a certain three-dimensional structural feature. The results of classifying each component associated with a three-dimensional structural feature can be combined with the molecular features measured from the stained cells to determine a class vector for each cell in the analyzed cell population. Different kernel functions can be developed to achieve the purpose of using each classification vector component to optimize the classification results. The kernel function is used to transform the diffraction image from the original imaging sensor plane (x, y) coordinates to another space called image space. Through a good kernel function, an improved classification of image space can be established in which all image vectors will be concentrated in mutually disjoint regions according to different types. Available kernel functions include polynomial or Gaussian functions and wavelet transforms, which can be analyzed to examine their effectiveness in image classification studies.
这里描述的基于支持矢量机算法的方法使用一种“一对全部”的方式将多个非黑即白式或二元的分类判据结合起来而达到分类的结论。上述核体积例子中建立了10个二元判据,均与根据训练数据库中的三维结构定义的支持矢量相关。在计算某个图像矢量与所有支持矢量的距离后可获得一个二元分类判据相对于某一支持矢量的信心度(CM)。信心度CM值介于-1.0至1.0之间,分别对应于与该支持矢量的最大与最小距离,每个信心度CM值标志该图像矢量是(CM>0)或否(CM<0)属于某一种类。所谓“一对全部”方式即为如果某一种类所对应的CM值是所有CM值中最大的即将所分析的细胞标志为该种类。下面的表二显示了3个根据这种方式分类的例子。The SVM-based approach described here uses a "one-to-all" approach to combine multiple black-and-white or binary classification criteria to reach classification conclusions. In the kernel volume example above, 10 binary criteria were established, all associated with support vectors defined from the 3D structure in the training database. After calculating the distance between a certain image vector and all support vectors, the confidence degree (CM) of a binary classification criterion relative to a certain support vector can be obtained. Confidence CM values are between -1.0 and 1.0, corresponding to the maximum and minimum distances to the support vector, each confidence CM value marks whether the image vector is (CM>0) or not (CM<0) belongs to a certain kind. The so-called "one-to-all" method means that if the CM value corresponding to a certain type is the largest among all CM values, the cells to be analyzed will be marked as this type. Table 2 below shows 3 examples classified in this way.
表二:信心度CM值表与基于“一对全部”方式的分类规则Table 2: Confidence CM value table and classification rules based on the "one-to-all" method

此外,测得的信号与图像数据也可用国际细胞分析学会(International Society forAnalytical Cytology(ISAC))所采用的流式细胞仪标准(Flow Cytometry Standard(FCS))的数据格式表达,有利于细胞仪数据的交流与互换操作性。可采取实用工具软件和XML或其他适当格式表达和显示数据。In addition, the measured signal and image data can also be expressed in the data format of the Flow Cytometry Standard (FCS) adopted by the International Society for Analytical Cytology (ISAC), which is beneficial to the cytometry data. exchange and interchangeability. Data can be represented and displayed using utility software and XML or other appropriate formats.
本发明的各种实施方式可以通过微流器件型的流式细胞仪获取粒子在相干光源和非相干光源激发下所产生的弹性散射光和/或荧光信号形成的衍射图像与非相干图像数据。利用这些数据可在提取三维结构特征的同时也提取基于染色粒子所产生的荧光信号的分子特征,从而使得以前无法实现的在多维特征空间内对含大量粒子的种群进行单粒子分析成为可能。三维结构特征的用途可通过细胞死亡研究的例子体现。细胞死亡定义为其包膜不可逆地丧失其功能,可经过多种机制发生,各自具有不同的形态结构和分子特征。哺乳动物细胞的死亡主要有三种类型:坏死,凋亡和自噬。凋亡和自噬为不同形式的由内部固有途径触发的程序性细胞死亡,凋亡的主要特征为其核形态结构发生变化后质膜出现凹凸泡,最后产生整体皱缩;而自噬的特征则为在细胞质中有大量的双膜液泡产生并积累增多,然后出现溶酶体并合。与此相对照,坏死是外界偶然刺激的结果,造成细胞质膨胀和细胞器变大。作为一种高速仪器,这里所描述的流式细胞仪技术应具有可通过提取三维结构和细胞特征对含有大量不同细胞的种群之内的细胞死亡机制以及相关的时间过程进行定量分析的功能。Various embodiments of the present invention can acquire diffraction image and incoherent image data formed by elastically scattered light and/or fluorescence signals generated by particles excited by coherent light sources and incoherent light sources through a microfluidic device-type flow cytometer. These data can be used to extract the molecular features based on the fluorescent signals generated by the dyed particles while extracting the three-dimensional structural features, thus making it possible to perform single-particle analysis on a population containing a large number of particles in a multi-dimensional feature space that could not be realized before. The use of three-dimensional structural features is exemplified by the study of cell death. Cell death, defined as the irreversible loss of its function by the envelope, can occur through a variety of mechanisms, each with distinct morphological and molecular characteristics. There are three main types of mammalian cell death: necrosis, apoptosis and autophagy. Apoptosis and autophagy are different forms of programmed cell death triggered by internal intrinsic pathways. The main feature of apoptosis is the appearance of concave and convex bubbles in the plasma membrane after the change of nuclear morphology and structure, and finally the overall shrinkage; while the feature of autophagy is In the cytoplasm, a large number of double-membrane vacuoles were produced and accumulated, and then lysosomes merged. In contrast, necrosis is the result of occasional external stimuli, causing swelling of the cytoplasm and enlargement of organelles. As a high-speed instrument, the flow cytometry technique described here should be capable of quantifying cell death mechanisms and their associated time courses within populations containing large numbers of diverse cells by extracting three-dimensional structure and cellular features.
例四Example four
通过图4B所示的系统,我们研究了物镜位置对衍射图像测量的影响。一旦在白光照射条件下看到样品后,物镜260将首先校准至聚焦的位置。该位置在其后的成像测量中作为参照位置或x=0。图13A至图13C显示了三张在白光照射以及物镜位置x=0条件下测得的非相干图像作为例子。With the system shown in Fig. 4B, we investigated the effect of the position of the objective lens on the measurement of diffraction images. Once the sample is seen under white light illumination conditions, the
在系统校正后,引入用于测量衍射图像的激光束并将成像系统位自参考位置x=0移动,然后在不同位置测量衍射图像,曝光时间在50微秒和3秒之间变化。x>0的方向对应于将物镜移向样品。图14展示了一组x位置在-500微米至+500微米之间取自一个直径为25微米微球的衍射图像。这些图像显示出两个特征。第一为在x>0位置上测得的图像都具有典型的竖直干涉条纹,这与基于单球光散射的米理论所预期的结果一致。还有在x增大的位置上所测得的图像展示了相机视野内干涉条纹的扩大,这点与直觉预期的结果相反。第二则为在x<0位置上,当物镜自样品移远时所测得图像内的干涉条纹与样品的结构关系不大。After system calibration, the laser beam used to measure the diffraction image was introduced and the imaging system was moved from the reference position x=0, then the diffraction image was measured at different positions with exposure times varying between 50 microseconds and 3 seconds. A direction of x > 0 corresponds to moving the objective towards the sample. Figure 14 shows a set of diffraction images taken from a 25 micron diameter microsphere at x-positions between -500 microns and +500 microns. These images show two features. The first is that the images measured at the x>0 position all have typical vertical interference fringes, which is consistent with the expected results based on the Mie theory of single-sphere light scattering. Also, images measured at positions where x increases show an enlargement of interference fringes within the camera's field of view, which is contrary to intuitive expectations. The second is that at the position of x<0, when the objective lens moves away from the sample, the interference fringes in the measured image have little to do with the structure of the sample.
除了直径为25微米的微球外,对直径为9.6微米的微球和4个黑色素瘤培养细胞也进行了同样的将物镜平移至不同的x>0位置后成像的实验。衍射图像与物镜位置在x=0两边之间的关系均有与上述相似的特征。在完成对球图像数据分析后发现于x=200微米位置上所测量的衍射图像显示了和粒子结构很强的关联关系,图15显示其中的一些图像作为例子,于x=-200微米位置上所测量的衍射图像也包括其中作为比较。In addition to the microspheres with a diameter of 25 μm, the same experiment was performed on the microspheres with a diameter of 9.6 μm and 4 cultured melanoma cells after the objective lens was translated to different x>0 positions. The relationship between the diffraction image and the position of the objective lens on both sides of x=0 has similar characteristics as above. After completing the analysis of the spherical image data, it was found that the diffraction images measured at x = 200 microns showed a strong correlation with the particle structure. Figure 15 shows some of these images as examples, at x = -200 microns The measured diffraction images are also included for comparison.
为了理解这些衍射图像数据,我们根据米理论(参见C.F.Bohren and D.R.Huffman,“Absorption and Scattering of Light by Small Particles”,(Wiley,New York,1983))计算获得了球散射光的角度分布,并将此分布投影至y-z平面作为计算衍射图像,这里没考虑物镜和筒镜的效应。在波长为532纳米微球和作为宿主介质的凝胶(其成分为水、甘油和羟乙基纤维素)的折射率分别取为1.59和1.40。计算衍射图像时使用了不同的角距值,对应于图像视野中沿水平方向或y轴的半宽角距。两种不同直径微球的计算与测量衍射图像示于图16。In order to understand these diffraction image data, we obtained the angular distribution of spherical scattered light according to the Mie theory (see C.F.Bohren and D.R.Huffman, "Absorption and Scattering of Light by Small Particles", (Wiley, New York, 1983)), and Project this distribution to the y-z plane as the calculated diffraction image, and the effects of the objective lens and the tube lens are not considered here. At a wavelength of 532 nm, the refractive indices of the microspheres and the gel as the host medium (the components of which are water, glycerin and hydroxyethyl cellulose) are taken as 1.59 and 1.40, respectively. Different angular distance values were used in the calculation of the diffraction image, corresponding to the half-width angular distance along the horizontal or y-axis in the field of view of the image. The calculated and measured diffraction images of microspheres with two different diameters are shown in FIG. 16 .
计算图像时并未考虑显微物镜,唯一的变量为角距Θ,减小Θ对应于视野中干涉条纹扩大。将图16(a)、(b)、(d)和(e)中显示的计算衍射图与图16(c)和(f)所显示的在x=200微米位置上所测量的衍射图像相比显示如果用视野中的干涉条纹数目作为判据则二者之间的最好拟合可在Θ=16°时达到。我们注意到根据物镜的数值孔径值(NA=0.55)和凝胶的折射率值(n=1.40)可以计算物镜置于光学聚焦位置(x=0)时的半宽角距为Θ=23°。从计算图像得到的Θ=16°的结果与将物镜自x=0位置沿朝向微球的方向平移200微米后测得的衍射图像结果相差不大,这是没有预料到的,应该与物镜不处于光学聚焦位置有关。在计算图像中的干涉条纹在视野边缘并不像测量图像那样弯曲,可能也是由于物镜造成的。The microscope objective is not taken into account when calculating the image, the only variable is the angular distance Θ, a decrease in Θ corresponds to an enlargement of the interference fringes in the field of view. Comparing the calculated diffraction patterns shown in Figure 16(a), (b), (d) and (e) with the measured diffraction patterns at x=200 microns shown in Figure 16(c) and (f) The ratio shows that the best fit between the two is achieved at Θ = 16° if the number of fringes in the field of view is used as the criterion. We noticed that according to the numerical aperture value of the objective lens (NA=0.55) and the refractive index value of the gel (n=1.40), the half-width angular distance of the objective lens at the optical focus position (x=0) can be calculated as Θ=23° . The result of Θ=16° obtained from the calculated image is not much different from the result of the diffraction image measured after the objective lens is translated from the x=0 position along the direction towards the microsphere for 200 microns. This is unexpected and should be different from the objective lens It is related to the optical focus position. The interference fringes in the computed image are not as curved at the edge of the field of view as in the measured image, probably also due to the objective lens.
我们调查了B16F10培养细胞诱导产生的形态结构变化,以决定这些细胞是否可以作为研究衍射图像和三维结构特征之间关联的模型。观察发现G蛋白耦合受体分子,即GPR4,在B16F10培养细胞中的表达会增加树状突的形成而导致细胞形态结构变化。此外通过吸收光谱仪对黑色素浓度的直接测量还发现GPR4表达会增强作为黑素细胞分化标志的黑色素颗粒的合成,使得细胞中的黑色素含量增加4倍(参见K.M.Jacobs,L.V.Yang,J.Ding,A.E.Ekpenyong,R.Castellone,J.Q.Lu,X.H.Hu,“Diffraction imaging of spheresand melanoma cells with a microscope objective”,J.Biophotonics,2,521-527(2009))。使用传统的流式细胞仪测试了两类细胞类型各10,000个细胞,其散射光信号的标绘图示于图17A至17B。从这些数据可以看出由B16/vector类细胞产生的前向散射光(平均值=391)稍大于B16/GPR4类细胞产生的同样信号(平均值=375),而两类细胞的侧向散射光信号的关系则恰好倒了过来(228相对于414)。We investigated the morphological structural changes induced by cultured B16F10 cells to determine whether these cells could serve as a model for studying the association between diffraction patterns and 3D structural features. It was observed that the expression of a G protein-coupled receptor molecule, namely GPR4, in cultured B16F10 cells would increase the formation of dendrites and lead to changes in cell morphology. In addition, the direct measurement of melanin concentration by absorption spectrometer also found that the expression of GPR4 will enhance the synthesis of melanin granules as a marker of melanocyte differentiation, so that the melanin content in cells will increase by 4 times (see K.M.Jacobs, L.V.Yang, J.Ding, A.E. Ekpenyong, R.Castellone, J.Q.Lu, X.H.Hu, "Diffraction imaging of spheres and melanoma cells with a microscope objective", J.Biophotonics, 2, 521-527(2009)). 10,000 cells of each of the two cell types were tested using conventional flow cytometry, and plots of the scattered light signal are shown in Figures 17A-17B. From these data, it can be seen that the forward scattered light (mean value = 391) produced by B16/vector cells is slightly larger than the same signal produced by B16/GPR4 type cells (mean value = 375), while the side scattered light of the two types of cells The relationship of optical signals is just reversed (228 vs. 414).
为了定量地研究形态结构变化,我们用共聚焦方法对黑色素瘤培养细胞进行了三结构重建。每幅共聚焦图像中的像素按照其荧光发光波长与强度分为三组:细胞质,核与线粒体。然后将每幅图像中的某一细胞器的轮廓线与其上下的共聚焦图像中同一细胞器的轮廓线相连而形成三维结构并可做体积计算。一个B16/GPR4细胞的三维结构作为一个例子以两种剖面图方式示于图18。在所研究的两类细胞中,每类随机选取了5个细胞作共聚焦测量及三维重建。所提取的体积数据列与下面的表三。我们目前正在研究在B16F10培养细胞中由于GPR4诱导的形态结构变化与黑色素合成与分化的机制和功能方面的意义。To quantitatively study morphological structural changes, we performed three-structure reconstructions of melanoma cultured cells using a confocal approach. Pixels in each confocal image are grouped into three groups according to their fluorescence emission wavelength and intensity: cytoplasmic, nuclear, and mitochondrial. Then, the outline of a certain organelle in each image is connected with the outline of the same organelle in the confocal image above and below to form a three-dimensional structure and can be used for volume calculation. The three-dimensional structure of a B16/GPR4 cell is shown in Figure 18 in two cross-sectional views as an example. Among the two types of cells studied, 5 cells were randomly selected from each type for confocal measurement and three-dimensional reconstruction. The extracted volume data are listed in Table III below. We are currently investigating the mechanistic and functional implications of GPR4-induced morphological changes and melanin synthesis and differentiation in cultured B16F10 cells.
表三:B16F10培养细胞的体积数据(微米3)Table 3: Volume data of B16F10 cultured cells (micron3 )

*数据由每组5个细胞统计获得,形式为:平均值 标准偏差。*The data are statistically obtained from 5 cells in each group, in the form of: mean standard deviation.
#等于细胞质与核和线粒体体积总和。#Equal to the sum of the volume of cytoplasm, nucleus and mitochondria.
^N/C为核与细胞的体积比平均值。^N/C is the average volume ratio of nuclei to cells.
指出下列事实很有意义,尽管两类细胞的核与线粒体体积值很接近,但细胞质体积看起来不同。B16/vector细胞具有较大的细胞质体积的结果可用来解释图17A至17B中的散射光信号标绘图的特征,即B16/vector细胞具有较大的细胞体积使其内部的折射率不均匀度变小。此外由GPR4受体分子诱导产生的细胞质体积变化可能导致这些细胞内的细胞骨架有显著的不同,这些不同可对细胞相互连接与移动的能力产生重要影响。尽管传统的流式细胞仪可用于测量如图17A至17B所示的散射光数据,但可很清楚地看到这些数据只能提供非常有限的定量三维结构信息。与此成为对照,这里介绍的衍射图像可以展示不同直径微球之间和大小相似的球与细胞之间的很大区别,因而可用于我们开始所讨论的三维结构特征的提取。我们现在正使用衍射图像流式细胞仪对不同B16F10培养细胞种群的研究并与差分时间域数值方法模拟结果相比较。It is interesting to point out the fact that although the nuclear and mitochondrial volume values are close for the two types of cells, the cytoplasmic volumes appear to be different. The result that B16/vector cells have a larger cytoplasm volume can be used to explain the characteristics of the scattered light signal plots in Figures 17A to 17B, that is, B16/vector cells have a larger cell volume to make the refractive index inhomogeneity inside Small. In addition, changes in cytoplasmic volume induced by the GPR4 receptor molecule may lead to marked differences in the cytoskeleton within these cells, and these differences can have important effects on the ability of cells to connect and move with each other. Although conventional flow cytometry can be used to measure scattered light data as shown in Figures 17A to 17B, it is clear that these data provide only very limited quantitative three-dimensional structural information. In contrast, the diffraction images presented here can show large differences between microspheres of different diameters and between spheres and cells of similar size, and thus can be used for the extraction of the 3D structural features we discussed at the beginning. We are now studying different B16F10 cultured cell populations using diffraction image flow cytometry and comparing the results with numerical simulations using a differential time-domain method.
应该指出上述方法可以用于在流控装置内的粒子,例如图12所示的流控装置。图19、20和图21A至图21C为使用图12所示的流控装置自微球所测的数字图像。具体参数如下,图20所示图像来自直径为9.6微米的微球,激光波长为532纳米,流速为1.6至1.8毫米/秒之间,曝光时间为50微秒。图21A所示图像来自直径为5.2微米的微球,流速约为4.7毫米/秒。图21B所示图像来自直径为9.6微米的微球,流速约为12毫米/秒。图21C所示图像来自直径为25微米的微球,流速约为7毫米/秒。It should be noted that the method described above can be used for particles within a fluidic device, such as the fluidic device shown in FIG. 12 . Figures 19, 20 and Figures 21A-21C are digital images measured from microspheres using the fluidic device shown in Figure 12 . The specific parameters are as follows. The image shown in Figure 20 is from a microsphere with a diameter of 9.6 microns, the laser wavelength is 532 nanometers, the flow rate is between 1.6 and 1.8 mm/s, and the exposure time is 50 microseconds. The image shown in Figure 21A is from microspheres with a diameter of 5.2 microns and a flow rate of approximately 4.7 mm/sec. The images shown in Figure 21B are from microspheres with a diameter of 9.6 microns and a flow rate of approximately 12 mm/sec. The image shown in Figure 21C is from microspheres with a diameter of 25 microns and a flow rate of approximately 7 mm/sec.
现有流式细胞仪技术基于角度积分后的光信号,一个可能的劣势是其自包含丰富信息的光信号中提取结构特征的能力非常有限。这里介绍了用显微物镜成像装置对自嵌于凝胶内单粒子的衍射图像实验结果。这些结果表明,使用物镜在沿接近粒子方向偏离聚焦的位置所测量的衍射图像与样品的三维结构高度相关。我们还进行了对肿瘤基因转化后的B16F10黑色素瘤培养细胞三维结构的研究,结果表明这些细胞可以作为使用衍射图像方法研究三维结构的模型。利用这里所描述的“流中流”技术,可以将显微物镜应用于流式细胞仪快速测量图像数据并提取三维结构特征,其速度可达例如每秒数百个细胞。A possible disadvantage of existing flow cytometry techniques based on angle-integrated light signals is their limited ability to extract structural features from information-rich light signals. Here we present the experimental results of diffraction images of self-embedded single particles in a gel using a microscope objective imaging setup. These results demonstrate that diffraction images measured using an objective lens at off-focus positions along the approach particle direction are highly correlated with the three-dimensional structure of the sample. We also conducted a study on the three-dimensional structure of B16F10 melanoma cultured cells after tumor gene transformation, and the results showed that these cells can be used as a model to study the three-dimensional structure using the diffraction image method. Using the "flow-in-flow" technique described here, microscope objectives can be applied to flow cytometers to rapidly measure image data and extract 3D structural features at speeds of, for example, hundreds of cells per second.
上述讨论仅说明本发明,不应作为限制性的范例。尽管我们描述了本发明几种典型实施方式,业内人士可以很快地认识到本发明的新颖性与优势可以通过对典型实施方式的许多修改实现而无需实质性的变化。因此所有这些修改都应包括在本发明通过其权力要求所规定的范围之内。按此可以理解,上述讨论仅是说明本发明,而不应该作为公开的带限制性的具体实施方式,任何对这里所公开的实施方式或其他实施方式的修改都包括在本发明权力要求所规定的范围之内。本发明由所述的权力要求定义,并包括与权利要求相等的要求。The above discussion is illustrative of the invention only and should not be taken as a limiting example. Although we have described several exemplary embodiments of this invention, those skilled in the art will quickly recognize that the novelty and advantages of this invention can be realized by many modifications of the exemplary embodiments without substantive changes. All such modifications are therefore intended to be included within the scope of this invention as defined by its claims. According to this, it can be understood that the above discussion is only to illustrate the present invention, and should not be used as a disclosed restrictive specific implementation. within the range. The invention is defined by the claims described and includes the equivalents of the claims.
Claims (29)
Translated fromChineseApplications Claiming Priority (3)
| Application Number | Priority Date | Filing Date | Title |
|---|---|---|---|
| US6099308P | 2008-06-12 | 2008-06-12 | |
| US61/060,993 | 2008-06-12 | ||
| PCT/US2009/003508WO2009151610A2 (en) | 2008-06-12 | 2009-06-11 | Flow cytometer apparatus for three dimensional diffraction imaging and related methods |
Publications (2)
| Publication Number | Publication Date |
|---|---|
| CN102037343A CN102037343A (en) | 2011-04-27 |
| CN102037343Btrue CN102037343B (en) | 2013-10-02 |
Family
ID=41417293
Family Applications (1)
| Application Number | Title | Priority Date | Filing Date |
|---|---|---|---|
| CN200980114507.7AExpired - Fee RelatedCN102037343B (en) | 2008-06-12 | 2009-06-11 | Flow cytometer apparatus for three dimensional diffraction imaging and related methods |
Country Status (4)
| Country | Link |
|---|---|
| US (1) | US9013692B2 (en) |
| EP (1) | EP2300800A2 (en) |
| CN (1) | CN102037343B (en) |
| WO (1) | WO2009151610A2 (en) |
Families Citing this family (73)
| Publication number | Priority date | Publication date | Assignee | Title |
|---|---|---|---|---|
| US11243494B2 (en) | 2002-07-31 | 2022-02-08 | Abs Global, Inc. | Multiple laminar flow-based particle and cellular separation with laser steering |
| US8634077B2 (en) | 2008-10-01 | 2014-01-21 | East Carolina University | Methods and systems for optically characterizing a turbid material using a structured incident beam |
| US8310531B2 (en)* | 2009-08-03 | 2012-11-13 | Genetix Corporation | Methods and apparatuses for processing fluorescence images |
| US8674304B2 (en)* | 2010-04-29 | 2014-03-18 | Rensselaer Polytechnic Institute | Plasma diagnostic method using terahertz-wave-enhanced fluorescence |
| US20120225475A1 (en) | 2010-11-16 | 2012-09-06 | 1087 Systems, Inc. | Cytometry system with quantum cascade laser source, acoustic detector, and micro-fluidic cell handling system configured for inspection of individual cells |
| US8941062B2 (en)* | 2010-11-16 | 2015-01-27 | 1087 Systems, Inc. | System for identifying and sorting living cells |
| US10908066B2 (en) | 2010-11-16 | 2021-02-02 | 1087 Systems, Inc. | Use of vibrational spectroscopy for microfluidic liquid measurement |
| CN102288530B (en)* | 2010-12-29 | 2014-05-14 | 天津炜辐医疗科技有限公司 | Time delay integral imaging system for measuring diffraction image of moving particle |
| US9636041B2 (en)* | 2011-01-28 | 2017-05-02 | Bar Ilan University | Method and system for non-invasively monitoring biological or biochemical parameters of individual |
| WO2012101644A2 (en) | 2011-01-28 | 2012-08-02 | Bar Ilan University | Method and system for non-invasively monitoring biological or biochemical parameters of individual |
| WO2014020611A1 (en) | 2012-08-01 | 2014-02-06 | Bar Ilan University | Method and system for non-invasively monitoring biological or biochemical parameters of individual |
| CN103635785B (en)* | 2011-02-15 | 2016-11-02 | 勒克思马克斯科技公司 | Integrate CMOS-FTIR measures and Raman measures spectrogrph and method thereof |
| JP2013024629A (en)* | 2011-07-19 | 2013-02-04 | Sysmex Corp | Flow cytometer |
| CN102507508B (en)* | 2011-09-28 | 2014-03-12 | 天津大学 | Flow measurement system for detecting tumor cells and analysis and monitoring method |
| EP2798333A4 (en)* | 2011-12-29 | 2016-02-10 | Abbott Lab | FLOW CYTOMETRY SYSTEMS AND METHODS OF BLOCKING DIFFRACTION PATTERNS |
| JP2014062822A (en)* | 2012-09-21 | 2014-04-10 | Sony Corp | Fine particle analyzer and fine particle analyzing method |
| CN103728236B (en)* | 2012-10-12 | 2016-01-20 | 厦门福流生物科技有限公司 | A kind of method detecting nano particle |
| CN105008895B (en) | 2012-10-15 | 2019-02-15 | 纳诺赛莱克特生物医药股份有限公司 | System, apparatus and method for particle sorting |
| US8994941B2 (en) | 2012-11-28 | 2015-03-31 | General Electric Company | Optical system, apparatus and method for performing flow cytometry |
| CN103217374B (en)* | 2013-02-20 | 2016-06-01 | 北京大学人民医院 | B-lineage Acute Lymphocyte Leukemia active cell characteristic measurement system |
| US9424459B1 (en)* | 2013-02-25 | 2016-08-23 | Flagship Biosciences, Inc. | Computerized methods for cell-based pattern recognition |
| US9412006B1 (en)* | 2013-02-25 | 2016-08-09 | Flagship Biosciences, Inc. | Continuous tissue analysis scoring scheme based on cell classifications |
| CN104034648A (en)* | 2013-03-05 | 2014-09-10 | 天津炜辐医疗科技有限公司 | Hydrodynamic focusing apparatus used for diffraction imaging flow cytometer |
| WO2014169231A1 (en) | 2013-04-12 | 2014-10-16 | Norton Pierce O | Automated set-up for cell sorting |
| AU2014277636A1 (en) | 2013-06-03 | 2015-11-19 | Garrett Thermal Systems Limited | Particle detection system and related methods |
| US8961904B2 (en) | 2013-07-16 | 2015-02-24 | Premium Genetics (Uk) Ltd. | Microfluidic chip |
| US11796449B2 (en) | 2013-10-30 | 2023-10-24 | Abs Global, Inc. | Microfluidic system and method with focused energy apparatus |
| CN103900944B (en)* | 2014-03-19 | 2016-01-13 | 苏州国科医疗科技发展有限公司 | A liquid flow focus control system of flow cytometer |
| US9551645B2 (en)* | 2014-07-10 | 2017-01-24 | Kinetic River Corp. | Flow cytometry apparatus and methods |
| ES2827022T3 (en)* | 2014-09-30 | 2021-05-19 | Univ California | Imaging Flow Cytometer Using Spatio-Temporal Transformation |
| CN104535481B (en)* | 2014-12-29 | 2017-04-05 | 中国科学院长春光学精密机械与物理研究所 | imaging flow cytometer |
| US10107746B2 (en) | 2015-01-08 | 2018-10-23 | University Of Washington | System and method for immersion flow cytometry |
| JP2018509615A (en) | 2015-02-19 | 2018-04-05 | プレミアム ジェネティクス (ユーケー) リミテッド | Scanning infrared measurement system |
| CN105184853B (en)* | 2015-08-14 | 2018-04-10 | 深圳大学 | A kind of unicellular three-dimensional image generating method based on optical flow analysis |
| EP3350542B1 (en)* | 2015-09-17 | 2022-07-27 | Technion Research & Development Foundation Limited | Reflectance confocal microscopy of blood cells |
| WO2017053592A1 (en)* | 2015-09-23 | 2017-03-30 | The Regents Of The University Of California | Deep learning in label-free cell classification and machine vision extraction of particles |
| EP4215900A1 (en) | 2015-09-23 | 2023-07-26 | Malvern Panalytical Limited | Particle characterisation |
| US11002655B2 (en) | 2015-09-23 | 2021-05-11 | Malvern Panalytical Limited | Cuvette carrier |
| WO2017108129A1 (en)* | 2015-12-23 | 2017-06-29 | Siemens Healthcare Gmbh | Flow cell for analyzing particles in a liquid to be examined |
| EP3404416A4 (en)* | 2016-01-12 | 2019-08-28 | Hanbat National University Industry Academic Cooperation Foundation | APPARATUS AND METHOD FOR GENERATING A THREE-DIMENSIONAL IMAGE OF SOLUT POLYMER SUBSTANCE THAT EXISTS IN A LIQUID SOLVENT |
| GB201604460D0 (en)* | 2016-03-16 | 2016-04-27 | Malvern Instr Ltd | Dynamic light scattering |
| EP3455608A1 (en)* | 2016-05-12 | 2019-03-20 | BD Biosciences | Fluorescence imaging flow cytometry with enhanced image resolution |
| CN106092859A (en)* | 2016-05-26 | 2016-11-09 | 天津大学 | Shape of particle judgement system based on laser interference imaging and in-line holographic and method |
| CN110023759B (en) | 2016-09-19 | 2023-04-04 | 血液学有限公司 | Systems, methods, and articles of manufacture for detecting abnormal cells using multidimensional analysis |
| EP3379232A1 (en) | 2017-03-23 | 2018-09-26 | Malvern Panalytical Limited | Particle characterisation |
| CN115931687A (en) | 2017-03-31 | 2023-04-07 | 生命技术公司 | Apparatus, system and method for imaging flow cytometry |
| US11657593B2 (en) | 2017-07-28 | 2023-05-23 | Siemens Healthcare Diagnostics Inc. | Deep learning volume quantifying methods and apparatus |
| US10578542B2 (en)* | 2017-10-16 | 2020-03-03 | Becton, Dickinson And Company | Multi-photon counting for high sensitivity flow cytometer systems and methods for using the same |
| CN107589052A (en)* | 2017-11-03 | 2018-01-16 | 大唐彬长发电有限责任公司 | Thermal power plant's condensate corrosion product particle size distribution method of testing and its system |
| WO2019161406A1 (en)* | 2018-02-16 | 2019-08-22 | The Regents Of The University Of California | Systems, devices and methods for three-dimensional imaging of moving particles |
| EP3796998A1 (en) | 2018-05-23 | 2021-03-31 | ABS Global, Inc. | Systems and methods for particle focusing in microchannels |
| DE112019003855T5 (en)* | 2018-08-01 | 2021-04-22 | Shimadzu Corporation | SCATTERED LIGHT DETECTOR |
| US12057229B1 (en)* | 2018-11-08 | 2024-08-06 | Dartmouth-Hitchcock Clinic | System and method for analyzing cytological tissue preparations |
| US11151356B2 (en)* | 2019-02-27 | 2021-10-19 | Fei Company | Using convolution neural networks for on-the-fly single particle reconstruction |
| US20220139527A1 (en)* | 2019-03-01 | 2022-05-05 | Agricam Aktiebolag | Method, device and system for detection of micro organisms |
| WO2020190641A1 (en)* | 2019-03-21 | 2020-09-24 | Becton, Dickinson And Company | Light detection systems and methods of use thereof |
| EP4245140A3 (en) | 2019-04-18 | 2024-01-17 | ABS Global, Inc. | System and process for continuous addition of cryoprotectant |
| US12222275B2 (en)* | 2019-05-13 | 2025-02-11 | Vrije Universiteit Brussel | Methods and systems for particle characterisation by imaging free-floating particle movement in liquid enviornment |
| US10670512B1 (en)* | 2019-10-18 | 2020-06-02 | Center For Quantitative Cytometry | Apparatus to perform intrinsic hyper-spectral flow cytometry |
| DE102020100020A1 (en)* | 2020-01-02 | 2021-07-08 | Lum Gmbh | Method and device for the determination of characteristics of particles by multiparametric detection of scattered light and extinction signals |
| US11628439B2 (en) | 2020-01-13 | 2023-04-18 | Abs Global, Inc. | Single-sheath microfluidic chip |
| EP4248190A4 (en) | 2020-11-23 | 2024-12-25 | ABS Global, Inc. | Modular flow cytometry systems and methods of processing samples |
| CN112782059B (en)* | 2020-12-30 | 2024-03-05 | 西安理工大学 | Method for measuring quasi-spherical cell height direction displacement in lens-free imaging system |
| TWI788786B (en) | 2021-02-20 | 2023-01-01 | 大象科技股份有限公司 | Optical detection device and detection method thereof |
| JP2024513349A (en)* | 2021-03-17 | 2024-03-25 | エービーエス グローバル インコーポレイテッド | Cell differentiation based on multidirectional light from microfluidic chips |
| CN113155713B (en)* | 2021-05-28 | 2023-05-05 | 山东大学 | Label-free high-content video flow cytometer and method based on transfer learning |
| CN113740235A (en)* | 2021-09-02 | 2021-12-03 | 清华大学 | Image flow cytometer driven by neuromorphic calculation |
| CN114018831A (en)* | 2021-10-28 | 2022-02-08 | 佛山科学技术学院 | Mueller matrix measuring device |
| CN114778419B (en)* | 2022-02-28 | 2024-06-11 | 山东大学 | High-magnification optical amplification imaging flow cytometer |
| WO2024186257A1 (en)* | 2023-03-06 | 2024-09-12 | Holtra Ab | Interferometric microscopy |
| WO2024238130A2 (en)* | 2023-05-12 | 2024-11-21 | Deepcell, Inc. | Systems and methods for cell morphology analysis |
| CN116778483B (en)* | 2023-08-25 | 2023-10-31 | 泰州骆华生物科技有限公司 | Cell death type identification method based on reflection confocal microscope technology |
| CN118961551B (en)* | 2024-08-22 | 2025-09-23 | 合肥工业大学 | A method for detecting the position of microsphere particles based on back focal plane images of confocal optical paths |
Citations (3)
| Publication number | Priority date | Publication date | Assignee | Title |
|---|---|---|---|---|
| US4500641A (en)* | 1981-03-23 | 1985-02-19 | Nederlandse Centrale Organisatie Voor Toegepast Natuurwetenschappelijk Onderzoek | Flow cytometer for identifying algae by chlorophyll fluorescence |
| US5017497A (en)* | 1986-04-21 | 1991-05-21 | Sequoia-Turner Corporation | Particle discriminator and method |
| CN1854735A (en)* | 2005-04-19 | 2006-11-01 | 林远 | Fluid cell equipment-microcarrier clinical diagnosis chip |
Family Cites Families (14)
| Publication number | Priority date | Publication date | Assignee | Title |
|---|---|---|---|---|
| US3960449A (en) | 1975-06-05 | 1976-06-01 | The Board Of Trustees Of Leland Stanford Junior University | Measurement of angular dependence of scattered light in a flowing stream |
| US4293221A (en) | 1979-04-17 | 1981-10-06 | Research Corporation | Multidimensional slit-scan flow system |
| JPH04337446A (en) | 1991-05-15 | 1992-11-25 | Hitachi Ltd | Method and device for measuring fine grain and constant quantity method |
| US5416582A (en) | 1993-02-11 | 1995-05-16 | The United States Of America As Represented By The Department Of Health And Human Services | Method and apparatus for localization and spectroscopy of objects using optical frequency modulation of diffusion waves |
| US5929443A (en) | 1995-12-18 | 1999-07-27 | The Research Foundation City College Of New York | Imaging of objects based upon the polarization or depolarization of light |
| EP2264428B1 (en) | 1997-01-31 | 2017-05-03 | Xy, Llc | Optical apparatus with focussing reflector for converging radiation onto a flow of particles |
| US7127109B1 (en) | 1999-09-27 | 2006-10-24 | University Of South Florida | Digital interference holographic microscope and methods |
| US6522775B2 (en) | 2001-03-28 | 2003-02-18 | Alan C. Nelson | Apparatus and method for imaging small objects in a flow stream using optical tomography |
| EP1707944A3 (en) | 2001-05-17 | 2006-11-08 | Xenogen Corporation | Method and apparatus for determining target depth, brightness and size within a body region |
| MXPA05001654A (en) | 2002-08-15 | 2005-10-18 | Xy Inc | High resolution flow cytometer. |
| AU2006338285B8 (en)* | 2005-02-09 | 2012-11-08 | S3I, Llc | Method and system for detecting, classifying and identifying particles |
| CA2967964A1 (en) | 2005-10-11 | 2007-04-19 | Duke University | Systems and method for endoscopic angle-resolved low coherence interferometry |
| US8120770B2 (en)* | 2007-09-10 | 2012-02-21 | The Penn State Research Foundation | Three-dimensional (3D) hydrodynamic focusing using a microfluidic device |
| US8634077B2 (en) | 2008-10-01 | 2014-01-21 | East Carolina University | Methods and systems for optically characterizing a turbid material using a structured incident beam |
- 2009
- 2009-06-11WOPCT/US2009/003508patent/WO2009151610A2/enactiveApplication Filing
- 2009-06-11EPEP09762906Apatent/EP2300800A2/ennot_activeWithdrawn
- 2009-06-11USUS12/997,186patent/US9013692B2/enactiveActive
- 2009-06-11CNCN200980114507.7Apatent/CN102037343B/ennot_activeExpired - Fee Related
Patent Citations (3)
| Publication number | Priority date | Publication date | Assignee | Title |
|---|---|---|---|---|
| US4500641A (en)* | 1981-03-23 | 1985-02-19 | Nederlandse Centrale Organisatie Voor Toegepast Natuurwetenschappelijk Onderzoek | Flow cytometer for identifying algae by chlorophyll fluorescence |
| US5017497A (en)* | 1986-04-21 | 1991-05-21 | Sequoia-Turner Corporation | Particle discriminator and method |
| CN1854735A (en)* | 2005-04-19 | 2006-11-01 | 林远 | Fluid cell equipment-microcarrier clinical diagnosis chip |
Also Published As
| Publication number | Publication date |
|---|---|
| US20110090500A1 (en) | 2011-04-21 |
| WO2009151610A3 (en) | 2010-03-11 |
| EP2300800A2 (en) | 2011-03-30 |
| WO2009151610A2 (en) | 2009-12-17 |
| CN102037343A (en) | 2011-04-27 |
| US9013692B2 (en) | 2015-04-21 |
Similar Documents
| Publication | Publication Date | Title |
|---|---|---|
| CN102037343B (en) | Flow cytometer apparatus for three dimensional diffraction imaging and related methods | |
| JP7361149B2 (en) | High-precision 5-part Differential using digital holography microscopy and untouched peripheral blood leukocytes | |
| Pirone et al. | Stain-free identification of cell nuclei using tomographic phase microscopy in flow cytometry | |
| ES3024557T3 (en) | Image-based cell sorting systems and methods | |
| EP2638435B1 (en) | Optical method for characterising transparent particles | |
| Yu et al. | Review of digital holographic microscopy for three-dimensional profiling and tracking | |
| CN101943663B (en) | Measuring analytical system and measuring analytical method for distinguishing diffraction image of particles automatically | |
| CN106520535B (en) | A kind of label-free cell detection device and method based on mating plate illumination | |
| US10578541B2 (en) | Flow cytometer with digital holographic microscope | |
| CN104568857B (en) | A kind of two-dimentional light scattering quiescence cells instrument method and device | |
| Dong et al. | Label-free classification of cultured cells through diffraction imaging | |
| Martin et al. | In-line holographic microscopy with model-based analysis | |
| Feng et al. | Polarization imaging and classification of j urkat t and r amos b cells using a flow cytometer | |
| Go et al. | Deep learning-based hologram generation using a white light source | |
| KR20240107127A (en) | Method and apparatus for determining nanoparticle properties in a sample | |
| Yu Wan et al. | Integration of light scattering with machine learning for label free cell detection | |
| Jiang et al. | Comparison study of distinguishing cancerous and normal prostate epithelial cells by confocal and polarization diffraction imaging | |
| Vovk et al. | Correlation characterization of particles in volume based on peak-to-basement ratio | |
| Han et al. | Flow stokes microscopy for high throughput classification of marine particles | |
| Singh et al. | Analysis of cellular structure by light scattering measurements in a new cytometer design based on a liquid-core waveguide | |
| CN120014636A (en) | Cell classification model training method and device, cell classification method and device | |
| Giugliano et al. | Label-free white blood cell analysis using holographic phase imaging flow cytometry | |
| US20240378908A1 (en) | Computer-implemented method and corresponding apparatus for identifying subcellular structures in the non-chemical staining mode from phase contrast tomography reconstructions in flow cytometry | |
| Martin | Precision Measurements of Colloidal Dynamics with Holographic Microscopy | |
| Alexander | Generative Models for Digital Holographic Microscopy |
Legal Events
| Date | Code | Title | Description |
|---|---|---|---|
| C06 | Publication | ||
| PB01 | Publication | ||
| C10 | Entry into substantive examination | ||
| SE01 | Entry into force of request for substantive examination | ||
| C14 | Grant of patent or utility model | ||
| GR01 | Patent grant | ||
| CF01 | Termination of patent right due to non-payment of annual fee | Granted publication date:20131002 Termination date:20210611 | |
| CF01 | Termination of patent right due to non-payment of annual fee |