CN101702262A - A Data Fusion Method of Urban Traffic Fluidity Index - Google Patents
A Data Fusion Method of Urban Traffic Fluidity IndexDownload PDFInfo
- Publication number
- CN101702262A CN101702262ACN200910211192ACN200910211192ACN101702262ACN 101702262 ACN101702262 ACN 101702262ACN 200910211192 ACN200910211192 ACN 200910211192ACN 200910211192 ACN200910211192 ACN 200910211192ACN 101702262 ACN101702262 ACN 101702262A
- Authority
- CN
- China
- Prior art keywords
- time
- intersection
- vehicle
- average
- arterial
- Prior art date
- Legal status (The legal status is an assumption and is not a legal conclusion. Google has not performed a legal analysis and makes no representation as to the accuracy of the status listed.)
- Granted
Links
- 238000007500overflow downdraw methodMethods0.000titleclaimsdescription24
- 230000003111delayed effectEffects0.000claimsabstractdescription8
- 230000004927fusionEffects0.000claimsdescription30
- 238000004364calculation methodMethods0.000claimsdescription14
- 230000014759maintenance of locationEffects0.000claimsdescription12
- 229920006395saturated elastomerPolymers0.000claimsdescription9
- 238000009826distributionMethods0.000claimsdescription6
- 238000006243chemical reactionMethods0.000claimsdescription4
- 238000013480data collectionMethods0.000claimsdescription3
- 241000282320Panthera leoSpecies0.000claimsdescription2
- 238000000034methodMethods0.000abstractdescription7
- 238000010586diagramMethods0.000description9
- 230000001934delayEffects0.000description3
- 230000001052transient effectEffects0.000description3
- 230000007704transitionEffects0.000description3
- 230000009286beneficial effectEffects0.000description1
- 230000007812deficiencyEffects0.000description1
- 230000007613environmental effectEffects0.000description1
- 230000010365information processingEffects0.000description1
- 238000012544monitoring processMethods0.000description1
- 230000010363phase shiftEffects0.000description1
- 238000012545processingMethods0.000description1
- 238000003672processing methodMethods0.000description1
- 230000002035prolonged effectEffects0.000description1
- 238000004088simulationMethods0.000description1
- 238000012360testing methodMethods0.000description1
- 238000009827uniform distributionMethods0.000description1
Images


Landscapes
- Traffic Control Systems (AREA)
Abstract
Description
Translated fromChinese技术领域technical field
本发明涉及城市道路交通多源数据融合技术领域,尤其涉及面向城市道路交通流畅通性控制指标的数据融合方法。The invention relates to the technical field of multi-source data fusion of urban road traffic, in particular to a data fusion method for urban road traffic flow control indicators.
背景技术Background technique
随着交通需求的持续增加和对路网高畅通性的要求越来越高,传统的交通单一控制目标如交叉口延误、排队长度和停车率等已不能满足城市道路交通控制的需要。为了改善交通运行状况,满足交通出行者对高畅通性的需求,需要建立以畅通性为主要目标的控制方法,以直接、系统、定量地表征交通流的拥堵程度。With the continuous increase of traffic demand and the higher and higher requirements for the smoothness of the road network, the traditional single control objectives of traffic, such as intersection delay, queue length and parking rate, can no longer meet the needs of urban road traffic control. In order to improve the traffic operation conditions and meet the needs of traffic travelers for high smoothness, it is necessary to establish a control method with smoothness as the main goal to directly, systematically and quantitatively characterize the degree of traffic flow congestion.
交通出行者在参与交通中,由于道路和环境条件、交通干扰以及交通管理与控制等因素难免会使旅行时间延长,畅通性就是定量的描述这种旅行时间延长的一种指标。换句话说,由于交通控制、交通流量的增加等外界因素的干扰,从而使得自由行驶交通流的旅行时间被迫延长,畅通性是衡量该旅行时间延长程度的定量指标。畅通性是一个多层次的指标,对于单交叉口、干线多交叉口、区域多交叉口,畅通性指标分别代表不同的含义,以适应不同层次交通控制的需求。When traffic travelers participate in traffic, the travel time will inevitably be prolonged due to factors such as road and environmental conditions, traffic interference, and traffic management and control. Unimpededness is an index to quantitatively describe the prolongation of travel time. In other words, due to the interference of external factors such as traffic control and traffic flow increase, the travel time of free traffic flow is forced to be extended, and smoothness is a quantitative indicator to measure the degree of travel time extension. Flowability is a multi-level index. For single intersections, multi-arterial intersections, and regional multi-intersections, the smoothness indicators represent different meanings to meet the needs of different levels of traffic control.
畅通性是定量描述由于交通控制、交通流量的增加等外界因素而使自由行驶交通流旅行时间延长程度的指标,不是传统交通控制目标的简单累加,其无法通过交通状态获取技术的一次测量得到,必须综合考虑交通环境、交通流特征和多源传感器数据等,借助多源数据融和方法。该畅通性指标的期望是能够尽量给交通参与者一个畅通的、快捷的交通出行环境。Unimpededness is an index that quantitatively describes the extension of travel time of free traffic flow due to external factors such as traffic control and increase in traffic flow. The traffic environment, traffic flow characteristics and multi-source sensor data must be considered comprehensively, with the help of multi-source data fusion methods. The expectation of this smoothness index is to give traffic participants a smooth and fast traffic travel environment as much as possible.
数据融合技术是针对使用了多个或多类传感器的这类系统其关联特征而开展的一种全新的信息处理方法。我国基于新型地磁传感器交通状态获取技术已取得突破进展,利用数据融合技术,将实时地、准确地获取交通流的畅通性指标。Data fusion technology is a new information processing method developed for the correlation characteristics of such systems that use multiple or multiple types of sensors. my country has made breakthroughs in the acquisition technology of traffic status based on new geomagnetic sensors. Using data fusion technology, the smoothness index of traffic flow will be obtained in real time and accurately.
发明内容Contents of the invention
为了克服现有技术结构的不足,本发明提供一种城市交通流畅通性指标的数据融合方法,该方法以畅通性为目标进行优化控制,基于交通状态获取技术获得一次交通参数,以实现交通流的畅通性目标控制,进而研究交通流畅通性指标的融合方法。本发明解决其技术问题所采用的技术方案是:In order to overcome the deficiencies of the existing technical structure, the present invention provides a data fusion method of urban traffic flow index, which optimizes control with smoothness as the goal, and obtains traffic parameters based on traffic state acquisition technology to realize traffic flow The smoothness target control of traffic flow, and then study the fusion method of traffic flow smoothness index. The technical solution adopted by the present invention to solve its technical problems is:
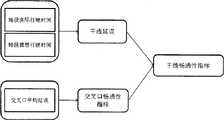
城市交通流畅通性指标的数据融合方法,其包括:十字交叉口畅通性指标的数据融合,其由各个方向的车辆平均延误的加权期望值来体现;干线多交叉口畅通性指标的数据融合,其由车辆通过该干线各交叉口平均旅行时间延误来体现;以及,路网多干线多交叉口畅通性指标的数据融合,其由路网区域中各个干线的平均旅行时间延误加权期望值来体现。所述十字交叉口畅通性指标由十字交叉口中各相位车辆的平均延误时间来确定,所述车辆的平均延误时间包括:滞留时间和损失时间,所述滞留时间是指十字交叉口的排队等待时间,其由车辆饱和度所决定的滞留时间计算而得,所述饱和度由交通信号灯的周期长、绿信比、车流量和饱和流量决定;所述损失时间是指由于十字交叉口的相位转换及司机反映所耽误的时间,其由车辆进入狮子交叉口信号灯控制区域的四种不同情况确定,所述四种不同情况及其相应的车辆延误时间确定如下:The data fusion method of the urban traffic flow index includes: the data fusion of the cross intersection smoothness index, which is reflected by the weighted expected value of the average delay of vehicles in each direction; the data fusion of the arterial multi-intersection traffic flow index, which It is reflected by the average travel time delay of vehicles passing through each intersection of the arterial line; and, the data fusion of the smoothness index of multiple arterial lines and multi-intersections in the road network, which is reflected by the average travel time delay weighted expectation value of each arterial line in the road network area. The smoothness index of the intersection is determined by the average delay time of each phase vehicle in the intersection, and the average delay time of the vehicle includes: retention time and lost time, and the retention time refers to the queuing time at the intersection , which is calculated from the residence time determined by the vehicle saturation, which is determined by the period length of traffic lights, the green signal ratio, the traffic flow and the saturated flow; the lost time refers to the phase shift due to the intersection and the time delayed by the driver’s report, which is determined by four different situations when the vehicle enters the control area of the signal light at the Shishi intersection. The four different situations and their corresponding vehicle delay times are determined as follows:
情况1:车辆进入信号灯控制区域时,受控信号显示绿灯;当车辆到达停止线时,信号灯依然显示绿灯,车辆正常通过交叉口;此时车辆没有滞留时间和损失时间,所述车辆的延误时间为0;Situation 1: When the vehicle enters the signal light control area, the controlled signal displays a green light; when the vehicle reaches the stop line, the signal light still displays a green light, and the vehicle passes through the intersection normally; is 0;
情况2:车辆进入信号灯控制区域时,受控信号显示绿灯;当车辆到达停止线时,信号灯显示红灯,此时车辆无法正常通过交叉口;此时进入下一周期,滞留时间为此方向的红灯时间;当信号灯显示绿灯时,车辆起动,车辆有起动损失时间;此时所述车辆的延误时间为损失时间和滞留时间之和;Situation 2: When the vehicle enters the signal light control area, the controlled signal displays a green light; when the vehicle reaches the stop line, the signal light displays a red light, and the vehicle cannot pass through the intersection normally; at this time, it enters the next cycle, and the residence time is in this direction Red light time; when the signal light shows a green light, the vehicle starts, and the vehicle has a lost time for starting; at this time, the delay time of the vehicle is the sum of the lost time and the retention time;
情况3:车辆进入信号灯控制区域时,受控信号显示红灯;当车辆到达停止线时,信号灯显示绿灯,这时车辆正常通过。此时车辆的延误时间为前面车辆启动所引起的延误时间;Situation 3: When the vehicle enters the signal light control area, the controlled signal displays a red light; when the vehicle reaches the stop line, the signal light displays a green light, and the vehicle passes normally at this time. At this time, the delay time of the vehicle is the delay time caused by the start of the vehicle in front;
情况4:车辆进入信号灯控制区域时,受控信号显示红灯;当车辆到达停止线时,信号灯依然显示红灯,车辆将无法正常通过交叉口;滞留时间为绿灯开始时刻与车辆到达时刻之差,当信号灯指示绿灯时,车辆起动,车辆有起动损失时间;所述车辆的延误时间为损失时间和滞留时间之和。Situation 4: When the vehicle enters the signal light control area, the controlled signal displays a red light; when the vehicle reaches the stop line, the signal light still displays a red light, and the vehicle will not be able to pass through the intersection normally; the retention time is the difference between the start time of the green light and the arrival time of the vehicle , when the signal light indicates a green light, the vehicle starts, and the vehicle has a starting lost time; the delayed time of the vehicle is the sum of the lost time and the retention time.
通过对各相位车辆的平均延误时间进行求取加权期望值,对所述十字交叉口畅通性指标进行数据融合;从而监控和优化城市交通流控制。所述干线多交叉口畅通性指标由干线旅行时间和干线理想旅行时间确定。所述干线旅行时间指从车辆进入干线开始,中间经过干线所有交叉口到驶离干线所花费的时间,其通过对该干线路段平均行驶时间和十字交叉口畅通性指标确定;所述干线理想旅行时间由该干线的路段长度和自由行驶速度确定。By calculating the weighted expected value of the average delay time of vehicles in each phase, data fusion is performed on the smoothness index of the intersection; thereby monitoring and optimizing urban traffic flow control. The arterial multi-intersection accessibility index is determined by arterial travel time and arterial ideal travel time. The trunk line travel time refers to the time it takes for the vehicle to enter the trunk line, pass through all the intersections of the trunk line and leave the trunk line, which is determined by the average travel time of the trunk line section and the smoothness index of the intersection; the ideal travel time of the trunk line The time is determined by the segment length and free travel speed of the arterial line.
在干线多交叉口中,畅通性指标由车辆通过该干线各交叉口平均旅行时间延误来体现,该干线各交叉口平均旅行时间延误由两部分组成,一是指干线行使时间与干线理想行使时间之差的数学期望;二是车辆在各交叉口的平均延误时间。该干线多交叉口畅通性指标的数据融合步骤包括:In multi-arterial intersections, the smoothness index is reflected by the average travel time delay of vehicles passing through the intersections of the arterial line. The average travel time delay of each intersection of the arterial line is composed of two parts. The poor mathematical expectation; the second is the average delay time of vehicles at each intersection. The data fusion steps of the arterial multi-intersection accessibility index include:
步骤1:干线行使时间的估计Step 1: Estimation of Mainline Travel Time
干线行使时间指从车辆进入干线开始,中间经过干线所有交叉口到驶离干线所花费的时间。由以下融合步骤得到:The trunk line travel time refers to the time it takes for a vehicle to enter the trunk line, pass through all the intersections of the trunk line, and leave the trunk line. Obtained by the following fusion steps:
第一步:标定虚拟传感器Step 1: Calibrate the virtual sensor
交通状态获取系统中,传感器安置在交叉口i的出口道最前端和交叉口i+1的停止线处。设定传感器节点i为交叉口i出口道安置的传感器,传感器节点i+1为交叉口i+1停止线处安置的传感器。节点i与i+1之间的距离为di,平均行驶时间为t行i,定义传感器节点i与传感器节点i+1之间的虚拟传感器为mi=[di/100]个,分别标记为(i,1)、(i,2)...(i,mi)。In the traffic state acquisition system, the sensor is placed at the front end of the exit road of intersection i and at the stop line of intersection i+1. Set sensor node i as the sensor placed at the exit of intersection i, and sensor node i+1 as the sensor placed at the stop line of intersection i+1. The distance between node i and i+1 is di , the average travel time is tlinei , and the number of virtual sensors between sensor node i and sensor node i+1 is defined as mi =[di /100], respectively Labeled as (i,1), (i,2)...(i,mi).
第二步:获取虚拟传感器的速度Step 2: Get the speed of the virtual sensor
定义传感器节点i与虚拟传感器节点(i,1)之间的平均行驶时间为Δti1,平均速度为Δvi1;虚拟传感器节点(i,(k-1))与虚拟传感器节点(i,k)之间的平均行程时间为Δtik,平均速度为Δvik(k=2,3...m);虚拟传感器节点(i,m)与传感器节点i+1之间的平均行程时间为


其中,传感器节点i(i=1,2...n)的速度可以直接获取,虚拟传感器节点i,k的速度主要由传感器节点i的历史数据获得。设传感器采集数据的时间间隔为Δt,传感器i现在的时刻记为tiN,虚拟传感器节点(i,k)的速度为
从而得到交通状态参数的空间分布。Thus, the spatial distribution of traffic state parameters can be obtained.
第三步:得出干线行驶时间Step 3: Get the trunk travel time
若该区段上共有n个传感器节点,编号分别为1,2...n,该区段长度为

步骤2理想的行驶时间的估算Step 2 Estimation of Ideal Travel Time
理想的行使时间是指车辆按自由行驶速度通过干线所花费的行驶时间;自由行驶的速度根据历史数据的统计规律和干线的基础设施环境决定,表达式如下:The ideal travel time refers to the time it takes for a vehicle to pass through the trunk line at a free travel speed; the free travel speed is determined according to the statistical laws of historical data and the infrastructure environment of the trunk line, and the expression is as follows:

式中,t理表示理想的行使时间;li表示交叉口i与i+1之间的距离;vi表示车辆自由行驶通过交叉口i与i+1之间路段的平均速度;i表示某个交叉口;n表示干线交叉口的总数。In the formula,tli represents the ideal driving time; li represents the distance between intersection i and i+1; vi represents the average speed of vehicles freely driving through the section between intersection i and i+1; i represents a certain intersections; n represents the total number of arterial intersections.
步骤3干线多交叉口畅通性指标的数据融合Step 3 Data Fusion of Arterial Multi-intersection Accessibility Index
车辆在各交叉口的平均延误时间用十字交叉口的畅通性指标来表示,所以干线交叉口的畅通性指标的数据融合计算公式如下:The average delay time of vehicles at each intersection is represented by the smoothness index of the intersection, so the data fusion calculation formula of the smoothness index of the arterial intersection is as follows:

式中,CTl表示某干线的畅通性指标;t理表示车辆通过干线的理想行使时间;t行表示车辆通过干线的实际行使时间;dsl表示车辆在各交叉口的延误时间总和;CTis表示交叉口i的畅通性指标,该指标反映的是交叉口的车辆平均延误时间;n表示干线的交叉口总数;i表示某交叉口;t行i表示车辆在交叉口i与i+1之间路段的平均行驶时间;li表示交叉口i与i+1之间的距离;vi表示车辆自由行驶通过交叉口i与i+1之间路段的平均速度。所述路网多干线多交叉口畅通性指标由路网区域中各条干线的畅通性指标所计算的平均旅行时间延误来确定。路网多干线多交叉口畅通性指标的数据融合,其由路网区域中各个干线的车辆平均旅行时间延误加权期望值来实现。In the formula, CTl represents the smoothnessindex of a certain trunk line; t represents the ideal travel time of vehicles passing through the trunk line; t rowrepresents the actual travel time of vehicles passing through the trunk line; dsl represents the sum of the delay time of vehicles at each intersection;is represents the smoothness index of intersection i, which reflects the average delay time of vehicles at the intersection; n represents the total number of intersections on the arterial line; i represents a certain intersection; trowi represents vehicles at intersection i and i+ The average travel time of the road section between 1; li represents the distance between intersection i and i+1; vi represents the average speed of vehicles traveling freely through the road section between intersection i and i+1. The smoothness index of multi-arterial lines and multi-intersections in the road network is determined by the average travel time delay calculated from the smoothness index of each arterial line in the road network area. The data fusion of multi-arterial and multi-intersection smoothness indicators in the road network is realized by the average travel time delay weighted expectation of vehicles on each arterial in the road network area.
本发明的有益效果Beneficial effects of the present invention
畅通性是定量描述由于交通控制、交通流量的增加等外界因素而使自由行驶交通流旅行时间延长程度的指标;本发明方法通过对城市交通流畅通性指标的数据融合来实现面向交通多目标的优化控制,其基于城市交通的交通状态获取技术,通过获取交通参数,来进行交通流畅通性指标数据融合。本发明方法具有普适性、全面性和灵活性。Unimpededness is an index that quantitatively describes the degree of travel time extension of free-running traffic flow due to external factors such as traffic control and increase in traffic flow; Optimal control, which is based on the traffic state acquisition technology of urban traffic, performs traffic flow index data fusion by acquiring traffic parameters. The method of the invention has universality, comprehensiveness and flexibility.
附图说明Description of drawings
图1为根据本发明的十字交叉口畅通性指标的数据融合方法示意图;Fig. 1 is a schematic diagram of a data fusion method according to an intersection smoothness index of the present invention;
图2为根据本发明的干线多交叉口畅通性指标的数据融合方法示意图;Fig. 2 is the data fusion method schematic diagram according to the arterial multi-intersection unimpededness index of the present invention;
图3为根据本发明的路网多干线多交叉口畅通性指标的数据融合方法示意图;Fig. 3 is a schematic diagram of the data fusion method of the road network multi-trunk multi-intersection unimpededness index according to the present invention;
图4为实施例其中由于信号转换和车辆启动引起的损失时间示意图;Fig. 4 is a schematic diagram of lost time due to signal conversion and vehicle startup in an embodiment;
图5为实施例中单个十字交叉口的信号配时方案图;Fig. 5 is a signal timing plan diagram of a single intersection in the embodiment;
图6为实施例中传感器空间分布图;Fig. 6 is a spatial distribution diagram of sensors in the embodiment;
图7为旅行时间估算时速度的空间分布图。Fig. 7 is a diagram of the spatial distribution of velocity when travel time is estimated.
具体实施方式Detailed ways
下面结合附图和具体实施方式对本发明作进一步详细描述:Below in conjunction with accompanying drawing and specific embodiment the present invention is described in further detail:
实施例1:十字交叉口畅通性指标的数据融合方法,如图1所示的为根据本发明的十字交叉口畅通性指标的数据融合方法示意图,十字交叉口畅通性指标由十字交叉口中各相位车辆的平均延误时间来确定。车辆的平均延误时间包括:滞留时间和损失时间,其中,滞留时间是指十字交叉口的排队等待时间,其由车辆饱和度所决定的滞留时间计算而得,所述饱和度由交通信号灯的周期长、绿信比、车流量和饱和流量决定;损失时间是指由于十字交叉口的相位转换及司机反映所耽误的时间,其由车辆进入狮子交叉口信号灯控制区域的四种不同情况确定。Embodiment 1: the data fusion method of crossing smoothness index, as shown in Figure 1 is the schematic diagram of the data fusion method according to crossing crossing smoothness index of the present invention, crossing crossing smoothness index is formed by each phase in crossing The average delay time of vehicles is determined. The average delay time of a vehicle includes: dwell time and lost time, where the dwell time refers to the queuing waiting time at an intersection, which is calculated from the dwell time determined by the vehicle saturation, which is determined by the cycle of traffic lights It is determined by the length, green signal ratio, traffic flow and saturated flow; the lost time refers to the time delayed due to the phase conversion of the intersection and the driver's reflection, which is determined by four different situations when the vehicle enters the control area of the signal light at the lion intersection.
四种不同情况及其相应的车辆延误时间确定如下:Four different scenarios and their corresponding vehicle delay times are determined as follows:
情况1:车辆进入信号灯控制区域时,受控信号显示绿灯;当车辆到达停止线时,信号灯依然显示绿灯,车辆正常通过交叉口;此时车辆没有滞留时间和损失时间,所述车辆的延误时间为0;Situation 1: When the vehicle enters the signal light control area, the controlled signal displays a green light; when the vehicle reaches the stop line, the signal light still displays a green light, and the vehicle passes through the intersection normally; is 0;
情况2:车辆进入信号灯控制区域时,受控信号显示绿灯;当车辆到达停止线时,信号灯显示红灯,此时车辆无法正常通过交叉口;此时进入下一周期,滞留时间为此方向的红灯时间;当信号灯显示绿灯时,车辆起动,车辆有起动损失时间;此时所述车辆的延误时间为损失时间和滞留时间之和;Situation 2: When the vehicle enters the signal light control area, the controlled signal displays a green light; when the vehicle reaches the stop line, the signal light displays a red light, and the vehicle cannot pass through the intersection normally; at this time, it enters the next cycle, and the residence time is in this direction Red light time; when the signal light shows a green light, the vehicle starts, and the vehicle has a lost time for starting; at this time, the delay time of the vehicle is the sum of the lost time and the retention time;
情况3:车辆进入信号灯控制区域时,受控信号显示红灯;当车辆到达停止线时,信号灯显示绿灯,这时车辆正常通过。此时车辆的延误时间为前面车辆启动所引起的延误时间;Situation 3: When the vehicle enters the signal light control area, the controlled signal displays a red light; when the vehicle reaches the stop line, the signal light displays a green light, and the vehicle passes normally at this time. At this time, the delay time of the vehicle is the delay time caused by the start of the vehicle in front;
情况4:车辆进入信号灯控制区域时,受控信号显示红灯;当车辆到达停止线时,信号灯依然显示红灯,车辆将无法正常通过交叉口;滞留时间为绿灯开始时刻与车辆到达时刻之差,当信号灯指示绿灯时,车辆起动,车辆有起动损失时间;所述车辆的延误时间为损失时间和滞留时间之和。Situation 4: When the vehicle enters the signal light control area, the controlled signal displays a red light; when the vehicle reaches the stop line, the signal light still displays a red light, and the vehicle will not be able to pass through the intersection normally; the retention time is the difference between the start time of the green light and the arrival time of the vehicle , when the signal light indicates a green light, the vehicle starts, and the vehicle has a starting lost time; the delayed time of the vehicle is the sum of the lost time and the retention time.
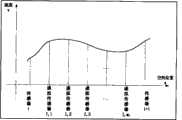
在本实施例中,损失时间是通过分析车辆在交叉口的运行速度曲线来估算的。如图4所示,当信号由红灯转变为绿灯的时候,车辆行驶速度由0开始加速直至正常行驶速度v,这段时间车辆的平均速度小于v,这样会引起一定的时间损失,称为前损失时间。当信号指示由绿灯转变成黄灯的时候,车速由正常行驶速度v减速为0,这段时间损失称为后损失时间。In this embodiment, the lost time is estimated by analyzing the speed profile of the vehicle at the intersection. As shown in Figure 4, when the signal changes from red light to green light, the vehicle speed starts to accelerate from 0 to the normal speed v, and the average speed of the vehicle during this period is less than v, which will cause a certain time loss, called Lost time before. When the signal indicator changes from green light to yellow light, the speed of the vehicle decelerates from the normal driving speed v to 0, and the time lost during this period is called post-loss time.
因此,由于信号转换和车辆启动引起的延误时间等于前损失时间加上后损失时间。在实际过程中,此损失时间变化范围不大,我们将此损失时间设定为定值3s。Therefore, the delay time due to signal transition and vehicle start is equal to the front lost time plus the back lost time. In the actual process, the variation range of this loss time is not large, and we set this loss time as a fixed value of 3s.
在本实施例中,滞留时间通过引用经典的滞留时间计算公式确定。当饱和度小于0.9时,采用WebSter计算公式,当饱和度大于0.9时采用Akcelik计算公式。In this embodiment, the residence time is determined by citing the classic calculation formula of residence time. When the saturation is less than 0.9, use the WebSter calculation formula, and when the saturation is greater than 0.9, use the Akcelik calculation formula.
Webster在“Signal Control Settings”(F.V.Webster.″Signal Controlsetting″.Technical Paper 39,Road Search Laboratory,1958.)中指出滞留时间由信号周期时长,绿信比,车流量,饱和流量大小,饱和度共同确定,其计算公式如下:Webster pointed out in "Signal Control Settings" (F.V.Webster. "Signal Controlsetting". Technical Paper 39, Road Search Laboratory, 1958.) that the residence time is composed of signal period length, green signal ratio, traffic flow, saturation flow, and saturation. OK, the calculation formula is as follows:
式中,t为车辆滞留时间;C为十字交叉口信号周期时长;λ为十字交叉口绿信比,即有效绿灯时间与信号周期时长C的比率;q为进口车道车流量;x为饱和度,观测最大流量与信号交叉口进口道的通行能力之比,有
上式第1项是均匀车辆到达率(即车辆以均匀分布规律进入交叉口)所产生的延误时间,第2项是是根据车辆随机到达服从泊松分布,利用M/D/1模型计算出来的车辆的随机性延误,第3项是从车流模拟试验得到。本实施例采用简化后的Webster模型,其表示如下:The first item of the above formula is the delay time caused by the uniform vehicle arrival rate (that is, the vehicle enters the intersection with a uniform distribution law), and the second item is calculated by using the M/D/1 model based on the random arrival of vehicles obeying the Poisson distribution The random delay of vehicles, the third item is obtained from the traffic flow simulation test. This embodiment adopts the simplified Webster model, which is expressed as follows:
该模型虽然应用广泛,但是其局限性也很明显,当饱和度较大,逐渐趋向于1.0时,按照该公式计算出来的结果将明显偏大。Although this model is widely used, its limitations are also obvious. When the saturation is large and gradually tends to 1.0, the result calculated according to this formula will be obviously too large.
而瞬态延误模型可以用来计算进口车道饱和度大于0.9的滞留时间。本实施例采用瞬态延误Akcelik模型,以解决如何减少由于饱和度过大而造成延误明显偏大的问题。首先采用非饱和流与饱和流之间的过渡函数延误模型。The transient delay model can be used to calculate the dwell time of the entrance lane saturation greater than 0.9. This embodiment adopts the transient delay Akcelik model to solve the problem of how to reduce the delay caused by excessive saturation. Firstly, the transition function delay model between unsaturated flow and saturated flow is adopted.
式中大括号内为均衡相位延误(分为饱和与非饱和两种情况),C为十字交叉口信号周期时长,g为该进口车道所在相位分配的绿灯时间;随机延误和过饱和延误是在Q0中计算的。饱和度较大时,它弥补了以往被忽视的随机延误。Q0为(0,T)时间段内平均饱和排队长度的过渡函数,其计算公式为The curly brackets in the formula represent the balanced phase delay (divided into saturated and non-saturated conditions), C is the signal cycle length of the intersection, and g is the green light time allocated for the phase of the entrance lane; the random delay and the oversaturation delay are in Calculated in Q0 . When the saturation is high, it makes up for random delays that were previously overlooked. Q0 is the transition function of the average saturated queue length in the (0, T) time period, and its calculation formula is
式中:x0为进口车道的饱和流量(辆/s);N为该车道的通行能力(辆/s);T为观察时段的长度(S)。In the formula: x0 is the saturated flow of the entrance lane (vehicles/s); N is the traffic capacity of the lane (vehicles/s); T is the length of the observation period (S).
根据饱和度的大小选择对应的模型,定义相位为一组享用共同绿灯时间的进口车道方位集合(1,2,...,i),则相位i的进口车道平均饱和度xi计算公式如下:Select the corresponding model according to the size of the saturation, define the phase as a set of orientations (1, 2, ..., i) of the entrance lanes sharing the common green light time, then the calculation formula of the average saturation xi of the entrance lane of phase i is as follows :
式中,k表示该相位i的车道数;xij表示相位i的第j进口车道的饱和度;设定η为延误时间模型选择因子,选择规则定义为:当相位i的车道平均饱和度≤0.9时η为1,否则η为0;数学表达式为:In the formula, k represents the number of lanes of the phase i; xij represents the saturation of the jth entrance lane of the phase i; η is set as the delay time model selection factor, and the selection rule is defined as: when the average saturation of the lane of the phase i ≤ When 0.9, η is 1, otherwise η is 0; the mathematical expression is:
可以计算进口车道上车辆的延误时间,即The delay time of vehicles on the entrance lane can be calculated as
Tij=ηtij+(1-η)t′ij+lijTij = ηtij + (1-η)t'ij + lij
式中:tij为第i相位的第j车道依据Webster延迟模型计算得各进口道的车辆延误之和(s);tij′为第i相位的第j车道依据瞬态延误Akcelik模型计算得各进口道的车辆延误之和(s);lij为第i相位的第j车道由于信号转换和车辆启动引起的损失时间。In the formula: tij is the sum (s) of vehicle delays at the entrances of the jth lane of the i-th phase calculated according to the Webster delay model; tij ' is the jth lane of the i-th phase calculated according to the transient delay Akcelik model The sum of vehicle delays at each entrance lane (s); lij is the lost time of the jth lane of the ith phase due to signal conversion and vehicle start.
至此,十字交叉口各相位车辆的平均延误时间为So far, the average delay time of vehicles in each phase at the intersection is
式中,ki表示相位i的车道总数,η为延误时间模型选择因子,qij为相位i第j进口车道上的车流量,其他字符含义如上述所指。In the formula,ki represents the total number of lanes in phase i, η is the delay time model selection factor, qij is the traffic flow on the jth entrance lane of phase i, and the meanings of other characters are as mentioned above.
根据十字交叉口各相位车辆的凭据延误时间,求各相位车辆的平均延误时间的加权期望值,从而实现对十字交叉口畅通性指标进行数据融合。具体地,畅通性指标的数据融合计算公式为According to the credential delay time of vehicles in each phase of the intersection, the weighted expected value of the average delay time of vehicles in each phase is calculated, so as to realize the data fusion of the smoothness index of the intersection. Specifically, the data fusion calculation formula of the smoothness index is
式中,CT表示某个交叉口的畅通性指标,M表示该交叉口的相位总数,αi表示第i相位的重要权重,该值越大表示该相位越优先安排,通过该指标可以有选择地对某交叉口相位进行优化。In the formula, CT represents the smoothness index of a certain intersection, M represents the total number of phases at the intersection, αi represents the important weight of the i-th phase, and the larger the value, the more priority the phase is arranged. Through this index, there is a choice To optimize the phase of an intersection.
在本实施例中,以某轮放式相位十字交叉口为例,统计其早高峰(7:00-9:00)、晚高峰(5:00-7:00)连续三天的流量数据,作平均值处理,得到该交叉口各方向的车流量,如表1所示表1实例单交叉口的基础数据表。In this embodiment, taking a wheeled phase intersection as an example, the traffic data of the morning peak (7:00-9:00) and evening peak (5:00-7:00) for three consecutive days are counted, Do average value processing to obtain the traffic flow in each direction of the intersection, as shown in Table 1. The basic data table of the single intersection in the example of Table 1.
表1交叉口各方向车流量表Table 1 Traffic flow meter in each direction at the intersection
同时可以观测出该交叉口的信号配时方案,如图5所示。At the same time, the signal timing scheme of the intersection can be observed, as shown in Figure 5.
根据交叉口各相位车辆平均延误计算公式,可以计算各相位的车辆平均延误,如表2所示的实例单交叉口的延误计算结果表。According to the calculation formula of the average vehicle delay of each phase of the intersection, the average vehicle delay of each phase can be calculated, as shown in Table 2, the delay calculation result table of the example single intersection.
表2各相位平均车辆延误表Table 2 Average vehicle delay table for each phase

至此,根据交叉口畅通性指标计算公式,可以得到该交叉口的畅通性指标,为了简化计算,假设各相位的权重相同,结果如下:So far, according to the calculation formula of the intersection smoothness index, the smoothness index of the intersection can be obtained. In order to simplify the calculation, it is assumed that the weights of each phase are the same, and the results are as follows:
实施例2干线多交叉口畅通性指标的融合方法Embodiment 2 The Fusion Method of the Unimpededness Index at Multiple Intersections on Arterial Lines
如图2所示的根据本发明的干线多交叉口畅通性指标的数据融合方法示意图。在干线多交叉口中,畅通性指标由车辆通过该干线各交叉口平均旅行时间延误来体现,该干线各交叉口平均旅行时间延误由两部分组成,一是指估算的行使时间与理想的行使时间的差额;二是车辆在各交叉口的平均延误时间。其中,各项畅通性指标的数据融合步骤包括:As shown in FIG. 2 , a schematic diagram of the data fusion method for the flowability index of multiple arterial intersections according to the present invention. In multi-arterial intersections, the smoothness index is reflected by the average travel time delay of vehicles passing through the intersections of the arterial line. The average travel time delay of each intersection of the arterial line is composed of two parts, one is the estimated travel time and the ideal travel time The difference; the second is the average delay time of vehicles at each intersection. Among them, the data fusion steps of each smoothness index include:
步骤1:干线行使时间的估计Step 1: Estimation of Mainline Travel Time
干线行使时间指从车辆进入干线开始,中间经过干线所有交叉口到驶离干线所花费的时间。结合图6和图7,由以下融合步骤得到干线行驶时间的估计:The trunk line travel time refers to the time it takes for a vehicle to enter the trunk line, pass through all the intersections of the trunk line, and leave the trunk line. Combining Figure 6 and Figure 7, the estimated travel time of the trunk line is obtained by the following fusion steps:
第一步:标定虚拟传感器Step 1: Calibrate the virtual sensor
交通状态获取系统中,传感器安置在交叉口i的出口道最前端和交叉口i+1的停止线处。设定传感器节点i为交叉口i出口道安置的传感器,传感器节点i+1为交叉口i+1停止线处安置的传感器。节点i与i+1之间的距离为di,平均行驶时间为t行i,定义传感器节点i与传感器节点i+1之间的虚拟传感器为mi=[di/100]个,分别标记为(i,1)、(i,2)...(i,mi)。In the traffic state acquisition system, the sensor is placed at the front end of the exit road of intersection i and at the stop line of intersection i+1. Set sensor node i as the sensor placed at the exit of intersection i, and sensor node i+1 as the sensor placed at the stop line of intersection i+1. The distance between node i and i+1 is di , the average travel time is tlinei , and the number of virtual sensors between sensor node i and sensor node i+1 is defined as mi =[di /100], respectively Labeled as (i,1), (i,2)...(i,mi).
第二步:获取虚拟传感器的速度Step 2: Get the speed of the virtual sensor
定义传感器节点i与虚拟传感器节点(i,1)之间的平均行驶时间为Δti1,平均速度为Δvi1;虚拟传感器节点(i,(k-1))与虚拟传感器节点(i,k)之间的平均行程时间为 Δtik,平均速度为Δvik(k=2,3...m);虚拟传感器节点(i,m)与传感器节点i+1之间的平均行程时间为平均速度为


其中,传感器节点i(i=1,2...n)的速度可以直接获取,虚拟传感器节点i,k的速度主要由传感器节点i的历史数据获得。设传感器采集数据的时间间隔为Δt,传感器i现在的时刻记为tiN,虚拟传感器节点(i,k)的速度为
从而得到交通状态参数的空间分布。Thus, the spatial distribution of traffic state parameters can be obtained.
第三步:得出干线行驶时间Step 3: Get the trunk travel time
若该区段上共有n个传感器节点,编号分别为1,2...n,该区段长度为

步骤2理想的行驶时间的估算Step 2 Estimation of Ideal Travel Time
理想的行使时间是指车辆按自由行驶速度通过干线所花费的行驶时间;自由行驶的速度根据历史数据的统计规律和干线的基础设施环境决定,表达式如下:The ideal travel time refers to the time it takes for a vehicle to pass through the trunk line at a free travel speed; the free travel speed is determined according to the statistical laws of historical data and the infrastructure environment of the trunk line, and the expression is as follows:

式中,t理表示理想的行使时间;li表示交叉口i与i+1之间的距离;vi表示车辆自由行驶通过交叉口i与i+1之间路段的平均速度;i表示某个交叉口;n表示干线交叉口的总数。In the formula,tli represents the ideal driving time; li represents the distance between intersection i and i+1; vi represents the average speed of vehicles freely driving through the section between intersection i and i+1; i represents a certain intersections; n represents the total number of arterial intersections.
步骤3干线多交叉口畅通性指标的数据融合Step 3 Data Fusion of Arterial Multi-intersection Accessibility Index
车辆在各交叉口的平均延误时间用交叉口的畅通性指标来表示,所以干线交叉口的畅通性指标的数据融合计算公式如下:The average delay time of vehicles at each intersection is represented by the smoothness index of the intersection, so the data fusion calculation formula of the smoothness index of the arterial intersection is as follows:
式中,CTl表示某干线的畅通性指标;t理表示车辆通过干线的理想行使时间;t行表示车辆通过干线的实际行使时间;dsl表示车辆在各交叉口的延误时间总和;CTis表示交叉口i的畅通性指标,该指标反映的是交叉口的车辆平均延误时间;n表示干线的交叉口总数;i表示某交叉口;t行i表示车辆在交叉口i与i+1之间路段的平均行驶时间;li表示交叉口i与i+1之间的距离;vi表示车辆自由行驶通过交叉口i与i+1之间路段的平均速度。In the formula, CTl represents the smoothnessindex of a certain trunk line; t represents the ideal travel time of vehicles passing through the trunk line; t rowrepresents the actual travel time of vehicles passing through the trunk line; dsl represents the sum of the delay time of vehicles at each intersection;is represents the smoothness index of intersection i, which reflects the average delay time of vehicles at the intersection; n represents the total number of intersections on the arterial line; i represents a certain intersection; trowi represents vehicles at intersection i and i+ The average travel time of the road section between 1; li represents the distance between intersection i and i+1; vi represents the average speed of vehicles traveling freely through the road section between intersection i and i+1.
实施例3路网多干线多交叉口畅通性指标的数据融合方法,如图3所示,路网多干线多交叉口畅通性指标由区域中若干干线的平均旅行时间延误加权期望值来体现。与单点控制交叉口畅通性指标的思路一样,加权期望也是一种改进,考虑了主次干道的关系,即主要干道分配的权重大而次要干道相对小。Embodiment 3 The data fusion method of the smoothness index of multi-trunk and multi-intersection in the road network, as shown in Figure 3, the smoothness index of the multi-trunk and multi-intersection of the road network is reflected by the average travel time delay weighted expected value of several trunk lines in the area. Similar to the idea of single-point control intersection smoothness index, weighted expectation is also an improvement, considering the relationship between primary and secondary arterial roads, that is, the weight assigned to major arterial roads is relatively large while the weight of secondary arterial roads is relatively small.
以一个包含4个干线的交通网络为例,左侧的北向南干线用LNS表示,右侧北向南干线用RNS表示,下方的西向东干线用DWE表示,上方的西向东干线用UWE表示,交叉口的相位集合为B={1,2,3,4},分别指西向东、南向北、东向西和北向南方向。Taking a traffic network with four main lines as an example, the north-to-south main line on the left is represented by LNS, the north-to-south main line on the right is represented by RNS, the west-to-east main line below is represented by DWE, the west-east main line above is represented by UWE, and the cross The phase set of mouth is B={1, 2, 3, 4}, respectively referring to the directions of west to east, south to north, east to west and north to south.
在区域多交叉口中,畅通性指标由区域中若干干线的平均旅行时间延误加权期望值来计算。有:In an area with multiple intersections, the accessibility index is calculated from the average travel time delay-weighted expected value of several arterials in the area. have:
其中,w1′是干线LNS权重值,CTLNSl是干线LNS的畅通性指标值,其它参数含义以此类推。Among them, w1' is the weight value of the main line LNS, CTLNSl is the smoothness index value of the main line LNS, and the meanings of other parameters can be deduced by analogy.
Claims (9)
Translated fromChinese


Priority Applications (1)
| Application Number | Priority Date | Filing Date | Title |
|---|---|---|---|
| CN200910211192XACN101702262B (en) | 2009-11-06 | 2009-11-06 | Data syncretizing method for urban traffic circulation indexes |
Applications Claiming Priority (1)
| Application Number | Priority Date | Filing Date | Title |
|---|---|---|---|
| CN200910211192XACN101702262B (en) | 2009-11-06 | 2009-11-06 | Data syncretizing method for urban traffic circulation indexes |
Publications (2)
| Publication Number | Publication Date |
|---|---|
| CN101702262Atrue CN101702262A (en) | 2010-05-05 |
| CN101702262B CN101702262B (en) | 2011-08-17 |
Family
ID=42157175
Family Applications (1)
| Application Number | Title | Priority Date | Filing Date |
|---|---|---|---|
| CN200910211192XAExpired - Fee RelatedCN101702262B (en) | 2009-11-06 | 2009-11-06 | Data syncretizing method for urban traffic circulation indexes |
Country Status (1)
| Country | Link |
|---|---|
| CN (1) | CN101702262B (en) |
Cited By (31)
| Publication number | Priority date | Publication date | Assignee | Title |
|---|---|---|---|---|
| CN102169627A (en)* | 2011-01-30 | 2011-08-31 | 北京交通大学 | Express way travel time prediction method based on virtual speed sensor |
| CN102426791A (en)* | 2011-09-13 | 2012-04-25 | 华南理工大学 | Method for weighting, regulation and transition of coordination time matching scheme of traffic signals in N cycles |
| CN102509456A (en)* | 2011-11-21 | 2012-06-20 | 青岛海信网络科技股份有限公司 | Saturation flow determination method and device |
| CN102687181A (en)* | 2010-06-17 | 2012-09-19 | 丰田自动车株式会社 | Signal cycle estimation apparatus and signal cycle estimation method |
| CN102915637A (en)* | 2012-08-01 | 2013-02-06 | 浙江浙大中控信息技术有限公司 | Method and system for traffic state evaluation at signal control crossing |
| CN103310640A (en)* | 2013-05-28 | 2013-09-18 | 哈尔滨工业大学 | Motor vehicle stream-oriented intersection traffic pre-signal control method |
| CN103700273A (en)* | 2014-01-06 | 2014-04-02 | 东南大学 | Signal timing optimization method based on variable guide lane |
| CN104200648A (en)* | 2014-08-21 | 2014-12-10 | 四川大学 | Road section average travelling time calculation method based on electronic license plate |
| CN104318791A (en)* | 2014-10-20 | 2015-01-28 | 安徽师范大学 | Multiple-intersection traffic flow self-adaptive coordination control method |
| CN105225477A (en)* | 2014-07-06 | 2016-01-06 | 临安巨丰城市配套设备有限公司 | A kind of road traffic detection system based on inspection well cover and method |
| CN105809981A (en)* | 2016-05-26 | 2016-07-27 | 陕西理工学院 | Single-intersection signal light control method based on instantaneous stop delay |
| CN105828505A (en)* | 2016-05-20 | 2016-08-03 | 厦门市智联信通物联网科技有限公司 | Sensor network management system and sensor network management method for lighting terminal data equalization |
| CN106205129A (en)* | 2016-08-17 | 2016-12-07 | 广州市市政工程设计研究总院 | Crossing based on stochastic traffic demand and traffic capacity Controlled drug-release Forecasting Methodology |
| CN106683468A (en)* | 2017-01-11 | 2017-05-17 | 深圳大图科创技术开发有限公司 | Optimal vehicle speed intelligent recommending equipment based on real-time traffic data |
| CN106781504A (en)* | 2017-01-23 | 2017-05-31 | 东南大学 | A kind of main line parking analysis method based on Floating Car gps data |
| CN106781499A (en)* | 2017-01-11 | 2017-05-31 | 深圳大图科创技术开发有限公司 | A kind of transportation network efficiency rating system |
| CN106781500A (en)* | 2017-01-11 | 2017-05-31 | 深圳万智联合科技有限公司 | A kind of vehicle intelligent speech recognition system |
| CN106997668A (en)* | 2017-04-18 | 2017-08-01 | 北京博研智通科技有限公司 | The method and system of intersection annunciator control efficiency is evaluated using mobile phone mobile data |
| CN107025789A (en)* | 2017-05-27 | 2017-08-08 | 青岛海信网络科技股份有限公司 | A kind of traffic incidents detection method and device |
| CN107644102A (en)* | 2017-10-13 | 2018-01-30 | 北京京东尚科信息技术有限公司 | Data characteristics building method and device, storage medium, electronic equipment |
| CN107665582A (en)* | 2017-11-20 | 2018-02-06 | 中兴软创科技股份有限公司 | A kind of level of service evaluation method based on multi-source data |
| CN107945511A (en)* | 2017-11-20 | 2018-04-20 | 中兴软创科技股份有限公司 | A kind of computational methods of intersection delay time |
| CN108226915A (en)* | 2017-12-25 | 2018-06-29 | 中国人民解放军63921部队 | A kind of quantitatively characterizing space multiple target spatial distribution method |
| CN108428338A (en)* | 2017-02-15 | 2018-08-21 | 阿里巴巴集团控股有限公司 | Traffic analysis method, device and electronic equipment |
| CN108764510A (en)* | 2018-03-26 | 2018-11-06 | 北京城建设计发展集团股份有限公司 | Urban track traffic parallel artificial tasks decomposition method towards large-scale road network |
| CN110634308A (en)* | 2019-09-26 | 2019-12-31 | 同济大学 | A Single Intersection Signal Control Method Based on Vehicle Queuing Dissipation Time |
| CN112740292A (en)* | 2018-10-05 | 2021-04-30 | 住友电工系统解决株式会社 | Traffic index calculation device, calculation method, traffic signal control system, and computer program |
| CN113936454A (en)* | 2021-09-22 | 2022-01-14 | 上海宝康电子控制工程有限公司 | Information processing method and system based on track fusion |
| WO2022021475A1 (en)* | 2020-07-31 | 2022-02-03 | 爱易成技术(天津)有限公司 | Implementation method and system for road traffic reservation passage, and electronic device |
| CN115410375A (en)* | 2022-11-02 | 2022-11-29 | 华路易云科技有限公司 | Fusion traffic index set generation method based on fusion traffic data of thunder card |
| CN116844350A (en)* | 2023-07-28 | 2023-10-03 | 哈尔滨工业大学 | A dynamic optimization method for signal control that takes into account accident risk and traffic efficiency |
Family Cites Families (2)
| Publication number | Priority date | Publication date | Assignee | Title |
|---|---|---|---|---|
| CN101373559B (en)* | 2007-08-24 | 2010-08-18 | 同济大学 | Method for evaluating city road net traffic state based on floating vehicle data |
| CN101572004A (en)* | 2008-04-30 | 2009-11-04 | 奥城同立科技开发(北京)有限公司 | System for controlling intersection traffic and leading current direction |
- 2009
- 2009-11-06CNCN200910211192XApatent/CN101702262B/ennot_activeExpired - Fee Related
Cited By (50)
| Publication number | Priority date | Publication date | Assignee | Title |
|---|---|---|---|---|
| US8725397B2 (en) | 2010-06-17 | 2014-05-13 | Toyota Jidosha Kabushiki Kaisha | Traffic signal cycle estimation device and traffic signal cycle estimation method |
| CN102687181A (en)* | 2010-06-17 | 2012-09-19 | 丰田自动车株式会社 | Signal cycle estimation apparatus and signal cycle estimation method |
| CN102687181B (en)* | 2010-06-17 | 2015-01-07 | 丰田自动车株式会社 | Signal cycle inference device and signal cycle inference method |
| CN102169627A (en)* | 2011-01-30 | 2011-08-31 | 北京交通大学 | Express way travel time prediction method based on virtual speed sensor |
| CN102426791A (en)* | 2011-09-13 | 2012-04-25 | 华南理工大学 | Method for weighting, regulation and transition of coordination time matching scheme of traffic signals in N cycles |
| CN102426791B (en)* | 2011-09-13 | 2013-08-07 | 华南理工大学 | Method for weighting, regulation and transition of coordination time matching scheme of traffic signals in N cycles |
| CN102509456A (en)* | 2011-11-21 | 2012-06-20 | 青岛海信网络科技股份有限公司 | Saturation flow determination method and device |
| CN102915637B (en)* | 2012-08-01 | 2014-08-20 | 浙江浙大中控信息技术有限公司 | Method and system for traffic state evaluation at signal control crossing |
| CN102915637A (en)* | 2012-08-01 | 2013-02-06 | 浙江浙大中控信息技术有限公司 | Method and system for traffic state evaluation at signal control crossing |
| CN103310640A (en)* | 2013-05-28 | 2013-09-18 | 哈尔滨工业大学 | Motor vehicle stream-oriented intersection traffic pre-signal control method |
| CN103700273A (en)* | 2014-01-06 | 2014-04-02 | 东南大学 | Signal timing optimization method based on variable guide lane |
| CN105225477A (en)* | 2014-07-06 | 2016-01-06 | 临安巨丰城市配套设备有限公司 | A kind of road traffic detection system based on inspection well cover and method |
| CN105225477B (en)* | 2014-07-06 | 2017-07-28 | 临安巨丰城市配套设备有限公司 | A kind of road traffic detection method based on inspection well cover |
| CN104200648A (en)* | 2014-08-21 | 2014-12-10 | 四川大学 | Road section average travelling time calculation method based on electronic license plate |
| CN104200648B (en)* | 2014-08-21 | 2016-02-03 | 四川大学 | A kind of road-section average computing method hourage based on electronic license plate |
| CN104318791A (en)* | 2014-10-20 | 2015-01-28 | 安徽师范大学 | Multiple-intersection traffic flow self-adaptive coordination control method |
| CN105828505A (en)* | 2016-05-20 | 2016-08-03 | 厦门市智联信通物联网科技有限公司 | Sensor network management system and sensor network management method for lighting terminal data equalization |
| CN105809981A (en)* | 2016-05-26 | 2016-07-27 | 陕西理工学院 | Single-intersection signal light control method based on instantaneous stop delay |
| CN106205129A (en)* | 2016-08-17 | 2016-12-07 | 广州市市政工程设计研究总院 | Crossing based on stochastic traffic demand and traffic capacity Controlled drug-release Forecasting Methodology |
| CN106205129B (en)* | 2016-08-17 | 2018-06-19 | 广州市市政工程设计研究总院 | Intersection Controlled drug-release Forecasting Methodology based on stochastic traffic demand and the traffic capacity |
| CN106781499B (en)* | 2017-01-11 | 2020-04-28 | 南京理工大学 | A Traffic Network Efficiency Evaluation System |
| CN106781500A (en)* | 2017-01-11 | 2017-05-31 | 深圳万智联合科技有限公司 | A kind of vehicle intelligent speech recognition system |
| CN106781499A (en)* | 2017-01-11 | 2017-05-31 | 深圳大图科创技术开发有限公司 | A kind of transportation network efficiency rating system |
| CN106683468A (en)* | 2017-01-11 | 2017-05-17 | 深圳大图科创技术开发有限公司 | Optimal vehicle speed intelligent recommending equipment based on real-time traffic data |
| CN106781500B (en)* | 2017-01-11 | 2020-01-07 | 深圳市鑫玉锋科技有限公司 | Vehicle-mounted intelligent voice recognition system |
| CN106683468B (en)* | 2017-01-11 | 2019-09-17 | 上海工业控制安全创新科技有限公司 | A kind of optimal speed intelligent recommendation apparatus based on real-time road big data |
| CN106781504A (en)* | 2017-01-23 | 2017-05-31 | 东南大学 | A kind of main line parking analysis method based on Floating Car gps data |
| CN106781504B (en)* | 2017-01-23 | 2019-03-12 | 东南大学 | A kind of main line parking analysis method based on Floating Car GPS data |
| US12014629B2 (en) | 2017-02-15 | 2024-06-18 | Alibaba Group Holding Limited | Road traffic analysis methods and apparatuses |
| US11380195B2 (en) | 2017-02-15 | 2022-07-05 | Alibaba Group Holding Limited | Road traffic analysis methods and apparatuses |
| CN108428338A (en)* | 2017-02-15 | 2018-08-21 | 阿里巴巴集团控股有限公司 | Traffic analysis method, device and electronic equipment |
| CN106997668A (en)* | 2017-04-18 | 2017-08-01 | 北京博研智通科技有限公司 | The method and system of intersection annunciator control efficiency is evaluated using mobile phone mobile data |
| CN107025789A (en)* | 2017-05-27 | 2017-08-08 | 青岛海信网络科技股份有限公司 | A kind of traffic incidents detection method and device |
| CN107644102B (en)* | 2017-10-13 | 2020-11-03 | 北京京东尚科信息技术有限公司 | Data feature construction method and device, storage medium and electronic equipment |
| CN107644102A (en)* | 2017-10-13 | 2018-01-30 | 北京京东尚科信息技术有限公司 | Data characteristics building method and device, storage medium, electronic equipment |
| CN107665582A (en)* | 2017-11-20 | 2018-02-06 | 中兴软创科技股份有限公司 | A kind of level of service evaluation method based on multi-source data |
| CN107945511A (en)* | 2017-11-20 | 2018-04-20 | 中兴软创科技股份有限公司 | A kind of computational methods of intersection delay time |
| CN108226915B (en)* | 2017-12-25 | 2021-07-30 | 中国人民解放军63921部队 | Quantitative representation space multi-target spatial distribution method |
| CN108226915A (en)* | 2017-12-25 | 2018-06-29 | 中国人民解放军63921部队 | A kind of quantitatively characterizing space multiple target spatial distribution method |
| CN108764510A (en)* | 2018-03-26 | 2018-11-06 | 北京城建设计发展集团股份有限公司 | Urban track traffic parallel artificial tasks decomposition method towards large-scale road network |
| CN108764510B (en)* | 2018-03-26 | 2021-08-27 | 北京城建设计发展集团股份有限公司 | Urban rail transit parallel simulation task decomposition method facing large-scale road network |
| CN112740292A (en)* | 2018-10-05 | 2021-04-30 | 住友电工系统解决株式会社 | Traffic index calculation device, calculation method, traffic signal control system, and computer program |
| CN110634308B (en)* | 2019-09-26 | 2021-09-03 | 同济大学 | Single-intersection signal control method based on vehicle queuing dissipation time |
| CN110634308A (en)* | 2019-09-26 | 2019-12-31 | 同济大学 | A Single Intersection Signal Control Method Based on Vehicle Queuing Dissipation Time |
| WO2022021475A1 (en)* | 2020-07-31 | 2022-02-03 | 爱易成技术(天津)有限公司 | Implementation method and system for road traffic reservation passage, and electronic device |
| US12236783B2 (en) | 2020-07-31 | 2025-02-25 | Ie-Cheng Technology (Tianjin) Co., Ltd. | Implementation method and system for road traffic reservation passage, and electronic device |
| CN113936454A (en)* | 2021-09-22 | 2022-01-14 | 上海宝康电子控制工程有限公司 | Information processing method and system based on track fusion |
| CN113936454B (en)* | 2021-09-22 | 2023-02-21 | 上海宝康电子控制工程有限公司 | Information processing method and system based on track fusion |
| CN115410375A (en)* | 2022-11-02 | 2022-11-29 | 华路易云科技有限公司 | Fusion traffic index set generation method based on fusion traffic data of thunder card |
| CN116844350A (en)* | 2023-07-28 | 2023-10-03 | 哈尔滨工业大学 | A dynamic optimization method for signal control that takes into account accident risk and traffic efficiency |
Also Published As
| Publication number | Publication date |
|---|---|
| CN101702262B (en) | 2011-08-17 |
Similar Documents
| Publication | Publication Date | Title |
|---|---|---|
| CN101702262A (en) | A Data Fusion Method of Urban Traffic Fluidity Index | |
| CN103258436B (en) | Method for determining length of variable guide lane for signal control intersection approach | |
| CN107274684B (en) | Single-point intersection signal control strategy selection method under cooperative vehicle and road environment | |
| CN104298829B (en) | Cellular automaton model based urban road network traffic flow simulation design method | |
| CN106781499B (en) | A Traffic Network Efficiency Evaluation System | |
| WO2019061933A1 (en) | Traffic signal chord panning control method and system | |
| CN104933859B (en) | A kind of method of the determination network carrying power based on macroscopical parent map | |
| CN106652493A (en) | Intersection signal optical control method in environment of Internet of vehicles | |
| CN102169634A (en) | A priority evacuation control method for traffic congestion | |
| CN104899360B (en) | A kind of method for drawing macroscopical parent map | |
| CN104157139A (en) | Prediction method and visualization method of traffic jam | |
| CN107730886A (en) | Dynamic optimization method for traffic signals at urban intersections in Internet of vehicles environment | |
| CN104637315A (en) | Non-signalized crossing optimization control method and system in cooperative vehicle infrastructure environment | |
| CN106205156A (en) | A kind of crossing self-healing control method for the sudden change of part lane flow | |
| CN101894461A (en) | Method for predicting travel time on urban ground level roads | |
| CN105243855A (en) | Crossing signal timing optimization method for reducing exhaust gas emission of motor vehicle | |
| CN110274609A (en) | A kind of real-time route planing method based on Forecasting of Travel Time | |
| Tiwari et al. | Optimizing performance at signalized intersections through signal coordination in two intersections of Nepal | |
| CN108417039A (en) | A Method for Estimating Traffic Demand at Signalized Intersections Influenced by Traffic Flow Composition | |
| CN105133450A (en) | Design method for road crossing turn-around region provided with center isolation guardrail | |
| CN113222382B (en) | Method for determining passing capacity of heterogeneous traffic flow lane change influence road sections in Internet of vehicles environment | |
| CN111009140B (en) | An intelligent traffic signal control method based on open source road condition information | |
| CN116189463A (en) | Single intersection signal timing scheme rolling optimization method based on information physical system | |
| Ma et al. | Traffic optimization methods of urban multi-leg intersections | |
| JP2019020799A (en) | Traffic management device, traffic management system, and traffic management method |
Legal Events
| Date | Code | Title | Description |
|---|---|---|---|
| C06 | Publication | ||
| PB01 | Publication | ||
| C10 | Entry into substantive examination | ||
| SE01 | Entry into force of request for substantive examination | ||
| C14 | Grant of patent or utility model | ||
| GR01 | Patent grant | ||
| CF01 | Termination of patent right due to non-payment of annual fee | ||
| CF01 | Termination of patent right due to non-payment of annual fee | Granted publication date:20110817 Termination date:20211106 |