CN101460090B - Methods for Characterizing Tissues - Google Patents
Methods for Characterizing TissuesDownload PDFInfo
- Publication number
- CN101460090B CN101460090BCN2007800206182ACN200780020618ACN101460090BCN 101460090 BCN101460090 BCN 101460090BCN 2007800206182 ACN2007800206182 ACN 2007800206182ACN 200780020618 ACN200780020618 ACN 200780020618ACN 101460090 BCN101460090 BCN 101460090B
- Authority
- CN
- China
- Prior art keywords
- tissue
- dynamic optical
- value
- parameter
- biomarker
- Prior art date
- Legal status (The legal status is an assumption and is not a legal conclusion. Google has not performed a legal analysis and makes no representation as to the accuracy of the status listed.)
- Expired - Fee Related
Links
Images


Classifications
- G—PHYSICS
- G01—MEASURING; TESTING
- G01N—INVESTIGATING OR ANALYSING MATERIALS BY DETERMINING THEIR CHEMICAL OR PHYSICAL PROPERTIES
- G01N33/00—Investigating or analysing materials by specific methods not covered by groups G01N1/00 - G01N31/00
- G01N33/48—Biological material, e.g. blood, urine; Haemocytometers
- G01N33/50—Chemical analysis of biological material, e.g. blood, urine; Testing involving biospecific ligand binding methods; Immunological testing
- G01N33/53—Immunoassay; Biospecific binding assay; Materials therefor
- G01N33/574—Immunoassay; Biospecific binding assay; Materials therefor for cancer
- G01N33/57407—Specifically defined cancers
- A—HUMAN NECESSITIES
- A61—MEDICAL OR VETERINARY SCIENCE; HYGIENE
- A61B—DIAGNOSIS; SURGERY; IDENTIFICATION
- A61B5/00—Measuring for diagnostic purposes; Identification of persons
- A61B5/0059—Measuring for diagnostic purposes; Identification of persons using light, e.g. diagnosis by transillumination, diascopy, fluorescence
- A—HUMAN NECESSITIES
- A61—MEDICAL OR VETERINARY SCIENCE; HYGIENE
- A61B—DIAGNOSIS; SURGERY; IDENTIFICATION
- A61B5/00—Measuring for diagnostic purposes; Identification of persons
- A61B5/72—Signal processing specially adapted for physiological signals or for diagnostic purposes
- A61B5/7235—Details of waveform analysis
- A61B5/7264—Classification of physiological signals or data, e.g. using neural networks, statistical classifiers, expert systems or fuzzy systems
Landscapes
- Health & Medical Sciences (AREA)
- Life Sciences & Earth Sciences (AREA)
- Engineering & Computer Science (AREA)
- Immunology (AREA)
- Biomedical Technology (AREA)
- Molecular Biology (AREA)
- Urology & Nephrology (AREA)
- Pathology (AREA)
- General Health & Medical Sciences (AREA)
- Physics & Mathematics (AREA)
- Hematology (AREA)
- Chemical & Material Sciences (AREA)
- Cell Biology (AREA)
- Heart & Thoracic Surgery (AREA)
- Food Science & Technology (AREA)
- Medicinal Chemistry (AREA)
- Biotechnology (AREA)
- Analytical Chemistry (AREA)
- Biochemistry (AREA)
- Oncology (AREA)
- General Physics & Mathematics (AREA)
- Hospice & Palliative Care (AREA)
- Biophysics (AREA)
- Microbiology (AREA)
- Medical Informatics (AREA)
- Surgery (AREA)
- Animal Behavior & Ethology (AREA)
- Public Health (AREA)
- Veterinary Medicine (AREA)
- Investigating Or Analysing Biological Materials (AREA)
- Investigating Or Analysing Materials By Optical Means (AREA)
- Sampling And Sample Adjustment (AREA)
- Measuring Or Testing Involving Enzymes Or Micro-Organisms (AREA)
- Pharmaceuticals Containing Other Organic And Inorganic Compounds (AREA)
Abstract
Description
Translated fromChinese技术领域technical field
本发明涉及用于表征组织的方法,还涉及分别用于体内筛选和临床诊断的自动和半自动诊断方法。该方法依赖于在应用特异性生物标志物之后在组织中出现的动态光学现象的定量评价和动态光学参数预测值的确定。The present invention relates to methods for characterizing tissues and also to automated and semi-automated diagnostic methods for in vivo screening and clinical diagnosis, respectively. The method relies on the quantitative evaluation of dynamic optical phenomena occurring in tissues after application of specific biomarkers and the determination of predictive values of dynamic optical parameters.
背景技术Background technique
用于检测和分级上皮癌和癌前病变的现有诊断和筛选方法是定性的、主观的、多步骤的和劳动密集的,整体而言,它们的特征是成本效率低下。Existing diagnostic and screening methods for detecting and grading epithelial cancers and precancerous lesions are qualitative, subjective, multistep, and labor-intensive, and overall they are characterized by low cost efficiency.
对于子宫颈而言,开发用于预防癌症的筛选程序的目标是早期检测和鉴别它的可治愈前体,例如宫颈上皮内瘤样病变(CIN)。For the cervix, screening programs developed for cancer prevention aim at the early detection and identification of its curable precursors, such as cervical intraepithelial neoplasia (CIN).
巴氏试验(Pap-test)是宫颈瘤变的主要筛选方法。在该试验过程中,要从宫颈上皮获得大量细胞,并且在适当的固定和染色之后对该细胞进行细胞学检查。该方法的准确度受取样和读取误差限制,导致明显的假阴性率。在过去若干年中,已经进行了大量研究来确定巴氏试验的性能。研究人员一致认为其平均灵敏度是0.59,平均特异性是0.69-0.75[Nanda K et al.(2000)Annals of Internal Medicine,16;132(10):810-819;Sankaranarayanana R,et al.(2005)InternationalJournal of Gynecology and Obstetrics,89:S4-S12;和Fahey MT et al.(1995)American Journal of Epidemiology,141:680-689]。还广泛认识到,巴氏试验不能同时获得高的特异性和灵敏度。例如,特异性在0.90-0.95范围内的可能增加会导致灵敏度降低到0.20-0.35范围[Fahey MT et al.(1995)American Journal of Epidemiology,141:680-689]。Pap test (Pap-test) is the main screening method for cervical neoplasia. During this assay, a large number of cells is obtained from the cervical epithelium and, after appropriate fixation and staining, the cells are subjected to cytological examination. The accuracy of this method is limited by sampling and readout errors, resulting in significant false negative rates. Over the past several years, numerous studies have been conducted to determine the performance of the Pap test. Researchers agree that its average sensitivity is 0.59 and its average specificity is 0.69-0.75 [Nanda K et al. (2000) Annals of Internal Medicine, 16; 132(10): 810-819; Sankaranarayanana R, et al. (2005 ) International Journal of Gynecology and Obstetrics, 89:S4-S12; and Fahey MT et al. (1995) American Journal of Epidemiology, 141:680-689]. It is also widely recognized that the Pap test cannot simultaneously achieve high specificity and sensitivity. For example, a possible increase in specificity in the range of 0.90-0.95 would result in a decrease in sensitivity to the range of 0.20-0.35 [Fahey MT et al. (1995) American Journal of Epidemiology, 141:680-689].
通常地,灵敏度(SS)和特异性(SP)用作定量统计参数来描述诊断试验的性能。灵敏度表示真阳性(TP)的百分比,而特异性表示真阴性(TN)的百分比。例如,80%(或0.80)的灵敏度是指,借助于金标准试验,所述试验从100个诊断为该疾病阳性的病例中正确地诊断出80例。Typically, sensitivity (SS) and specificity (SP) are used as quantitative statistical parameters to describe the performance of a diagnostic test. Sensitivity represents the percentage of true positives (TP), while specificity represents the percentage of true negatives (TN). For example, a sensitivity of 80% (or 0.80) means that the test correctly diagnoses 80 out of 100 cases diagnosed positive for the disease by means of the gold standard test.
在常规临床环境中,在异常Pap染色涂片(stained smear)之后是进行阴道镜检查,该检查涉及利用低倍显微镜检查子宫颈。根据以下标准评价宫颈组织:a)病变边缘的形态学;b)异常上皮的血管模式;和c)在局部施用标志物(如乙酸溶液)之后的染色程度。阴道镜分级主要基于肉眼检查,并且所检测的病变根据经验定性量表来分类。基于目视评价(阴道镜检查)的临床诊断表现出0.77的灵敏度和0.64的特异性[Mitchell MF,et al.(1998)Obstetrics & Gynecology,91:626-631]。常规的阴道镜检查不能诊断56%的微浸润性宫颈癌和30%的浸润性宫颈癌,导致不能在其可治愈状态下治疗病变。此外,在鉴别用于活组织检查的最不典型部位方面,两个不同医师之间存在高度分歧(77%)。研究人员已经报道了在通过阴道镜检查鉴别宫颈病变中观察者之间的显著变异性[Schiffman M,et al.(2003)Arch.Pathol.Lab.Med.,127:946-949;NHS Report.Cervical Screening Programme,England:2003-04 Statistical Bulletin 2004/20.October 2004.U.K;和Cantor SB,et al.(1998)Obstetrics & Gynecology,91;(2):270-277]。这降低了阴道镜检查的重复性,其主要原因在于事实上阴道镜检查评价是定性的和主观的。In a routine clinical setting, an abnormal Pap stained smear is followed by colposcopy, which involves examination of the cervix with a low-powered microscope. Cervical tissue was evaluated according to the following criteria: a) morphology of the lesion margin; b) vascular pattern of abnormal epithelium; and c) degree of staining after topical application of markers such as acetic acid solution. Colposcopy grading is primarily based on visual inspection, and detected lesions are classified according to empirical qualitative scales. Clinical diagnosis based on visual evaluation (colposcopy) demonstrated a sensitivity of 0.77 and a specificity of 0.64 [Mitchell MF, et al. (1998) Obstetrics & Gynecology, 91:626-631]. Routine colposcopy fails to diagnose 56% of microinvasive cervical cancers and 30% of invasive cervical cancers, resulting in inability to treat lesions in their curable state. Furthermore, there was a high degree of disagreement (77%) between two different physicians in identifying the most atypical site for biopsy. Researchers have reported significant interobserver variability in the identification of cervical lesions by colposcopy [Schiffman M, et al. (2003) Arch. Pathol. Lab. Med., 127:946-949; NHS Report. Cervical Screening Programme, England: 2003-04 Statistical Bulletin 2004/20. October 2004.U.K; and Cantor SB, et al. (1998) Obstetrics & Gynecology, 91; (2): 270-277]. This reduces the reproducibility of colposcopy, mainly due to the fact that colposcopy evaluation is qualitative and subjective.
为了获得更准确的CIN诊断和评级,从可疑区域获得活组织检查样品,然后对其进行组织学检查。但是,活组织检查取样存在几个问题,例如:a)主观性和观察者之间的高度不一致性(>30%),如以下研究中所揭示:Ismail等人[Ismail SM,et al.(1989)British MedicalJournal,298;(6675):707-710]、Bellina等人[Bellina JH,et al.(1982)South Med.J.,75;(1):6-8.56]和Robertson等人[Robertson AJ,et al.(1989)J.Clin.Pathol.,42;(3):231-238];和b)在选择用于活组织检查的异常部位中存在取样误差的风险。For a more accurate diagnosis and grading of CIN, a biopsy sample is obtained from the suspicious area, which is then examined histologically. However, there are several problems with biopsy sampling, such as: a) subjectivity and high inter-observer inconsistency (>30%), as revealed in the following study: Ismail et al [Ismail SM, et al.( 1989) British Medical Journal, 298; (6675): 707-710], Bellina et al [Bellina JH, et al. (1982) South Med.J., 75; (1): 6-8.56] and Robertson et al [ Robertson AJ, et al. (1989) J. Clin. Pathol., 42; (3): 231-238]; and b) there is a risk of sampling error in the selection of abnormal sites for biopsy.
宫颈瘤变的现有诊断链已经将发病率和死亡率降低到了历史性的低水平,但是利用现有诊断程序看起来不可能进一步显著降低发病率和死亡率。这一事实突显出需要更高效的替代技术,实现突出的(standalone)和单步骤的“即查即治”(see and treat)构思。The existing diagnostic chain for cervical neoplasia has reduced morbidity and mortality to historically low levels, but further significant reductions in morbidity and mortality do not appear to be possible using existing diagnostic procedures. This fact highlights the need for more efficient alternative technologies that enable standalone and single-step "see and treat" concepts.
在过去十年中,已经进行了相当大的努力来开发能够提供改进的和客观的组织病理学信息的新型光学技术。这些方法通常基于如下事实:从正常到病理状态的组织变化改变组织的结构和功能性,并且这些改变可以通过利用光-组织相互作用现象来进行体内检测。对组织所发光之特征的测量和分析还可以提供关于不同分子存在性的信息或关于疾病进程中各种结构和功能变化的信息,由此提供一种用于对病变进行体内鉴定和分级的手段。During the past decade, considerable efforts have been made to develop novel optical techniques capable of providing improved and objective histopathological information. These methods are generally based on the fact that tissue changes from normal to pathological states alter the structure and functionality of the tissue, and these changes can be detected in vivo by exploiting the phenomenon of light-tissue interaction. Measurement and analysis of luminescent features of tissues can also provide information on the presence of different molecules or on various structural and functional changes during disease progression, thereby providing a means for in vivo identification and grading of lesions .
朝该方向的先前的尝试包括以检测体内生化和/或结构变化为目标的各种光谱分析和光谱成像技术。美国专利No 4,930,516清楚地公开了一种用于检测癌组织的方法,其中利用第一波长的激发光照射组织样品,从而响应所检测的激发光而产生荧光辐射。癌组织与正常组织之间的区别基于所发射的荧光辐射的波长和振幅。作为一个替代方案,正常组织的光谱振幅会与相同波长下癌组织的光谱振幅不同。Previous attempts in this direction include various spectroscopic analysis and spectroscopic imaging techniques aimed at detecting biochemical and/or structural changes in vivo. U.S. Patent No 4,930,516 clearly discloses a method for detecting cancerous tissue in which a tissue sample is irradiated with excitation light of a first wavelength, thereby generating fluorescent radiation in response to the detected excitation light. The distinction between cancerous tissue and normal tissue is based on the wavelength and amplitude of the emitted fluorescent radiation. As an alternative, normal tissue will have a different spectral amplitude than cancerous tissue at the same wavelength.
时间分辨光谱法基于监测荧光衰变时间,已知这种分析方法也具有区分被照射组织的类型或状态的潜力。例如,美国专利No 5,562,100公开了一种用于确定组织特征的方法,该方法基于利用特定波长的激发辐射的短脉冲照射靶组织,并检测靶组织响应于该激发所发射的荧光辐射。从记录的所发射辐射的振幅来确定组织特征。与之相似,美国专利No 5,467,767公开了一种利用时间分辨荧光光谱分析来确定组织恶性病症的方法。Time-resolved spectroscopy, based on monitoring fluorescence decay times, is known to also have the potential to differentiate the type or state of irradiated tissue. For example, U.S. Patent No 5,562,100 discloses a method for characterizing tissue based on irradiating target tissue with short pulses of excitation radiation of a specific wavelength and detecting fluorescent radiation emitted by the target tissue in response to the excitation. Tissue characteristics are determined from the recorded amplitude of the emitted radiation. Similarly, U.S. Patent No 5,467,767 discloses a method for determining tissue malignancy using time-resolved fluorescence spectroscopy.
另一些发明着重于结合两种或更多种测量技术来确定组织特征。例如,美国专利No 6,975,899公开了一种利用荧光和反射相组合以将癌组织中出现的生物化学变化与形态变化分开的设备和方法。该组合方法基于以下事实:当组织经历从正常状态到癌状态的变化时,荧光光谱分析在确定组织特征方面的有效性低于吸收光谱分析。Other inventions focus on combining two or more measurement techniques to determine tissue characteristics. For example, U.S. Patent No 6,975,899 discloses an apparatus and method that utilizes a combination of fluorescence and reflection to separate biochemical changes from morphological changes that occur in cancerous tissue. This combined approach is based on the fact that fluorescence spectroscopy is less effective than absorption spectroscopy in determining tissue characteristics as the tissue undergoes a change from a normal state to a cancerous state.
另一些专利,例如Utzinger等人的美国专利No 5,369,496公开了一种利用荧光、反射和偏振反射光谱分析来进行诊断性多光谱数字成像的方法和设备。在美国专利No 6,427,082中,提供了一种基于组织对激光激发的荧光响应(LIF)和对白光照射的反向散射响应来区分健康和病变宫颈组织的方法和系统。Other patents, such as Utzinger et al., U.S. Patent No. 5,369,496, disclose a method and apparatus for diagnostic multispectral digital imaging using fluorescence, reflectance and polarized reflectance spectroscopy. In U.S. Patent No 6,427,082, a method and system are provided for differentiating healthy and diseased cervical tissue based on the tissue's fluorescence response to laser excitation (LIF) and backscatter response to white light illumination.
一般而言,现有技术的光谱分析法着重于组织上有限个点处的组织特征,而光学成像法着重于对整个组织区域进行非时间依赖性的光学参数测量。而且,这些方法只提供关于生化或细胞组织结构变化的信息,而不提供关于上皮功能变化的信息。In general, state-of-the-art spectroscopic analysis methods focus on tissue features at a limited number of points on the tissue, while optical imaging methods focus on time-independent optical parameter measurements over the entire tissue region. Moreover, these methods only provide information on changes in biochemical or cellular organization, but not on changes in epithelial function.
C.Balas开发的另一种方法根本上不同于前述发明,其原因是它涉及定量测量施用生物标志物之后在组织中出现的动态现象(PCT公开号WO 01/72214 A1,[Balas C.(2001)IEEE Trans.on BiomedicalEngineering,48:96-104]和[Balas CJ,et al.(1999)SPIE 3568:31-37])。这种动态现象的测量能够潜在地提供关于组织的结构和功能特征的信息,有助于进行体内诊断。Another method developed by C. Balas is fundamentally different from the preceding invention in that it involves the quantitative measurement of dynamic phenomena that occur in tissues following the administration of biomarkers (PCT Publication No. WO 01/72214 A1, [Balas C.( 2001) IEEE Trans. on Biomedical Engineering, 48:96-104] and [Balas CJ, et al. (1999) SPIE 3568:31-37]). Measurement of this dynamic phenomenon can potentially provide information about the structural and functional characteristics of tissues, aiding in vivo diagnostics.
在上述文献中公开的方法和装置依赖于施用病理区分剂(生物标志物),其具有选择性增强异常细胞的结构和功能变化的可视化的性质,然后它在任意空间点和各种波长带下作为时间函数测量所发射的光。所记录的发射光强度(例如反向散射光的强度(IBSL)、漫反射率(DR)和荧光强度)作为时间的函数被定义为“动态光学曲线”(DOC),它表达了在组织-生物标志物相互作用期间所产生之光学现象的时间特征。对所得DOC的建模和分析使得能够计算用于表征每个图像位置(像素或像素组)处生物标志物-组织相互作用动力学的各种动态光学参数(DOP)。这些参数的空间分布包括动力学图,其可以重叠到组织的彩色图像上。这些数据能够提供一种用于对病变进行体内检测、作图和分级以便诊断、筛选和跟踪并同时能够引导活组织取样和外科手术治疗的手段。The methods and devices disclosed in the above documents rely on the administration of pathological distinguishing agents (biomarkers), which have the property of selectively enhancing the visualization of structural and functional changes of abnormal cells, which are then The emitted light is measured as a function of time. The recorded emitted light intensity (such as the intensity of backscattered light (IBSL), diffuse reflectance (DR) and fluorescence intensity) as a function of time is defined as a "dynamic optical curve" (DOC), which expresses the intensities in tissue- Temporal signature of optical phenomena produced during biomarker interactions. Modeling and analysis of the resulting DOC enables the calculation of various dynamic optical parameters (DOPs) characterizing the dynamics of biomarker-tissue interactions at each image location (pixel or group of pixels). The spatial distribution of these parameters includes a kinetic map, which can be overlaid onto a color image of the tissue. These data can provide a means for in vivo detection, mapping, and grading of lesions for diagnosis, screening, and follow-up, while also being able to guide biopsy and surgical treatment.
通常地,这种诊断技术的临床价值通过它在灵敏度(SS)和特异性(SP)的阳性和阴性预测值方面的性能来确定。如果SS和SP大于现有诊断方法的SS和SP,则可以认为该新技术适用于筛选和/或临床诊断目的。Typically, the clinical value of this diagnostic technique is determined by its performance in terms of positive and negative predictive value of sensitivity (SS) and specificity (SP). If the SS and SP are greater than those of existing diagnostic methods, the new technique can be considered suitable for screening and/or clinical diagnostic purposes.
发明内容Contents of the invention
与在PCT公开No.WO 01/72214 A1;Balas C.(2001)IEEE Trans.on Biomedical Engineering,48:96-104和Balas CJ,et al.(1999)SPIE3568:31-37中公开的方法相比,本文所述的本发明提供了改进的方法。具体而言,本发明提供了基于选择适当DOP及其相应的截止值来用于筛选目的的自动诊断或用于阴道镜检查中的半自动临床诊断的方法,所述方法能够最佳地区分各种病理状态。这是通过将从DOC提取的DOP与定性和定量病理学相关联来实现的。本文公开的本发明还提供用于经过建立上皮转运现象的模型来评价活组织中的结构和功能特征以及它们与体内测量的动态光学特征的关联性的方法。Compared to the methods disclosed in PCT Publication No. WO 01/72214 A1; Balas C. (2001) IEEE Trans. on Biomedical Engineering, 48: 96-104 and Balas CJ, et al. (1999) SPIE 3568: 31-37 Compared to this, the invention described herein provides an improved method. In particular, the present invention provides a method based on the selection of an appropriate DOP and its corresponding cut-off value for automatic diagnosis for screening purposes or for semi-automated clinical diagnosis in colposcopy, which can best distinguish between various Pathological state. This was achieved by correlating DOP extracted from DOC with qualitative and quantitative pathology. The invention disclosed herein also provides methods for evaluating structural and functional features in living tissues and their correlation with in vivo measured dynamic optical features by modeling epithelial transport phenomena.
本发明提供用于表征(例如分级)组织例如(如宫颈、子宫、口腔、皮肤、呼吸和胃肠的)癌组织和/或癌前组织的方法,例如自动或半自动的方法。因此,在本发明的第一方面中,提供了一种用于确定组织的结构和功能特征和/或病理状态的方法,其包括:The present invention provides methods, eg automated or semi-automated methods, for characterizing (eg grading) tissue such as (eg cervical, uterine, oral, skin, respiratory and gastrointestinal) cancerous and/or precancerous tissue. Therefore, in a first aspect of the present invention there is provided a method for determining structural and functional characteristics and/or pathological state of a tissue comprising:
基于已经暴露于生物标志物的组织或其部分的光学性质生成一段时间内动态光学曲线的数据;generating data for dynamic optical curves over time based on optical properties of tissue or portions thereof that have been exposed to the biomarker;
基于所述数据,确定动态光学参数的值;determining a value for a dynamic optical parameter based on the data;
将该动态光学参数的值和已知与该组织的结构或功能特征和/或病理状态相关的动态光学参数的参考值进行比较;以及comparing the value of the dynamic optical parameter to a reference value of a dynamic optical parameter known to be associated with a structural or functional characteristic and/or pathological state of the tissue; and
基于该比较,确定所述组织或其部分的结构或功能特征和/或病理状态。本发明的方法可用于例如辅助组织的筛选、临床诊断、引导活组织取样或治疗。该组织可以是上皮癌前组织或者宫颈、子宫、口腔、皮肤、呼吸或胃肠的癌组织或癌前组织。该方法包括基于已经暴露于生物标志物的组织或其部分在一段时间中的反向散射光的强度绘制动态光学曲线;基于该动态光学曲线,确定动态光学参数,例如“积分”、“最大值”、“到最大值的时间”、“到最大值的面积”、“斜度A”和“斜度B”;基于一个或更多个所述动态光学参数或其亚组合的值来表征该组织。所述动态光学参数代表施用生物标志物之后从组织部位获得的反向散射光强度的时间变异,并且可以经过对一个或更多所述动态光学曲线的数学分析或经过对一个或更多所述动态光学曲线的经验、手工或视觉分析来产生所述动态光学参数。Based on this comparison, structural or functional characteristics and/or pathological states of said tissue or parts thereof are determined. The methods of the invention can be used, for example, to aid in tissue screening, clinical diagnosis, guided biopsy or therapy. The tissue may be epithelial precancerous tissue or cervical, uterine, oral, skin, respiratory or gastrointestinal cancerous or precancerous tissue. The method includes drawing a dynamic optical curve based on the intensity of backscattered light over a period of time from tissue or portions thereof that have been exposed to the biomarker; based on the dynamic optical curve, determining dynamic optical parameters such as "integral", "maximum ", "time to maximum", "area to maximum", "slope A" and "slope B"; characterize the organize. The dynamic optical parameters represent temporal variations in backscattered light intensity obtained from a tissue site following administration of a biomarker, and may be the result of a mathematical analysis of one or more of the dynamic optical curves or of one or more of the Empirical, manual or visual analysis of the dynamic optical curves to generate the dynamic optical parameters.
在一个特别优选的实施方案中,所述试验组织是宫颈组织。在另一个实施方案中,所述方法优选用于诊断或表征瘤变和/或检测HPV感染。在又一个实施方案中,所述方法用于确定组织中细胞的核质比。所述试验组织优选包括上皮细胞。In a particularly preferred embodiment, the test tissue is cervical tissue. In another embodiment, the method is preferably used for diagnosing or characterizing neoplasia and/or detecting HPV infection. In yet another embodiment, the method is used to determine the nucleoplasmic ratio of cells in a tissue. The test tissue preferably comprises epithelial cells.
本发明方法优选给出至少60%的灵敏度和至少60%的特异性,甚至更优选至少65%或70%的灵敏度和至少65%或70%的特异性,最优选至少75%、76%、77%、78%、79%或80%的灵敏度和至少75%、76%、77%、78%、79%或80%的特异性。The method of the invention preferably gives a sensitivity of at least 60% and a specificity of at least 60%, even more preferably a sensitivity of at least 65% or 70% and a specificity of at least 65% or 70%, most preferably at least 75%, 76%, A sensitivity of 77%, 78%, 79% or 80% and a specificity of at least 75%, 76%, 77%, 78%, 79% or 80%.
在一个实施方案中,生物标志物选自醋酸(例如3~5%的醋酸溶液)、甲酸、丙酸、丁酸、卢戈氏碘(Lugol’s iodine)、希尔氏碘(Shiller’siodine)、亚甲基蓝、甲苯胺蓝、渗透剂、离子剂和靛蓝胭脂红(indigocarmine)的溶液。In one embodiment, the biomarker is selected from the group consisting of acetic acid (eg 3-5% acetic acid solution), formic acid, propionic acid, butyric acid, Lugol's iodine, Shiller's iodine, Solutions of methylene blue, toluidine blue, penetrant, ionizer, and indigocarmine.
在另一个实施方案中,所述动态光学参数是积分(Integral),并且至少约480~650的标准化值(无量纲)(例如,至少约480、490、500、510、520、530、540、550、560、570、580、590、600、610、620、630、640或650)指示所试验的宫颈组织为高级宫颈瘤变(例如,区分高级宫颈瘤变和非高级宫颈瘤变)。In another embodiment, the dynamic optical parameter is Integral and has a normalized value (dimensionless) of at least about 480 to 650 (e.g., at least about 480, 490, 500, 510, 520, 530, 540, 550, 560, 570, 580, 590, 600, 610, 620, 630, 640, or 650) indicates that the cervical tissue tested is a high-grade cervical neoplasia (eg, to distinguish between high-grade cervical neoplasia and non-high-grade cervical neoplasia).
在另一个实施方案中,所述动态光学参数是积分,并且至少约420~490的标准化值(无量纲)(例如,至少约420、430、440、450、460、470、480、485或490)指示HPV感染是所述宫颈癌组织的原因(例如,区分HPV感染和高级宫颈瘤变)。In another embodiment, the dynamic optical parameter is an integral and has a normalized value (dimensionless) of at least about 420 to 490 (e.g., at least about 420, 430, 440, 450, 460, 470, 480, 485, or 490 ) indicates that HPV infection is the cause of the cervical cancer tissue (eg, distinguishing HPV infection from high-grade cervical neoplasia).
在又一个实施方案中,所述动态光学参数是最大值(Max),并且至少约70~90的已校准单位的值(例如,至少约70、75、80、85、86、87、88、89或90)指示所述宫颈组织是高级宫颈瘤变(例如,区分高级宫颈瘤变和非高级宫颈瘤变)。In yet another embodiment, the dynamic optical parameter is a maximum value (Max), and has a value of at least about 70 to 90 calibrated units (e.g., at least about 70, 75, 80, 85, 86, 87, 88, 89 or 90) indicates that the cervical tissue is a high-grade cervical neoplasia (eg, distinguishing between a high-grade cervical neoplasia and a non-high-grade cervical neoplasia).
在又一个实施方案中,所述动态光学参数是最大值,并且至少约65~90的已校准单位的值(例如,至少约60、65、70、75、80、85、86、87、88、89或90)指示HPV感染是所述宫颈组织的原因(例如,区分HPV感染和高级宫颈瘤变)。In yet another embodiment, the dynamic optical parameter is a maximum value and has a value of at least about 65 to 90 calibrated units (e.g., at least about 60, 65, 70, 75, 80, 85, 86, 87, 88 , 89, or 90) indicates that HPV infection is the cause of the cervical tissue (eg, distinguishing HPV infection from high-grade cervical neoplasia).
在又一个实施方案中,所述动态光学参数是到最大值的面积(Areato Max),并且至少约120~170的标准化值(无量纲)(例如,至少约120、130、140、150、160或170)指示所试验的宫颈组织为高级宫颈瘤变(例如,区分高级宫颈瘤变与非高级宫颈瘤变)。In yet another embodiment, the dynamic optical parameter is Area to Maximum (Areato Max) and has a normalized value (dimensionless) of at least about 120 to 170 (e.g., at least about 120, 130, 140, 150, 160 or 170) indicates that the tested cervical tissue is a high-grade cervical neoplasia (eg, to distinguish a high-grade cervical neoplasia from a non-high-grade cervical neoplasia).
在又一个实施方案中,所述动态光学参数是到最大值的时间(Timeto Max),并且至少约80~100秒的值(例如,至少约80、85、90、95、100)指示所试验的宫颈组织为高级宫颈瘤变(例如,区分高级宫颈瘤变与非高级宫颈瘤变)。In yet another embodiment, the dynamic optical parameter is Time to Max, and a value of at least about 80 to 100 seconds (e.g., at least about 80, 85, 90, 95, 100) indicates that the tested Cervical tissue with high-grade cervical neoplasia (eg, distinguishing high-grade cervical neoplasia from non-high-grade cervical neoplasia).
在又一个实施方案中,所述动态光学参数是“到最大值的面积”,并且大于或约等于高级宫颈瘤变之“到最大值的面积”截止值的值指示所述宫颈组织是高级宫颈瘤变(例如,区分高级宫颈瘤变与非高级宫颈瘤变),其中“到最大值的面积”截止值在标准化的约120和约170(无量纲)之间(例如,约120、130、140、150、160或170)。In yet another embodiment, the dynamic optical parameter is "area to maximum" and a value greater than or about equal to the "area to maximum" cutoff for a high-grade cervical neoplasia indicates that the cervical tissue is high-grade cervical Neoplastic changes (eg, to distinguish high-grade cervical neoplasia from non-high-grade cervical neoplasia), where the "area to maximum" cutoff value is between about 120 and about 170 (dimensionless) normalized (eg, about 120, 130, 140 , 150, 160 or 170).
在又一个实施方案中,所述动态光学参数是斜度A(SlopeA),并且至少约1.1至1.3(弧度)(例如,至少约1.1、1.2或1.3弧度)的值指示所述宫颈组织为高级宫颈瘤变(例如,区分高级宫颈瘤变与非高级宫颈瘤变)。In yet another embodiment, the dynamic optical parameter is Slope A (SlopeA), and a value of at least about 1.1 to 1.3 (radians) (e.g., at least about 1.1, 1.2, or 1.3 radians) indicates that the cervical tissue is high grade Cervical neoplasia (eg, distinguishing high-grade from non-high-grade cervical neoplasia).
在又一个实施方案中,所述动态光学参数是斜度B,并且至少约-0.012至-0.090(弧度)(至多约例如-0.012、-0.020、-0.025、-0.030、-0.040、-0.050、-0.060、-0.070、-0.080、或-0.090)的值指示所述宫颈组织为高级宫颈瘤变(例如,区分高级宫颈瘤变与非高级宫颈瘤变)。In yet another embodiment, the dynamic optical parameter is slope B and is at least about -0.012 to -0.090 (radians) (up to about eg -0.012, -0.020, -0.025, -0.030, -0.040, -0.050, A value of -0.060, -0.070, -0.080, or -0.090) indicates that the cervical tissue is a high-grade cervical neoplasia (eg, to distinguish a high-grade cervical neoplasia from a non-high-grade cervical neoplasia).
在另一方面中,本发明提供了用于表征宫颈组织(例如宫颈癌)或癌前组织的方法,该方法是通过以下进行的:基于从已经暴露于生物标志物的成像宫颈组织或其部分在一段时间中所观察的光学性质(例如来自宫颈癌或癌前组织的反向散射光的强度)绘制动态光学曲线;基于该动态光学曲线,确定选自“积分”、“最大值”、“到最大值的时间”、“到最大值的面积”、“斜度A”和“斜度B”的动态光学参数;基于一个或更多所述动态光学参数或其亚组合的值来表征宫颈癌或癌前组织。In another aspect, the present invention provides a method for characterizing cervical tissue (e.g., cervical cancer) or precancerous tissue based on imaging cervical tissue or a portion thereof that has been exposed to a biomarker A dynamic optical curve is plotted over time for the observed optical properties (eg, the intensity of backscattered light from cervical cancer or precancerous tissue); Dynamic optical parameters of "time to maximum", "area to maximum", "slope A" and "slope B"; characterize the cervix based on the value of one or more of said dynamic optical parameters or a subcombination thereof cancerous or precancerous tissue.
在另一方面中,本发明提供了用于表征组织的方法,包括以下步骤:通过例如施加器(applicator)将生物标志物施用到组织;在施用生物标志物之前和之后,并且施用生物标志物和开始获取图像之间适当同步化,在预定时间段内以时间顺序获取并对齐一系列光谱和彩色图像;从该系列光谱和彩色图像计算每个像点处的动态光学曲线,其表达预定光谱带中的发射光作为时间的函数;从所述动态光学曲线计算一个或更多个动态光学参数,并且以伪彩图的形式显示所述一个或更多动态光学参数,由此表征组织。In another aspect, the invention provides a method for characterizing tissue comprising the steps of: applying a biomarker to the tissue, eg, by an applicator; before and after applying the biomarker, and administering the biomarker Acquire and align a series of spectral and color images in chronological order over a predetermined period of time, with appropriate synchronization between and start acquiring images; from this series of spectral and color images, a dynamic optical curve at each image point is computed that expresses the predetermined spectrum Emitted light in a strip as a function of time; calculating one or more dynamic optical parameters from said dynamic optical curve, and displaying said one or more dynamic optical parameters in the form of a pseudo-color map, thereby characterizing the tissue.
在另一个方面中,本发明提供了用于确定组织的体内功能和结构特征的方法。该方法包括通过例如施加器将生物标志物施用到组织;在施用生物标志物之前和之后,并且施用生物标志物和开始获取图像之间适当同步化,在预定时间段内以时间顺序获取并优选对齐一系列光谱和彩色图像;从该系列光谱和彩色图像计算选定像点或每个像点处的动态光学曲线,其表示组织在预定光谱带中的光学特征例如发射光作为时间的函数;从所述数据(即动态光学曲线)计算一个或更多个动态光学参数(例如“积分”、“最大值”、“到最大值的时间”、“到最大值的面积”、“斜度A”和“斜度B”),并且以伪彩图的形式显示所述一个或更多个动态光学参数,由此确定组织的体内功能和结构特征。In another aspect, the present invention provides methods for determining in vivo functional and structural characteristics of tissues. The method comprises applying a biomarker to the tissue by, for example, an applicator; before and after the application of the biomarker, with appropriate synchronization between the application of the biomarker and the start of acquiring images, acquired in chronological order over a predetermined period of time and preferably aligning a series of spectral and color images; calculating from the series of spectral and color images a dynamic optical curve at a selected image point or at each image point representing an optical characteristic of the tissue, such as emitted light, in a predetermined spectral band as a function of time; Calculate one or more dynamic optical parameters (e.g. "integral", "maximum", "time to maximum", "area to maximum", "slope A" from the data (i.e. dynamic optical curve) " and "Slope B"), and display the one or more dynamic optical parameters in the form of a pseudo-color map, thereby determining in vivo functional and structural characteristics of the tissue.
已经证实,针对本发明各个方面所列出的所有实施方案加以必要修改后适用于本发明的其它相关方面,并且为了简明起见不再赘述。All of the embodiments listed for each aspect of the invention have been found to be applicable mutatis mutandis to other related aspects of the invention and will not be repeated for the sake of brevity.
在一个实施方案中,所述动态光学参数“积分”用于获得所述组织功能和结构特征的信息。在另一个实施方案中,动态光学参数是“最大值”,而组织的功能和结构特征选自细胞外酸度、被动扩散常数、复层上皮的细胞层数和核质比。In one embodiment, said dynamic optical parameter "integration" is used to obtain information on the functional and structural characteristics of said tissue. In another embodiment, the dynamic optical parameter is "maximum" and the functional and structural characteristics of the tissue are selected from the group consisting of extracellular acidity, passive diffusion constant, number of cell layers in stratified epithelium, and nucleoplasmic ratio.
在又一个实施方案中,关联核质比(NCR)与“积分”和“最大值”的数学式为:

在又一个实施方案中,所述动态光学参数是“斜度A”,组织的功能和结构特征选自在调节细胞内pH方面的细胞功能障碍、脉管系统紊乱的存在和淋巴引流不良。In yet another embodiment, said dynamic optical parameter is "slope A" and the functional and structural characteristics of the tissue are selected from the group consisting of cellular dysfunction in regulating intracellular pH, presence of vasculature disorder, and poor lymphatic drainage.
在相关的方面中,本发明还提供容纳用于表征癌组织的计算机程序指令的计算机可读介质,当被计算设备执行时,该计算机可读介质使计算设备执行以下步骤:In a related aspect, the present invention also provides a computer readable medium embodying computer program instructions for characterizing cancerous tissue that, when executed by a computing device, cause the computing device to perform the steps of:
施用生物标志物之后,从一系列光谱和彩色图像计算选定图像点处的动态光学曲线,该动态光学曲线表达预定光谱带中发射光作为时间的函数;After administration of the biomarker, calculating a dynamic optical curve at selected image points from the series of spectral and color images, the dynamic optical curve expressing emitted light in a predetermined spectral band as a function of time;
从所述动态光学曲线确定一个或更多个动态光学参数,以及determining one or more dynamic optical parameters from the dynamic optical curve, and
存储所述一个或更多个动态光学参数以用于表征癌组织。The one or more dynamic optical parameters are stored for characterizing cancerous tissue.
在一个优选的实施方案中,经过将人工神经网络、统计学模式识别算法、贝叶斯分类或分类树的辅助与动态光学参数相结合,所述动态光学参数用于区分病理状态。In a preferred embodiment, dynamic optical parameters are used to differentiate pathological states through the combination of artificial neural networks, statistical pattern recognition algorithms, Bayesian classification or classification trees with the aid of dynamic optical parameters.
在另一个方面中,提供了一种容纳计算机可执行指令的计算机可读介质,该计算机可执行指令用于实施表征组织的方法,所述方法包括In another aspect, there is provided a computer-readable medium embodying computer-executable instructions for implementing a method of characterizing tissue, the method comprising
从已经暴露于生物标志物的组织或其部分获得在一段时间中的光学性质确定动态光学曲线的数据;obtaining data determining a dynamic optical curve from the optical properties of the tissue or portion thereof that has been exposed to the biomarker over a period of time;
基于所述数据,确定动态光学参数,以及based on said data, determining dynamic optical parameters, and
基于一个或更多个所述动态光学参数或其亚组合的值来表征所述组织。The tissue is characterized based on values of one or more of the dynamic optical parameters or a subcombination thereof.
相似地,本发明提供了一种容纳用于表征宫颈组织的计算机可执行指令的计算机可读介质,包括用于执行以下步骤的指令:Similarly, the present invention provides a computer-readable medium containing computer-executable instructions for characterizing cervical tissue, including instructions for performing the steps of:
基于已经暴露于生物标志的宫颈组织或其部分在一段时间中的一个或更多光学性质绘制动态光学曲线;drawing a dynamic optical profile based on one or more optical properties of cervical tissue or a portion thereof that has been exposed to the biomarker over a period of time;
基于所述动态光学曲线,确定选自“积分”、“最大值”、“到最大值的时间”、“到最大值的面积”、“斜度A”和“斜度B”的动态光学参数;以及Based on the dynamic optical curve, a dynamic optical parameter selected from the group consisting of "Integral", "Maximum", "Time to Maximum", "Area to Maximum", "Slope A" and "Slope B" is determined ;as well as
基于一个或更多个所述动态光学参数或其亚组合的值来表征所述宫颈组织。The cervical tissue is characterized based on values of one or more of the dynamic optical parameters or a subcombination thereof.
还提供一种容纳用于执行表征组织之方法的计算机可执行指令的计算机可读介质,该方法包括以下步骤:Also provided is a computer-readable medium containing computer-executable instructions for performing a method of characterizing tissue, the method comprising the steps of:
将生物标志物施用到组织;administering the biomarker to the tissue;
在施用生物标志物之前和之后,并且在施用生物标志物和开始获取图像之间适当同步化,在预定时间段内按时间顺序获取一系列光谱和彩色图像;Acquire a series of spectral and color images in chronological order over a predetermined period of time before and after administration of the biomarker, with appropriate synchronization between administration of the biomarker and initiation of image acquisition;
从该系列光谱和彩色图像计算选定图像点处的动态光学曲线,该动态光学曲线在预定光谱带中将光学性质表达为时间的函数;calculating a dynamic optical curve at selected image points from the series of spectral and color images, the dynamic optical curve expressing optical properties as a function of time in predetermined spectral bands;
从所述动态光学曲线计算一个或更多个动态光学参数,以及calculating one or more dynamic optical parameters from the dynamic optical curve, and
以伪彩图的形式显示所述一个或更多个动态光学参数,由此表征癌组织。The one or more dynamic optical parameters are displayed in a pseudo-color map, thereby characterizing the cancerous tissue.
本文中还提供一种容纳计算机可执行指令的计算机可读介质,所述指令用于执行确定组织的体内功能和结构特征的方法,该方法包括以下步骤:Also provided herein is a computer-readable medium embodying computer-executable instructions for performing a method of determining in vivo functional and structural characteristics of a tissue, the method comprising the steps of:
将生物标志物施用到组织;administering the biomarker to the tissue;
在施用生物标志物之前和之后,并且在施用生物标志物和开始获取图像之间适当同步化,在预定时间段内以时间顺序获取并对齐一系列光谱和彩色图像;Acquiring and aligning a series of spectral and color images in chronological order over a predetermined period of time before and after administration of the biomarker, with appropriate synchronization between administration of the biomarker and initiation of image acquisition;
从该系列光谱和彩色图像计算每个图像点处的动态光学曲线,该动态光学曲线表达预定光谱带中发射光作为时间的函数;calculating a dynamic optical curve at each image point from the series of spectral and color images, the dynamic optical curve expressing emitted light in a predetermined spectral band as a function of time;
从所述动态光学曲线计算一个或更多个动态光学参数,以及calculating one or more dynamic optical parameters from the dynamic optical curve, and
以伪彩图的形式显示所述一个或更多个动态光学参数,由此确定组织的体内功能和结构特征。The one or more dynamic optical parameters are displayed in the form of a pseudo-color map, thereby determining in vivo functional and structural characteristics of the tissue.
与本发明方法相关的所有合适的实施方案加以必要的修改后适用于本发明的计算机可读介质方面,反之亦然。All suitable embodiments in relation to the methods of the invention apply mutatis mutandis to the computer readable medium aspects of the invention, and vice versa.
从以下详细说明和权利要求中,本发明的其它特征和优点是显而易见的。Other features and advantages of the invention are apparent from the following detailed description and claims.
附图说明Description of drawings
现在将参照以下附图和权利要求描述本发明的优选实施方案。在附图中,相同的附图标记用于表示各视图中的相同要素。Preferred embodiments of the invention will now be described with reference to the following drawings and claims. In the drawings, the same reference numerals are used to designate the same elements in the various views.
图1是本文所公开诊断方法的流程图的示意图。Figure 1 is a schematic illustration of a flow chart of the diagnostic methods disclosed herein.
图2显示从与醋酸相互作用的宫颈组织部位获得的典型DOC,其对应于人乳头瘤病毒(HPV)(经组织学分类)。Figure 2 shows typical DOC obtained from cervical tissue sites interacting with acetic acid, corresponding to human papillomavirus (HPV) (histologically classified).
图3显示从与醋酸相互作用的宫颈组织部位获得的典型DOC,其对应于炎症(经组织学分类)。Figure 3 shows typical DOC obtained from cervical tissue sites interacting with acetic acid, corresponding to inflammation (by histological classification).
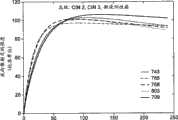
图4显示从与醋酸相互作用的宫颈组织部位获得的典型DOC,其对应于宫颈上皮内瘤样病变I(CIN I)(经组织学分类)。Figure 4 shows typical DOC obtained from cervical tissue sites interacting with acetic acid, corresponding to cervical intraepithelial neoplasia I (CIN I) (by histological classification).
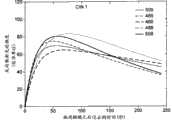
图5显示从与醋酸相互作用的宫颈组织部位获得的典型DOC,其对应于高级(HG)病变(CIN II、III,微浸润性癌)(经组织学分类)。Figure 5 shows typical DOC obtained from acetic acid-interacted cervical tissue sites corresponding to high-grade (HG) lesions (CIN II, III, minimally invasive carcinoma) (by histological classification).
图6示出与典型DOC对应的DOP,其可用于诊断组织的各种病理状况。Figure 6 shows DOPs corresponding to typical DOCs, which can be used to diagnose various pathological conditions of tissues.
图7示出对应于指示性DOP(积分)和“ROC曲线下面积”的受试者工作特征(Receiver Operating Characteristic,ROC)曲线,其表达该特定DOP在区分低级和高级CIN中的性能。该结果是在310位妇女参与的临床环境中从与醋酸溶液相互作用的体内宫颈上皮获得的。Figure 7 shows the Receiver Operating Characteristic (ROC) curve corresponding to the indicative DOP (integral) and the "area under the ROC curve" expressing the performance of that particular DOP in distinguishing low-grade from high-grade CIN. The results were obtained from in vivo cervical epithelium interacting with acetic acid solution in a clinical setting involving 310 women.
图8显示从与指示性DOP(积分)对应的ROC分析获得的灵敏度(灰色)和特异性(黑色)作图,其表达该特定DOP在区分低级和高级病变中的性能。选自480到650范围的积分值包括用于区分低级和高级宫颈瘤变的截止值,其中SS和SP均大于60%。该结果是在310位妇女参与的临床环境中从与3%醋酸溶液相互作用的体内宫颈上皮获得的。Figure 8 shows sensitivity (gray) and specificity (black) plots obtained from ROC analysis against an indicative DOP (integral) expressing the performance of this particular DOP in distinguishing low-grade from high-grade lesions. Score values selected from the range of 480 to 650 included cut-off values for distinguishing low-grade and high-grade cervical neoplasia, where both SS and SP were greater than 60%. The results were obtained from in vivo cervical epithelium interacted with 3% acetic acid solution in a clinical setting involving 310 women.
图9A~E显示从DOC提取的5个不同DOP的带对应误差线的平均值。该结果是在310位妇女参与的临床环境中从与醋酸溶液相互作用的体内宫颈上皮获得的。Figures 9A-E show the mean values with corresponding error bars for 5 different DOPs extracted from the DOC. The results were obtained from in vivo cervical epithelium interacting with acetic acid solution in a clinical setting involving 310 women.
图10A和10B显示核质比(NCR)散点图和线性回归曲线,在组织样品中相对于活组织检查之前从相同样品获得的两个不同DOP(积分和最大值)对此进行了定量评价。该结果是在310位妇女参与的临床环境中从与醋酸溶液相互作用的体内宫颈上皮获得的。Figures 10A and 10B show nucleoplasmic ratio (NCR) scatter plots and linear regression curves, quantified in tissue samples relative to two different DOPs (integral and maximum) obtained from the same samples prior to biopsy . The results were obtained from in vivo cervical epithelium interacting with acetic acid solution in a clinical setting involving 310 women.
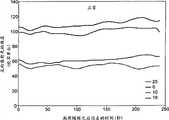
图11显示从与醋酸相互作用的宫颈组织部位获得的典型DOC,其对应于健康(正常)组织(经组织学分类)。Figure 11 shows typical DOC obtained from cervical tissue sites interacted with acetic acid, corresponding to healthy (normal) tissue (histologically classified).
图12显示了联合硬件设置的一个示例性实施方案通过本文所公开发明的软件执行所采用的步骤,用于获取图像组织数据。Figure 12 shows the steps taken by an exemplary embodiment of a combined hardware setup for acquiring image tissue data by software implementation of the invention disclosed herein.
具体实施方式Detailed ways
光学生物标志物是引发异常组织的光响应暂时性变化的化学物质。对于高效生物标志物而言,异常组织的结构、形态和功能变化表现在生物标志物组织相互作用期间产生的光学信号中,这有助于对病变进行鉴定和定位。Optical biomarkers are chemicals that trigger temporary changes in the light response of abnormal tissues. For highly effective biomarkers, structural, morphological, and functional changes in abnormal tissues are manifested in optical signals generated during biomarker-tissue interactions, which aid in the identification and localization of lesions.
涉及施用生物标志物的典型诊断程序包括:Typical diagnostic procedures involving the administration of biomarkers include:
■局部或系统性施用一种或更多种生物标志物。■ Topical or systemic administration of one or more biomarkers.
■检查生物标志物引发的组织光学性质变化。■ Examine biomarker-induced changes in tissue optical properties.
■定位异常区域以进行诊断和治疗。■ Locate abnormal areas for diagnosis and treatment.
传统的涉及生物标志物的诊断方法存在主要与以下事实相关的几个缺点:不能有效地进行动态光学现象的视觉评价,其原因在于人体光学系统在检测和记录不同组织部位中具有不同动力学的快速变化现象的生理局限性。Traditional diagnostic methods involving biomarkers suffer from several disadvantages mainly related to the fact that visual evaluation of dynamic optical phenomena cannot be effectively performed due to the different dynamics of the human optical system in detecting and recording different tissue sites. Physiological limitations of rapidly changing phenomena.
Balas C.(2001)IEEE Trans.on Biomedical Engineering,48:96-104;Balas CJ,et al.(1999)SPIE 3568:31-37;和PCT公开No.WO 01/72214 A1公开的一种方法和装置提供了该问题的一种解决方案,其中提供了从生物标志物-组织相互作用产生的动态光学现象的定量评价和作图分析。Balas C. (2001) IEEE Trans. on Biomedical Engineering, 48: 96-104; Balas CJ, et al. (1999) SPIE 3568: 31-37; and a method disclosed in PCT Publication No. WO 01/72214 A1 A solution to this problem is provided by the and device, which provides quantitative evaluation and mapping analysis of dynamic optical phenomena resulting from biomarker-tissue interactions.
如上所示,本发明提供与前述方法相比改进的方法。例如,针对在区分各种正常和病理状况的预测值和效率方面,本发明提供了DOC的系统性参数分析和所得DOP的比较性评价。As indicated above, the present invention provides improved methods compared to the methods previously described. For example, the present invention provides a systematic parametric analysis of DOC and a comparative assessment of the resulting DOP with respect to its predictive value and efficiency in differentiating various normal and pathological conditions.
本文所述的本发明涉及基于选择合适DOP及其最佳区分各种病理状态的相应截止值,用于筛选目的的自动诊断或者用于阴道镜检查中半自动临床诊断的方法。这是通过将从DOC提取的DOP与定性和定量病理学相关联来实现的。本文公开的本发明的另一目的是提供一种经过建立上皮转运现象的模型来评价活组织中结构和功能特征以及它们与体内测量的动态光学特性的关联性的方法。The invention described herein relates to a method for automatic diagnosis for screening purposes or for semi-automated clinical diagnosis in colposcopy based on the selection of an appropriate DOP and its corresponding cut-off value that best differentiates various pathological states. This was achieved by correlating DOP extracted from DOC with qualitative and quantitative pathology. Another object of the invention disclosed herein is to provide a method for evaluating structural and functional features in living tissues and their correlation with in vivo measured dynamic optical properties by modeling epithelial transport phenomena.
本文中术语“动态光学曲线”和“DOC”可互换使用,意在包括代表所观察组织在一段时间中的光学特性(例如来自组织或其部分的反向散射光的强度、光反射、来自组织或其部分的光的漫反射或来自组织或其部分的荧光,所述组织已经暴露于生物标志物)的曲线。The terms "dynamic optical curve" and "DOC" are used interchangeably herein and are intended to include optical properties (e.g., intensity of backscattered light from the tissue or parts thereof, light reflectance, Diffuse reflectance of light or fluorescence from tissue or a portion thereof that has been exposed to a biomarker).
本文所用的术语“生物标志物”意思包括能够改变来自试验组织样品的光学信号的任意化学试剂。这种试剂的非限制性实例包括但不限于醋酸、甲酸、丙酸、丁酸、卢戈氏碘、希尔氏碘、亚甲基蓝、甲苯胺蓝、渗透剂、离子剂(ionic agent)和靛蓝胭脂红。可以使用前述试剂的任意溶液。在一个优选实施方案中,生物标志物是醋酸溶液,例如3~5%的醋酸溶液。The term "biomarker" as used herein is meant to include any chemical agent capable of altering an optical signal from a test tissue sample. Non-limiting examples of such agents include, but are not limited to, acetic acid, formic acid, propionic acid, butyric acid, Lugol's iodine, Hill's iodine, methylene blue, toluidine blue, penetrants, ionic agents, and indigo carmine red. Any solution of the aforementioned reagents may be used. In a preferred embodiment, the biomarker is an acetic acid solution, such as a 3-5% acetic acid solution.
本文使用的术语“动态光学参数”意思包括本领域技术人员可以基于其表征组织(例如分级组织)的一个或更多参数。如本文所述,这种参数可经过对基于来自已经暴露于生物标志物的癌组织或其部分在一段时间中的反向散射光强度绘制的一个或更多动态光学曲线进行数学分析来获得。这种参数还可以通过经验、手动或视觉分析一个或更多所述动态光学曲线来获得。本发明涵盖的动态光学参数的非限制性实例是“积分”、“最大值”、“到最大值的时间”、“到最大值的面积”、“斜度A”和“斜度B”。As used herein, the term "dynamic optical parameter" is meant to include one or more parameters based on which one skilled in the art can characterize tissue (eg, grade tissue). As described herein, such parameters may be obtained by mathematical analysis of one or more dynamic optical curves plotted based on backscattered light intensity over time from cancerous tissue or portions thereof that have been exposed to the biomarker. Such parameters may also be obtained by empirical, manual or visual analysis of one or more of said dynamic optical curves. Non-limiting examples of dynamic optical parameters encompassed by the present invention are "Integral", "Maximum", "Time to Maximum", "Area to Maximum", "Slope A" and "Slope B".
这些动态光学参数的数值是基于利用数字成像系统(DySIS技术,Forth Photonics)获得的那些值,该数字成像系统利用18%反射校准试样校准,以在该系统的绿色通道中对该试样产生0-255灰度量表中的105灰度值。基于该校准方案,最大值被给作以校准单位(0-255级)表示的绿色灰度值最大差异或者被给作反射率最大差异(0-100%级)。The values for these dynamic optical parameters are based on those obtained using a digital imaging system (DySIS technology, Forth Photonics) calibrated with an 18% reflectance calibration sample to produce 105 gray value on the 0-255 gray scale. Based on this calibration scheme, the maximum value is given as the maximum difference in green gray value in calibrated units (0-255 scale) or as the maximum difference in reflectance (0-100% scale).
本文引用的积分截止值是从与τ=240秒积分时间对应的DOC计算出来的:The integration cutoffs quoted in this paper are calculated from the DOC corresponding to τ = 240 seconds integration time:
其中c是换算系数(scaling factor),其中值c=8[τIt=0]-1,或代替c=1/30(强度单位)-1秒-1。It是在施用生物标志物之后指定时间点的发射强度,It=0是在施用生物标志物之前的发射强度。where c is a scaling factor with a value of c=8[τIt=0 ]−1 , or instead of c=1/30 (intensity unit)−1 sec−1 .It is the emission intensity at a given time point after administration of the biomarker, and It=0 is the emission intensity before administration of the biomarker.
到最大值的面积是从同一Itg公式计算的,唯一不同之处在于τ=T最大值。因此,Itg和到最大值的面积的值在本文中都表示为无量纲的量。The area to the maximum is calculated from the same Itg formula, the only difference is that τ =Tmax . Therefore, the values of Itg and area to maximum are expressed herein as dimensionless quantities.
不同的获取、积分时间段和校准方案和样品都可能导致不同的截止值。选择240秒积分时间段作为最佳时间段,它在此处代表一个实例,而不是限制。本文公开的“校准单位”和“无量纲的量”也可以称为“任意单位”。Different acquisition, integration time periods, and calibration protocols and samples may result in different cutoffs. The 240 second integration period was chosen as the optimal period, which here represents an example, not a limit. "Calibrated units" and "dimensionless quantities" disclosed herein may also be referred to as "arbitrary units".
因此,本文引用的值指经过上述特定方案获得的那些值。这为技术人员提供了一种用于比较利用其它成像系统获得的定量值的可容易辨别的方法。Accordingly, the values quoted herein refer to those obtained via the specific protocol described above. This provides the skilled person with an easily discernable method for comparing quantitative values obtained with other imaging systems.
本文所用名词在不限定数量时是指一个或多于一个(即,至少一个)所述对象。例如,“动态光学参数”是指一个或更多个动态光学参数。Nouns are used herein to refer to one or more than one (ie, at least one) of said subject without limiting the number. For example, "dynamic optical parameters" refers to one or more dynamic optical parameters.
本文使用的术语“组织”意思包括任意组织或其部分,包括癌组织和癌前组织。例如,该组织可以是上皮组织、结缔组织、肌肉组织或神经组织。在本发明的一个优选实施方案中,该组织是上皮组织或其部分,例如,覆盖和衬里上皮或腺上皮。例如,该组织可以是宫颈组织;皮肤组织;胃肠道组织,例如口腔组织、胃组织、食管组织、十二指肠组织、小肠组织、大肠组织、胰腺组织、肝组织、胆囊组织或结肠组织;或鼻腔组织。在一个优选实施方案中,该组织是癌前组织或癌组织,例如发育异常(dysplasia)、瘤变(neoplasia)或癌变(cancerous lesion)。As used herein, the term "tissue" is meant to include any tissue or part thereof, including cancerous tissue and precancerous tissue. For example, the tissue can be epithelial tissue, connective tissue, muscle tissue or neural tissue. In a preferred embodiment of the invention, the tissue is epithelial tissue or a part thereof, eg, covering and lining epithelium or glandular epithelium. For example, the tissue can be cervical tissue; skin tissue; gastrointestinal tissue, such as oral tissue, gastric tissue, esophageal tissue, duodenal tissue, small intestinal tissue, large intestine tissue, pancreatic tissue, liver tissue, gallbladder tissue, or colon tissue ; or nasal tissue. In a preferred embodiment, the tissue is precancerous or cancerous tissue, such as a dysplasia, neoplasia or cancerous lesion.
本文使用的短语“表征”癌组织意思包括利用本文所述的方法表征癌组织以便有助于癌组织的筛选、临床诊断、引导活组织检查取样和/或治疗。例如,可以分级癌组织,例如表征为低级(LG)病变(即,HPV感染、炎症或CIN I级病变或其亚组合)或高级(HG)病变(即,CIN II级病变、CIN III级病变或浸润性癌(CA)或其亚组合)。As used herein, the phrase "characterizing" cancerous tissue means to include using the methods described herein to characterize cancerous tissue in order to facilitate screening, clinical diagnosis, guide biopsy sampling, and/or treatment of cancerous tissue. For example, cancerous tissue can be graded, e.g., characterized as low-grade (LG) lesions (i.e., HPV infection, inflammation, or CIN class I lesions or subcombinations thereof) or high-grade (HG) lesions (i.e., CIN class II lesions, CIN class III lesions) or invasive carcinoma (CA) or a subcombination thereof).
本文使用的组织特征包括但不限于组织的结构特征、功能特征和病理状态以及前述项的任意组合。Tissue characteristics as used herein include, but are not limited to, structural characteristics, functional characteristics, and pathological states of tissues, as well as any combination of the foregoing.
有各种程度的宫颈上皮瘤样病变(cervical intraepithelial neoplasia,CIN),以前称为发育异常(dysplasia)。组织学评价的病变通常是利用CIN命名法来表征的;细胞学涂片通常是根据Bethesda系统来分类的;并且宫颈癌通常是基于国际妇产科联盟(FIGO)系统来分期的。I级CIN(轻度发育异常)定义为低于三分之一的上皮衬层生长紊乱;II级CIN(中度发育异常)定义为三分之二的所述衬层异常成熟;III级CIN(严重发育异常)包括多于三分之二的上皮厚度具有原位癌(CIS),这代表全厚度的成熟障碍。对于宫颈发育异常(cervical dysplasia)(即宫颈上皮衬层的生长和发育紊乱)具有公知的分类系统(例如参见DeCherney,A.等人,CurrentObstetric & Gynecologic Diagnosis & Treatment,9th ed.,The McGraw-HillCompanies,New York,NY(2003),其内容通过引用并入本文)。There are various degrees of cervical epithelial neoplasia (cervical intraepithelial neoplasia, CIN), formerly known as dysplasia (dysplasia). Histologically evaluated lesions are usually characterized using the CIN nomenclature; cytology smears are usually classified according to the Bethesda system; and cervical cancer is usually staged based on the International Federation of Gynecology and Obstetrics (FIGO) system. Grade I CIN (mild dysplasia) is defined as dysplasia in less than one-third of the epithelial lining; grade II CIN (moderate dysplasia) is defined as abnormal maturation of two-thirds of said lining; grade III CIN (Severe dysplasia) includes more than two-thirds of the epithelial thickness with carcinoma in situ (CIS), which represents a full-thickness maturation disorder. There is a well-known classification system for cervical dysplasia (i.e., a disorder of the growth and development of the epithelial lining of the cervix) (see, for example, DeCherney, A. et al., Current Obstetric & Gynecologic Diagnosis & Treatment, 9th ed., The McGraw- Hill Companies, New York, NY (2003), the contents of which are incorporated herein by reference).
“参考值”涉及各种动态光学参数(DOP)的预测和截止值,其与组织的特定组织病理状态和/或结构和功能特征相关联并可用于区分它们。"Reference values" relate to predictions and cut-off values of various dynamic optical parameters (DOPs) that are associated with specific histopathological states and/or structural and functional characteristics of tissues and can be used to differentiate them.
图1示出了本发明方法的基本步骤。Figure 1 shows the basic steps of the method of the present invention.
·应用生物标志物之前获取组织的参考图像,102。需要该步骤以记录所检查组织的原始光学性质。• Obtain a reference image of the tissue prior to applying the biomarkers, 102 . This step is required to document the original optical properties of the examined tissue.
·施用生物标志物,例如通过施加器,104。生物标志物施加器还可以提供引发信号以在施用生物标志物之后立即(即少于1秒)开始获取图像,由此确保获取过程的同步化和标准化。• Administering the biomarker, for example via an applicator, 104 . The biomarker applicator can also provide a trigger signal to begin image acquisition immediately (ie, less than 1 second) after biomarker application, thereby ensuring synchronization and standardization of the acquisition process.
·在预定的光谱带内,在约4分钟的预定时间段内以约5到7秒之间的取样或获取速率按时间顺序获取一系列图像,106。该时间段的确定考虑到了生物标志物所引发光学现象的持续时间。本领域技术人员会认识到,该时间段可以从4分钟延长到1或2小时或其间的任意时间间隔,但是可以使用诸如患者舒适性、患者便利性、生物标志物所引发光学现象在一段时间之后的有效性、系统能力(如存储能力和处理能力)以及其它因素之类的因素来确定所期望的时间段。作为替代,可以根据获取的图像数目(例如30个图像、35个图像、40个图像等)测量该时间段。选择光谱带,以便实现生物标志物响应区域和非响应区域之间的最大对比度。• Acquiring a series of images in time sequence, 106, within a predetermined spectral band at a sampling or acquisition rate of between about 5 and 7 seconds over a predetermined period of time of about 4 minutes. The determination of this time period takes into account the duration of the optical phenomenon induced by the biomarker. Those skilled in the art will recognize that this time period can be extended from 4 minutes to 1 or 2 hours or any time interval in between, but can use factors such as patient comfort, patient convenience, biomarker-induced optical phenomena over a period of time Factors such as subsequent availability, system capabilities (such as storage and processing power), and other factors determine the desired time period. Alternatively, the time period may be measured according to the number of images acquired (
·对齐获取的图像,108。该步骤对于获得每个组织点所发射的光强度的时间变化是必要的。与特定图像位置对应的图像像素需要与同一组织点对应。在体内测量的几种情况下,在连续获取组织图像期间由于呼吸等原因存在光学传感器-组织相对运动。可以确保光学传感器和所检查组织区域之间的恒定相对位置,例如通过机械稳定化手段和/或图像对准算法。将所获取图像与参考图像正确对准(102)还确保从与所检测组织的特定位置相对应的每个像素或像素组有效提取DOC。aligning acquired images, 108 . This step is necessary to obtain the temporal variation of the light intensity emitted by each tissue point. Image pixels corresponding to a particular image location need to correspond to the same tissue point. In several cases of in vivo measurements, there is optical sensor-tissue relative motion during continuous acquisition of tissue images due to respiration etc. A constant relative position between the optical sensor and the examined tissue region can be ensured, eg by means of mechanical stabilization and/or image alignment algorithms. Proper alignment (102) of the acquired image with the reference image also ensures efficient extraction of DOC from each pixel or group of pixels corresponding to a particular location of the detected tissue.
·对于选定图像,从获取的所述系列图像中的一些或全部图像计算每个图像位置(即每个像素位置或者由一组像素限定的位置)处的DOC,其代表预定光谱带中作为时间函数的漫反射率[DR]或荧光强度(FI),110。通过所采用生物标志物的性质确定光学性质(DR、FI)的选择,以分别改变漫反射率或荧光特性。如上所述,选择恰当的光谱带以提供生物标志物响应和非响应组织和组织区域之间的最大对比度。在一个示例性实施方案中,将在下文描述的图2~5,显示了从与醋酸溶液(生物标志物)相互作用的对应于各种病理(经组织学分类)的宫颈组织部位获得的DOC曲线。For a selected image, from some or all of the images acquired in the series of images, calculate a DOC at each image location (i.e., each pixel location or a location defined by a group of pixels) representing a predetermined spectral band as Diffuse reflectance [DR] or fluorescence intensity (FI) as a function of time, 110. The choice of optical properties (DR, FI) is determined by the properties of the biomarkers employed to alter the diffuse reflectance or fluorescence properties, respectively. As noted above, the appropriate spectral bands are chosen to provide maximum contrast between biomarker responsive and non-responsive tissue and tissue regions. In an exemplary embodiment, Figures 2-5, described below, show the DOC obtained from cervical tissue sites corresponding to various pathologies (by histological classification) interacted with acetic acid solution (biomarker) curve.
·对于选定图像,从在每个图像位置(即每个像素位置或由一组像素限定的位置)获得的DOC计算DOP,112。获得表达所述现象之动态特征的许多参数。根据生物标志物选择性染色组织异常的效率,DOP潜在地能够提供一种评价体内各种组织病理的定量手段。然后,可以以伪彩图形式显示这些参数,其中不同的颜色代表不同的参数值。这种伪彩图可用于确定病变级别和边界,由此有助于活组织检查取样、治疗以及一般性病变管理。在本发明的一个实施方案中,从表达由生物标志物-组织相互作用产生的光学现象之动态特征的DOC(例如,在选定时间范围内的DOC积分、最大值、斜度,例如在下文表1中所示)计算各种DOP。下文对组织为宫颈上皮而生物标志物为醋酸溶液的情况下(参考图6)提供了指示性DOP的详细分析。• For a selected image, calculate the DOP, 112, from the DOC obtained at each image location (ie each pixel location or a location defined by a group of pixels). A number of parameters characterizing the dynamics of the phenomenon are obtained. Based on the efficiency with which biomarkers selectively stain tissue abnormalities, DOP could potentially provide a quantitative means of assessing various histopathologies in vivo. These parameters can then be displayed as a pseudo-color map, where different colors represent different parameter values. This pseudocolor map can be used to determine lesion grade and boundaries, thereby aiding in biopsy sampling, treatment, and general lesion management. In one embodiment of the invention, the DOC expressing the dynamic characteristics of the optical phenomenon produced by the biomarker-tissue interaction (for example, DOC integral, maximum value, slope over a selected time range, such as in the following shown in Table 1) to calculate various DOPs. A detailed analysis of indicative DOPs is provided below for the case where the tissue is cervical epithelium and the biomarker is acetic acid solution (see Figure 6).
·在另一实施方案中,在统计学上足够的组织群中通过将DOP和DOC与提供明确诊断的标准方法如组织学(金标准)进行比较来试验性确定DOP和DOC的预测值。对于那些显示适当预测值的DOP,确定最好地区分各种病理状态的截止值,116。对于特定的生物标志物和上皮组织,该步骤可以单独进行,而不是作为本方法常规实施的一部分。该步骤对于将DOP和DOC与特定病理状态进行关联是必要的。在建立这种关联之后,就能够基于预定的DOP截止值区分病理状态,120。参照图7~9,下文提供了在组织为宫颈上皮而生物标志物为醋酸的情况下评价各种DOP预测值的详细分析。• In another embodiment, the predictive value of DOP and DOC is experimentally determined in a statistically sufficient tissue population by comparing them with standard methods that provide a definitive diagnosis, such as histology (gold standard). For those DOPs showing appropriate predictive value, the cutoff value that best discriminates the various pathological states was determined, 116. For specific biomarkers and epithelial tissues, this step may be performed alone rather than as part of the routine practice of the method. This step is necessary to correlate DOP and DOC with specific pathological states. Once this association is established, pathological states can be distinguished based on a predetermined DOP cutoff, 120 . Referring to Figures 7-9, the following provides a detailed analysis for evaluating the predictive value of various DOPs when the tissue is cervical epithelium and the biomarker is acetic acid.
·可以以伪彩图形式显示代表不同病理状态和分级的DOP和DOC值,其中不同的颜色代表不同的级别,124。伪彩图表达了能够用于体内分级所述病变以及确定病变边界的病理图,这有助于活组织取样、治疗以及一般性病变管理。· DOP and DOC values representing different pathological states and grades can be displayed in the form of a pseudo-color map, where different colors represent different grades, 124 . The pseudo-color image represents a pathological map that can be used to grade the lesion in vivo and define lesion boundaries, which aids in biopsy, treatment, and general lesion management.
·在本发明的另一实施方案中,基于通过体内和体外实验对生物标志物-组织相互作用的理解和分析,建立了上皮组织的转运现象和结构特征的生物物理模型,114。在通过组织的功能特征来确定上皮传输现象的情况下,以及在以DOP和DOC表达功能特征的情况下,将模型参数与后者关联,从而提供一种用于体内评价组织的功能和结构特征的手段。具体地,可以转换DOP值以表达各种正常和病理状态下组织的功能和/或结构特征,118。值得注意的是,只可以在活组织中确定功能特性,但是可以在体外通过分析组织样品(活组织检查)确定结构特征。本发明方法提供了一种用于体内评价这两种特征的手段,从而实现更完全的上皮系统表征或鉴定。完全的上皮系统表征/鉴定可望提高诊断性能,这是因为各种病理状态影响上皮组织的功能和结构性质。作为实例,并参考使用醋酸溶液作为生物标志物的宫颈癌的情形中的结构现象,将DOP值与表达通过定量病理学方法获得的核密度的定量数据相关联。该关联在图10~11中示出,这能够将DOP转换成核质比。在功能或结构特征的两种情形中,可以产生伪彩图,其中利用不同颜色代表不同的功能和结构特征,122。伪彩图表示组织的功能和/或结构图,其可用于病变的体内分级以及确定病变的边界,有助于活组织检查取样、治疗和一般性病变管理。伪彩图还可以用于体内监测生物学标志物在组织的结构和功能特征中的作用,并因此用于评价生物标志物在突出异常组织区域中的效率。• In another embodiment of the present invention, based on the understanding and analysis of biomarker-tissue interactions through in vivo and in vitro experiments, a biophysical model of the transport phenomena and structural features of epithelial tissues was established, 114 . In cases where epithelial transport phenomena are determined by the functional characteristics of the tissue, and where the functional characteristics are expressed as DOP and DOC, the model parameters are linked to the latter, thus providing a means for evaluating the functional and structural characteristics of the tissue in vivo s method. Specifically, DOP values can be transformed to express functional and/or structural characteristics of tissues in various normal and pathological states, 118 . It is worth noting that functional properties can only be determined in living tissue, but structural features can be determined in vitro by analyzing tissue samples (biopsies). The methods of the present invention provide a means for evaluating these two features in vivo, allowing for a more complete characterization or identification of epithelial systems. Complete epithelial system characterization/identification is expected to improve diagnostic performance, since various pathological conditions affect the functional and structural properties of epithelial tissue. As an example, and with reference to structural phenomena in the case of cervical cancer using acetic acid solutions as biomarkers, DOP values were correlated with quantitative data expressing nuclear densities obtained by quantitative pathology methods. This correlation is shown in Figures 10-11, which enables the conversion of DOP to nucleoplasmic ratio. In both cases of functional or structural features, a pseudo-color map can be generated in which different colors are used to represent different functional and structural features, 122 . Pseudo-color maps represent functional and/or structural maps of tissues, which can be used for in vivo grading of lesions as well as defining lesion boundaries, aiding in biopsy sampling, treatment, and general lesion management. Pseudocolor maps can also be used in vivo to monitor the role of biomarkers in structural and functional features of tissues, and thus to evaluate the efficiency of biomarkers in highlighting abnormal tissue regions.
作为宫颈组织情形下本发明的一个示例性实施方案,确定最好地区分各种状况(包括正常、HPV(人乳头瘤病毒)感染、炎症和不同级别的宫颈上皮内瘤样病变(CIN))的合适DOP和相应的截止值。使用3-5%的醋酸溶液作为生物标志物,然后进行上述测量程序来获得DOC。为了确定DOC和DOP的预测值,从多中心临床试验获得试验数据,其中登记并检查了308位具有异常巴氏试验的妇女。通过在蓝-绿光谱范围内以时间顺序获取宫颈组织图像来获得DOC。对醋酸溶液响应性组织区域(如DOC和DOP伪彩图所示出的)进行活组织检查并提交用于组织学评价和分级。然后将组织学分类与一组DOP比较,以通过ROC分析确定与组织学分级最佳关联的那些。从ROC曲线中获得每个参数或参数集合的最佳截止值,从而提供期望的SS和SP值。As an exemplary embodiment of the invention in the context of cervical tissue, it was determined that best distinguishes various conditions including normal, HPV (human papillomavirus) infection, inflammation and different grades of cervical intraepithelial neoplasia (CIN) The appropriate DOP and the corresponding cut-off value. A 3-5% acetic acid solution was used as a biomarker, followed by the above measurement procedure to obtain DOC. To determine the predictive value of DOC and DOP, trial data were obtained from a multicenter clinical trial in which 308 women with abnormal Pap tests were enrolled and examined. DOC was obtained by temporally acquiring images of cervical tissue in the blue-green spectral range. Biopsies were taken of acetic acid solution-responsive tissue areas (as shown in DOC and DOP pseudocolor maps) and submitted for histological evaluation and grading. Histological classification was then compared to a set of DOPs to identify those best associated with histological grade by ROC analysis. The optimal cut-off values for each parameter or set of parameters are obtained from the ROC curve, thus providing the desired SS and SP values.
在一个示例性实施方案中,图2到图5显示了从组织学上分别分类为:HPV感染、炎症、CIN1和高级(HG)病变的宫颈组织部位获得的典型DOC。作为临床实践中常用的进一步分类,HPV、炎症、CIN1或其组合称为低级(LG)病变。HG病变对应于CIN2、CIN3或浸润性癌(CA)中任意一种或组合。组织学级别CIN1、CIN2和CIN3是CA的前体(CIN1-最低,CIN3-最高)。纵轴对应于IBSL(以任意单位表示),横轴代表将醋酸施用到组织后过去的时间(秒)。可清楚地看出,与不同病理状态对应的DOC在强度-时间变化方面存在多方面的不同。In an exemplary embodiment, Figures 2 to 5 show typical DOC obtained from cervical tissue sites histologically classified as: HPV infection, inflammation, CIN1 and high grade (HG) lesions, respectively. As a further classification commonly used in clinical practice, HPV, inflammation, CIN1, or a combination thereof are referred to as low-grade (LG) lesions. HG lesions correspond to either or a combination of CIN2, CIN3, or invasive carcinoma (CA). Histological grades CIN1, CIN2, and CIN3 are precursors of CA (CIN1-lowest, CIN3-highest). The vertical axis corresponds to IBSL (expressed in arbitrary units), and the horizontal axis represents the elapsed time (seconds) after the application of acetic acid to the tissue. It can be clearly seen that the DOC corresponding to different pathological states differs in many ways in terms of intensity-time variation.
具体地,可以看出,分类为HPV的曲线几乎按指数增加,然后到达饱和水平,而对应于炎症的曲线则更早达到更高的峰值,然后突然减弱。分类为CIN1的曲线比对应于HPV或炎症的曲线更晚达到其最大值,然后缓慢减弱,其速率明显低于在炎症情形中观察到的。对于HG病变,与在HPV和CIN1中观察到的相比更晚达到曲线最大值,但是达到了更高的值,而减弱速率非常小;比在炎症分类曲线中看到的小得多。与这些发现相比,从正常组织部位获得的DOC在整个测量期间几乎恒定(见图11)。In particular, it can be seen that the curve classified as HPV increases almost exponentially and then reaches a saturation level, while the curve corresponding to inflammation reaches a higher peak earlier and then suddenly weakens. The curve classified as CIN1 reached its maximum later than the curves corresponding to HPV or inflammation, and then decayed slowly, at a rate significantly lower than that observed in the case of inflammation. For HG lesions, the curve maxima were reached later than observed in HPV and CIN1, but at higher values, while the rate of attenuation was very small; much smaller than seen in the inflammation classification curves. In contrast to these findings, the DOC obtained from normal tissue sites was nearly constant throughout the measurement period (see Figure 11).
尽管有帮助,但是与特定病理状态相关对DOC的前述说明是相当定性的。因此,下文描述从动态曲线提取的定量参数,其能够稳健地区分LG和HG病变以及区分HPV感染和HG病变。While helpful, the foregoing descriptions of DOC in relation to specific pathological states are rather qualitative. Therefore, the quantitative parameters extracted from the dynamic curves are described below, which can robustly distinguish LG from HG lesions as well as distinguish HPV infection from HG lesions.
在本发明的一个优选实施方案中,还可以利用数学公式进一步处理从组织获得的DOC,以获得描述与病理状态相关的所记录DOC的各种特征的单个DOP或DOP组合,该数学公式包括但不限于多项式、单-、双-和多指数拟合、线性和非线性分解、或其组合。In a preferred embodiment of the present invention, the DOC obtained from the tissue can also be further processed using a mathematical formula to obtain a single DOP or combination of DOPs describing various features of the recorded DOC related to the pathological state, the mathematical formula including but Not limited to polynomial, single-, double- and multi-exponential fits, linear and nonlinear decompositions, or combinations thereof.
在另一实施方案中,还可以基于所检查组织样品特有的特征(例如,患者年龄、绝经期(对妇女而言))或基于表征接受组织检查之对象的地区性、全球性群体的特征或基于以上两者对所得的DOP进行加权。In another embodiment, it may also be based on characteristics specific to the tissue sample examined (e.g. patient age, menopause (for women)) or on characteristics characterizing a regional, global population of subjects undergoing tissue examination or The resulting DOP is weighted based on the above two.
在本发明方法的另一优选实施方案中,在区分LG和HG病变中具有高诊断价值的DOP如下:In another preferred embodiment of the method of the invention, the DOPs with high diagnostic value in differentiating LG and HG lesions are as follows:
1.最大值1. Maximum value
该参数定义为施用生物标志物之后所记录DOC的最大值和在t=0时DOC值之间的差。This parameter is defined as the difference between the maximum value of DOC recorded after administration of the biomarkers and the DOC value at t=0.
2.积分2. Points
该参数定义为由所记录DOC和与第一DOC实验点相交的时间轴的平行线所包围的面积。针对预定时间段计算积分,其取决于生物标志物-组织相互作用所产生之光学效应的持续时间。在宫颈组织和醋酸溶液(生物标志物)的情形中,对t=0到t=4分钟计算积分。还可以在用封闭型数学形式对所测量曲线取近似之后通过数学公式的积分来分析计算该参数。This parameter is defined as the area enclosed by the recorded DOC and the parallel line of the time axis that intersects the first DOC experimental point. The integral is calculated for a predetermined time period, which depends on the duration of the optical effect produced by the biomarker-tissue interaction. In the case of cervical tissue and acetic acid solution (biomarker), integration was calculated from t=0 to t=4 minutes. This parameter can also be calculated analytically by integration of the mathematical formula after approximating the measured curve in a closed form mathematical form.
3.T最大值3.Tmax
该参数定义为达到DOC最大值所需的时间,其中所述最大值是“最大值”参数。This parameter is defined as the time required to reach the maximum value of the DOC, where said maximum value is the "maximum value" parameter.
4.到最大值的面积4. Area to maximum value
该参数定义为与从t=0秒(即醋酸白化(acetowhiten)现象的起始时间)到t=T最大值的DOC所对应的曲线面积。同样,也可以在用封闭型数学形式对所测量曲线取近似之后通过数学公式的积分来分析计算该参数。This parameter is defined as the area of the curve corresponding to the DOC from t=0 seconds (ie the onset time of the acetowhiten phenomenon) to t=Tmaximum . Likewise, this parameter can also be calculated analytically by integration of mathematical formulas after approximating the measured curves in a closed mathematical form.
5.斜度A5. Slope A
这是一个表达直到“最大”值时强度增加速率的参数。作为指示,它可以作为曲线的第一导数或作为直至“最大”值时中间斜度的平均值来计算。This is a parameter expressing the rate at which the intensity increases up to a "maximum" value. As an indication, it can be calculated as the first derivative of the curve or as the average value of the intermediate slope up to the "maximum" value.
6.斜度B6. Slope B
这是一个表达从曲线“最大”值开始强度降低的速率的参数。作为指示,它可以作为曲线的最后导数或作为从“最大”值开始中间斜度的平均值来计算。This is a parameter expressing the rate at which the intensity decreases from the "maximum" value of the curve. As an indication, it can be calculated either as the last derivative of the curve or as the average of the intermediate slopes from the "maximum" value.
图6在DOC曲线上示出了前述定义参数中的4个:“最大值”、“T最大值”、“斜度A”和“斜度B”。另外两个参数(“积分”和“到最大值的面积”)实际上代表分别由指示点:KLNP和KLM所封闭的面积Fig. 6 shows 4 of the previously defined parameters: "Maximum", "Tmax ", "Slope A" and "Slope B" on the DOC curve. The other two parameters ("integral" and "area to maximum") actually represent the area enclosed by the indicated points: KLNP and KLM respectively
图7示出了针对前述“积分”参数的累积结果的LG/HG ROC分析。ROC曲线下面积是0.83,其含义是高区分度(灵敏度)。Figure 7 shows the LG/HG ROC analysis of the cumulative results for the aforementioned "integration" parameter. The area under the ROC curve was 0.83, which means high discrimination (sensitivity).
图8示出了从对用于定量醋酸白化特征的“积分”参数的各个值进行ROC分析所获得的灵敏度(灰色)和特异性(黑色)曲线。可清楚地看出,对于一定的值,灵敏度和特异性最大同时达到78%。Figure 8 shows the sensitivity (grey) and specificity (black) curves obtained from ROC analysis for various values of the "integration" parameter used to quantify the acetic acid whitening profile. It can be clearly seen that for a certain value, the sensitivity and the specificity simultaneously reach a maximum of 78%.
图9示出了针对LG和HG诊断状态,前述一些参数的平均值(相应的误差线代表95%置信区间),这是通过组织学家进行活组织检查推断出来的。Figure 9 shows the mean values (corresponding error bars represent 95% confidence intervals) for some of the aforementioned parameters for LG and HG diagnostic status, as extrapolated from biopsies performed by histologists.
利用ROC分析计算区分LG和HG病变的最佳值范围,如前文对“积分”参数所示出的。具体地,对于每个参数类型,对跨越整个范围[P最小、P最大]的各个阈值计算真阳性(TP)和假阳性(FP)的百分比,其中P代表特定参数的值。使用其中灵敏度(SS=TP)和特异性(SP=100-FP)大致相互一致的阈值作为区分LG和HG的最佳(截止)值。The optimal value range for distinguishing LG from HG lesions was calculated using ROC analysis, as shown previously for the 'integration' parameter. Specifically, for each parameter type, the percentages of true positives (TP) and false positives (FP) are calculated for respective thresholds across the entire range [Pmin ,Pmax ], where P represents the value of a particular parameter. A threshold value in which sensitivity (SS=TP) and specificity (SP=100-FP) approximately agree with each other was used as the optimal (cut-off) value for distinguishing LG from HG.
表1示出了对于前述定义的一些参数,用于区分LG和HG的最佳值范围,其导致特异性和灵敏度大于60%所示的性能。Table 1 shows, for some of the parameters defined previously, the optimal range of values for differentiating LG from HG, which results in specificities and sensitivities greater than the performance indicated by 60%.
表1 Table 1

*上述参数是利用数字成像系统(DySIS技术,Forth Photonics)获得的,该数字成像系统利用18%反射校准试样校准,以在系统的绿色通道中在0~255灰度量表中对后者产生105的灰度值。基于该校准方案,作为以校准单位(0~255级)表示的绿色灰度值最大差值或作为反射率最大差值(0~100%级)给出最大值。*The above parameters were obtained using a digital imaging system (DySIS technology, Forth Photonics) calibrated using an 18% reflection calibration sample to measure the latter on a 0-255 gray scale in the green channel of the system Produces a grayscale value of 105. Based on this calibration scheme, the maximum value is given as the maximum difference in green gray values in calibration units (0-255 steps) or as the maximum difference in reflectance (0-100% steps).
**所示的积分截止值是从对应于τ=240秒积分时间的DOC计算的:**Integration cutoffs shown are calculated from DOC corresponding to τ = 240 s integration time:
其中c是换算系数,其中c=8[τIt=0]-1或替代c=1/30(强度单位)-1秒-1,It是在施用生物标志物之后在指定时间点的发射强度,It=0是在施用生物标志物之前的发射强度。where c is a scaling factor where c = 8[τIt = 0 ]-1 or alternatively c = 1/30 (intensity units)-1 sec-1 , It is the emission at a specified time point after administration of the biomarker Intensity, It= 0 is the emission intensity before biomarker administration.
因此,从同一Itg公式计算到最大值的面积,唯一的差别在于τ=T最大值。此处的Itg和到面积的最大值都表示为无量纲的量。Therefore, the area to the maximum is calculated from the same Itg formula, with the only difference being that τ =Tmax . Both Itg and the maximum value to the area here are expressed as dimensionless quantities.
不同的获取、积分时间段和校准方案和样品都可能导致不同的截止值。选择240秒积分时间段为最佳时间段,它在此代表一个实例,而不是作为限制。Different acquisition, integration time periods, and calibration protocols and samples may result in different cutoffs. An integration period of 240 seconds was chosen as the optimal period, which represents an example here and not as a limitation.
虽然已经参照具体实施方案显示并描述了本发明,但是本领域技术人员将会理解,在不违背本发明精神和范围的情况下可以对形式和细节进行变化。While the present invention has been shown and described with reference to particular embodiments, workers skilled in the art will understand that changes may be made in form and detail without departing from the spirit and scope of the invention.
基于前述分析,在一个优选的实施方案中,使用具有约480~650的截止值范围的DOC“积分”参数来区分LG和HG病变。Based on the foregoing analysis, in a preferred embodiment, a DOC "integration" parameter with a cut-off range of about 480-650 is used to distinguish LG from HG lesions.
在另一优选实施方案中,使用具有约70~90或35%~45%的截止值范围的DOC“最大值”参数来区分LG和HG病变。In another preferred embodiment, a DOC "maximum" parameter with a cutoff range of about 70-90 or 35%-45% is used to distinguish LG from HG lesions.
在又一实施方案中,使用具有约120~170的截止值范围的“到最大值的面积”参数来区分LG和HG病变。In yet another embodiment, the "area to maximum" parameter with a cutoff range of about 120-170 is used to distinguish LG from HG lesions.
在又一实施方案中,使用具有约80~100秒的截止值范围的“T最大值”参数来区分LG和HG病变。In yet another embodiment, the "Tmax " parameter with a cut-off range of about 80-100 seconds is used to distinguish between LG and HG lesions.
在另一个优选实施方案中,使用具有约1.1~1.3值范围的“斜度A”参数来区分LG和HG病变。In another preferred embodiment, a "slope A" parameter with a value range of about 1.1 to 1.3 is used to distinguish LG from HG lesions.
在再一实施方案中,使用具有约-0.012~-0.090的截止值范围的“斜度B”参数来区分LG和HG病变。In yet another embodiment, the "Slope B" parameter with a cutoff range of about -0.012 to -0.090 is used to differentiate between LG and HG lesions.
还可以进行类似的分析来获得前述参数的合适截止值,以用于区分HPV感染和HG病变。Similar analyzes can also be performed to obtain suitable cut-off values for the aforementioned parameters for distinguishing HPV infection from HG lesions.
表2示出了对区分HPV/HG产生大于60%的特异性和灵敏度的“最大值”和“积分”参数的最佳值范围。Table 2 shows the optimal value ranges for the "Maximum" and "Integral" parameters for distinguishing HPV/HG yielding greater than 60% specificity and sensitivity.
表2 Table 2
在一个优选的实施方案中,使用具有约380~490的截止值范围的DOC“积分”参数来区分HPV感染和HG病变。In a preferred embodiment, a DOC "integration" parameter with a cutoff range of about 380-490 is used to distinguish HPV infection from HG lesions.
在另一个实施方案中,使用具有约65~90的截止值范围的DOC“最大值”参数来区分HPV感染和HG病变。In another embodiment, the DOC "Maximum" parameter with a cutoff range of about 65-90 is used to distinguish HPV infection from HG lesions.
在又一实施方案中,包括但不限于上述参数的参数组合可以提供一种用于确定组织病理学的手段。例如,该参数可以是在施用所述生物标志物之后直至约40秒取样时间的平均斜度DOC与最大值的乘积。大于约2.05±0.2(校准强度单位/时间)的乘积值可以指示高级瘤变的存在,而较低的值可以指示低级瘤变或健康组织。In yet another embodiment, a combination of parameters including, but not limited to, the parameters described above may provide a means for determining histopathology. For example, the parameter can be the product of the mean slope DOC and the maximum value up to a sampling time of about 40 seconds after administration of the biomarker. Product values greater than about 2.05±0.2 (calibrated intensity units/time) may indicate the presence of a high-grade neoplasia, while lower values may indicate low-grade neoplasia or healthy tissue.
除了使用截止参数值来区分LG和HG病变或区分HPV和HG病变的“硬聚类”(hard-clustering)方法之外,可以采用更高级的统计和模式识别分析技术(例如贝叶斯分类、人工神经网络(ANN)、分类树)来提取其它线性或非线性的、单个参数或多参数组合以获得高度区分。在又一个实施方案中,采用利用贝叶斯建模的参数方法(例如描述于FukunagaK.(1990)New York:Academic,2nd Ed.中)和利用ANN的非参数方法(学习矢量量子化(Learning Vector Quantization)-LVQ,例如描述于KohonenT.,(1986)Int.J.Quant.Chem.,Suppl.13,209-21中)以用于区分从具有LG和HG瘤变的组织部位的对应DOC所获得的DOP。对于贝叶斯和NN分类,针对前述光学参数的各种组合,以及针对选自总体样品的不同数目的训练集,LG和HG病变的总体区分性能高于75%。In addition to "hard-clustering" approaches that use cutoff parameter values to distinguish LG from HG lesions or HPV from HG lesions, more advanced statistical and pattern recognition analysis techniques (e.g., Bayesian classification, Artificial neural network (ANN), classification tree) to extract other linear or nonlinear, single parameter or multi-parameter combination to obtain high degree of discrimination. In yet another embodiment, a parametric approach using Bayesian modeling (such as described in Fukunaga K. (1990) New York: Academic,2nd Ed.) and a non-parametric approach using ANNs (Learning Vector Quantization ( Learning Vector Quantization)-LVQ, e.g. described in KohonenT., (1986) Int.J.Quant.Chem., Suppl.13, 209-21) for distinguishing from corresponding DOP earned by DOC. For Bayesian and NN classification, the overall discrimination performance of LG and HG lesions was higher than 75% for various combinations of the aforementioned optical parameters, and for different numbers of training sets selected from the population samples.
在另一实施方案中,本发明包括一种用于通过对动态参数值以及显示该疾病存在的对应截止值作图以自动进行宫颈筛选的手段。In another embodiment, the invention comprises a means for automated cervical screening by plotting dynamic parameter values and corresponding cut-off values indicating the presence of the disease.
在又一实施方案中,本发明包括一种通过对动态参数值和显示该疾病存在的相应截止值作图进行半自动阴道镜检查的手段。这种方法确保基线阴道镜检查的性能与专业人员的技能无关,有助于整体诊断程序、随访和在活组织取样和治疗期间的引导。In yet another embodiment, the present invention includes a means for performing semi-automated colposcopy by plotting dynamic parameter values and corresponding cut-off values indicating the presence of the disease. This approach ensures that the performance of the baseline colposcopy is independent of the skill of the professional and contributes to the overall diagnostic procedure, follow-up and guidance during biopsy and treatment.
本发明的另一方面包括通过与上皮的功能和结构变化相关的动态参数给出的醋酸白化现象的解释。在一个实施方案中,计算与宫颈结构性质相关的区别性参数,并与从同一组织部位记录的DOC获得的许多功能特征相关联。具体地,普遍一致认为在核体积和瘤变分级(HPV、CIN 1、CIN 2和CIN 3)或宫颈癌[Walker DC,et al.(2003)PhysiologicalMeasurement,24:1-15]之间有直接关联。表达上皮组织中核密度的核质比(NCR)是用于描述与某些诊断病症的这种关联的最常用参数。在一个优选实施方案中,通过找到前述动态参数中任一个或其组合与从对应宫颈位置提取的活组织检查材料计算的NCR之间的关联公式来评价组织的细胞结构。为此,在将醋酸引入组织区域中之后,将NCR与反映上皮功能异常的DOC参数进行关联。Another aspect of the present invention includes the explanation of the phenomenon of acetowhitening given by dynamic parameters related to the functional and structural changes of the epithelium. In one embodiment, discriminative parameters related to the structural properties of the cervix are calculated and correlated with a number of functional features obtained from DOC recorded from the same tissue site. Specifically, there is general agreement that there is a direct relationship between nuclear volume and neoplastic grade (HPV,
在又一实施方案中,除了代表醋酸白化动力学特性并且突出高核密度的部位的图之外,这种关联能够导致提取出代表所检查宫颈组织每个位置处结构性质的伪彩图。如果想到通过定量从组织获得的体内光学曲线(代表宏观结构组织状态的体内评价),还能够获得有关组织的细胞性能的直接结论(这构成在微观水平下关于其结构的代表性观点),该执行还具有额外的价值。In yet another embodiment, this correlation can result in the extraction of a pseudo-color map representing the structural properties at each location of the cervical tissue examined, in addition to a map representing the kinetics of acetic acid whitening and highlighting sites of high nuclear density. If one thinks that by quantifying the in vivo optical curves obtained from tissues (representing in vivo evaluation of the state of the macrostructural tissue), direct conclusions can also be obtained about the cellular properties of the tissue (which constitute a representative view about its structure at the microscopic level), the Execution also has additional value.
为了对相应数目的上皮组织部位(通过本文公开的方法从其获得了动态参数)计算NCR,在阴道镜检查期间获得了相等数目的宫颈活组织检查样品。该活检组织经过标准程序处理、免疫组化染色并置于载玻片上用于通过显微镜图像分析来进一步评价。在获取等量的显微组织学图像之后,采用多级图像分析算法来分割图像中显示的细胞核[Loukas CG,et al.(2003)Cytometry,55A(1):30-42]。用上皮中包封的核所占据的面积之和除以上皮组织的总面积来计算NCR的量。NCR也称为上皮组织的“细胞堆积”性能,主要代表组织的细胞群体的截面结构。To calculate NCR for a corresponding number of epithelial tissue sites from which dynamic parameters were obtained by the methods disclosed herein, an equal number of cervical biopsy samples were obtained during colposcopy. The biopsies were processed by standard procedures, immunohistochemically stained and mounted on glass slides for further evaluation by microscopic image analysis. After acquiring equal volumes of microhistological images, a multilevel image analysis algorithm was employed to segment the nuclei displayed in the images [Loukas CG, et al. (2003) Cytometry, 55A(1): 30-42]. The amount of NCR was calculated by dividing the sum of the area occupied by the encapsulated nuclei in the epithelium by the total area of the epithelial tissue. NCR, also known as the "cell packing" property of epithelial tissue, primarily represents the cross-sectional structure of the cell population of the tissue.
在一个示意性实施方案中,图10A和10B显示了对NCR表现出最强关联系数(R)的两个不同DOP的散点图。这些参数是如前文定义的动态光学曲线的“积分”和最大值(“最大值”)。图中的线代表线性回归曲线,而从实验数据的最小二乘法拟合获得的DOP到NCR变换方程和关联结果示于表3中。In an illustrative embodiment, Figures 10A and 10B show scatterplots of two different DOPs showing the strongest correlation coefficient (R) to NCR. These parameters are the "integral" and the maximum value ("max") of the dynamic optics curve as defined above. The lines in the figure represent the linear regression curves, while the DOP to NCR transformation equations and correlation results obtained from the least squares fitting of the experimental data are shown in Table 3.
表3 table 3
从该表可见,两个参数与组织的细胞堆积性能都表现出了显著的相关性。在所述方法的一个实施方案中,线性方程将与从特定组织部位获得的DOC对应的DOP变换成组织部位的NCR基本性质。It can be seen from the table that both parameters showed a significant correlation with the cell packing performance of the tissue. In one embodiment of the method, a linear equation transforms a DOP corresponding to a DOC obtained from a particular tissue site into an NCR base property of the tissue site.
在所述方法的另一实施方案中,“积分”或“最大值”的定量伪彩图中的任一个都可以利用前述变换公式变换成上皮组织的NCR图。In another embodiment of the method, either the "integral" or "maximum" quantitative pseudo-color map can be transformed into an NCR map of epithelial tissue using the aforementioned transformation formula.
除了与瘤变发展有关的上皮组织结构变化之外,在施用醋酸溶液之后在上皮的细胞外和细胞内空间中还存在几种功能变化。具体地,已知实体瘤在酸性微环境下存活[Webb SD,at al.(1999)J.Theor.Biol.,196:237-250;Lee AH,et al.(1998)Cancer Research,58:1901-1908;YamagataM et al.(1996)Br.J.Cancer,73:1328-1334;和Marion S,et al.(2000)Molecular Medicine Today,6:15-19]。此外,实验测量表明肿瘤中细胞外pH比正常组织平均低0.5个单位,肿瘤的细胞外pH通常在[6.6~7.0]的范围内(见[Yamagata M et al.(1996)Br.J.Cancer,73:1328-1334])。肿瘤细胞还具有中性或微碱性的细胞内pH[Marion S,et al.(2000)MolecularMedicine Today,6:15-19]。与正常细胞类似,肿瘤细胞在窄范围内调节它们的细胞质pH以提供有利于各种细胞内活动的环境。In addition to the structural changes of the epithelium associated with the development of neoplasia, there were several functional changes in the extracellular and intracellular spaces of the epithelium after application of the acetic acid solution. Specifically, solid tumors are known to survive in an acidic microenvironment [Webb SD, at al. (1999) J. Theor. Biol., 196: 237-250; Lee AH, et al. (1998) Cancer Research, 58: 1901-1908; Yamagata M et al. (1996) Br. J. Cancer, 73: 1328-1334; and Marion S, et al. (2000) Molecular Medicine Today, 6: 15-19]. In addition, experimental measurements show that the extracellular pH in tumors is 0.5 units lower than that in normal tissues on average, and the extracellular pH of tumors is usually in the range of [6.6-7.0] (see [Yamagata M et al. (1996) Br.J.Cancer , 73: 1328-1334]). Tumor cells also have a neutral or slightly alkaline intracellular pH [Marion S, et al. (2000) Molecular Medicine Today, 6: 15-19]. Like normal cells, tumor cells regulate their cytoplasmic pH within a narrow range to provide an environment conducive to various intracellular activities.
尽管关于肿瘤中存在细胞外酸性pH的问题还存在争议,但是一般相信肿瘤的酸性环境起因于高的代谢酸(例如乳酸)生产率和效率低下的从细胞外空间的去除能力[Webb SD,at al.(1999)J.Theor.Biol.,196:237-250;Lee AH,et al.(1998)Cancer Research,58:1901-1908;Marion S,et al.(2000)Molecular Medicine Today,6:15-19;和Prescott DM,et al.(2000)Clinical Cancer Research,6;(6):2501-2505]。此外,肿瘤细胞具有高的糖酵解速率,这与它们的供氧水平无关。因此,从细胞环境产生出大量的乳酸(以及H+)。由于诸如脉管系统紊乱或淋巴引流不良和间隙压力升高等许多因素,酸清除(H+清除)(到血液中)非常慢,由此在肿瘤细胞的细胞外和细胞内空间之间观察到反转的pH梯度[Webb SD,at al.(1999)J.Theor.Biol.,196:237-250;Lee AH,et al.(1998)Cancer Research,58:1901-1908;Yamagata M et al.(1996)Br.J.Cancer,73:1328-1334;和Marion S,et al.(2000)Molecular Medicine Today,6:15-19]。假设癌是过渡性过程且CIN是前癌,则也有理由认为CIN的细胞外环境也是酸性的(可能是较弱的酸性)。而且,已知肿瘤以及发育异常的细胞采用与正常细胞相同的短期[Marion S,et al.(2000)Molecular Medicine Today,6:15-19]和长期[Lee AH,et al.(1998)Cancer Research,58:1901-1908;Yamagata Met al.(1996)Br.J.Cancer,73:1328-1334和Prescott DM,et al.(2000)Clinical Cancer Research,6;(6):2501-2505]的pH调节机制。肿瘤细胞代谢产生的过量质子经过特异性氢泵从细胞排泄掉[Prescott DM,et al.(2000)Clinical Cancer Research,6;(6):2501-2505]。Although there is controversy regarding the presence of extracellular acidic pH in tumors, it is generally believed that the acidic environment of tumors results from high production rates of metabolic acids (e.g., lactate) and inefficient removal from the extracellular space [Webb SD, at al .(1999) J.Theor.Biol., 196: 237-250; Lee AH, et al. (1998) Cancer Research, 58: 1901-1908; Marion S, et al. (2000) Molecular Medicine Today, 6: 15-19; and Prescott DM, et al. (2000) Clinical Cancer Research, 6; (6):2501-2505]. Furthermore, tumor cells have a high rate of glycolysis independent of their oxygen supply level. Consequently, large amounts of lactic acid (and H+ ) are produced from the cellular environment. Acid clearance (H+ clearance) (into the blood) is very slow due to many factors such as vasculature disturbance or poor lymphatic drainage and elevated interstitial pressure, whereby a reverse reaction is observed between the extracellular and intracellular spaces of tumor cells. Transduced pH gradient [Webb SD, at al. (1999) J. Theor. Biol., 196: 237-250; Lee AH, et al. (1998) Cancer Research, 58: 1901-1908; Yamagata M et al. (1996) Br. J. Cancer, 73: 1328-1334; and Marion S, et al. (2000) Molecular Medicine Today, 6: 15-19]. Given that carcinoma is a transitional process and CIN is precancerous, it is also reasonable to assume that the extracellular environment of CIN is also acidic (possibly less acidic). Moreover, it is known that tumors and dysplastic cells adopt the same short-term [Marion S, et al. (2000) Molecular Medicine Today, 6: 15-19] and long-term [Lee AH, et al. (1998) Cancer Research, 58: 1901-1908; Yamagata Metal. (1996) Br. J. Cancer, 73: 1328-1334 and Prescott DM, et al. (2000) Clinical Cancer Research, 6; (6): 2501-2505] pH adjustment mechanism. Excess protons produced by tumor cell metabolism are excreted from cells through specific hydrogen pumps [Prescott DM, et al. (2000) Clinical Cancer Research, 6; (6): 2501-2505].
在宫颈中观察的醋酸白化效应用于阴道镜检查术中来表征异常组织(即HPV、CIN或癌症)。醋酸白化效应是指将醋酸溶液施用到宫颈转化区所引发的现象。醋酸的施用选择性诱导异常宫颈区域的暂时变白。尽管它已经在临床实践中用于定位异常区域超过70年,但是组织变白所涉及的确切物理化学机制仍然是未知的。当采用甲酸、丙酸和丁酸作为生物标志物时观察到了类似的现象。The bleaching effect of acetic acid observed in the cervix is used during colposcopy to characterize abnormal tissue (ie HPV, CIN or cancer). The acetic acid whitening effect refers to the phenomenon induced by the application of acetic acid solution to the cervical transformation zone. Administration of acetic acid selectively induces temporary whitening of the abnormal cervical region. Although it has been used in clinical practice to locate abnormal areas for over 70 years, the exact physicochemical mechanisms involved in tissue blanching remain unknown. A similar phenomenon was observed when using formate, propionate, and butyrate as biomarkers.
对解释醋酸白化效应的两种主要解释见于相关文献中。体外研究显示,醋酸效应与某些细胞角蛋白(上皮细胞中存在的蛋白质)的量有关[Maddox P,et al.(1999)Journal of Clinical Pathology,52:41-46和Carrilho C,et al.(2004)Human Pathology,35:546-551]。由于在宫颈瘤变中细胞外环境为酸性,所以局部施用的酸性酸分子没有分解成它的组成离子,并且因此可以被动穿过细胞膜。进入中性pH细胞质后,乙酸分子分解,释放出氢离子和羧酸离子,它们与核内蛋白相互作用,导致选择性改变异常细胞的散射特性。Two main explanations for the bleaching effect of acetic acid are found in the relevant literature. In vitro studies have shown that the effect of acetic acid is related to the amount of certain cytokeratins (proteins present in epithelial cells) [Maddox P, et al. (1999) Journal of Clinical Pathology, 52:41-46 and Carrilho C, et al. (2004) Human Pathology, 35:546-551]. Since the extracellular environment is acidic in cervical neoplasia, topically applied acidic acid molecules are not broken down into their constituent ions and can therefore pass passively across cell membranes. After entering the neutral-pH cytoplasm, the acetic acid molecules decompose, releasing hydrogen ions and carboxylate ions, which interact with intranuclear proteins, leading to selective changes in the scattering properties of abnormal cells.
细胞溶胶的pH值对于这些蛋白质的构象稳定至关重要。在中性pH值下,蛋白质在溶液中是稳定的。随着pH降低,它们变得不稳定和不溶(取决于其pI(等电点))。蛋白质失稳的过程称为变性,这种部分变性是可逆过程,它仅持续若干毫秒。变性或解折叠的蛋白质具有不同的折射率,因此这可能是白化效应的原因。正常细胞中的pH降低可能不足以引起蛋白质解折叠,或许这是在正常组织中未检测到IBSL中变化的原因。因此,反向散射光与宫颈上皮中的醋酸渗透所影响的pH动力学非常相关。然而,有助于该效应的蛋白质并不太确定。而且,这些蛋白质中的各种蛋白质可以在不同的pH值下变性。The pH of the cytosol is critical for the conformational stabilization of these proteins. At neutral pH, proteins are stable in solution. As the pH decreases, they become unstable and insoluble (depending on their pi (isoelectric point)). The process of protein destabilization is called denaturation, and this partial denaturation is a reversible process that lasts only a few milliseconds. Denatured or unfolded proteins have a different refractive index, so this may be responsible for the albino effect. The decrease in pH in normal cells may not be sufficient to cause protein unfolding, and perhaps this is why changes in IBSL were not detected in normal tissues. Therefore, the backscattered light correlates very well with the pH kinetics affected by acetate penetration in the cervical epithelium. However, the proteins that contribute to this effect are less certain. Also, various of these proteins can be denatured at different pH values.
根据另一种解释,醋酸对转化区上皮的作用与其浓度有关[MacLeanAB.(2004)Gynecologic Oncology,95:691-694]。醋酸进入发育异常层的细胞环境中,改变了不同核蛋白的结构,由此使细胞呈现出不透明。因此,反向散射光的动力学遵循醋酸浓度的动力学。在正常组织中没有出现白化的原因是核蛋白的量非常小。According to another explanation, the effect of acetic acid on the epithelium of the transformation zone is related to its concentration [MacLean AB. (2004) Gynecologic Oncology, 95: 691-694]. Acetic acid enters the cellular environment of the dysplastic layer and alters the structure of various nucleoproteins, thereby rendering the cell opaque. Therefore, the kinetics of backscattered light follow the kinetics of the acetic acid concentration. The reason why albinism does not occur in normal tissues is that the amount of nucleoprotein is very small.
基于以上对在瘤变发展期间经历变化的上皮的功能和结构特征的分析,可以将动态光学数据与具有诊断重要性的上皮特征关联起来。具体地,所测量的动态特征可用于将在施用生物标志物之后按时间顺序出现的各种上皮结构和运输现象分开,并将它们与体内可测量的光学参数关联起来,由此对该反问题提供解决方案。换言之,可以通过测量体内动态特征和参数来获得关于各种上皮特征的信息。Based on the above analysis of the functional and structural features of the epithelium that undergoes changes during neoplastic development, dynamic optical data can be correlated with epithelial features of diagnostic importance. Specifically, the measured dynamic features can be used to separate various epithelial structure and trafficking phenomena that occur chronologically after biomarker administration and correlate them with measurable optical parameters in vivo, thereby addressing the inverse problem provide the solution. In other words, information about various epithelial features can be obtained by measuring dynamic features and parameters in vivo.
在所述方法的一个实施方案中,“斜度A”用于获得用于细胞外酸度的信息,并依次用于被动扩散常数以及复层上皮的细胞层数。在所述方法的另一实施方案中,“最大值”用于确定上皮的NCR,这是因为反向散射光的强度与信号源(细胞核)的密度成比例。在所述方法的另一实施方案中,“斜度B”用于获得与调节细胞内pH的细胞功能障碍、脉管系统紊乱的存在和与瘤变发展有关的淋巴引流不良有关的信息。在另一实施方案中,“积分”参数用于获得上述功能特征和结构特征的组合信息。In one embodiment of the method, "Slope A" is used to obtain information for extracellular acidity and, in turn, for passive diffusion constant and cell layer number of stratified epithelium. In another embodiment of the method, "maximum value" is used to determine the NCR of the epithelium, since the intensity of backscattered light is proportional to the density of the signal source (nuclei). In another embodiment of the method, "Slope B" is used to obtain information on cellular dysfunction regulating intracellular pH, the presence of vasculature disorders, and poor lymphatic drainage associated with neoplastic development. In another embodiment, an "integration" parameter is used to obtain combined information of the functional and structural features described above.
该生物物理模型的临床验证已经通过将NCR与前述“最大值”和“积分”参数相关联来进行。然而,功能特征的临床验证在临床上是行不通的,这是因为缺乏能够在体内测量这些特征的参考方法。相反,基于其记录、分析和显示在体内从与生物标志物相互作用的组织获得的动态光学特性的固有能力,本文所公开的方法能够来建模和预测组织的体内功能特征。Clinical validation of this biophysical model has been performed by correlating NCR with the aforementioned "maximum" and "integral" parameters. However, clinical validation of functional signatures is clinically infeasible due to the lack of reference methods capable of measuring these signatures in vivo. Rather, the methods disclosed herein enable modeling and prediction of in vivo functional characteristics of tissues based on their inherent ability to record, analyze and visualize in vivo dynamic optical properties obtained from tissues interacting with biomarkers.
图12描述了本发明的另一示例性实施方案。计算设备1070执行在计算机可读介质上体现的指令,所述指令至少限定在图像处理引擎1085中示出的步骤,并且与用于获得组织图像数据的硬件设置联用。具体地,用光源1010连续照射组织1020。在通过施加器1030施用合适的生物标志物之后,提供触发信号来启动用图像获取设备1040(如视频CCD和其它合适的图像获取设备)获取图像。在组织1020和图像获取设备1040之间是滤光器1050和透镜1060,例如,可以插入一个或更多个可变焦透镜。滤光器1050可以调节至优选的光谱带,在该优选的光谱带下,在施用合适试剂之后,在其光学反射率或荧光特征经历不同级别变化的区域之间获得最大的对比度。Figure 12 depicts another exemplary embodiment of the present invention.
在施药之前,获得组织的图像作为参照。在施药之后,在预定的光谱带中、在预定时间段内按时间顺序获得一系列图像1080,并且存储在计算机设备1070内部或外部的记忆体(memory)或存储器中,用于由图像处理引擎1085进一步处理。在将一些或全部所获取的图像正确对齐之后,对与相同组织点对应的特定图像位置生成DOC1090。在步骤1100中,从DOC获得表示所述现象的动态特征的许多动态光学参数,1100。Prior to drug administration, images of the tissue were obtained as a reference. After administration, a series of
在提取DOP之后,在步骤1110中,可以将它们的值与预定截止值比较,进而在步骤1120中将组织的各种病理状态分类。作为一种结果,然后可以将伪彩图1130显示在显示设备1140上,该伪彩图1130以不同的颜色或灰度代表不同的病理。作为替代,可以存储组织的各种病理状态的分类,以用于再次显示或通过例如信息包或适用于在网络环境下传输数据的其它合适单元发送到另一计算设备。After the DOPs are extracted, in
作为替代,在步骤1150中,可以利用预定的数学公式将DOP的值变换成表达组织的功能和结构特征。在该情况下,可以将伪彩图1130显示在显示设备1140上,其中以不同的颜色或灰度代表不同的功能和结构特征。Alternatively, in
本申请全文所引用的全部文献、数字、专利和公开的专利申请通过引用并入本文。All references, figures, patents and published patent applications cited throughout this application are hereby incorporated by reference.
本领域的技术人员将会承认,或仅利用常规实验就能够确定,本文所述的本发明具体实施方案的许多等同方案。这些等同方案也将包括在所附权利要求的范围内。Those skilled in the art will recognize, or be able to ascertain using no more than routine experimentation, many equivalents to the specific embodiments of the invention described herein. Such equivalents are also intended to be within the scope of the appended claims.
Claims (20)


Applications Claiming Priority (3)
| Application Number | Priority Date | Filing Date | Title |
|---|---|---|---|
| US81093006P | 2006-06-05 | 2006-06-05 | |
| US60/810,930 | 2006-06-05 | ||
| PCT/GB2007/002067WO2008001037A2 (en) | 2006-06-05 | 2007-06-05 | Methods for characterizing tissues |
Publications (2)
| Publication Number | Publication Date |
|---|---|
| CN101460090A CN101460090A (en) | 2009-06-17 |
| CN101460090Btrue CN101460090B (en) | 2013-11-20 |
Family
ID=38805809
Family Applications (1)
| Application Number | Title | Priority Date | Filing Date |
|---|---|---|---|
| CN2007800206182AExpired - Fee RelatedCN101460090B (en) | 2006-06-05 | 2007-06-05 | Methods for Characterizing Tissues |
Country Status (9)
| Country | Link |
|---|---|
| US (1) | US8340745B2 (en) |
| EP (1) | EP1978867B1 (en) |
| JP (1) | JP5410274B2 (en) |
| CN (1) | CN101460090B (en) |
| AT (1) | ATE510492T1 (en) |
| AU (1) | AU2007263622B2 (en) |
| CA (1) | CA2652010C (en) |
| RU (1) | RU2008152386A (en) |
| WO (1) | WO2008001037A2 (en) |
Families Citing this family (13)
| Publication number | Priority date | Publication date | Assignee | Title |
|---|---|---|---|---|
| WO2010006513A1 (en)* | 2008-07-15 | 2010-01-21 | Zeng Kun | Portable diagnostic equipment for precancerous lesion of cervical cancer |
| CN102282569A (en)* | 2008-10-10 | 2011-12-14 | 国际科学技术医疗系统有限责任公司 | Methods for tissue classification in cervical imagery |
| US9788728B2 (en)* | 2009-01-23 | 2017-10-17 | Beth Israel Deaconess Medical Center, Inc. | Endoscopic polarized multispectral light scattering scanning method |
| WO2013109130A1 (en)* | 2012-01-18 | 2013-07-25 | Joel Gerardo Diaz Sanchez | Colpostereoscope for photodynamic diagnosis (pdd) of diseases of the female genital tract and early detection of neoplastic lesions |
| US9514556B2 (en)* | 2012-01-31 | 2016-12-06 | Given Imaging Ltd. | System and method for displaying motility events in an in vivo image stream |
| KR101489163B1 (en)* | 2013-07-25 | 2015-02-03 | 전북대학교산학협력단 | Automated cervical cancer diagnosis method and system |
| US9916658B2 (en) | 2013-09-19 | 2018-03-13 | Keio University | Disease analysis apparatus, control method, and program |
| CN107530452A (en) | 2015-02-02 | 2018-01-02 | 诺瓦达克技术公司 | Methods and systems for characterizing tissue of a subject |
| WO2018018160A1 (en) | 2016-07-29 | 2018-02-01 | Novadaq Technologies ULC | Methods and systems for characterizing tissue of a subject utilizing machine learning |
| CN107274386B (en)* | 2017-05-18 | 2019-12-17 | 深思考人工智能机器人科技(北京)有限公司 | artificial intelligent auxiliary cervical cell fluid-based smear reading system |
| TWI631532B (en)* | 2017-08-16 | 2018-08-01 | 台達電子工業股份有限公司 | Examination system and method thereof |
| GB201812050D0 (en) | 2018-07-24 | 2018-09-05 | Dysis Medical Ltd | Computer classification of biological tissue |
| US12007550B2 (en)* | 2019-06-20 | 2024-06-11 | Cilag Gmbh International | Driving light emissions according to a jitter specification in a spectral imaging system |
Citations (2)
| Publication number | Priority date | Publication date | Assignee | Title |
|---|---|---|---|---|
| WO2001072214A1 (en)* | 2000-03-28 | 2001-10-04 | Foundation For Research And Technology-Hellas | Method and system for characterization and mapping of tissue lesions |
| WO2003077750A1 (en)* | 2002-03-13 | 2003-09-25 | Tufts University | Optical imaging and oximetry of tissue |
Family Cites Families (6)
| Publication number | Priority date | Publication date | Assignee | Title |
|---|---|---|---|---|
| EP1057024A4 (en)* | 1998-02-23 | 2002-10-30 | Diadexus Inc | Methods using pla 2? as a marker of metastases and for the diagnosis of selected cancers |
| US6902935B2 (en)* | 1999-12-15 | 2005-06-07 | Medispectra, Inc. | Methods of monitoring effects of chemical agents on a sample |
| FI20010019L (en)* | 2001-01-05 | 2002-07-06 | Biohit Oyj | Method for diagnosing atrophic |
| US20040073120A1 (en)* | 2002-04-05 | 2004-04-15 | Massachusetts Institute Of Technology | Systems and methods for spectroscopy of biological tissue |
| US6933154B2 (en) | 2002-07-09 | 2005-08-23 | Medispectra, Inc. | Optimal windows for obtaining optical data for characterization of tissue samples |
| AU2003271456A1 (en)* | 2002-09-26 | 2004-04-19 | Mount Sinai Hospital | Methods for detecting endocrine cancer |
- 2007
- 2007-06-05CACA2652010Apatent/CA2652010C/enactiveActive
- 2007-06-05CNCN2007800206182Apatent/CN101460090B/ennot_activeExpired - Fee Related
- 2007-06-05EPEP07823884Apatent/EP1978867B1/ennot_activeNot-in-force
- 2007-06-05ATAT07823884Tpatent/ATE510492T1/ennot_activeIP Right Cessation
- 2007-06-05WOPCT/GB2007/002067patent/WO2008001037A2/enactiveApplication Filing
- 2007-06-05USUS11/810,699patent/US8340745B2/ennot_activeExpired - Fee Related
- 2007-06-05AUAU2007263622Apatent/AU2007263622B2/ennot_activeCeased
- 2007-06-05JPJP2009513758Apatent/JP5410274B2/ennot_activeExpired - Fee Related
- 2007-06-05RURU2008152386/14Apatent/RU2008152386A/ennot_activeApplication Discontinuation
Patent Citations (2)
| Publication number | Priority date | Publication date | Assignee | Title |
|---|---|---|---|---|
| WO2001072214A1 (en)* | 2000-03-28 | 2001-10-04 | Foundation For Research And Technology-Hellas | Method and system for characterization and mapping of tissue lesions |
| WO2003077750A1 (en)* | 2002-03-13 | 2003-09-25 | Tufts University | Optical imaging and oximetry of tissue |
Also Published As
| Publication number | Publication date |
|---|---|
| WO2008001037A2 (en) | 2008-01-03 |
| JP2009539366A (en) | 2009-11-19 |
| JP5410274B2 (en) | 2014-02-05 |
| CA2652010C (en) | 2016-01-05 |
| AU2007263622A1 (en) | 2008-01-03 |
| US20080039720A1 (en) | 2008-02-14 |
| RU2008152386A (en) | 2010-07-20 |
| AU2007263622B2 (en) | 2013-05-30 |
| EP1978867B1 (en) | 2011-05-25 |
| US8340745B2 (en) | 2012-12-25 |
| CN101460090A (en) | 2009-06-17 |
| EP1978867A2 (en) | 2008-10-15 |
| CA2652010A1 (en) | 2008-01-03 |
| HK1131323A1 (en) | 2010-01-22 |
| ATE510492T1 (en) | 2011-06-15 |
| WO2008001037A3 (en) | 2008-03-06 |
Similar Documents
| Publication | Publication Date | Title |
|---|---|---|
| CN101460090B (en) | Methods for Characterizing Tissues | |
| AU2015284810B2 (en) | Raman spectroscopy system, apparatus, and method for analyzing, characterizing, and/or diagnosing a type or nature of a sample or a tissue such as an abnormal growth | |
| JP5684452B2 (en) | System, method and software apparatus for evaluating information related to anatomical structures by optical interferometry | |
| US8649849B2 (en) | Optical methods to intraoperatively detect positive prostate and kidney cancer margins | |
| Yan et al. | Tongue squamous cell carcinoma discrimination with Raman spectroscopy and convolutional neural networks | |
| Terry et al. | Detection of dysplasia in Barrett's esophagus with in vivo depth-resolved nuclear morphology measurements | |
| Kumashiro et al. | Integrated endoscopic system based on optical imaging and hyperspectral data analysis for colorectal cancer detection | |
| Barroso et al. | Raman spectroscopy for assessment of bone resection margins in mandibulectomy for oral cavity squamous cell carcinoma | |
| CN1302210A (en) | Use of acetic acid as a signal contrast enhancing reagent in fluorescence spectroscopy | |
| Poh et al. | Squamous cell carcinoma and precursor lesions: diagnosis and screening in a technical era | |
| Grillone et al. | The color of cancer: margin guidance for oral cancer resection using elastic scattering spectroscopy | |
| JP5615295B2 (en) | A device for cancer screening using parameters obtained by detecting the initial increase in microvascular blood volume | |
| Wessels et al. | Functional optical coherence tomography of pigmented lesions | |
| Gouveia et al. | In vivo reflectance confocal microscopy can detect the invasive component of lentigo maligna melanoma: prospective analysis and case–control study | |
| CN107847145B (en) | Photonic structures and chemometric pathological systems | |
| Bugter et al. | Detecting head and neck lymph node metastases with white light reflectance spectroscopy; a pilot study | |
| CN113792568B (en) | Methods to identify key features used to determine cell status | |
| CN114295586A (en) | High-precision three-spectrum oxyhemoglobin saturation distribution imaging method | |
| HK1131323B (en) | Methods for characterizing tissues | |
| Park et al. | Artificial intelligence-based gastric cancer detection in the gastric submucosal dissection method via hyperspectral imaging | |
| Lau et al. | Early detection of high-grade squamous intraepithelial lesions in the cervix with quantitative spectroscopic imaging | |
| Sheikhzadeh | Improving cervical neoplasia diagnosis via novel in vivo imaging technologies and deep learning algorithms | |
| Chang | Exploiting Optical Contrasts for Cervical Precancer Diagnosis via Diffuse Reflectance Spectroscopy | |
| Eguizabal et al. | Textural analysis of optical scattering for identification of cancer in breast surgical specimens | |
| Reble | Raman spectroscopy in biological tissue: influence of absorption and scattering and detection of cervical precancer |
Legal Events
| Date | Code | Title | Description |
|---|---|---|---|
| C06 | Publication | ||
| PB01 | Publication | ||
| C10 | Entry into substantive examination | ||
| SE01 | Entry into force of request for substantive examination | ||
| REG | Reference to a national code | Ref country code:HK Ref legal event code:DE Ref document number:1131323 Country of ref document:HK | |
| C14 | Grant of patent or utility model | ||
| GR01 | Patent grant | ||
| REG | Reference to a national code | Ref country code:HK Ref legal event code:GR Ref document number:1131323 Country of ref document:HK | |
| CP01 | Change in the name or title of a patent holder | ||
| CP01 | Change in the name or title of a patent holder | Address after:London, England Patentee after:Dyis Pharmaceutical Co.,Ltd. Address before:London, England Patentee before:Forth Photonics Ltd. | |
| CF01 | Termination of patent right due to non-payment of annual fee | ||
| CF01 | Termination of patent right due to non-payment of annual fee | Granted publication date:20131120 |