CN101366041B - Method of Reservoir Simulation Using Dissolved Gas Flooding Heavy Oil - Google Patents
Method of Reservoir Simulation Using Dissolved Gas Flooding Heavy OilDownload PDFInfo
- Publication number
- CN101366041B CN101366041BCN2006800525037ACN200680052503ACN101366041BCN 101366041 BCN101366041 BCN 101366041BCN 2006800525037 ACN2006800525037 ACN 2006800525037ACN 200680052503 ACN200680052503 ACN 200680052503ACN 101366041 BCN101366041 BCN 101366041B
- Authority
- CN
- China
- Prior art keywords
- reservoir
- gas
- capillary number
- correlationship
- relative permeability
- Prior art date
- Legal status (The legal status is an assumption and is not a legal conclusion. Google has not performed a legal analysis and makes no representation as to the accuracy of the status listed.)
- Expired - Fee Related
Links
Images


Classifications
- E—FIXED CONSTRUCTIONS
- E21—EARTH OR ROCK DRILLING; MINING
- E21B—EARTH OR ROCK DRILLING; OBTAINING OIL, GAS, WATER, SOLUBLE OR MELTABLE MATERIALS OR A SLURRY OF MINERALS FROM WELLS
- E21B47/00—Survey of boreholes or wells
- E21B47/10—Locating fluid leaks, intrusions or movements
Landscapes
- Physics & Mathematics (AREA)
- Life Sciences & Earth Sciences (AREA)
- Engineering & Computer Science (AREA)
- Geology (AREA)
- Mining & Mineral Resources (AREA)
- Geophysics (AREA)
- Environmental & Geological Engineering (AREA)
- Fluid Mechanics (AREA)
- General Life Sciences & Earth Sciences (AREA)
- Geochemistry & Mineralogy (AREA)
- Management, Administration, Business Operations System, And Electronic Commerce (AREA)
- Investigation Of Foundation Soil And Reinforcement Of Foundation Soil By Compacting Or Drainage (AREA)
Abstract
Description
Translated fromChinese技术领域technical field
本发明总体涉及用于预测地下储层中的流体流的储层模拟的方法和系统,更特别地,涉及通过考虑由于溶气驱重油(heavy oil solutiongas drive)对流体流的影响来提高储层性能预测。The present invention relates generally to methods and systems for reservoir simulation for predicting fluid flow in subterranean reservoirs, and more particularly, to improving reservoir performance by taking into account the impact of fluid flow due to heavy oil solution gas drive. performance prediction.
背景技术Background technique
储层模拟用于预测地下储层中的流体流。流体流可以包括油、气和水。这种储层预测对于储层管理和估计储层的潜在开采量很重要。Reservoir simulations are used to predict fluid flow in subterranean reservoirs. Fluid streams may include oil, gas and water. Such reservoir prediction is important for reservoir management and for estimating the potential recovery of a reservoir.
储层模拟在石油工业和科学文献中众所周知。关于储层模拟的原理的一本好的入门书是K.Aziz和A.Settari的Petroleum ReserviorSimulation,Elsevier Applied Science Publishers,London(1979)。另外,在Watts III等人的美国专利No.6,052,520中描述了一般如何进行储层模拟的说明。这些参考文献的全部内容在此引入作为参考。Reservoir modeling is well known in the petroleum industry and scientific literature. A good primer on the principles of reservoir simulation is Petroleum Reservior Simulation by K. Aziz and A. Settari, Elsevier Applied Science Publishers, London (1979). Additionally, an illustration of how reservoir simulations are generally performed is described in US Patent No. 6,052,520 to Watts III et al. The entire contents of these references are hereby incorporated by reference.
下列是在传统的储层模拟中所采取的一般步骤。首先,选择要对其岩石和流体性质进行建模和模拟的储层。储层被建模并被离散化成多个单元。一般以有限差分方程的形式为每一个单元构造非线性控制方程,其表示储层中的岩石和流体的性质。岩石性质的实例包括孔隙度、毛细压力和流体(油、水、气)的每一个相的相对渗透率。流体性质的实例包括油的粘度、油地层因数(B0)、以及每一个单元的压力、温度、和饱和度。这些方程中的非线性项被线性化以便形成用于模拟的每一个时间步长的一组线性方程。然后这些线性方程可被求解以估算未知项(比如单元中的压力和饱和度)的解值。从压力和饱和度的这些值可以估算出其他性质,其包括每个时间步长的来自储层的油、气和水的总生产量。重复进行前述步骤,经过许多这种时间步长来模拟储层中相对于时间的流体流。The following are the general steps taken in conventional reservoir simulation. First, select the reservoir whose rock and fluid properties are to be modeled and simulated. The reservoir is modeled and discretized into cells. Nonlinear governing equations are constructed for each cell, generally in the form of finite difference equations, that represent the properties of rock and fluid in the reservoir. Examples of rock properties include porosity, capillary pressure, and relative permeability of each phase of fluid (oil, water, gas). Examples of fluid properties include the viscosity of the oil, the oil formation factor (B0 ), and the pressure, temperature, and saturation of each cell. The non-linear terms in these equations are linearized to form a set of linear equations for each time step of the simulation. These linear equations can then be solved to estimate solution values for unknowns such as pressure and saturation in the cell. From these values of pressure and saturation other properties can be estimated including the total production of oil, gas and water from the reservoir at each time step. The preceding steps are repeated over many such time steps to simulate fluid flow in the reservoir with respect to time.
储层模拟中所需的关键性质中的一个是待流经的岩石的渗透率。绝对渗透率K是岩石传送流的能力的量度,而且可能在储层和周围地层各处变化很大。当气、油和水移动穿过多孔岩石时,它们不会等速运动。而是流体彼此竞相运动。当存在多于一种流体时,相对渗透率kr 是有效渗透率ke与绝对渗透率K的比率。有效渗透率ke是当存在另一个流体时,多孔介质对一种流体所测量的渗透率。相对渗透率kr和饱和度S之间的关系取决于储层岩石和流体,而且在不同地层之间可以改变。此外,相对渗透率kr取决于存在的流体的相对比例,即流体饱和度。One of the key properties required in reservoir simulation is the permeability of the rock to flow through. Absolute permeability K is a measure of the ability of rock to transport flow, and can vary widely throughout the reservoir and surrounding formations. When gas, oil and water move through porous rock, they do not move at constant speeds. Instead, the fluids race against each other. The relative permeability kr is the ratio of the effective permeabilityke to the absolute permeability K when more than one fluid is present. The effective permeability ke is the measured permeability of a porous medium to one fluid in the presence of another fluid. The relationship between relative permeability kr and saturation S depends on reservoir rock and fluids and can vary between formations. Furthermore, the relative permeability kr depends on the relative proportion of the fluids present, i.e. the fluid saturation.
图1说明了气体的典型的相对渗透率krg相对于饱和度Sg的曲线。直到气体饱和度达到最小阈值之前,气体不能以任何可感知的速度流动。参照图1,该阈值被称为临界气体饱和度Sgc0并且起始于近似0.03或大约3%饱和度的值。曲线的另一端是端点相对渗透率krgro0,其为保留在岩石中的残余油的运动最小时的气体相对渗透率值krg。由于储层岩石总是包含最小量的残余油,气体饱和度不会达到100%。饱和度的总百分比必须加起来达100%。在这种情况下,存在最大的76%气体饱和度Sg和24%的残余油饱和度Sorg。从图1中可看出,最大的相对渗透率krgro0发生在接近0.76的饱和度处,这时kr=0.40。Sgc0和krgro0的这些值将被称为气体饱和度Sg和相对渗透率krg的端点基线值。Figure 1 illustrates a typical relative permeability krg versus saturation Sg for a gas. Gas cannot flow at any appreciable velocity until gas saturation reaches a minimum threshold. Referring to Figure 1, this threshold is referred to as critical gas saturation Sgc0 and starts at a value of approximately 0.03 or approximately 3% saturation. The other end of the curve is the endpoint relative permeability krgro0 , which is the gas relative permeability value krg at which the movement of residual oil retained in the rock is minimal. Since the reservoir rock always contains a minimum amount of residual oil, gas saturation will never reach 100%. The total percentages for saturation must add up to 100%. In this case there is a maximum gas saturation Sg of 76% and a residual oil saturation Sorg of 24%. It can be seen from Fig. 1 that the maximum relative permeability krgro0 occurs near the saturation of 0.76, where kr =0.40. These values of Sgc0 and krgro0 will be referred to as endpoint baseline values for gas saturation Sg and relative permeability krg .
理想地,通过对取自将进行储层模拟的储层的岩心试样进行实验室试验来得到相对渗透率曲线。例如,驱替试验可以用于得到相对渗透率krg相对于饱和度Sg的曲线。这种试验众所周知。特别地,在文献E.F.Johnson、D.P.Bossier和V.O.Nauniann的Calculations ofRelative Permeability from Displacement Experiments,Trans.Am.Inst.Mining Engineers,Volume 216,1959,pp.370-378以及S.C.Jones和W.O.Roszelle的Graphical Techniques for DeterminingRelative Permeability from Displacement Experiments,Journal ofPetroleum Engineering,Volume 30,pp.807-817(1978)中描述了公知的驱替试验程序。由于通常认为渗透率曲线基本与气体流动穿过 储层岩石的速度多快无关,因此这些驱替试验通常在低衰竭速度下进行。Ideally, relative permeability curves are obtained by laboratory testing of core samples taken from the reservoir in which the reservoir simulation will be performed. For example, a displacement test can be used to obtain a plot of relative permeabilitykrg versus saturationSg . Such tests are well known. In particular, Calculations of Relative Permeability from Displacement Experiments by EF Johnson, DP Bossier and VONauniann, Trans. , Journal of Petroleum Engineering,
替代地,如果得不到岩心试样,可以从理论上建立相对渗透率krg 相对于饱和度Sg的曲线。例如,曲线可以根据可比的类似储层得到。Alternatively, if core samples are not available, a curve of relative permeabilitykrg versus saturationSg can be theoretically constructed. For example, curves can be derived from comparable similar reservoirs.
一旦已经获得相对渗透率krg相对于饱和度Sg曲线,假定储层模型单元中的饱和度Sg已知,则从这些曲线就能简单地获得将在储层模拟中使用的相对渗透率krg。饱和度Sg一般从在模拟的起始点处建立的初始条件、从模拟的最后的时间步长或者从时间步长的迭代中的计算得知。Once the relative permeability krg versus saturation Sg curves have been obtained, the relative permeability to be used in the reservoir simulation can be obtained simply from these curves, assuming the saturation Sg in the reservoir model cells is known krg . The saturation Sg is generally known from initial conditions established at the start point of the simulation, from the last time step of the simulation or from calculations in iterations of time steps.
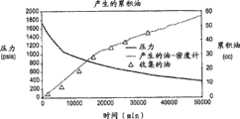
重油的生产量最初主要由油的压力驱动。可以认为重油包括具有200或更小的API重力值的油。当在高储层压力下时,大量的气体常常存在于重油内。在从储层生产出足够量的重油之后,储层部分的压力可以下降到低于泡点压力。在该压力,气体容易从重油溶液中选出。一旦足够的气体已经从油中释放出来,则认为气体形成连续相,而且气体可以流动穿过储层,而且气体的生产率显著提高。如上所述,气体流动开始处的饱和度Sg称为临界气体饱和度或者Sgc。图11显示了从岩心试样产生的累积气体相对于时间(分钟)的曲线图。曲线中所示的断点表示Sgc。The production volume of heavy oil was originally mainly driven by the pressure of the oil. Heavy oils may be considered to include oils having an API Gravity value of200 or less. Large amounts of gas are often present in heavy oil when at high reservoir pressures. After a sufficient amount of heavy oil has been produced from the reservoir, the pressure in the reservoir portion may drop below the bubble point pressure. At this pressure, gas is readily separated from the heavy oil solution. Once enough gas has been released from the oil, the gas is considered to form a continuous phase, and the gas can flow through the reservoir, and the production rate of the gas increases significantly. As noted above, the saturationSg at which gas flow begins is referred to as the critical gas saturation orSgc . Figure 11 shows a graph of cumulative gas production from core samples versus time (minutes). Breakpoints shown in the curves indicate Sgc .
试验表明来自重油储层的油开采量取决于储层的衰竭速度。较高的衰竭速度常常将导致整体提高的油开采量。由于不能很好地理解溶气驱重油的机制,储层模拟器通常利用静态气体相对渗透率krg相对于饱和度Sg的曲线,比如从图1中看到的曲线,其与流体流或衰竭速度不相关。一旦用于待建模的相应类型的岩石的这些曲线建立,不管穿过储层单元的流速如何,曲线将在整个储层模拟过程中保持相同(即Sgc0和krgro0的端点保持固定)。对于包含非重油的含烃地下地层中的一般储层模拟而言渗透率曲线是稳定的假设一般能得到满足。Tests have shown that the amount of oil recovered from a heavy oil reservoir depends on the rate of depletion of the reservoir. Higher depletion rates will often result in overall increased oil recovery. Since the mechanism of solution gas flooding heavy oil is not well understood, reservoir simulators usually use static gas relative permeability krg versus saturation Sg curves, such as the curve seen from Fig. 1, which is related to fluid flow or The rate of exhaustion is not relevant. Once these curves are established for the corresponding type of rock to be modeled, the curves will remain the same throughout the reservoir simulation regardless of the flow rate through the reservoir unit (i.e. the endpoints of Sgc0 and krgro0 remain fixed ). For general reservoir modeling in hydrocarbon-bearing subterranean formations containing non-heavy oil, the assumption that the permeability curve is stable is generally satisfied.
然而,在重油的情况下,不平衡的溶气驱油(“泡沫油”)是影响临界气体饱和度Sgc和油开采量的重要生产机制。当前,对于所有规模(气孔、岩心和矿区)的溶气驱重油的理解是有限的。传统的储层模拟 器在预测储层中的流体流时不能准确地考虑这种溶气驱油。这是常常导致低估重油产量的预测的显著缺点。本发明通过考虑了溶气驱重油的影响来克服这一缺点。However, in the case of heavy oil, unbalanced dissolved gas flooding (“foamy oil”) is an important production mechanism affecting the critical gas saturation Sgc and oil recovery. Currently, understanding of solution gas flooding heavy oil at all scales (pore, core, and field) is limited. Traditional reservoir simulators cannot accurately account for this dissolved gas flooding when predicting fluid flow in the reservoir. This is a significant disadvantage of forecasts that often lead to underestimation of heavy oil production. The present invention overcomes this shortcoming by considering the influence of dissolved gas flooding heavy oil.
发明内容Contents of the invention
本发明公开了一种用于预测在包含含气重油的地下储层中的至少一种流体的性质的方法。例如,该性质可以包括来自储层的流体(即油、气和水)的总生产量。使用储层模拟器进行预测,该储层模拟器使用具有代表储层的多个单元的储层模型。对于至少一些单元以及对于至少一些储层模拟的迭代,气体相对渗透率krg取决于单元中的局部流体速度vo。The present invention discloses a method for predicting the properties of at least one fluid in a subterranean reservoir containing gas-bearing heavy oil. For example, the property may include the total production of fluids (ie, oil, gas, and water) from the reservoir. The prediction is made using a reservoir simulator that uses a reservoir model with a plurality of cells representing the reservoir. For at least some cells and for at least some iterations of the reservoir simulation, the gas relative permeability krg depends on the local fluid velocity vo in the cell.
在本方法的一个优选实施例中,通常基于在慢速的衰竭速度下进行的驱替试验,来得到气体相对渗透率krg相对于气体饱和度Sg的基线相关关系。接着,在临界气体饱和度Sgc与毛细数Nca之间和气体相对渗透率端点Krgro与毛细数Nca之间的至少一个得到与毛细数Nca相关的相关关系,而且最优选在临界气体饱和度Sgc与毛细数Nca之间和气体相对渗透率端点Krgro与毛细数Nca之间都得到与毛细数Nca相关的相关关系。可如何表示这种相关关系的非限制性实例包括(举例来说但不局限于)使用描述曲线的数学方程或者建立相应的查阅表。In a preferred embodiment of the method, a baseline correlation of gas relative permeability krg with respect to gas saturation Sg is obtained, usually based on displacement tests performed at slow depletion rates. Then, at least one of the critical gas saturation Sgc and the capillary numberNca and between the gas relative permeability endpointKrgro and the capillary numberNca is obtained at least one of the correlations related to the capillary numberNca , and most preferably at the critical The relationship between gas saturation Sgc and capillary number Nca and between gas relative permeability endpoint Krgro and capillary number Nca is related to capillary number Nca. Non-limiting examples of how this correlation can be represented include, for example and without limitation, using a mathematical equation describing the curve or building a corresponding look-up table.
然后,可以使用这些通过实验方法获得的与毛细数Nca相关的相关关系结合储层模拟来获得溶气驱重油和衰竭速度对重油和含在重油中的气体的生产的影响。为代表其流体性质待模拟的地下储层的储层模型中的多个单元计算毛细数Nc。Sgc和/或Krgro的值基于为单元计算的毛细数Nc根据与毛细数相关的相关关系选择。然后得到经过调整的基线相关关系。例如,基线曲线的初始端点,即Sgc0和krgro0用新的与毛细数相关的Sgc和Krgro值替代,其间的曲线比如通过线性比例缩放而调整。图2建议经过调整的基线曲线可以通过将初始端点值Sgc0和krgro0改变为其他的Sgc和Krgro值而得到,其部分地基于油流动穿过单元的速度vo。These experimentally obtained correlations with capillary number Nca can then be used in combination with reservoir simulations to obtain solution gas flooding of heavy oil and the effect of depletion rate on the production of heavy oil and gas contained in heavy oil. Capillary numbers Nc are calculated for a plurality of cells in a reservoir model representing the subterranean reservoir whose fluid properties are to be modeled. The values of Sgc and/or Krgro are chosen according to the correlation relation related to capillary number based on the capillary number Nc calculated for the cell. The adjusted baseline correlation is then obtained. For example, the initial endpoints of the baseline curve, namely Sgc0 and krgro0 are replaced with new capillary number-dependent Sgc and Krgro values, and the curves in between are adjusted eg by linear scaling. Figure 2 suggests that adjusted baseline curves can be obtained by changing the initial endpoint values Sgc0 and krgro0 to other values of Sgc and Krgro based in part on the velocity vo of oil flow through the cell.
多个单元的气体相对渗透率krg根据相应的经过调整的基线相关 关系选择。然后,在储层模拟中使用这些相对渗透率krg来预测在包含含气重油的地下储层中的至少一种流体的性质。这种预测的性质可以是油、水或气的生产量。优选地,一旦单元中的饱和度Sg等于或大于临界气体饱和度Sgc的水平,该单元的当前经过调整的基线相关关系在剩余的模拟时间步长中被固定。一旦气体开始流动,该经过调整的基线相关关系的固定有助于在求解用于为储层建模的方程组的过程中保持稳定性。The gas relative permeabilities krg for multiple cells are selected according to the corresponding adjusted baseline correlations. These relative permeability krg are then used in a reservoir simulation to predict the properties of at least one fluid in a subterranean reservoir containing gas-bearing heavy oil. This predicted property could be the production of oil, water or gas. Preferably, once the saturationSg in a cell is equal to or greater than the level of critical gas saturationSgc , the current adjusted baseline correlation for that cell is fixed for the remaining simulation time steps. Once the gas begins to flow, the fixation of this adjusted baseline correlation helps to maintain stability in solving the system of equations used to model the reservoir.
可以使用Sgc或Krgro的与毛细数相关的相关关系中的一个或两个来调整基线相关关系以提出经过调整的基线相关关系。这些经过调整的基线相关关系,通过使用毛细数Nc,获得衰竭速度/流体速度流和粘度在溶气驱重油作用下的重油生产期间对相对渗透率的影响。优选地,在不同衰竭速度下进行衰竭试验以便得到Sgc和Krgro的与毛细数相关的相关关系。然而,如果需要,可通过理论方法预测所述与毛细数相关的相关关系应该是什么样。The baseline correlation can be adjusted using either or both of the capillary number-dependent correlations for Sgc or Krgro to come up with an adjusted baseline correlation. These adjusted baseline correlations capture the effect of depletion velocity/fluid velocity flow and viscosity on relative permeability during heavy oil production with solution gas flooding heavy oil by using capillary numberNc . Preferably, depletion experiments are performed at different depletion rates in order to obtain capillary number-dependent correlations ofSgc andKrgro . However, what the capillary number-dependent correlation should look like can be predicted theoretically, if desired.
可以选择在储层模拟中的时间步长开始处所计算的与毛细数相关的相对渗透率krg。替代地,毛细数Nc可以在时间步长中的迭代期间一直重复计算,以便在模拟期间提供相对渗透率曲线的不断更新。此外,一旦单元中的饱和度Sg在模拟期间保持在临界气体饱和度Sgc处或之上,则优选停止单元的相对渗透率曲线的毛细数Nc的这种更新。The capillary number-dependent relative permeability krg calculated at the beginning of the time step in the reservoir simulation can be selected. Alternatively, the capillary number Nc can be repeatedly calculated throughout the iterations in the time step to provide a constant update of the relative permeability curve during the simulation. Furthermore, such updating of the capillary numberNc of the relative permeability curve of the cell is preferably stopped once the saturationSg in the cell remains at or above the critical gas saturationSgc during the simulation.
本发明的一个目的是通过比传统的储层模拟器更好地考虑由于溶气驱重油对流体流的影响来提高储层性能预测,从而改进地下地层中涉及重油流的储层模拟的预测能力,这可能导致改进储层管理策略。It is an object of the present invention to improve reservoir performance prediction by better considering the effect of heavy oil on fluid flow due to solution gas flooding than conventional reservoir simulators, thereby improving the predictive capability of reservoir simulations involving heavy oil flow in subterranean formations , which could lead to improved reservoir management strategies.
另一个目的是用实验方法在许多不同的衰竭速度下确定岩心试样的临界气体饱和度Sgc值和/或气体相对渗透率端点Krgro的值,以及使这些值与毛细数Nca相关而得到与毛细数相关的相关关系。这些与毛细数Nca相关的相关关系可以结合储层模型和在储层模拟过程中所计算的算出的毛细数Nc一起使用,以便更准确地估计在重油的储层模拟中要使用的相对渗透率krg。Another object is to experimentally determine the values of the critical gas saturation Sgc and/or the gas relative permeability endpoint Krgro of core samples at many different depletion rates, and to relate these values to the capillary number Nca Obtain the correlation relation related to the capillary number. These correlations with respect to the capillary number Nca can be used in conjunction with the reservoir model and the calculated capillary number Nc calculated during the reservoir simulation to more accurately estimate the relative Permeability krg .
附图说明Description of drawings
根据下列说明、所附的权利要求书和附图,将更好地理解本发明的这些和其他目的、特征和优点,其中:These and other objects, features and advantages of the present invention will be better understood from the following description, appended claims and accompanying drawings, in which:
图1显示了传统的气体相对渗透率krg相对于饱和度Sg的曲线;Figure 1 shows the conventional gas relative permeability kr g versus saturation Sg ;
图2描绘了通过将Sgc0和krgro0端点修改为与Sgc与krgro的值一致来调整图1的传统曲线,该Sgc与krgro的值根据Sgc与Nca和Krgro与Nca的与毛细数相关的相关关系来选择;Figure 2 depicts the adjustmentof the conventional curves of Figure 1 by modifying the Sgc0 and krgro0 endpoints to coincide with the values of Sgc andk rgroaccording to Sgc with Nca and Krgro Selected based on the capillary number-related correlation with Nca ;
图3显示了在本发明的一个优选实施例中进行储层模拟所采取的步骤的流程图,其利用了取决于单元中的流体流的局部速度vo的气体相对渗透率krg;Figure 3 shows a flow diagram of the steps taken in a preferred embodiment of the invention to perform a reservoir simulation using the gas relative permeability krg dependent on the local velocity vo of the fluid flow in the cell;
图4显示了用于确定岩心和填砂柱(sandpack)试样的气体饱和度Sg的试验装置的示意图;Figure 4 shows a schematic diagram of the test setup for determining the gas saturationS of core and sandpack samples;
图5描绘了在快速衰竭试验中横跨填砂柱试样的平均填砂柱压力和压差相对于时间的曲线图;Figure 5 depicts the average sand-pack pressure and pressure differential across the sand-pack samples versus time in the rapid depletion test;
图6示出了在图5的快速衰竭试验中所产生的累积的油和气的曲线图;Figure 6 shows a graph of the accumulated oil and gas produced in the rapid depletion test of Figure 5;
图7显示了慢速衰竭试验的平均填砂柱试样压力和流出物(effluent)密度的曲线图;Figure 7 shows a graph of average sand pack sample pressure and effluent density for the slow depletion test;
图8描绘了慢速衰竭试验的平均填砂柱试样压力和所产生的累积的油的曲线图;Figure 8 depicts a graph of the average sand pack sample pressure and the resulting accumulated oil for the slow depletion test;
图9显示了油开采量作为在衰竭速度为0.3和0.03cc/min下所进行的填砂柱试验的平均孔隙压力的函数的曲线图;Figure 9 shows a graph of oil recovery as a function of mean pore pressure for sand pack tests performed at depletion rates of 0.3 and 0.03 cc/min;
图10是油开采量作为在衰竭速度分别为0.082、0.08和0002cc/min下所进行的岩心试验的平均孔隙压力的函数的曲线图;以及Figure 10 is a graph of oil recovery as a function of mean pore pressure for core tests performed at depletion rates of 0.082, 0.08, and 0002 cc/min; and
图11是产生的累积气体(测得的)和产生的累积溶气(计算的)相对于时间的曲线图。Figure 11 is a graph of cumulative gas produced (measured) and cumulative dissolved gas produced (calculated) versus time.
具体实施方式Detailed ways
I.引言I. Introduction
本发明考虑了溶气驱重油的影响,而且更特别地考虑了流体衰竭速度对重油生产的影响。在重油储层模拟中利用与速度或衰竭速度相关的相对渗透率krg值来提供比用传统的储层模拟所获得的储层模拟预测更准确的储层模拟预测。The present invention takes into account the effect of solution gas flooding heavy oil, and more particularly the effect of fluid depletion rate on heavy oil production. Utilizing relative permeability krg values in relation to velocity or depletion velocity in heavy oil reservoir simulations provides more accurate reservoir simulation predictions than those obtained with conventional reservoir simulations.
在一个优选实施例中,为储层单元计算与油速度vo相关的毛细数Nc。这些毛细数Nc用于调整基线相对渗透率相关关系,以考虑速度或衰竭速度对相对渗透率krg的影响。在本优选实施例中,首先,优选基于实验室试验,得到与毛细数Nca相关的临界气体饱和度Sgc和/或端点相对渗透率krgro的相关关系。然后,利用相应于为单元计算的毛细数Nc 的Sgc和/或krgro的值来调整该单元的基线相对渗透率的相关关系。然后基于单元中的饱和度Sg由这些毛细数调整的基线相对渗透率的相关关系选择相对渗透率krg的值。In a preferred embodiment, the capillary number Nc is calculated for the reservoir unit in relation to the oil velocity vo . These capillary numbersNc are used to adjust the baseline relative permeability correlation to account for the effect of velocity or depletion velocity on the relative permeabilitykrg . In this preferred embodiment, first, preferably based on laboratory experiments, the correlation relationship between the critical gas saturation Sgc and/or the endpoint relative permeability krgro related to the capillary number Nca is obtained. The baseline relative permeability correlation for the cell is then adjusted by values ofSgc and/orkrgro corresponding to the capillary numberNc calculated for the cell. A value for the relative permeability krg is then selected based on the correlation of the baseline relative permeabilities adjusted by these capillary numbers based on the saturation Sg in the cell.
图3提供了可以用于进行本发明的溶气驱重油储层模拟的步骤的示例性流程图。在步骤100中,得到krg和Sg之间的基线相关关系。然后在步骤110中得到Sgc和Nca和/或krgro和Nca之间的相关关系。在步骤120中为储层模型中的许多单元计算毛细数Nc。在步骤130中,为这些单元中的每一个建立krg和Sg之间的经过调整的基线相关关系,其取决于Nc和在步骤110中得到的相关关系。然后在步骤140中使用来自单元的饱和度Sg值,从krg和Sg之间的经过调整的基线相关关系为每一个单元选择气体相对渗透率krg。然后在步骤150中,在储层模拟中使用与这些毛细数相关的渗透率krg来预测储层模型中的流体流的性质。Figure 3 provides an exemplary flowchart of the steps that may be used to perform the solution gas drive heavy oil reservoir simulation of the present invention. In
将描述用于建立Sgc和Nca之间以及krgro和Nca之间的相关关系的示例性试验方法的说明。然后,将描述对传统的储层模拟器所进行的修改,通过所述修改来在进行储层模拟时结合衰竭速度/与毛细数相关的Sgc和/或krgro相关关系来选择相对渗透率krg。A description of exemplary experimental methods used to establish correlations between Sgc and Nca and between krgro and Nca will be described. Then, modifications to conventional reservoir simulators to select relative permeability in combination with depletion velocity/capillary number-dependent Sgc and/or krgro correlations when performing reservoir simulations will be described krg .
II.建立相关关系II.Building Relevant Relationships
A.基线气体相对渗透率krg相对于饱和度Sg的相关关系A.Correlation ofbaseline gas relative permeability krgwith respect to saturation Sg
建立气体相对渗透率krg与饱和度Sg之间的相关关系,以使得基于储层模型单元中的已知的饱和度Sg值,相对渗透率值krg可以被储层模 拟器利用。理想地,这些相关关系由来自将进行储层模拟的储层的岩心试样通过试验方法得到。替代地,也可以利用典型的填砂柱和/或合成油来得到相关关系。用于建立这些基线相关关系的优选方法是Johnson、Bossier和Naumann的方法,或者Jones和Roszell的方法,它们在上述的背景技术部分中被引用并且被建立渗透率曲线的技术人员所公知。替代地,存在用于为储层岩石和流体建立气体相对渗透率krg相对于饱和度Sg曲线的许多其他公知的方案。通常,krg将成为Sg的函数。由于实际原因,人们常常将用于krg相关关系中的气体饱和度归一化。在方程12中描述了这种归一化。这种归一化允许模拟器容易地估算用于改变端点(例如Sgc和Sorg)的krg。A correlation between gas relative permeabilitykrg and saturationSg is established such that relative permeability valueskrg can be utilized by the reservoir simulator based on known saturationSg values in reservoirmodel cells. Ideally, these correlations are derived experimentally from core samples from the reservoir in which the reservoir simulation will be performed. Alternatively, correlations can also be derived using typical sand packs and/or synthetic oils. The preferred methods for establishing these baseline correlations are the methods of Johnson, Bossier and Naumann, or the methods of Jones and Roszell, cited above in the Background section and known to those skilled in the art of establishing permeability curves. Alternatively, there are many other well-known schemes for establishing gas relative permeability krg versus saturation Sg curves for reservoir rocks and fluids. In general, krg will be a function of Sg . For practical reasons, one often normalizes the gas saturation used in the krg correlation. This normalization is described in Equation 12. This normalization allows the simulator to easily estimate krg for varying endpoints such as Sgc and Sorg .
如果得不到岩心试样,则相对渗透率krg与饱和度Sg之间的相关关系可以用理论方法估计。作为非限制性的实例,可利用相似地层来最初建立基线曲线。相关关系的非限制性的实例可以采用几种形式,比如曲线、数学表达式、查阅表等。If core samples are not available, the correlation between relative permeabilitykrg and saturationSg can be estimated theoretically. As a non-limiting example, similar formations may be utilized to initially establish the baseline curve. Non-limiting examples of correlations may take several forms, such as curves, mathematical expressions, look-up tables, and the like.
图1是气体相对渗透率krg相对于饱和度Sg的示例性基线曲线或相关关系。所示的Sgc0的基线值位于大约0.03或3%处。Figure 1 is an exemplary baseline curve or correlation of gas relative permeabilitykrg versus saturationSg . The baseline values for Sgc0 are shown at approximately 0.03 or 3%.
在该值之上,期望气体开始自由流动而不是主要被截留在多孔介质内。最大气体饱和度Sg为大约76%,并且残余油饱和度Sorg为24%饱和度。本实例假设几乎不存在水。在最大气体饱和度Sg=76%处,最大气体相对渗透率krgro0为近似0.4%。Above this value, it is expected that the gas begins to flow freely rather than being primarily trapped within the porous media. The maximum gas saturation Sg is about 76% and the residual oil saturation Sorg is 24% saturation. This example assumes that almost no water is present. At the maximum gas saturation Sg =76%, the maximum gas relative permeability krgro0 is approximately 0.4%.
B.Sgc相对于Nca和krgro相对于Nca之间的相关关系Correlation between BSgc relative to Nca and krgro relative to Nca
在不同衰竭速度下进行实验室试验以便建立Sgc相对于Nca和krgro相对于Nca的相关关系。Sgc在下述方法中获得。使用下面的方程(8)计算Nca。从试验和使用对岩心或填砂柱试样的储层模拟的历史匹配(history matching)获得每一个衰竭速度的Sgc、krgro和Nca的值。然后,通过曲线拟合Sgc、krgro和Nca的数据而获得Sgc与Nca和krgro与Nca之间的相关关系。岩心试样的生产数据的历史匹配可以用于提高相关关系的准确度。Laboratory experiments were performed at different rates of depletion in order to establish correlations of Sgc with respect to Nca and krgro with respect to Nca. Sgc is obtained in the method described below. Nca is calculated using equation (8) below. Values for Sgc , krgro and Nca for each depletion rate were obtained from tests and history matching using reservoir simulations on core or sand pack samples. Then, the correlations between Sgcand N ca and krgro and Nca were obtained by curve fitting the data of Sgc , krgro and Nca. Historical matching of production data for core samples can be used to improve the accuracy of correlations.
1.含气石油的制备1.Preparation of gas-bearing petroleum
通过使未过滤的脱气石油(dead oil)与甲烷组合来制备含气石油(live oil)。油的水含量可忽略。PVT(压力、体积和温度)数据:油气比(Rs)、油层体积因子(Bo)和气层体积因子(Bg)通过试验(恒定的成分膨胀、闪蒸(flash)、密度测量)与状态方程的调整相组合来确定。含气石油的粘度在储层温度下在毛细管粘度计(ID=0.05in)中进行测量。表1列出了在178°F下的含气石油的相关关系质。Live oil is produced by combining unfiltered dead oil with methane. The water content of the oil is negligible. PVT (pressure, volume and temperature) data: oil-gas ratio (Rs ), reservoir volume factor (Bo ) and gas reservoir volume factor (Bg ) are tested (constant compositional expansion, flash, density measurement) with A combination of adjustments to the equation of state is determined. The viscosity of the gas oil was measured in a capillary viscometer (ID = 0.05 in) at reservoir temperature. Table 1 lists the relevant properties for gas oil at 178°F.
表1原油的性质Table 1Properties of Crude Oil
2.衰竭试验2.Exhaustion test
在恒定衰竭速度下在水平80cm长的填砂柱或者29cm的水平合成岩心(4塞)中进行衰竭试验。填砂柱试验中使用的砂是尺寸范围从75到125微米的清洁的Ottawa砂。砂被包装在配有压力端口的特制维托套管(Viton sleeve)中。用氦孔隙度仪测量填砂柱和合成岩心的孔隙度。填砂柱和合成岩心的性质列在表2中:The depletion tests were performed in horizontal 80 cm long sand-packed columns or 29 cm horizontal synthetic cores (4 plugs) at a constant depletion rate. The sand used in the sand pack tests was clean Ottawa sand ranging in size from 75 to 125 microns. The sand is packed in special Viton sleeves equipped with pressure ports. The porosity of the sand-packed columns and synthetic cores was measured with a helium porosimeter. The properties of the sand packs and synthetic cores are listed in Table 2:
表2填砂柱和合成岩心的性质Table 2Properties of sand-packed columns and synthetic cores
使用以再填充模式操作的一个或两个ISCO泵来控制衰竭速度。图4显示了试验装置的示意图。在衰竭期间,监控压力(入口、出口和沿着岩心的几个点处)、油和气的生产量以及流出物的密度。将岩心夹持器放置在Siemens Somatom HiQ CT扫描仪上以监控空间的和时间的气体饱和度。Use one or two ISCO pumps operating in refill mode to control the rate of depletion. Figure 4 shows a schematic diagram of the test setup. During depletion, pressure (inlet, outlet, and at several points along the core), oil and gas production, and effluent density are monitored. The core holder was placed on a Siemens Somatom HiQ CT scanner to monitor spatial and temporal gas saturation.
3.程序3.Procedure
干填砂柱首先在储层条件(即在上覆岩层应力和温度下)下被进行CT(计算机X射线层析摄影法)扫描。然后岩心在~1600psia的背压下被用CO2闪蒸、被抽空并用煤油饱和。填砂柱(或合成岩心)的渗透率在不同的流速下用煤油测量。充满煤油的填砂柱也被进行CT扫描。使用湿的和干的空气和煤油的CT扫描和CT数来计算填砂柱的孔隙度。然后将含气石油慢慢注入到岩心中来替代煤油。也在若干流速下用含气石油测量填砂柱渗透率。然后减少含气石油的注入率使得横跨岩心的差压小于2psi。The dry-pack sand column is first CT (computed tomography) scanned at reservoir conditions (ie, under overburden stress and temperature). The core was then flashed withCO2 , evacuated and saturated with kerosene at ~1600 psia back pressure. The permeability of the sandpack (or synthetic core) was measured with kerosene at various flow rates. A sand pack filled with kerosene was also CT scanned. Wet and dry air and kerosene CT scans and CT numbers were used to calculate the porosity of the sand pack. Gas-bearing oil is then slowly injected into the core to replace the kerosene. Sand pack permeability was also measured with gas oil at several flow rates. The gas oil injection rate is then reduced such that the differential pressure across the core is less than 2 psi.
被含气石油饱和的填砂柱被进行CT-扫描以便记录初始状态。在~1500-1700psi(在泡点压力之上大约150-350psi)的压力下开始衰竭。关闭入口阀,并且以恒定的抽出速度操作下游的Isco泵A。在给定衰竭时间之后,转换泵并且Isco泵B抽出流体而Isco泵A将油和气传送到收集系统中。重复进行泵循环直到出口压力减小至大约200psia。使用传统的数据采集软件连续记录收集系统中的压力、温度和流体积累。使用在线密度计连续测量产生的流体的密度。还周期地扫描填砂柱以直接确定作为时间和位置的函数的气体饱和度Sc。Sand packs saturated with gas oil were CT-scanned to record initial conditions. Failure begins at pressures of -1500-1700 psi (approximately 150-350 psi above bubble point pressure). The inlet valve was closed and the downstream Isco pump A was operated at a constant pump speed. After a given depletion time, the pumps are switched and Isco pump B draws fluid while Isco pump A delivers oil and gas into the collection system. The pump cycle is repeated until the outlet pressure decreases to approximately 200 psia. Continuously record pressure, temperature, and fluid accumulation in the collection system using conventional data acquisition software. The density of the resulting fluid was continuously measured using an in-line densitometer. The sand pack was also scanned periodically to directly determine the gas saturationSc as a function of time and position.
4.CT-扫描4.CT-scan
Siemens Somatom HiQ CT扫描仪用于监控空间的和时间的气体饱和度。这种第三代的CT-扫描仪具有768个固定的探测器和旋转的X射线源。以133kV进行扫描并且扫描时间为2.7秒。三维像素尺寸对于10mm的扫描厚度来说为近似0.625mm3而且饱和度测量中的不确定度为+/-1.5饱和度单位。获得了10mm和/或5mm的扫描厚度。A Siemens Somatom HiQ CT scanner was used to monitor spatial and temporal gas saturation. This third-generation CT-scanner has 768 fixed detectors and a rotating X-ray source. The sweep was performed at 133 kV and the sweep time was 2.7 seconds. The voxel size is approximately0.625mm3 for a scan thickness of 10mm and the uncertainty in the saturation measurement is +/- 1.5 saturation units. Scan thicknesses of 10 mm and/or 5 mm were obtained.
5.结果5.Results
在试验的过程中,获得了沿着岩心和在封闭的岩心入口和开放的岩心出口处的压力信息、产生的油和气的量、流出物密度和气体饱和度(经由CT-扫描仪)。在试验期间观察到的典型响应如图5和图6所示。图5显示了在快速衰竭试验期间的平均填砂柱压力和横跨填砂柱的压差。图6示出了在快速衰竭试验期间产生的累积的油和气。During the test, pressure information along the core and at the closed core inlet and open core outlet, the amount of oil and gas produced, effluent density and gas saturation (via CT-scanner) were obtained. Typical responses observed during the test are shown in Figures 5 and 6. Figure 5 shows the average sand-pack pressure and the pressure differential across the sand-pack during the rapid depletion test. Figure 6 shows the accumulated oil and gas produced during the rapid depletion test.
虽然不希望依据特别的理论,相信在早期仅通过油和地层膨胀进行生产(系统中没有游离气体),而且压力迅速降低。在(明显的)泡点压力下气泡开始成核。当压力减小到泡点压力之下时,气泡的尺寸缓慢增长而且油的生产由气体膨胀控制。如从图5可看到的,压力减小率显著下降。油是唯一的运动相,而且收集的气体是由收集系统中溶解的气体所释放的。在临界气体饱和度Sgc处,气泡在填砂柱各处连接而且气体开始自由流动。注意气体的生产量有显著增加而油的生产量渐渐减少(见累积的气生产量图中在~270分钟时的急剧突变)。While not wishing to be bound by a particular theory, it is believed that production occurs early on only by oil and formation expansion (no free gas in the system), and the pressure drops rapidly. Bubble nucleation begins at the (significant) bubble point pressure. As the pressure decreases below the bubble point pressure, the bubbles grow slowly in size and oil production is controlled by gas expansion. As can be seen from FIG. 5 , the pressure reduction rate decreased significantly. Oil is the only mobile phase and the collected gas is released by dissolved gas in the collection system. At the critical gas saturation Sgc , gas bubbles connect throughout the sand-pack and the gas begins to flow freely. Note the dramatic increase in gas production and the gradual decrease in oil production (see the sharp break at ~270 minutes in the cumulative gas production plot).
对于填砂柱中的较慢衰竭速度试验和对于岩心试验,也测量流出物密度。图7和8显示了在这种仪器中观察到的典型响应。图7示出了慢速衰竭试验的平均填砂柱压力和流出物密度。图8描绘了慢速衰竭试验的平均填砂柱压力、产生的累积的油(收集在分离器中以及基于流出物密度推断的)。For slower depletion rate tests in sand packs and for core tests, effluent density was also measured. Figures 7 and 8 show typical responses observed in such an instrument. Figure 7 shows the average sand pack pressure and effluent density for the slow depletion test. Figure 8 depicts the average sand pack pressure, accumulated oil produced (collected in the separator and extrapolated based on effluent density) for the slow depletion test.
6.速度影响6.Speed effect
在衰竭试验期间观察到的主要影响是油开采量对衰竭速度非常敏感。大填砂柱试验(图9)和小岩心试验(图10)都观察到这种现象。图9示出了油开采量为平均孔隙压力(填砂柱试验-速度=0.3和0.03cc/min)的函数。图10显示了油开采量作为平均孔隙压力(岩心试验-速度=0.082、0.08和0.002cc/min)的函数。The main effect observed during the depletion tests is that the amount of oil recovered is very sensitive to the rate of depletion. This phenomenon was observed in both the large sand-pack test (Fig. 9) and the small core test (Fig. 10). Figure 9 shows oil recovery as a function of average pore pressure (sand pack test - speed = 0.3 and 0.03 cc/min). Figure 10 shows oil recovery as a function of mean pore pressure (core test - velocity = 0.082, 0.08 and 0.002 cc/min).
除了速度影响之外,注意在这些试验中观察的总油开采量非常大(达~30%OOIP)。如此高的开采量和这种对衰竭速度的相关关系不容易用传统的物理学来解释。此外,这种现象用当前商用模拟器不能进行正确建模。In addition to the velocity effect, note that the total oil recovery observed in these experiments was very large (up to -30% OOIP). Such high extraction rates and this correlation to depletion rates are not easily explained by conventional physics. Furthermore, this phenomenon cannot be properly modeled with current commercial simulators.
7.数据分析-Sg和Sgc的确定7.Data Analysis -Determination ofSgandSgc
临界气体饱和度Sgc是在产生的累积气体开始显著增加处的饱和度。图11显示了产生的累积气(测量的)和产生的累积溶气(计算的)相对于时间的关系。临界气体饱和度Sgc也可以基于流出物密度来确定。The critical gas saturation Sgc is the saturation at which the cumulative gas produced begins to increase significantly. Figure 11 shows the cumulative gas produced (measured) and the cumulative dissolved gas produced (calculated) versus time. The critical gas saturation Sgc may also be determined based on effluent density.
用图4所描述的装置,有几种方式来确定气体饱和度:With the setup described in Figure 4, there are several ways to determine gas saturation:
(1)直接在原地用CT-扫描仪测量;(1) Measure directly in situ with a CT-scanner;
(2)使用收集在收集系统中的流体量的物质平衡;以及(2) mass balance using the volume of fluid collected in the collection system; and
(3)使用流出物流的密度的物质平衡。(3) Mass balance using the density of the effluent stream.
方法2和3需要使用PVT数据(即地层体积因子和作为压力函数的密度)。
物质平衡:Material balance:
SR=1-So (1)SR =1-So (1)
其中:N是试验开始的适当位置处而且在压力Pi下的油(stb);Np 是在压力P下产生的累积油(stb)(Np是用收集系统测量的);Bo和Boi 分别是在P和Pi下的油层体积因子;以及cf是岩石或填砂柱的可压缩性(1/psi)。where: N is the oil (stb) at the appropriate location at the start of the test andat pressure Pi;Np is the accumulated oil (stb) produced at pressure P (Np is measured with the collection system); BoandBoi is the reservoir volume factor at P andPi , respectively; andcf is the compressibility (1/psi) of the rock or sand pack.
在泡点之上,油仅通过油和地层膨胀产生。即Above the bubble point, oil is produced only by oil and formation expansion. Right now
其中,油的可压缩性给定为where the compressibility of the oil is given as
由于co已知,填砂柱和合成岩心的可压缩性使用方程(3)来计算。Since co is known, the compressibility of the sandpack and the synthetic core is calculated using Equation (3).
如上所指出,Np是通过收集系统来测量的。替代地,产生的油的量可基于流出物密度,ρeff:As noted above,Np is measured by collecting the system. Alternatively, the amount of oil produced can be based on the effluent density,ρeff :

孔隙度和气体饱和度都可使用CT-扫描仪来计算。孔隙度被给定为Both porosity and gas saturation can be calculated using a CT-scanner. The porosity is given as
其中:CTsaturated_core是被煤油饱和的填砂柱(在初始压力下)的CT数,CTdry_core是被气体饱和的填砂柱的CT数。CTliq和CTgas分别是煤油和空气的CT数。Where: CTsaturated_core is the CT number of the kerosene-saturated sand pack (at initial pressure), and CTdry_core is the CT number of the gas-saturated sand pack. CTliq and CTgas are the CT numbers of kerosene and air, respectively.
类似地,气体饱和度通过下列方程获得:Similarly, gas saturation is obtained by the following equation:
其中:CTp是在衰竭期间(在压力P下)测得的CT数.CTsaturated_core是被含气石油饱和(在初始压力下)的填砂柱的CT数,以及CTdry_core是被空气饱和的填砂柱在初始压力下的CT数。where: CTp is the CT number measured during depletion (at pressure P), CTsaturated_core is the CT number of the sandpack saturated (at initial pressure) by gas oil, and CTdry_core is the air saturated The CT number of the sand-packed column under the initial pressure.
8.数据分析-毛细数的计算8. Data analysis - calculation of capillary number
对于每一个试验,使用在衰竭期间记录的压差来计算平均毛细数(Nca)。毛细数可用几种方式来计算。在本优选实施例中,使用下列公式:For each trial, the average capillary number (Nca ) was calculated using the differential pressure recorded during depletion. Capillary number can be calculated in several ways. In the preferred embodiment, the following formula is used:
其中:K是岩心或填砂柱的渗透率,σ是气油表面张力(在试验中使用的油被估算为80dyn/cm),L是填砂柱的长度,以及ΔP是在气体变得可动之前所测得的压差。where: K is the permeability of the core or sand pack, σ is the gas-oil surface tension (the oil used in the test was estimated to be 80 dyn/cm), L is the length of the sand pack, and ΔP is the time at which the gas becomes available. The differential pressure measured before the operation.
9.数据分析-作为Nca的函数的Sgc和krgro9.Data analysis - Sgcand krgro asa function of Nca
基于上述分析,对于所有可用试验,Sgc被绘制成Nca的函数的曲线。然后对数据进行曲线拟合,优选地,使用指数函数(方程(9))来内插/外插缺少的数据。系数“a”和指数“b”的值针对每一个油/岩石系统而异。Based on the above analysis, Sgc was plotted as a function of Nca for all available trials. The data are then curve fitted, preferably using an exponential function (equation (9)) to interpolate/extrapolate missing data. The values of coefficient "a" and index "b" vary for each oil/rock system.
举例来说式,但不局限于此,优选的作为Nca的函数的Sgc和krgro之间的数学相关关系性如下:By way of example, but not limitation, the preferred mathematical correlation between Sgc and krgro as a function of Nca is as follows:
以及as well as
Sgc0和krgro0分别是“常规的”临界气体饱和度和气体相对渗透率值的端点,如上述在背景技术中所述和如图1所示。Sgc0 and krgro0 are the endpoints of the "conventional" critical gas saturation and gas relative permeability values, respectively, as described above in the background and shown in FIG. 1 .
在不同衰竭速度下对岩心试样进行的储层模拟用于确定krgro的值。对于每一个模拟操作,临界气体饱和度Sgc是已知的,因此气体相对渗透率krg相对于饱和度Sg曲线上的该端点是已知的。对于曲线krgro的另一个端点,做出多个估算值。然后,使用反复试验方法来确定在特定的衰竭速度下krgro的估算值中的哪一个值与由岩心试样产出的试验生产量相匹配。使用利用多次模拟得到的试验生产量结果的历史记录匹配来在多个衰竭速度下确定krgro,其与Nca值对应。然后这些krgro与Nca的值被进行曲线拟合以便得到与毛细数相关的相关关系。最优选地,该相关关系为带有确定的“c”和“d”值的方程(10)形式。Reservoir simulations performed on core samples at different depletion rates were used to determine the value of krgro . For each simulation run, the critical gas saturationSgc is known, and thus the endpoint on the gas relative permeabilitykrg versus saturationSg curve is known. For the other endpoint of the curve krgro , multiple estimates are made. A trial-and-error approach is then used to determine which of the estimated values of krgro matches the experimental production from the core sample at a particular depletion rate. The krgro , which corresponds to the Nca value, was determined at multiple failure rates using history matching of experimental throughput results obtained with multiple simulations. These values of krgro and Nca were then curve fitted to obtain a correlation with capillary number. Most preferably, the correlation is in the form of equation (10) with determined "c" and "d" values.
III.利用溶气驱重油进行储层模拟III.Reservoir Simulation Using Dissolved Gas Flooding Heavy Oil
从试验数据获得的Sgc和krgro相对于Nca的函数形式在本示例性实施例中执行,优选在储层模拟器中使用修正的隐式算法执行。举例来说,但不局限于此,Sgc和krgro的优选形式是使用上述的方程(9)和(10)作为Nca函数的输入量。参数a、b、c和d是使用者输入到储层模拟器的输入量。应注意的是,在图2中Sgc是a、b和毛细数Nca的函数。类似地,krgro是c、d和Nca的函数。在本发明的优选实施例中,下列是默认值:a=104;b=1.0;c=104;以及d=1。理想地,所计算的Sgc和krgro 的值分别受使用者指定的最大值和最小值的限制。例如,可使用最大值Sgc=0.1和最小值krgro=10-4。由于Nc是定向的,为每个单元面计算Sgc 和krgro,而且从而它们也是定向的。The functional forms of Sgc and krgro versus Nca obtained from experimental data are implemented in this exemplary embodiment, preferably in a reservoir simulator using a modified implicit algorithm. By way of example, but not limitation, a preferred form of Sgc and krgro uses equations (9) and (10) above as inputs to the Nca function. Parameters a, b, c, and d are user inputs to the reservoir simulator. It should be noted that in FIG. 2 Sgc is a function of a, b and capillary number Nca . Similarly, krgro is a function of c, d and Nca. In a preferred embodiment of the present invention, the following are default values: a=104 ; b=1.0; c=104 ; and d=1. Ideally, the calculated values of Sgc and krgro are bounded by user-specified maximum and minimum values, respectively. For example, a maximum value Sgc =0.1 and a minimum value krgro =10−4 may be used. Since Nc is directional, Sgc and krgro are calculated for each cell face, and thus they are also directional.
为了减少振荡和收敛问题,执行优选实施例的修正的隐式算法来计算Sgc和krgro。当气相是不可动的,即饱和度Sg≤Sgc时,例如分别使用方程(9)和(10)来计算Sgc和krgro。当气相流动时,Sgc和krgro变成不变量-既不增加也不减小。它们的值使用当气相变得可动在时间步长的起点处的毛细数Nc来计算,并且对于所有剩余的时间步长都固定。To reduce oscillation and convergence problems, the modified implicit algorithm of the preferred embodiment is implemented to calculate Sgc and krgro . When the gas phase is immobile, ie the saturation Sg ≤ Sgc , Sgc and krgro are calculated eg using equations (9) and (10), respectively. When the gas phase is flowing, Sgc and krgro become invariant - neither increase nor decrease. Their values are calculated using the capillary number Nc at the beginning of the time step when the gas phase becomes mobile, and are fixed for all remaining time steps.
A.单元毛细数Nc的计算A. Calculation of unit capillary number Nc
在优选示例性实施例中,毛细数Nc的修正表达式优选地使用下列 表达式来并入储层模拟器中:In a preferred exemplary embodiment, a modified expression for the capillary numberNc is preferably incorporated into the reservoir simulator using the following expression:
其中:σog为油气界面张力,K为岩石渗透率,φo为油相势能,Po是横跨单元面的压力变化,ρo=油的密度,g=重力常数,以及D=离基准点的深度变化。where: σog is the oil-gas interfacial tension, K is the rock permeability, φo is the potential energy of the oil phase, Po is the pressure change across the cell surface, ρo = density of oil, g = gravitational constant, and D = distance from datum The depth variation of the point.
Nc的该修正定义在方程中省去油相对渗透率。由于Nc理想地以隐式计算,这在雅可比行列式(Jacobian)生成过程中大大简化了作为原始变量的函数的气体相对渗透率的导数的计算。同样,Nc计算中的势梯度是定向的,并且基于横跨两个相邻网格块的面的梯度。对于每一次牛顿迭代,为每一个网格块的面计算毛细数Nc。在三维模型中,每一个网格块将有六个方向的Nc。每一个Nc对应于单元面处的六个值中的一个。定向的Nc的使用导致了雅可比行列式可容易地通过传统的线性方程解算器进行求解。在本优选实施例中,计算了所有网格块的面的平均Nc。This modified definition ofNc omits the oil relative permeability from the equation. SinceNc is ideally computed implicitly, this greatly simplifies the calculation of the derivative of gas relative permeability as a function of the original variables during Jacobian generation. Also, the potential gradient in the Nc calculation is directional and based on the gradient across the faces of two adjacent grid blocks. For each Newton iteration, the capillary number Nc is calculated for each grid block face. In a 3D model, each grid block will have Nc in six directions. EachNc corresponds to one of six values at the cell face. The use of orientedNc results in a Jacobian that is easily solved by conventional linear equation solvers. In the preferred embodiment, the average Nc of the faces of all grid blocks is calculated.
B.调整基线相对渗透率相关关系B.Adjusting the Baseline Relative Permeability Correlation
为每一个单元分配特定的岩石类型或相。这些岩石类型或相的每一个对应于特定基线气体相对渗透率krg相对于饱和度Sg的曲线,比如图1中所示的曲线。为每一个相应的单元调整这些相应的基线曲线。这通过由使用方程(9)和(10)以及为每一个相应单元计算的特定毛细数Nc而计算得到的与毛细数相关的Sgc和krgro值来替换Sgc0和krgro0的初始值来为每一个单元实现。连接这些端点的基线曲线优选通过按比例缩放而进行调整。可使用几种方法确定相对渗透率的比例。方程(12)显示了这样一种方法,即:Assign specific rock types or facies to each cell. Each of these rock types or facies corresponds to a particular baseline gas relative permeability krg versus saturation Sg curve, such as the curve shown in Fig. 1 . These corresponding baseline curves are adjusted for each corresponding unit. This is done by replacing the values of Sgc0 and krgro0 with the capillary number-dependent values of Sgc and krgro calculated using equations (9) and (10) and the specific capillary number Nc calculated for each corresponding cell. Initial values are implemented for each cell. The baseline curve connecting these endpoints is preferably adjusted by scaling. Several methods can be used to determine the ratio of relative permeability. Equation (12) shows such a method, namely:
方程(12)简单陈述了krg是Sg、Sgc和Sorg的函数。(气体饱和度大于Sorg时,油相是不可动的-即,Kro=0)。函数F可为(但不局限于)一个简单的幂函数:Equation (12) simply states that krg is a function of Sg , Sgc and Sorg . (When the gas saturation is greater than Sorg , the oil phase is immobile - ie, Kro =0). Function F can be (but not limited to) a simple power function:
在气体相对渗透率的传统的处理中,方程12或13中的Sgc等于Sgc0。然而,对于本公式,方程12和13中的Sgc现在是毛细数的函数。In a conventional treatment of gas relative permeability, Sgc in equation 12 or 13 is equal to Sgc0 . However, for this formulation, Sgc in Equations 12 and 13 is now a function of capillary number.
另外,如果气体相对渗透率krgro的端点相对于基线曲线的初始krgro0 减小10%,则相关关系或曲线上的所有气体相对渗透率值将减小10%。所属领域的技术人员应该理解的是可使用许多其他方式来调整基线曲线以便反映端点Sgc和/或krgro的更新值的变化,而且也在本发明范围内。Alternatively, if the endpoint of the gas relative permeability krgro is reduced by 10% relative to the initial krgro0 of the baseline curve, all gas relative permeability values on the correlation or curve will be reduced by 10%. Those skilled in the art will understand that many other ways to adjust the baseline curve to reflect changes in the updated values of the endpoints Sgc and/or krgro can be used and are within the scope of the present invention.
C.选择用于并入储层模拟器中的气体相对渗透率krgC. Selection of gas relative permeability krgfor incorporation into the reservoir simulator
饱和度值Sg可来自当储层模拟第一次开始时的初始条件,来自前一个时间步长,或来自在时间步长内迭代计算的值。然后,检查每一个储层单元的饱和度Sg,并且由经过调整的基线相关关系选择相应的相对渗透率krg。如上所述,如果Sg≥Sgc,则使用来自先前计算的曲线相关关系来确定krg。The saturation value Sg may come from initial conditions when the reservoir simulation first started, from a previous time step, or from values iteratively calculated over a time step. Then, the saturation Sg of each reservoir unit is checked, and the corresponding relative permeability krg is selected from the adjusted baseline correlation. As above, if Sg ≥ Sgc , krg is determined using the curvilinear correlation from the previous calculation.
D.使用选定的气体相对渗透率krg来运行储层模拟D.Run the reservoir simulationusing the selected gas relative permeability krg
求解有限差分方程来确定未知量,比如压力P或饱和度Sg。这些有限差分方程取决于最近更新的相对渗透率kr,包括储层单元的与毛细数相关的气体渗透率krg。这种有限差分方程对于储层模拟领域的技术人员来说是公知的。该方程公知的求解方法的实例包括:(1)完全显式的;(2)隐式压力、显式饱和度(IMPES);(3)完全隐式的;(4)顺序隐式的(SEQ)、适应性隐式的(AIM);以及(阶式)Cascade。在优选实施例中,使用完全隐式方法来求解这些方程。Solve finite difference equations to determine unknown quantities, such as pressure P or saturation Sg . These finite difference equations depend on the most recently updated relative permeability kr , including the capillary number-dependent gas permeability krg of the reservoir unit. Such finite difference equations are well known to those skilled in the art of reservoir modeling. Examples of known solutions to this equation include: (1) fully explicit; (2) implicit pressure, explicit saturation (IMPES); (3) fully implicit; (4) sequentially implicit (SEQ ), Adaptive Implicit (AIM); and (cascaded) Cascade. In a preferred embodiment, these equations are solved using a fully implicit method.
如果状态变量(即压力或饱和度)的解在迭代期间在满意的公差范围内,则将为一个时间步长建立最终的流体性质。在时间步长期间的气、水和油的生产容积可根据这些流体性质建立,如使用储层模拟器的通常做法一样。然后储层模拟器可以运行经历更多的时间步长直到满足预定的时间长度。这些时间步长累积的生产量提供了对地下地层生产的估计。If the solution for the state variable (i.e. pressure or saturation) is within satisfactory tolerances during the iterations, the final fluid properties will be established for one time step. The production volumes of gas, water and oil during the time step can be established from these fluid properties, as is common practice using reservoir simulators. The reservoir simulator can then be run through further time steps until a predetermined length of time is met. Cumulative production over these time steps provides an estimate of subsurface formation production.
本发明还包括用于使用取决于衰竭速度/流体速度和原油的粘度的相对渗透率krg进行上述储层模拟的系统。此外,本发明还包括带有用于使用与流体速度相关的相对渗透率来进行该储层模拟的指令的程序存储设备。The present invention also includes a system for performing the above described reservoir simulation using the relative permeability krg depending on the depletion velocity/fluid velocity and the viscosity of the crude oil. Additionally, the present invention includes a program storage device with instructions for performing the reservoir simulation using relative permeability relative to fluid velocity.
尽管在前述说明中,已经结合某些优选实施例描述了本发明,并且为了示例说明目的已经陈述了许多详细资料,但对所属领域的技术人员而言显而易见的是,本发明容许改变而且在此描述的某些其他详细资料可显著改变而不偏离本发明的基本原理。While in the foregoing specification the invention has been described in conjunction with certain preferred embodiments, and numerous details have been set forth for purposes of illustration, it will be apparent to those skilled in the art that the invention is susceptible to variation and that is described herein. Certain other details described may vary considerably without departing from the basic principles of the invention.
术语the term
a=用于计算Sgc的系数;a = coefficient used to calculate Sgc ;
b=用于计算Sgc的指数;b = index used to calculate Sgc ;
Boj=在压力Pi下的油层体积因子;Boj = reservoir volume factor at pressure Pi ;
Bo=在压力P下的油层体积因子;Bo = Reservoir volume factor under pressure P;
Bg=在压力P下的气层体积因子;Bg = gas layer volume factor under pressure P;
c=用于计算krgro的系数;c = coefficient used to calculate krgro ;
cf=岩石或岩心试样的可压缩性(1/psi);cf = compressibility of rock or core sample (1/psi);
co=油试样的可压缩性(1/psi);co = compressibility of the oil sample (1/psi);
CTdry_core=被气体饱和的试样的CT数;CTdry_core = CT number of sample saturated with gas;
CTsaturated_core=被煤油饱和(在初始压力下)的试样的CT数;CTsaturated_core = CT number of sample saturated with kerosene (at initial pressure);
CTp=在压力P下衰竭期间测量的CT数;CTp = number of CTs measured during failure at pressure P;
CTliq=煤油的CT数;CTliq = CT number of kerosene;
CTgas=空气的CT数;CTgas = CT number of air;
d=用于计算krgro的指数;d = index used to calculate krgro ;
D=离基准点的深度的变化;D = change in depth from datum point;
g=重力常数;g = gravitational constant;
ke=有效渗透率;ke = effective permeability;
kr=相对渗透率,无量纲;kr = relative permeability, dimensionless;
krg=气体相对渗透率,无量纲;krg = gas relative permeability, dimensionless;
krgro=在最小残余油情况下的气体相对渗透率,无量纲;krgro = gas relative permeability at minimum residual oil, dimensionless;

kro=油相对渗透率,无量纲;kro = oil relative permeability, dimensionless;
K=岩石渗透率;K = rock permeability;
K=溶气曲线的斜率,psi-1;K = the slope of the dissolved gas curve, psi-1 ;
Nc=为储层模型的特定单元计算的毛细数;Nc = capillary number calculated for a particular cell of the reservoir model;
Nca=毛细数;Nca = capillary number;
ΔP=压力变化(psi);ΔP = pressure change (psi);
L=试验腔的长度(英寸);L = the length of the test chamber (inches);
N=在初始条件下适当位置的油(stb);N = oil in place at initial conditions (stb);
Np=压力P(cm3)下产生的累积的油(stb);Np = accumulated oil (stb) produced at pressure P (cm3 );
φo=油相势能;φo = potential energy of oil phase;
Pi=在时间i时的压力,psi;Pi = pressure at time i, psi;
ΔPo=横跨面的压力变化;ΔPo = pressure change across the surface;
ρeff=有效密度;ρeff = effective density;
ρg=气的密度;ρg = density of gas;
ρo=油的密度;ρo = density of oil;
Rs=气油比;Rs = gas-oil ratio;
S=饱和度,无量纲;S = saturation, dimensionless;
Sg=气体饱和度,无量纲;Sg = gas saturation, dimensionless;
Sgc=临界气体饱和度,无量纲;Sgc = critical gas saturation, dimensionless;
So=油饱和度,无量纲;So = oil saturation, dimensionless;

Sorg=特定岩石区的残余油对气体的饱和度,无量纲;Sorg = residual oil to gas saturation of a specific rock zone, dimensionless;
stb=油罐桶数;stb = number of oil tank barrels;
σ=界面张力;σ = interfacial tension;
σog=油气的界面张力;以及σog = interfacial tension of oil and gas; and
vo=油的速度。vo = Velocity of oil.
Claims (14)
Applications Claiming Priority (3)
| Application Number | Priority Date | Filing Date | Title |
|---|---|---|---|
| US75390005P | 2005-12-22 | 2005-12-22 | |
| US60/753,900 | 2005-12-22 | ||
| PCT/US2006/049095WO2007076044A2 (en) | 2005-12-22 | 2006-12-20 | Method, system and program storage device for reservoir simulation utilizing heavy oil solution gas drive |
Publications (2)
| Publication Number | Publication Date |
|---|---|
| CN101366041A CN101366041A (en) | 2009-02-11 |
| CN101366041Btrue CN101366041B (en) | 2011-10-12 |
Family
ID=38218675
Family Applications (1)
| Application Number | Title | Priority Date | Filing Date |
|---|---|---|---|
| CN2006800525037AExpired - Fee RelatedCN101366041B (en) | 2005-12-22 | 2006-12-20 | Method of Reservoir Simulation Using Dissolved Gas Flooding Heavy Oil |
Country Status (4)
| Country | Link |
|---|---|
| CN (1) | CN101366041B (en) |
| BR (1) | BRPI0620170A2 (en) |
| CA (1) | CA2634757C (en) |
| WO (1) | WO2007076044A2 (en) |
Families Citing this family (24)
| Publication number | Priority date | Publication date | Assignee | Title |
|---|---|---|---|---|
| AU2009238481B2 (en) | 2008-04-22 | 2014-01-30 | Exxonmobil Upstream Research Company | Functional-based knowledge analysis in a 2D and 3D visual environment |
| US8892407B2 (en) | 2008-10-01 | 2014-11-18 | Exxonmobil Upstream Research Company | Robust well trajectory planning |
| AU2009311619B2 (en) | 2008-11-06 | 2015-10-01 | Exxonmobil Upstream Research Company | System and method for planning a drilling operation |
| CA2770602C (en)* | 2009-09-02 | 2017-02-14 | Landmark Graphics Corporation | System and method of hydrocarbon formation modeling |
| CA2781868C (en) | 2010-02-03 | 2016-02-09 | Exxonmobil Upstream Research Company | Method for using dynamic target region for well path/drill center optimization |
| US8452580B2 (en)* | 2010-02-26 | 2013-05-28 | Chevron U.S.A. Inc. | Method and system for using multiple-point statistics simulation to model reservoir property trends |
| US9367564B2 (en) | 2010-03-12 | 2016-06-14 | Exxonmobil Upstream Research Company | Dynamic grouping of domain objects via smart groups |
| US9595129B2 (en) | 2012-05-08 | 2017-03-14 | Exxonmobil Upstream Research Company | Canvas control for 3D data volume processing |
| CN103590807B (en)* | 2012-08-13 | 2016-06-08 | 中国石油天然气集团公司 | A kind of method determining heavy oil thermal recovery steam chamber state |
| AU2014278645B2 (en) | 2013-06-10 | 2016-07-28 | Exxonmobil Upstream Research Company | Interactively planning a well site |
| CN104481504B (en)* | 2014-11-11 | 2017-09-01 | 中国石油天然气股份有限公司 | Simulation experiment system and method for thick oil dissolved gas drive development |
| CN104481523B (en)* | 2014-11-11 | 2018-07-13 | 中国石油天然气股份有限公司 | Simulation experiment system and method for thick oil dissolved gas drive development |
| FR3034894B1 (en)* | 2015-04-09 | 2018-08-10 | Services Petroliers Schlumberger | OIL STORAGE SATURATION TANK AND PERMEABILITY MODELING |
| FR3036820B1 (en) | 2015-06-01 | 2021-12-31 | Services Petroliers Schlumberger | MODELING OF OIL FIELD RESERVOIR SATURATION AND PERMEABILITY |
| FR3038408B1 (en) | 2015-06-30 | 2017-08-25 | Services Petroliers Schlumrberger | MODELING THE SATURATION AND PERMEABILITY OF PETROLEUM FIELD RESERVOIR |
| CN105443080A (en)* | 2015-12-04 | 2016-03-30 | 中国石油天然气股份有限公司 | Simulation device for failure development of bottom-edge water gas-containing oil reservoir |
| CN107101773B (en)* | 2017-04-14 | 2019-07-09 | 中国石油天然气股份有限公司 | Method and device for testing bubble point pressure value and quasi-bubble point pressure value |
| CN107944599B (en)* | 2017-10-31 | 2020-10-09 | 中国石油天然气股份有限公司 | Method for predicting yield of oil-gas horizontal well |
| CN109281662B (en)* | 2018-08-16 | 2022-03-29 | 中国石油天然气股份有限公司 | Method for determining relative compressibility index of reservoir at different section positions of horizontal well |
| US11492895B2 (en) | 2018-11-13 | 2022-11-08 | Saudi Arabian Oil Company | Relative permeability ratio from wellbore drilling data |
| CN110671084B (en)* | 2019-09-04 | 2021-07-06 | 中国石油化工股份有限公司 | Method for simulating flooding numerical value of common thick oil water-soluble viscosity reducer |
| CN110863806B (en)* | 2019-11-28 | 2021-07-23 | 西安石油大学 | A method for predicting the dynamic change of carbon dioxide flooding gas front |
| US12404753B2 (en) | 2022-12-30 | 2025-09-02 | Landmark Graphics Corporation | Adjusting fluid injection into a wellbore based on relative permeability of a formation |
| WO2025071844A1 (en)* | 2023-09-29 | 2025-04-03 | Schlumberger Technology Corporation | A method to reduce carbon dioxide recovery from subsurface locations |
Citations (4)
| Publication number | Priority date | Publication date | Assignee | Title |
|---|---|---|---|---|
| US6052520A (en)* | 1998-02-10 | 2000-04-18 | Exxon Production Research Company | Process for predicting behavior of a subterranean formation |
| US6227296B1 (en)* | 1998-11-03 | 2001-05-08 | Exxonmobil Upstream Research Company | Method to reduce water saturation in near-well region |
| CN1529238A (en)* | 2003-10-17 | 2004-09-15 | 大庆油田有限责任公司 | Three-dimensinal composite drive computer simulating method for low-concentration surface active agent and phase state joint |
| US6810332B2 (en)* | 2003-01-31 | 2004-10-26 | Chevron U.S.A. Inc. | Method for computing complexity, confidence and technical maturity indices for reservoir evaluations |
Family Cites Families (1)
| Publication number | Priority date | Publication date | Assignee | Title |
|---|---|---|---|---|
| FR2837572B1 (en)* | 2002-03-20 | 2004-05-28 | Inst Francais Du Petrole | METHOD FOR MODELING HYDROCARBON PRODUCTION FROM A SUBTERRANEAN DEPOSITION SUBJECT TO DEPLETION |
- 2006
- 2006-12-20CNCN2006800525037Apatent/CN101366041B/ennot_activeExpired - Fee Related
- 2006-12-20CACA2634757Apatent/CA2634757C/enactiveActive
- 2006-12-20WOPCT/US2006/049095patent/WO2007076044A2/enactiveApplication Filing
- 2006-12-20BRBRPI0620170-9Apatent/BRPI0620170A2/ennot_activeIP Right Cessation
Patent Citations (4)
| Publication number | Priority date | Publication date | Assignee | Title |
|---|---|---|---|---|
| US6052520A (en)* | 1998-02-10 | 2000-04-18 | Exxon Production Research Company | Process for predicting behavior of a subterranean formation |
| US6227296B1 (en)* | 1998-11-03 | 2001-05-08 | Exxonmobil Upstream Research Company | Method to reduce water saturation in near-well region |
| US6810332B2 (en)* | 2003-01-31 | 2004-10-26 | Chevron U.S.A. Inc. | Method for computing complexity, confidence and technical maturity indices for reservoir evaluations |
| CN1529238A (en)* | 2003-10-17 | 2004-09-15 | 大庆油田有限责任公司 | Three-dimensinal composite drive computer simulating method for low-concentration surface active agent and phase state joint |
Non-Patent Citations (1)
| Title |
|---|
| 2000.04.18,说明书第4栏第30-46行,第5栏第16-20行,第7栏第33-61行,第8栏第8-15行、第36-45行,第9栏第28-30行,第10栏第45-57行,附图1-2、4-5. |
Also Published As
| Publication number | Publication date |
|---|---|
| WO2007076044A2 (en) | 2007-07-05 |
| CA2634757C (en) | 2014-12-16 |
| BRPI0620170A2 (en) | 2011-11-01 |
| CA2634757A1 (en) | 2007-07-05 |
| CN101366041A (en) | 2009-02-11 |
| WO2007076044A3 (en) | 2007-12-27 |
Similar Documents
| Publication | Publication Date | Title |
|---|---|---|
| CN101366041B (en) | Method of Reservoir Simulation Using Dissolved Gas Flooding Heavy Oil | |
| US9020793B2 (en) | Method, system and program storage device for reservoir simulation utilizing heavy oil solution gas drive | |
| US7289942B2 (en) | Performance prediction method for hydrocarbon recovery processes | |
| Wu et al. | Flow and displacement of Bingham non-Newtonian fluids in porous media | |
| US7006959B1 (en) | Method and system for simulating a hydrocarbon-bearing formation | |
| Wan et al. | The use of numerical simulation to investigate the enhanced Eagle Ford shale gas condensate well recovery using cyclic CO2 injection method with nano-pore effect | |
| Maini | Is it futile to measure relative permeability for heavy oil reservoirs? | |
| Kumar et al. | Effect of depletion rate on gas mobility and solution gas drive in heavy oil | |
| Hossain et al. | Numerical approach for the prediction of formation and hydraulic fracture properties considering elliptical flow regime in tight gas reservoirs | |
| Song et al. | Numerical research on CO2 storage efficiency in saline aquifer with low-velocity non-Darcy flow | |
| Qin et al. | Numerical studies of spontaneous imbibition in porous media: Model development and pore-scale perspectives | |
| US20150226061A1 (en) | System and method for estimating flow capacity of a reservoir | |
| US20210010357A1 (en) | Method for developing a hydrocarbon reservoir by injecting a gas in the form of foam | |
| Mathews et al. | Fractal methods improve Mitsue miscible predictions | |
| Khanifar et al. | Experiment aided optimization of IWAG recovery process in a complex field with complex fluid: A case study | |
| Ali | Developments in measurement and interpretation techniques in coreflood tests to determine relative permeabilities | |
| Yamada | Dispersion and hydrate formation analysis for CCS/CCUS in depleted gas reservoirs | |
| Worawutthichanyakul | Unstable immiscible displacement study in oil-wet rocks | |
| Ghamdi et al. | Optimization of Waterflooding Utilizing Data Driven Models: An Application of the Two-Phase Capacitance Resistance Model | |
| Mahmud et al. | Investigating relative permeability measurements using unsteady-state core flooding method | |
| Kuk et al. | Estimation of carbon dioxide injection into reservoirs potential to enhance oil production and reduce CO2 emissions to the atmosphere | |
| Azim et al. | 3D numerical and experimental study on upscaling two phase relative permeability curve of naturally fractured reservoirs | |
| Savioli et al. | Modeling multiphase fluid flow in unconventional reservoirs | |
| Reis et al. | Compositional pore-network modeling of gas-condensate flow | |
| Yao et al. | Estimation of Remaining Reserves Post-Dry Gas Infusion in Cracked Formations Utilizing an Enhanced Material Balance Formula |
Legal Events
| Date | Code | Title | Description |
|---|---|---|---|
| C06 | Publication | ||
| PB01 | Publication | ||
| C10 | Entry into substantive examination | ||
| SE01 | Entry into force of request for substantive examination | ||
| C14 | Grant of patent or utility model | ||
| GR01 | Patent grant | ||
| CF01 | Termination of patent right due to non-payment of annual fee | Granted publication date:20111012 Termination date:20141220 | |
| EXPY | Termination of patent right or utility model |