CN101313294A - Intelligent copy/paste of graph nodes - Google Patents
Intelligent copy/paste of graph nodesDownload PDFInfo
- Publication number
- CN101313294A CN101313294ACNA2006800431608ACN200680043160ACN101313294ACN 101313294 ACN101313294 ACN 101313294ACN A2006800431608 ACNA2006800431608 ACN A2006800431608ACN 200680043160 ACN200680043160 ACN 200680043160ACN 101313294 ACN101313294 ACN 101313294A
- Authority
- CN
- China
- Prior art keywords
- relation
- data
- diagram
- definition
- graphical diagrams
- Prior art date
- Legal status (The legal status is an assumption and is not a legal conclusion. Google has not performed a legal analysis and makes no representation as to the accuracy of the status listed.)
- Pending
Links
Images


Classifications
- G—PHYSICS
- G06—COMPUTING OR CALCULATING; COUNTING
- G06F—ELECTRIC DIGITAL DATA PROCESSING
- G06F3/00—Input arrangements for transferring data to be processed into a form capable of being handled by the computer; Output arrangements for transferring data from processing unit to output unit, e.g. interface arrangements
- G06F3/01—Input arrangements or combined input and output arrangements for interaction between user and computer
- G06F3/048—Interaction techniques based on graphical user interfaces [GUI]
- G06F3/0481—Interaction techniques based on graphical user interfaces [GUI] based on specific properties of the displayed interaction object or a metaphor-based environment, e.g. interaction with desktop elements like windows or icons, or assisted by a cursor's changing behaviour or appearance
- G—PHYSICS
- G06—COMPUTING OR CALCULATING; COUNTING
- G06F—ELECTRIC DIGITAL DATA PROCESSING
- G06F17/00—Digital computing or data processing equipment or methods, specially adapted for specific functions
- G—PHYSICS
- G06—COMPUTING OR CALCULATING; COUNTING
- G06F—ELECTRIC DIGITAL DATA PROCESSING
- G06F40/00—Handling natural language data
- G06F40/10—Text processing
- G06F40/12—Use of codes for handling textual entities
- G06F40/137—Hierarchical processing, e.g. outlines
Landscapes
- Engineering & Computer Science (AREA)
- Theoretical Computer Science (AREA)
- General Engineering & Computer Science (AREA)
- Physics & Mathematics (AREA)
- General Physics & Mathematics (AREA)
- Human Computer Interaction (AREA)
- Computational Linguistics (AREA)
- General Health & Medical Sciences (AREA)
- Health & Medical Sciences (AREA)
- Audiology, Speech & Language Pathology (AREA)
- Artificial Intelligence (AREA)
- Data Mining & Analysis (AREA)
- Databases & Information Systems (AREA)
- Mathematical Physics (AREA)
- Software Systems (AREA)
- User Interface Of Digital Computer (AREA)
Abstract
Description
Translated fromChinese背景background
a.技术领域a.Technical field
本发明一般涉及计算机系统中的对象的剪切和粘贴,尤其涉及有预定义图形图表的对象的剪切和粘贴。The present invention relates generally to cutting and pasting of objects in computer systems, and more particularly to cutting and pasting of objects with predefined graphical representations.
b.背景描述b. Background description
在计算机系统中经常需要对象和思想的图形表示。许多软件应用程序能够以多种不同的形式表示数据,且这些软件应用程序中的大部分都允许用户创建诸如图形、图表以及其他可视表示等图形表示。在某些情况下,通过关系定义的图表可用来显示数据。通过关系定义的图表可以包括对图表内的对象和关系的定义,该定义使得计算机应用程序能够构造图形表示。Graphical representations of objects and ideas are often required in computer systems. Many software applications are capable of representing data in many different forms, and most of these software applications allow users to create graphical representations such as graphs, charts, and other visual representations. In some cases, diagrams defined by relationships can be used to display data. A diagram defined by relationships may include definitions of objects and relationships within the diagram that enable a computer application to construct a graphical representation.
当来自一个应用程序的项目被复制且粘贴到预定义的关系图表中时可能会出现问题。从一个应用程序或图表中取出的对象可能不适合其正被置到的图表。而且,当从图表中剪切对象影响其他对象之间建立的关系时,可能会出现问题。Problems can arise when items from one application are copied and pasted into predefined relational diagrams. An object taken from one application or diagram may not fit in the diagram it is being placed into. Also, problems can arise when clipping objects from the diagram affects relationships established between other objects.
概述overview
当使用图形图表时,剪切和粘贴操作可以利用预定义关系来智能地对图表插入和移除项目。可顺序地或分层地解释一数据模型来构造各种图表。当新数据符合图表定义时,粘贴操作将把新数据带入该图表和数据模型中。剪切操作可以使得该数据模型和图表复原为符合图表定义。When working with graphical diagrams, cut and paste operations can take advantage of predefined relationships to intelligently insert and remove items from the diagram. A data model can be interpreted sequentially or hierarchically to construct various diagrams. When the new data conforms to the diagram definition, the paste operation will bring the new data into the diagram and data model. A cut operation may restore the data model and diagram to conform to the diagram definition.
附图简述Brief description of the drawings
以下各图中,In the following figures,
图1是示出顺序图表的创建的一个实施例的图示。Figure 1 is a diagram illustrating one embodiment of the creation of a sequence diagram.
图2是示出分层图表的创建的一个实施例的图示。Figure 2 is a diagram illustrating one embodiment of the creation of a hierarchical graph.
图3是示出粘贴为子项目操作的一个实施例的图示。Figure 3 is a diagram illustrating one embodiment of a paste as subitem operation.
图4是示出剪切操作的一个实施例的图示。Figure 4 is a diagram illustrating one embodiment of a shearing operation.
图5是示出粘贴为父项目操作的一个实施例的图示。Figure 5 is a diagram illustrating one embodiment of a paste as parent operation.
图6是示出用于创建图表的方法的一个实施例的流程图说明。Figure 6 is a flowchart illustration showing one embodiment of a method for creating a chart.
图7是示出用于修改图表的方法的一个实施例的流程图说明。Figure 7 is a flowchart illustration showing one embodiment of a method for modifying a chart.
图8是示出从一图表复制和粘贴到另一图表的操作的一个实施例的图示。Figure 8 is a diagram illustrating one embodiment of the operation of copying and pasting from one chart to another.
详细描述A detailed description
虽然本发明容许各种修改和替换形式,但是本发明的各具体实施例作为示例在各图中示出,且将在此处详细描述。然而,应当理解,不存在将本发明限于所公开的具体形式的意图,而是相反,本发明是要覆盖落入权利要求所定义的本发明的精神和范围内的所有修改、等效技术方案以及替换技术方案。一般而言,选择各实施例来突出本发明的创造性方面或特征。While the invention is susceptible to various modifications and alternative forms, specific embodiments of the invention are shown in the drawings by way of example and will be described in detail herein. It should be understood, however, that there is no intention to limit the invention to the particular forms disclosed, but on the contrary, the invention is to cover all modifications, equivalent technical solutions falling within the spirit and scope of the invention as defined by the claims and alternative technical solutions. In general, the embodiments were chosen to highlight inventive aspects or features of the invention.
在整个说明书中,相同标号指示全部附图描述中的相同元素。Throughout the specification, like reference numerals refer to like elements throughout the description of the figures.
当元素被称为被“连接”或“耦合”时,该元素可被直接相互连接或耦合,或者也可以存在一个或多个居间元素。相反,当元素被称为被“直接连接”或“直接耦合”时,并不存在居间元素。When elements are referred to as being "connected" or "coupled", the elements can be directly connected or coupled to each other, or one or more intervening elements may also be present. In contrast, when elements are referred to as being "directly connected" or "directly coupled," there are no intervening elements present.
本发明可被实现为设备、系统、方法、和/或计算机程序产品。因此,本发明的部分或全部可以用硬件和/或软件(包括固件、常驻软件、微码、状态机、门阵列等)来实现。此外,本发明可以采用计算机可用或计算机可读存储介质上的计算机程序产品的形式,这些介质将计算机可用或计算机可读程序代码包含在介质中,以供指令执行系统使用或结合其一起使用。在本文的上下文中,计算机可用或计算机可读介质可以是能够包含、存储、通信、传播或传送由指令执行系统、装置或设备使用或结合其一起使用的任何介质。The present invention can be implemented as an apparatus, system, method, and/or computer program product. Accordingly, part or all of the present invention may be implemented in hardware and/or software (including firmware, resident software, microcode, state machines, gate arrays, etc.). Furthermore, the invention may take the form of a computer program product on a computer-usable or computer-readable storage medium having computer-usable or computer-readable program code embodied on the medium for use by or in connection with an instruction execution system. In this context, a computer-usable or computer-readable medium may be any medium capable of containing, storing, communicating, propagating or transporting for use by or in connection with an instruction execution system, apparatus or device.
作为示例而非限制,计算机可用或计算机可读介质可以是电、磁、光、电磁、红外或半导体系统、装置、设备或传播介质。作为示例而非限制,计算机可读介质可以包括计算机存储介质和通信介质。By way of example and not limitation, a computer-usable or computer-readable medium can be an electrical, magnetic, optical, electromagnetic, infrared or semiconductor system, apparatus, device or propagation medium. By way of example, and not limitation, computer readable media may comprise computer storage media and communication media.
计算机存储介质包括能以用于存储诸如计算机可读指令、数据结构、程序模块或其他数据这样的信息的任何方法或技术实现的易失性和非易失性介质、可移动和不可移动介质。计算机存储介质包括但不限于,RAM、ROM、EEPROM、闪存或者其它存储器技术、CD-ROM、数字多功能盘(DVD)或者其它光学存储、磁带盒、磁带、磁盘存储或者其它磁存储设备、或者能够用来存储所需信息并且能够由指令执行系统访问的任何其它介质。注意,计算机可用或计算机可读介质可以是其上印有程序的纸张或其他适当的介质,因为程序可通过例如对纸张或其他介质进行光学扫描而获得,然后如有需要被编译、解释、或按适当的方式处理,随后被存储在计算机存储器中。Computer storage media includes volatile and nonvolatile, removable and non-removable media implemented in any method or technology for storage of information such as computer readable instructions, data structures, program modules or other data. Computer storage media includes, but is not limited to, RAM, ROM, EEPROM, flash memory or other memory technology, CD-ROM, digital versatile disk (DVD) or other optical storage, magnetic tape cartridges, magnetic tape, magnetic disk storage or other magnetic storage devices, or Any other medium that can be used to store the required information and that can be accessed by the instruction execution system. Note that the computer-usable or computer-readable medium may be paper or other suitable medium on which the program is printed, since the program may be obtained by, for example, optically scanning the paper or other medium, and then compiled, interpreted, or processed in an appropriate manner and subsequently stored in computer memory.
通信介质通常以诸如载波或其他传输机制等已调制数据信号来体现计算机可读指令、数据结构、程序模块或其他数据,并且包括任何信息传送介质。术语“已调制数据信号”表示按在信号中编码信息的方式设置或改变其一个或多个特性的信号。作为示例而非限制,通信介质包括诸如有线网络或直接线连接等有线介质,以及诸如声学、RF、红外和其他无线介质等无线介质。上述的任何组合也应当被包括在计算机可读介质的范围内。Communication media typically embodies computer readable instructions, data structures, program modules or other data in a modulated data signal such as a carrier wave or other transport mechanism and includes any information delivery media. The term "modulated data signal" means a signal that has one or more of its characteristics set or changed in such a manner as to encode information in the signal. By way of example, and not limitation, communication media includes wired media such as a wired network or direct-wired connection, and wireless media such as acoustic, RF, infrared and other wireless media. Combinations of any of the above should also be included within the scope of computer readable media.
当本发明在计算机可执行指令的一般上下文中实现时,该实施例可以包括由一个或多个系统、计算机或其他设备执行的程序模块。通常,程序模块包括执行特定任务或实现特定抽象数据类型的例程、程序、对象、组件、数据结构等。通常,程序模块的功能可以在各实施例中按需组合或分布。When the invention is implemented in the general context of computer-executable instructions, the embodiments may include program modules executed by one or more systems, computers or other devices. Generally, program modules include routines, programs, objects, components, data structures, etc. that perform particular tasks or implement particular abstract data types. Generally, the functions of the program modules may be combined or distributed as desired in various embodiments.
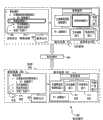
图1是示出图表的构造的实施例100的图示。图表定义102与数据104组合以使用粘贴操作107来创建图表106。FIG. 1 is a diagram of an embodiment 100 showing the construction of a graph. Chart definition 102 is combined with data 104 to create chart 106 using paste operation 107 .
图表定义102包括一组关系定义108、数据模型110以及图示视图112。数据模型110和图示视图112都包括若干对象。Diagram definition 102 includes a set of relationship definitions 108 , data model 110 , and diagram view 112 . Both the data model 110 and the diagram view 112 include a number of objects.
当与数据104结合时,图表定义102可用来创建图表106。图表106包括数据视图114、图示视图116以及图表定义102。When combined with data 104 , graph definition 102 may be used to create graph 106 . Chart 106 includes data view 114 , diagram view 116 , and chart definition 102 .
实施例100示出了用于使用预定义图表定义102来创建图表的机制。在图表定义102内,使用一组关系定义108来构造数据模型110,并且用来描述图示视图112。多个对象可被置于数据模型110中,并且还可以在图示视图112中表示相同的对象。Embodiment 100 illustrates a mechanism for creating diagrams using predefined diagram definitions 102 . Within the diagram definition 102 , a set of relationship definitions 108 are used to construct the data model 110 and to describe the diagram view 112 . Multiple objects may be placed in data model 110 and the same object may also be represented in diagrammatic view 112 .
数据模型110可以具有关系定义108中的规则,它描述该模型中的各项目或各对象之间的可接受关系。在某些数据模型中,各项目之间的关系可以是对等关系,并且这种项目有时可被当作顺序关系。在其他数据模型中,各项目之间的关系可以是分层关系,并且可以缩进子项目或按与父项目不同的其它方式来显示。Data model 110 may have rules in relationship definitions 108 that describe acceptable relationships between items or objects in the model. In some data models, the relationship between items can be a peer-to-peer relationship, and such items can sometimes be treated as an order relationship. In other data models, the relationship between items may be hierarchical, and sub-items may be indented or otherwise displayed differently than parent items.
图示视图112同样也可以具有关系定义108中的规则,它定义各项目之间的布局、定位以及其他图示关系。图示视图112以排列成圆环的一系列箭头来定义项目118、120和122。项目之间的关系是顺序的,从而项目120跟随项目118,且项目122跟随项目120。Diagram view 112 may also have rules in relationship definition 108 that define the layout, positioning, and other diagram relationships between items. Diagram view 112 defines items 118, 120, and 122 as a series of arrows arranged in a circle. The relationship between the items is sequential such that item 120 follows item 118 and item 122 follows item 120 .
粘贴操作107将数据104添加到数据模型110中,以便创建图表106。数据104有四个项目,“雨”、“水”、“蒸发”以及“云”。在此情形中的数据模型110将数据项目作为对等或顺序来处理,数据视图114在相同分层层次上示出所有四个项目。关系定义108可以创建每个数据项目之间的关系。在此示例中,关系可以是顺序的。Paste operation 107 adds data 104 to data model 110 in order to create diagram 106 . The data 104 has four items, "rain", "water", "evaporation" and "cloud". The data model 110 in this case treats the data items as peers or sequences, and the data view 114 shows all four items on the same hierarchical level. Relationship definitions 108 can create relationships between each data item. In this example, the relationship can be sequential.
图示视图116示出了根据图表定义102显示在图表中的所有四个项目。每个项目都在排列为圆环的一组箭头中按顺序示出。可以使用允许许多不同数量的项目的规则来定义图示视图116。例如,如果将另一项目添加到数据中,则图示视图116可以包括排列成圆环的五个箭头。在某些情况下,图示视图可被创建为独立于数据项目的数量,而在其他情况下,图示视图可以需要特定数量或最大和/或最小数量的项目。Diagram view 116 shows all four items displayed in the diagram according to diagram definition 102 . Each item is shown sequentially in a set of arrows arranged in a circle. Diagram view 116 may be defined using rules that allow many different numbers of items. For example, if another item is added to the data, the graphical view 116 may include five arrows arranged in a circle. In some cases, a graphical view may be created independent of the number of data items, while in other cases, a graphical view may require a specific number or a maximum and/or minimum number of items.
在图形用户界面(GUI)中,可以显示图示视图116和/或数据视图114。在某些实施例中,可允许用户操纵图示视图116的图形元素,且用户还可以直接在图示视图中编辑、添加以及移除项目。某些实施例可使用户能够编辑、添加以及从数据视图114中移除项。在某些实施例中,用户能够将数据视图114和图示视图116同时显示在GUI上。In a graphical user interface (GUI), a graphical view 116 and/or a data view 114 may be displayed. In some embodiments, the user may be allowed to manipulate graphical elements of the diagram view 116, and the user may also edit, add, and remove items directly in the diagram view. Certain embodiments may enable users to edit, add, and remove items from the data view 114 . In some embodiments, the user is able to display the data view 114 and the graphical view 116 simultaneously on the GUI.
当添加项或从数据视图114或图示视图116中移除项时,改变之后的剩余项目之间的关系就必须重新建立。例如,如果在现有项目“水”之后添加项目“海洋”,则“水”和“蒸发”之间的关系将被解除,并且建立起“水”和新添加的“海洋”之间以及“海洋”和“蒸发”之间的顺序关系。When items are added or removed from the data view 114 or diagram view 116, the relationships between the remaining items after the change must be re-established. For example, if the item "Ocean" is added after the existing item "Water", the relationship between "Water" and "Evaporation" will be released, and the relationship between "Water" and the newly added "Ocean" and " The order relationship between "ocean" and "evaporation".
在许多实施例中,图表定义102可以包括用于图示视图112中的项目的各种显示特性的默认设置。这种默认设置可以包括关于形状、边框、字体、颜色、阴影或可以影响外观的其他设置的特性。另外,默认设置可以包括项目的空间定向。在某些实施例中,用户能够改变、变更或操纵这些设置中的一个或多个。In many embodiments, diagram definition 102 may include default settings for various display characteristics of items in diagram view 112 . Such default settings may include characteristics regarding shape, borders, fonts, colors, shadows, or other settings that may affect appearance. Additionally, the default settings can include the spatial orientation of the item. In some embodiments, a user is able to change, alter or manipulate one or more of these settings.
在粘贴操作107之后,图表定义102被包含在图表106内。因为对图表106做了改变,所以可参照图表定义102来协调对图表106的改变。在某些情况下,对图表106的改变可以包括覆盖图表定义102的默认或其他设置。在其他情况下,对图表106的改变可以包括将随图表定义102一起包含的规则和关系重新应用于图表106。虽然不是一个全面的操作列表,但在以下实施例中示出了此种动作的若干示例。After the paste operation 107 , the chart definition 102 is contained within the chart 106 . As changes are made to the diagram 106 , the diagram definition 102 may be referenced to coordinate changes to the diagram 106 . In some cases, changes to graph 106 may include overriding default or other settings of graph definition 102 . In other cases, changes to the graph 106 may include reapplying the rules and relationships included with the graph definition 102 to the graph 106 . While not a comprehensive list of operations, several examples of such actions are shown in the following embodiments.
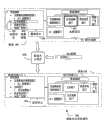
图2是分层图表的构造的实施例200的图示。图表定义204可与数据206结合以使用粘贴操作210来创建图表208。FIG. 2 is an illustration of an embodiment 200 of the construction of a hierarchical graph.
图表定义204可以包括某些关系定义212、数据模型214以及图示表示216。数据模型214描述分层数据模型,其中项目222处于数据模型214的最高层,且项目224和226是项目222的子项目。当在图示表示216中示出时,项目222处于组织结构图的顶层,项目224和226处于项目222后的第二层。
由粘贴操作210产生的图表208包含数据视图218和图示视图220。图表208还包括图表定义204。The diagram 208 resulting from the paste operation 210 includes a data view 218 and a diagram view 220 . Chart 208 also includes
在数据206中,数据以三层深的分层或缩进格式来呈现。“911监察部门”是“交通事故损害赔偿部门”的子部门,而“交通事故损害赔偿部门”是“常务律师”的子部门。图表定义204的关系定义212可以包括用于处理分层关系的许多层的规定。In data 206, data is presented in a hierarchical or indented format three levels deep. The "911 Supervision Department" is a sub-department of the "Traffic Accident Compensation Department", and the "Traffic Accident Compensation Department" is a sub-department of the "Standing Lawyer". Relationship definition 212 of
实施例200是分层数据模型的一个示例。分层数据模型可以包括具有对等或顺序关系的若干数据项目。例如,项目“交通事故损害赔偿部门”、“快速解决部门”和“电视广告部门”都是相互对等的。在有些图表中,这些项目可以按顺序的方式显示,例如用连续项目之间的箭头来显示。在某些实施例中,可在纯粹顺序的图表中使用分层数据。在这种情况下,可以按缩进大纲形式来构造某些数据,但是仅对最高层项目分配单独的图示项目。当文本被显示在项目的图示视图中时,若干缩进项目层可以被显示在单个图示项目中。Embodiment 200 is an example of a hierarchical data model. A hierarchical data model may include several data items with peer-to-peer or order relationships. For example, the items "Traffic Accident Damage Compensation Division", "Quick Resolution Division" and "Television Advertising Division" are all equivalent to each other. In some diagrams, these items may be displayed in a sequential fashion, for example by arrows between consecutive items. In some embodiments, hierarchical data may be used in a purely sequential graph. In this case, some data may be structured in an indented outline form, but only the highest-level items are assigned separate graphical items. When text is displayed in a graphical view of an item, several indented item layers may be displayed in a single graphical item.
许多类型的图表可以使用数据模型中的项目之间定义的关系来构造。除了更复杂的关系之外,还可以建立分层或顺序关系。复杂关系可以包括用于排序或其他数据操纵的规则,且可以取决于所构想的图表的类型。Many types of diagrams can be constructed using the relationships defined between items in the data model. In addition to more complex relationships, hierarchical or sequential relationships can also be established. Complex relationships may include rules for sorting or other data manipulation, and may depend on the type of graph being conceived.
数据206按文本形式呈现。在许多实施例中,可以将纯文本数据应用于图表定义来创建新图表。在某些实施例中,数据可以包括额外的元素,诸如字体、样式、颜色、阴影或其他视觉增强信息。而且,某些实施例可以使用除了文本之外的数据,诸如数字、图像或形状数据。各种图表定义可以不同地处理附加或其他数据。在某些情况下,可以完全删除或忽略附加或其他数据。在其他情况下,可以包括附加或其他数据的子集,然而在另外的情况下,可使用所有的附加或其他数据来构造图表。在某些实施例中,原始数据可以不包括任何文本数据,且可以由图形元素、数字数据、颜色类型或其他类型的数据构成。Data 206 is presented in textual form. In many embodiments, plain text data can be applied to a chart definition to create a new chart. In some embodiments, the data may include additional elements such as font, style, color, shading, or other visually enhancing information. Also, some embodiments may use data other than text, such as numerical, image or shape data. Various chart definitions can handle additional or other data differently. In some cases, additional or other data may be completely removed or ignored. In other cases, a subset of additional or other data may be included, while in other cases, all of the additional or other data may be used to construct the graph. In some embodiments, raw data may not include any textual data, and may consist of graphical elements, numerical data, color types, or other types of data.
图3是粘贴为子项目操作的粘贴的实施例300的图示。数据302被添加到图表208以便使用粘贴为子项目(paste-as-child)操作306来产生图表304。在图表208中,选择项目308,即“快速解决部门”。数据302包含两个项目,“文字曲解部门”和“快速讲话部门”,它们被添加为子项目。在图表304中,项目314和316分别对应于数据302的项目“文字曲解部门”和“快速讲话部门”。FIG. 3 is a diagram of an
图表304包含包括项目314和316的经更新的数据视图310,以及具有项目314和316的经更新的图示视图312。图示视图312的组织结构图示出了两个新项目314和316在“快速解决部门”下面。Chart 304 includes updated data view 310 including
实施例300是用于添加或粘贴项目到分层图表中的方法的一个说明。用户可以从数据视图218或图示视图220中选择项目308,且可以将数据302粘贴到数据308下面。用户可以通过编辑图示视图310或数据视图312来改变结果图表304。因为图示视图312和数据视图310可以是相同的底层数据的表示,所以用户可以使用用于任一表示的编辑工具来操纵数据。
当向图表304中使用的数据添加新数据302时,形成了现有数据和新数据之间的关系。因为新数据302是作为项目308的子项目添加的,所以在项目308和数据302中的每个项目之间形成子关系。“快速解决部门”和“电视广告部门”之间的对等或顺序关系已经存在,且甚至在将数据302作为子项目添加到项目308之后还保持完好。When new data 302 is added to the data used in graph 304, a relationship between the existing data and the new data is formed. Because new data 302 was added as a sub-item of
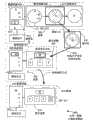
图4是剪切操作的实施例400的图示说明。项目402,即“快速解决部门”在图表304的数据视图310或图示视图312中被用户选择。在剪切操作404之后,创建图表406。图表406包含数据视图408、图示视图410以及图表定义204。FIG. 4 is an illustration of an
在实施例400中,从图表304中移除项目402。项目402与项目412和414有关系,该关系在剪切操作期间被切断。在图表406中,项目412和414的被切断的关系与其他项目复原或重建,从而与图表定义204一致。In
图表定义204可以包括不允许子项目在没有父项目的情况下存在的规则、逻辑或其他定义。如果项目402,即“快速解决部门”被移除,则项目412和414,即“文字曲解部门”和“快速讲话部门”就成了无父项目的子项目。在移除项目402之后,应用图表定义204的逻辑,且将项目412和414提升到分层结构的下一较高层。这种提升使数据模型与逻辑保持一致。
不同的图表定义可以结合定义该图表的不同逻辑组。某些图表定义可以允许子项目与直接上层上的父项目解除附连,而其它图表定义可能不如此允许。在某些图表定义中,例如,各项目的顺序是重要的,且可以强制实施规则以确保符合规则。每个图表定义可以有或没有定义数据项目之间的关系的某些最低准则的规则或逻辑。不管用于特定图表的规则或逻辑是什么,在数据结构变化时都可以强制实施该规则或逻辑。Different graph definitions can combine different logical groups that define the graph. Some diagram definitions may allow child items to be unattached from the parent item on the immediate parent, while others may not. In some graph definitions, for example, the order of items is important and rules can be enforced to ensure compliance. Each graph definition may or may not have rules or logic that define some minimum guidelines for relationships between data items. Regardless of the rules or logic used for a particular diagram, the rules or logic can be enforced when the data structure changes.
图5是粘贴为父项目(paste-as-parent)操作的实施例500的图示说明。项目502,即“文字曲解部门”在图表406的数据视图408或图示视图410中被用户选择。数据504“合同部门”通过粘贴为父项目操作506被添加到图表以便创建图表508。图表508包含数据视图510、图示视图512以及图表定义204。FIG. 5 is an illustration of an
实施例500示出了改变图表中的各项目之间的关系的另一操作。数据504“合同部门”作为父项目被添加到项目502,即“文字曲解部门”。为“文字曲解部门”建立一组新关系,它包括成为新添加的“合同部门”的子项目。“常务律师”和“文字曲解部门”之间的先前的父/子关系被切断。用于“合同部门”的关系包括成为“常务律师”的子项目、“文字曲解部门”的父项目以及“交通事故损害赔偿部门”、“快速讲话部门”和“电视广告部门”的对等项目。
图6是用于创建图表的方法的实施例600的流程图说明。在框602中定义图表定义。在框604中将数据添加到图表定义。在框606中按照图表定义的关系定义来组织传入数据,并且在框608中将该数据被分配给各项目。在框610中建立各项目之间的关系。FIG. 6 is a flowchart illustration of an embodiment 600 of a method for creating a graph. In block 602 a chart definition is defined. Data is added to the chart definition in block 604 . Incoming data is organized in block 606 according to the relationship definitions defined by the graph, and in block 608 the data is assigned to projects. Relationships between items are established in block 610 .
在框612中使用关系和图表定义来构造图示视图,之后在框614中将格式和样式应用于该图示视图。在框616中显示该新的图示视图,且在框618中显示新的数据视图。该过程在框620中结束。The diagram view is constructed using the relationships and diagram definitions in block 612 , and then formatting and styles are applied to the diagram view in block 614 . The new pictorial view is displayed in block 616 and the new data view is displayed in block 618 . The process ends in block 620 .
实施例600示出了由预定义图表定义用来创建图表的方法。可以首先检查传入数据,且将其组织成与图表定义的数据模型一致。可以建立各项目之间的关系,以使图表中各项目的改变、添加以及删除可以容易地合并到该图表的图示视图中。该关系可以有助于保持图表的图示视图一致,且当做出改变时该图示视图对用户来说是直观的。Embodiment 600 illustrates a method used to create graphs defined by predefined graphs. Incoming data can first be inspected and organized to be consistent with the data model defined by the diagram. Relationships between items can be established so that changes, additions, and deletions of items in a diagram can be easily incorporated into the graphical view of the diagram. This relationship can help keep the graphical view of the diagram consistent and intuitive to the user when changes are made.
本说明书所描述的关系可以是可被个别地分配给每个项目的明确关系,或者关系可以被隐含在数据的更大定义或组织中。例如,当以列表格式中呈现数据时,诸如由如回车等定界符分隔的一系列文本项目,则可能存在隐含的顺序和对等关系。在这种数据模型内,隐含的关系足以使图表定义正常运行。在另一实施例中,单独的文本项目可以被分成离散的对象或项目,其每一个都有该项目和另一项目之间的明确定义的关系。各种实现或实施例可以按不同的方式处理数据定义和关系定义。某些实施例可以更简单地定义却需要更少的处理或数据存储开销。其他实施例可以按更复杂却更强大的方式来定义,从而对各项目有更复杂的控制。The relationships described in this specification can be explicit relationships that can be assigned to each item individually, or the relationships can be implicit in the larger definition or organization of the data. For example, when data is presented in a list format, such as a series of text items separated by a delimiter such as a carriage return, there may be implied order and equivalence relationships. Within this data model, the implied relationships are sufficient for the diagram definition to function properly. In another embodiment, individual textual items may be divided into discrete objects or items, each of which has a well-defined relationship between that item and another item. Various implementations or embodiments may handle data definitions and relationship definitions differently. Certain embodiments may be simpler to define yet require less processing or data storage overhead. Other embodiments can be defined in more complex yet powerful ways, allowing more sophisticated control over items.
图7是示出用于改变图表的数据结构的方法的实施例700的流程图说明。在现有图表中,在框702中选择一个或多个项目。在框704中改变数据结构。在过程706中复原数据结构中的项目的关系。复原过程对框708中的每个项目包括,在框710中评价该项目的关系。如果在框710中该关系不合适,则在框712中按照图表定义建立新关系。在所有关系都复原之后,在框714中生成并显示新的图示视图,且在框716中生成并显示新的数据视图。该过程在框718中结束。FIG. 7 is a flowchart illustration of an
实施例700可用于对图表中的数据的任何修改。例如,可在框702中选择一项目,且在框704中剪切它。在另一示例中,可在框702中选择一项目,且在框704中用不同的项目替换它。在又一示例中,可在框702中选择一项目,且在框704中添加额外的项目。
在修改数据结构之后,可在方法706中复原关系。关系可以为每个项目明确地定义,或者可以隐含在数据结构中。在任何一种情况下,单独扫描各项目以确保它们遵守图表定义。每个图表定义可以包含其自己的用于可接受数据结构的特定规则或定义。After modifying the data structure, the relationship can be restored in
一旦被过程706检查,就可在框714中使用关系和数据结构来创建新的图示视图。诸如顺序或分层等数据关系可由图示定义用来创建、组织以及布置图示视图。Once examined by
图8是从一图表到另一图表的复制/粘贴操作的图示。第一图表802包含数据视图804、图示视图806以及图表定义810。可以从数据视图804或图示视图806中选择项目812并复制814到缓冲区816中。Figure 8 is an illustration of a copy/paste operation from one chart to another. The
第二图表820可以包含数据视图822、图示视图824以及图表定义826。可以在数据视图822或图示视图824中选择项目828,且可以执行粘贴为子项目操作830。粘贴操作830可以包括保持任何定制参数的选项。The second diagram 820 may contain a data view 822 , a
图表832可由粘贴操作产生。修改的数据视图834和图示视图836合并了来自粘贴操作的改变,且图表832保留相同的图表定义826。Chart 832 may result from a paste operation. Modified data view 834 and
图表802中的项目812可以具有诸如被加阴影的某些定制参数设置。这些设置可通过用户选择项目812并修改改变项目812的外观的某些默认设置来来引起。当项目被复制到可以是剪贴板或其他此种工具的缓冲区816中时,可以复制该项目的整个定义。例如,复制项目812的形状以及定制的阴影。
当项目812被粘贴到图表820中时,定义该项目的某些参数被保留,而其它参数则被丢弃。例如,为圆形的项目812的原始形状被丢弃,且新项目838被创建为矩形。然而,项目812的定制阴影设置被应用于类似地加阴影的项目838。When
图表定义826可以定义诸如定制的阴影等可被导入到图表820中的参数类型、以及诸如形状等不能被导入的参数类型。在某些情况下,来自另一图表的定制参数可被导入,但是非定制参数则不可以。例如,项目812可以将默认文本样式应用于整个图表802。当项目812被导入到图表802中时,可以应用图表820的默认文本样式。然而,如果从默认设置更改812文本样式,则定制样式可以覆盖目的地图表820的默认设置。可被应用于项目812的任何参数可被任选地导入到图表820中。
在某些情况下,用户可以具有这样的选项:来自源图表820和项目812的参数将被应用于由对目的地图表820的粘贴或其他导入操作产生的新创建的项目。例如,可以向用户呈现对话框,或者用户可以具有使用户能够选择特定参数来导入的其他可设置选项。In some cases, the user may have the option that parameters from source diagram 820 and
在其他情况下,当从另一图表802导入时,目的地图表820的图表定义826可以具有定义新项目如何被创建的过滤器或其他类型的规则。该规则可以指定某些参数将不被导入、某些参数将被任选地被导入、和/或某些参数将始终被导入。有某些情况下,可以导入参数,但可改变它以使其符合目的地图表的样式或规则。In other cases, when importing from another diagram 802, the
可被导入或改变的参数可以包括可被分配给图表中的项目的任何变量或值。取决于系统的设计、约定、与其他系统的兼容性或任何其他原因,每个实施例或实现可以有具有带不同设置的不同参数。Parameters that can be imported or changed can include any variable or value that can be assigned to an item in the diagram. Each embodiment or implementation may have different parameters with different settings depending on the design of the system, conventions, compatibility with other systems, or any other reason.
图表802是允许分层数据结构的纯顺序图表的一个示例。图示视图806中的项目被定义成三个项目,它们对应于数据视图804中的最高层项目。该项目恰巧以从一个项目到另一个项目的箭头以顺序的方式来排列。第一个项目840包括父项目“A”具有子项目“B”和“C”的形式的分层数据。此分层信息被显示成图示视图806中顶层的“A”具有缩进子项目“B”和“C”。在图表802中,允许且以特定方式处理分层信息,即使图示视图806是纯顺序的或是对等型图形表示。Diagram 802 is an example of a purely sequential diagram that allows for hierarchical data structures. The items in the diagram view 806 are defined as three items that correspond to the top-level items in the data view 804 . The items happen to be arranged in a sequential fashion with arrows from one item to another. The first item 840 includes hierarchical data in the form of a parent item "A" with sub-items "B" and "C". This hierarchical information is displayed with "A" at the top level in pictorial view 806 with indented sub-items "B" and "C". In diagram 802, hierarchical information is allowed and handled in a specific manner, even though diagram view 806 is a purely sequential or peer-to-peer graphical representation.
出于说明和描述的目的已经呈现本发明的以上描述。这不旨在成为穷尽性的或将本发明限于所公开的精确形式,且根据以上所教内容可以做出其他可能修改或变型。选择和描述各实施例以便最佳地解释本发明的原理及其实际应用,从而使本领域技术员能够在适用于构想的特定用途的各实施例和各修改中最佳地利用本发明。除被限制在现有技术的范围内之外,所附权利要求旨在被解释为包括本发明的其他替换实施例。The foregoing description of the invention has been presented for purposes of illustration and description. It is not intended to be exhaustive or to limit the invention to the precise form disclosed, and other possible modifications or variations are possible in light of the above teaching. The embodiments were chosen and described in order to best explain the principles of the invention and its practical application, thereby enabling others skilled in the art to best utilize the invention in various embodiments and with modifications as are suited to the particular use contemplated. The appended claims are intended to be construed to cover other alternative embodiments of the invention, in addition to being limited within the scope of the prior art.
Claims (20)
Applications Claiming Priority (2)
| Application Number | Priority Date | Filing Date | Title |
|---|---|---|---|
| US11/281,076 | 2005-11-17 | ||
| US11/281,076US8042065B2 (en) | 2005-11-17 | 2005-11-17 | Smart copy/paste of graphical nodes |
Publications (1)
| Publication Number | Publication Date |
|---|---|
| CN101313294Atrue CN101313294A (en) | 2008-11-26 |
Family
ID=38042164
Family Applications (1)
| Application Number | Title | Priority Date | Filing Date |
|---|---|---|---|
| CNA2006800431608APendingCN101313294A (en) | 2005-11-17 | 2006-11-13 | Intelligent copy/paste of graph nodes |
Country Status (4)
| Country | Link |
|---|---|
| US (3) | US8042065B2 (en) |
| KR (1) | KR20080068869A (en) |
| CN (1) | CN101313294A (en) |
| WO (1) | WO2007061689A1 (en) |
Cited By (1)
| Publication number | Priority date | Publication date | Assignee | Title |
|---|---|---|---|---|
| CN103744832A (en)* | 2013-12-27 | 2014-04-23 | 华为技术有限公司 | Data multiplexing method and device |
Families Citing this family (18)
| Publication number | Priority date | Publication date | Assignee | Title |
|---|---|---|---|---|
| US8134575B2 (en)* | 2004-09-30 | 2012-03-13 | Microsoft Corporation | Maintaining graphical presentations based on user customizations |
| US8510657B2 (en) | 2004-09-30 | 2013-08-13 | Microsoft Corporation | Editing the text of an arbitrary graphic via a hierarchical list |
| US7348982B2 (en)* | 2004-09-30 | 2008-03-25 | Microsoft Corporation | Method, system, and computer-readable medium for creating and laying out a graphic within an application program |
| US7750924B2 (en)* | 2005-03-15 | 2010-07-06 | Microsoft Corporation | Method and computer-readable medium for generating graphics having a finite number of dynamically sized and positioned shapes |
| US7743325B2 (en)* | 2005-03-15 | 2010-06-22 | Microsoft Corporation | Method and computer-readable medium for fitting text to shapes within a graphic |
| US7747944B2 (en) | 2005-06-30 | 2010-06-29 | Microsoft Corporation | Semantically applying style transformation to objects in a graphic |
| US8438486B2 (en) | 2006-02-09 | 2013-05-07 | Microsoft Corporation | Automatically converting text to business graphics |
| US20090182595A1 (en)* | 2008-01-15 | 2009-07-16 | Milaski John J | Operational Transformation for Analyzing Business Processes |
| CN101241436B (en)* | 2008-02-21 | 2011-07-27 | 北大方正集团有限公司 | Rapid object grouping method for supporting pasting |
| EP2333651B1 (en)* | 2009-12-11 | 2016-07-20 | Dassault Systèmes | Method and system for duplicating an object using a touch-sensitive display |
| US8799325B2 (en)* | 2010-03-12 | 2014-08-05 | Microsoft Corporation | Reordering nodes in a hierarchical structure |
| US20110283204A1 (en)* | 2010-05-12 | 2011-11-17 | Microsoft Corporation | Pasting Various Data into a Programming Environment |
| US8832578B1 (en)* | 2011-12-08 | 2014-09-09 | Google Inc. | Visual clipboard on soft keyboard |
| WO2014140666A1 (en)* | 2013-03-12 | 2014-09-18 | Lg Electronics Inc. | Terminal and method of operating the same |
| WO2014186419A1 (en) | 2013-05-13 | 2014-11-20 | Mitutoyo Corporation | Machine vision system program editing environment including operating context aware copy and paste feature |
| US9569062B2 (en)* | 2014-05-21 | 2017-02-14 | Facebook, Inc. | Asynchronous execution of animation tasks for a GUI |
| US9882979B2 (en) | 2015-03-16 | 2018-01-30 | International Business Machines Corporation | Image file transmission |
| US10783012B2 (en) | 2018-04-20 | 2020-09-22 | CopyBucket, Inc. | Systems and methods for efficient inter-device data exchange |
Family Cites Families (20)
| Publication number | Priority date | Publication date | Assignee | Title |
|---|---|---|---|---|
| US5010500A (en)* | 1989-01-26 | 1991-04-23 | Xerox Corporation | Gesture-modified diagram for retrieval of image resembling diagram, with parts selectable for further interactive retrieval |
| US5020411A (en)* | 1989-03-06 | 1991-06-04 | Larry Rowan | Mobile assault logistic kinetmatic engagement device |
| US5050088A (en)* | 1989-03-29 | 1991-09-17 | Eastman Kodak Company | Production control system and method |
| US5652884A (en)* | 1994-11-14 | 1997-07-29 | Object Technology Licensing Corp. | Method and apparatus for dynamic update of an existing object in an object editor |
| US5623541A (en)* | 1995-02-17 | 1997-04-22 | Lucent Technologies Inc. | Apparatus to manipulate and examine the data structure that supports digit analysis in telecommunications call processing |
| US5838563A (en)* | 1996-04-12 | 1998-11-17 | Fisher-Rosemont Systems, Inc. | System for configuring a process control environment |
| US5905498A (en)* | 1996-12-24 | 1999-05-18 | Correlate Technologies Ltd | System and method for managing semantic network display |
| US6128617A (en)* | 1997-11-24 | 2000-10-03 | Lowry Software, Incorporated | Data display software with actions and links integrated with information |
| CA2256931A1 (en)* | 1998-12-23 | 2000-06-23 | Robert Weisz | Source editing in a graphical hierarchical environment |
| US7249328B1 (en)* | 1999-05-21 | 2007-07-24 | E-Numerate Solutions, Inc. | Tree view for reusable data markup language |
| US6920608B1 (en)* | 1999-05-21 | 2005-07-19 | E Numerate Solutions, Inc. | Chart view for reusable data markup language |
| US20020059272A1 (en)* | 2000-04-20 | 2002-05-16 | Porter Edward W. | Apparatuses, methods, programming, and propagated signals for creating, editing, organizing and viewing collaborative databases |
| US7110936B2 (en)* | 2001-02-23 | 2006-09-19 | Complementsoft Llc | System and method for generating and maintaining software code |
| US7156655B2 (en)* | 2001-04-13 | 2007-01-02 | Orametrix, Inc. | Method and system for comprehensive evaluation of orthodontic treatment using unified workstation |
| US20020178184A1 (en)* | 2001-05-22 | 2002-11-28 | Allan Kuchinsky | Software system for biological storytelling |
| US7475333B2 (en)* | 2001-06-01 | 2009-01-06 | Sap Ag | Defining form formats with layout items that present data of business application |
| US7644361B2 (en)* | 2002-12-23 | 2010-01-05 | Canon Kabushiki Kaisha | Method of using recommendations to visually create new views of data across heterogeneous sources |
| CN100390791C (en)* | 2004-05-31 | 2008-05-28 | 国际商业机器公司 | Method and apparatus for editing, reorganizing verification, creating and converting flowcharts |
| US8510657B2 (en)* | 2004-09-30 | 2013-08-13 | Microsoft Corporation | Editing the text of an arbitrary graphic via a hierarchical list |
| US7730429B2 (en)* | 2004-12-03 | 2010-06-01 | Spark-Space Ltd. | Graphical workspace for idea management |
- 2005
- 2005-11-17USUS11/281,076patent/US8042065B2/enactiveActive
- 2006
- 2006-11-13KRKR1020087011846Apatent/KR20080068869A/ennot_activeAbandoned
- 2006-11-13WOPCT/US2006/044169patent/WO2007061689A1/enactiveApplication Filing
- 2006-11-13CNCNA2006800431608Apatent/CN101313294A/enactivePending
- 2011
- 2011-09-15USUS13/234,113patent/US9639230B2/ennot_activeExpired - Fee Related
- 2017
- 2017-03-28USUS15/471,748patent/US20170199628A1/ennot_activeAbandoned
Cited By (1)
| Publication number | Priority date | Publication date | Assignee | Title |
|---|---|---|---|---|
| CN103744832A (en)* | 2013-12-27 | 2014-04-23 | 华为技术有限公司 | Data multiplexing method and device |
Also Published As
| Publication number | Publication date |
|---|---|
| US8042065B2 (en) | 2011-10-18 |
| KR20080068869A (en) | 2008-07-24 |
| US20070112832A1 (en) | 2007-05-17 |
| US20120005608A1 (en) | 2012-01-05 |
| WO2007061689A1 (en) | 2007-05-31 |
| US20170199628A1 (en) | 2017-07-13 |
| US9639230B2 (en) | 2017-05-02 |
Similar Documents
| Publication | Publication Date | Title |
|---|---|---|
| CN101313294A (en) | Intelligent copy/paste of graph nodes | |
| CN110727687B (en) | Material list conversion method and system | |
| US10573038B2 (en) | Editing the text of an arbitrary graphic via a hierarchical list | |
| US6986120B2 (en) | System and apparatus for programming system views in an object oriented environment | |
| AU2020298056B2 (en) | Autolayout of visualizations based on graph data | |
| CA2884365C (en) | Graphically representing programming attributes | |
| US20060150169A1 (en) | Object model tree diagram | |
| US20220164526A1 (en) | Method And Apparatus For Structured Documents | |
| US7899846B2 (en) | Declarative model editor generation | |
| JP2009508227A (en) | Browse mode designer | |
| CN114461200A (en) | A low-code development application and method based on cloud SaaS platform | |
| CN103092589A (en) | SSH (Struts, Spring and Hibernate) frame based code automatic generation method | |
| CN110705237A (en) | Automatic document generation method, data processing device, and storage medium | |
| CN109445794B (en) | Page construction method and device | |
| CN109033157B (en) | Complex data retrieval method and system based on user-defined search condition tree | |
| CN113986158B (en) | Printing method, printing designer and computer readable storage medium | |
| CN109636883A (en) | A kind of advertising pictures processing system based on Canvas | |
| US9250925B2 (en) | Adding inheritance support to a computer programming language | |
| CN105867995A (en) | Editing method and device for XML (extensible markup language) file | |
| CN116340293B (en) | Data processing method, device, equipment and readable storage medium | |
| CN108509554B (en) | Method for rapidly generating tissue architecture diagram based on WPF technology and EXCEL | |
| CN114995802A (en) | Configuration method and device for industrial automation engineering | |
| CN110134309A (en) | Drawing practice, device, electronic equipment and storage medium | |
| US20250284691A1 (en) | Fragment-based design search | |
| Jones | An example-based introduction to graph grammars for modeling |
Legal Events
| Date | Code | Title | Description |
|---|---|---|---|
| C06 | Publication | ||
| PB01 | Publication | ||
| C10 | Entry into substantive examination | ||
| SE01 | Entry into force of request for substantive examination | ||
| C12 | Rejection of a patent application after its publication | ||
| RJ01 | Rejection of invention patent application after publication | Application publication date:20081126 |