CN101287410A - Brain function analysis method and brain function analysis program - Google Patents
Brain function analysis method and brain function analysis programDownload PDFInfo
- Publication number
- CN101287410A CN101287410ACNA2006800380625ACN200680038062ACN101287410ACN 101287410 ACN101287410 ACN 101287410ACN A2006800380625 ACNA2006800380625 ACN A2006800380625ACN 200680038062 ACN200680038062 ACN 200680038062ACN 101287410 ACN101287410 ACN 101287410A
- Authority
- CN
- China
- Prior art keywords
- brain function
- data
- voxel
- value
- analysis
- Prior art date
- Legal status (The legal status is an assumption and is not a legal conclusion. Google has not performed a legal analysis and makes no representation as to the accuracy of the status listed.)
- Granted
Links
Images


Classifications
- G—PHYSICS
- G01—MEASURING; TESTING
- G01R—MEASURING ELECTRIC VARIABLES; MEASURING MAGNETIC VARIABLES
- G01R33/00—Arrangements or instruments for measuring magnetic variables
- G01R33/20—Arrangements or instruments for measuring magnetic variables involving magnetic resonance
- G01R33/44—Arrangements or instruments for measuring magnetic variables involving magnetic resonance using nuclear magnetic resonance [NMR]
- G01R33/48—NMR imaging systems
- G01R33/54—Signal processing systems, e.g. using pulse sequences ; Generation or control of pulse sequences; Operator console
- G01R33/56—Image enhancement or correction, e.g. subtraction or averaging techniques, e.g. improvement of signal-to-noise ratio and resolution
- G01R33/563—Image enhancement or correction, e.g. subtraction or averaging techniques, e.g. improvement of signal-to-noise ratio and resolution of moving material, e.g. flow contrast angiography
- G01R33/56341—Diffusion imaging
- A—HUMAN NECESSITIES
- A61—MEDICAL OR VETERINARY SCIENCE; HYGIENE
- A61B—DIAGNOSIS; SURGERY; IDENTIFICATION
- A61B5/00—Measuring for diagnostic purposes; Identification of persons
- A61B5/72—Signal processing specially adapted for physiological signals or for diagnostic purposes
- A61B5/7235—Details of waveform analysis
- A—HUMAN NECESSITIES
- A61—MEDICAL OR VETERINARY SCIENCE; HYGIENE
- A61B—DIAGNOSIS; SURGERY; IDENTIFICATION
- A61B5/00—Measuring for diagnostic purposes; Identification of persons
- A61B5/05—Detecting, measuring or recording for diagnosis by means of electric currents or magnetic fields; Measuring using microwaves or radio waves
- A61B5/055—Detecting, measuring or recording for diagnosis by means of electric currents or magnetic fields; Measuring using microwaves or radio waves involving electronic [EMR] or nuclear [NMR] magnetic resonance, e.g. magnetic resonance imaging
- A—HUMAN NECESSITIES
- A61—MEDICAL OR VETERINARY SCIENCE; HYGIENE
- A61B—DIAGNOSIS; SURGERY; IDENTIFICATION
- A61B5/00—Measuring for diagnostic purposes; Identification of persons
- A61B5/40—Detecting, measuring or recording for evaluating the nervous system
- A61B5/4058—Detecting, measuring or recording for evaluating the nervous system for evaluating the central nervous system
- A61B5/4064—Evaluating the brain
- A—HUMAN NECESSITIES
- A61—MEDICAL OR VETERINARY SCIENCE; HYGIENE
- A61B—DIAGNOSIS; SURGERY; IDENTIFICATION
- A61B5/00—Measuring for diagnostic purposes; Identification of persons
- A61B5/72—Signal processing specially adapted for physiological signals or for diagnostic purposes
- A61B5/7235—Details of waveform analysis
- A61B5/7264—Classification of physiological signals or data, e.g. using neural networks, statistical classifiers, expert systems or fuzzy systems
- G—PHYSICS
- G01—MEASURING; TESTING
- G01R—MEASURING ELECTRIC VARIABLES; MEASURING MAGNETIC VARIABLES
- G01R33/00—Arrangements or instruments for measuring magnetic variables
- G01R33/20—Arrangements or instruments for measuring magnetic variables involving magnetic resonance
- G01R33/44—Arrangements or instruments for measuring magnetic variables involving magnetic resonance using nuclear magnetic resonance [NMR]
- G01R33/48—NMR imaging systems
- G01R33/4808—Multimodal MR, e.g. MR combined with positron emission tomography [PET], MR combined with ultrasound or MR combined with computed tomography [CT]
- G01R33/481—MR combined with positron emission tomography [PET] or single photon emission computed tomography [SPECT]
- G—PHYSICS
- G01—MEASURING; TESTING
- G01R—MEASURING ELECTRIC VARIABLES; MEASURING MAGNETIC VARIABLES
- G01R33/00—Arrangements or instruments for measuring magnetic variables
- G01R33/20—Arrangements or instruments for measuring magnetic variables involving magnetic resonance
- G01R33/44—Arrangements or instruments for measuring magnetic variables involving magnetic resonance using nuclear magnetic resonance [NMR]
- G01R33/48—NMR imaging systems
- G01R33/54—Signal processing systems, e.g. using pulse sequences ; Generation or control of pulse sequences; Operator console
- G01R33/56—Image enhancement or correction, e.g. subtraction or averaging techniques, e.g. improvement of signal-to-noise ratio and resolution
- G01R33/5608—Data processing and visualization specially adapted for MR, e.g. for feature analysis and pattern recognition on the basis of measured MR data, segmentation of measured MR data, edge contour detection on the basis of measured MR data, for enhancing measured MR data in terms of signal-to-noise ratio by means of noise filtering or apodization, for enhancing measured MR data in terms of resolution by means for deblurring, windowing, zero filling, or generation of gray-scaled images, colour-coded images or images displaying vectors instead of pixels
Landscapes
- Health & Medical Sciences (AREA)
- Life Sciences & Earth Sciences (AREA)
- Physics & Mathematics (AREA)
- Engineering & Computer Science (AREA)
- Nuclear Medicine, Radiotherapy & Molecular Imaging (AREA)
- General Health & Medical Sciences (AREA)
- Public Health (AREA)
- Animal Behavior & Ethology (AREA)
- Molecular Biology (AREA)
- Surgery (AREA)
- Signal Processing (AREA)
- Veterinary Medicine (AREA)
- Biophysics (AREA)
- Pathology (AREA)
- Biomedical Technology (AREA)
- Heart & Thoracic Surgery (AREA)
- Medical Informatics (AREA)
- Physiology (AREA)
- Artificial Intelligence (AREA)
- Neurology (AREA)
- Radiology & Medical Imaging (AREA)
- High Energy & Nuclear Physics (AREA)
- Computer Vision & Pattern Recognition (AREA)
- General Physics & Mathematics (AREA)
- Psychiatry (AREA)
- Condensed Matter Physics & Semiconductors (AREA)
- Vascular Medicine (AREA)
- Fuzzy Systems (AREA)
- Neurosurgery (AREA)
- Psychology (AREA)
- Evolutionary Computation (AREA)
- Mathematical Physics (AREA)
- Magnetic Resonance Imaging Apparatus (AREA)
Abstract
Description
Translated fromChinese技术领域technical field
本发明涉及一脑功能分析方法及脑功能分析程序,该脑功能分析方法及脑功能分析程序使用不同检测技术获得的数据分析脑功能,如:fMRI(BOLD成像),PET(正电子发射断层成像)或类似技术。The present invention relates to a brain function analysis method and a brain function analysis program, the brain function analysis method and the brain function analysis program use the data obtained by different detection techniques to analyze brain function, such as: fMRI (BOLD imaging), PET (positron emission tomography) ) or similar techniques.
背景技术Background technique
如今典型的非介入性脑功能检测方法有fMRI,PET,MEG(脑磁图描技术)及其类似技术,其中fMRI被认为具有很强的空间分辨能力,并被广泛应用。Today's typical non-invasive brain function detection methods include fMRI, PET, MEG (magnetoencephalography) and similar techniques, among which fMRI is considered to have strong spatial resolution and is widely used.
fMRI是一种能通过反映脑不同物理量来确定脑激活区域的非常有效的脑功能检测手段(参见非专利文献1,2)。它除了能和检测脑结构的MRI解剖图像一样反映活体器官的质子密度,纵向弛豫时间T1和横向弛豫时间T2以外,还能特别的检测出脑激活区域中血液流量的增加。现在已知,在脑激活区域的血液流量会增加,同时血液中血红蛋白的磁性也会因其带氧状态即含氧血红蛋白(氧合血红蛋白)和脱氧血红蛋白(去氧血红蛋白)而不同。人们认为fMRI在激活区域的信号(BOLD信号)会增加,因为在增加的动脉血液中,具有干扰磁场能力的去氧血红蛋白的量减少了。因此,我们可以使用fMRI,以脑工作时BOLD信号的变化为线索,确定进行该工作的脑区域(激活区域)。fMRI is a very effective means of brain function detection that can determine brain activation regions by reflecting different physical quantities of the brain (see non-patent
fMRI检测得到的BOLD信号的时间序列数据的分析技术包括基于一种广泛的线性模型的SPM(统计参数绘图)(参见非专利文献1),或是基本主要组份分析或独立组份分析的数据分析(参见非专利文献3),或类似分析。这些分析技术的特点是其输出的结果中的BOLD信号的时间序列数据的每个三维像素(体素)都各自经过统计处理,最后形成图像从而确定脑的激活区域。Analysis techniques for time-series data of BOLD signals detected by fMRI include SPM (statistical parametric mapping) based on a broad linear model (see Non-Patent Document 1), or basic principal component analysis or independent component analysis of the data Analysis (see Non-Patent Document 3), or similar analysis. The characteristic of these analysis techniques is that each three-dimensional pixel (voxel) of the time-series data of the BOLD signal in the output results is statistically processed, and finally an image is formed to determine the activation area of the brain.
然而在上述所说的分析技术中存在着以下问题:在分析数据时,神经网络结构并未被考虑。脑中许多神经细胞通过神经突触构成复杂的网络,而根据近些年来的脑研究,我们认为脑中每个神经区域通过互相协作形成上述神经网络,进而作为一个整体发挥出更强的功能。例如:在脑完成一项工作时,其中的很多区域都出现激活现象。虽然上述所说的分析技术可以用于分析该激活现象,确定激活区域,但是却很难确定激活区域间的联系。However, the following problem exists in the analysis techniques mentioned above: the structure of the neural network is not considered when analyzing the data. Many nerve cells in the brain form a complex network through synapses. According to brain research in recent years, we believe that each nerve area in the brain cooperates with each other to form the above-mentioned neural network, and then exerts a stronger function as a whole. For example, when a task is being performed in the brain, many areas of the brain are activated. Although the analysis techniques mentioned above can be used to analyze the activation phenomenon and determine the activation region, it is difficult to determine the connection between the activation regions.
造成上述现象的原因有多个。因为fMRI是如上所述依据血液流量检测血液信号的,fMRI可以捕捉到具有较高血液流量的脑灰质的活动(神经细胞体),但却很难捕捉到血液流量较低的脑白质的活动(神经细胞轴突或神经纤维)。There are several reasons for the above phenomenon. Because fMRI detects blood signals based on blood flow as described above, fMRI can capture activity in gray matter (nerve cell bodies) with higher blood flow, but it is difficult to capture activity in white matter with lower blood flow ( nerve cell axon or nerve fiber).
同时为了捕捉作为神经网络结构基础的神经纤维组的走向,一种DTI(弥散张量成像)方法在近些年来越来越受到人们的关注。该方法使用MRI检测身体器官内质子的弥散度,作为一种新的参数(参见非专利文献4)。当时使用常规的解剖性MRI时,神经纤维在T1加权图像中是强信号,在T2加权图像中是弱信号。神经纤维在T1加权图象中变成强信号是因为髓磷脂的存在。髓磷脂是由双分子层类脂物和大型蛋白质组成,并沿着神经纤维走向成形。因此才出现了各向异性,即沿着神经纤维走向上的质子的弥散常数很大,而其在垂直方向上的弥散常数很小。DTI是使用MPG(弥散梯度磁场,)检测弥散的各向异性,从而突出质子弥散情况的技术。该技术可以应用于分析ST(Stejskal-Tanner)脉冲序列检测获得的BOLD信号的时间序列数据的强度S′(l,m,k,i),在SE(回波)脉冲的前后,STG(Stejskal-Tanner Gradient梯度)脉冲被加入用于检测弥散。At the same time, in order to capture the direction of the nerve fiber group as the basis of the neural network structure, a DTI (diffusion tensor imaging) method has attracted more and more attention in recent years. This method uses MRI to detect the diffusivity of protons in body organs as a new parameter (see Non-Patent Document 4). When conventional anatomic MRI was used at the time, the nerve fibers were strong onT1- weighted images and weak on T2-weighted images. Nerve fibers become intense on T1- weighted images due to the presence of myelin. Myelin is composed of lipid bilayers and large proteins and forms along the course of nerve fibers. Therefore, anisotropy appears, that is, the diffusion constant of protons along the direction of the nerve fiber is very large, while its diffusion constant in the vertical direction is small. DTI is a technique that uses MPG (diffusion gradient magnetic field,) to detect the anisotropy of dispersion, thereby highlighting the proton dispersion. This technique can be applied to analyze the intensity S′(l, m, k, i) of the time series data of the BOLD signal obtained by ST (Stejskal-Tanner) pulse sequence detection, before and after the SE (echo) pulse, STG (Stejskal -Tanner Gradient gradient) pulses were added to detect diffusion.
其中:l,m,k为正离散变量,代表三维体素的位置,它们分别代表体素在X,Y,Z方向上的值。另外,i为正离散变量,代表检测时间。BOLD信号强度S′(l,m,k,i)表达式如下:Among them: l, m, k are positive discrete variables, which represent the position of the three-dimensional voxel, and they respectively represent the value of the voxel in the X, Y, and Z directions. In addition, i is a positive discrete variable, representing the detection time. The expression of BOLD signal strength S'(l, m, k, i) is as follows:
当弥散加权图像形成后,式1中的弥散张量将成为分析数据。该弥散张量如下所示:When the diffusion-weighted image is formed, the diffusion tensor in
其中:ρ′(l,m,k,i)代表当没有使用MPG时,BOLD信号强度(普通脑功能数据分析对象),而b为MPG强度参数。请注意ρ′(l,m,k,i)如下式所示:Among them: ρ'(l, m, k, i) represents the signal intensity of BOLD (normal brain function data analysis object) when MPG is not used, and b is the MPG intensity parameter. Note that ρ′(l, m, k, i) is given by:
其中:f(v)代表流动速度;TR为反复时间;TE为回波时间;ξ′(l,m,k,i)为质子密度。Among them: f(v) represents the flow velocity; TR is the repetition time; TE is the echo time; ξ′(l, m, k, i) is the proton density.
近些年来,在分析fMRI测得的BOLD信号ρ′(l,m,k,i)的时间序列数据后再使用弥散张量数据D(l,m,k)将目标脑区域连接起来的脑分析方法已经被广泛使用(参见非专利文献5)。In recent years, after analyzing the time series data of the BOLD signal ρ'(l, m, k, i) measured by fMRI, the diffusion tensor data D(l, m, k) is used to connect the brain regions of the target brain. Analytical methods have been widely used (see Non-Patent Document 5).
非专利文献1:“Human Brain Function:2nd-Ed.″,Richard S.J.Frackowiak,et al,ELSEVIER ACADEMIC PRESS,2004”Non-Patent Document 1: "Human Brain Function: 2nd-Ed.", Richard S.J.Frackowiak, et al, ELSEVIER ACADEMIC PRESS, 2004"
非专利文献2:“Image of Mind″,M.I.Posner and M.E.Raichle,WH Freeman&Co,1997”。Non-Patent Document 2: "Image of Mind", M.I.Posner and M.E.Raichle, WH Freeman&Co, 1997".
非专利文献3:“Independent Component Analysis:Theory andApplications″,T.W.Lee,Kluwer Acadmic,1988”。Non-Patent Document 3: "Independent Component Analysis: Theory and Applications", T.W.Lee, Kluwer Academic, 1988".
非专利文献4:“Korede wakaru diffusion MRI″S.Aoki,O.Abe,Syuujyun sha,2002”。Non-Patent Document 4: "Korede wakaru diffusion MRI" S. Aoki, O. Abe, Syuujyun sha, 2002".
非专利文献5:“Combined functional MRI and tractography todemonstrate the connectivity of the human primary motor cortex invivo″,Guye M,et al.,Neuroimage,Vol.19,pp.1349-1360,2003”。Non-Patent Document 5: "Combined functional MRI and tractography todemonstrate the connectivity of the human primary motor cortex invivo", Guye M, et al., Neuroimage, Vol.19, pp.1349-1360, 2003".
发明内容Contents of the invention
在上述的脑功能分析方法中,弥散张量D(l,m,k)并不是用于分析BOLD信号ρ′(l,m,k,i)时间序列数据本身的。因此其有效性值得怀疑。In the above brain function analysis method, the diffusion tensor D(l, m, k) is not used to analyze the time series data of the BOLD signal ρ'(l, m, k, i) itself. Therefore its effectiveness is questionable.
本发明就上述问题提出了相应的解决方案,还提供了基于非介入检测方法(如:fMRI,PET或类似方法)测得的脑功能数据和能够确定神经纤维组走向的弥散张量上,分析脑激活区域间连接结构的脑功能分析方法和脑功能分析程序。The present invention proposes corresponding solutions to the above-mentioned problems, and also provides brain function data measured based on non-interventional detection methods (such as: fMRI, PET or similar methods) and the diffusion tensor that can determine the direction of nerve fiber groups. Brain function analysis method and brain function analysis program of brain activation interregional connection structure.
一方面,本发明提供了一种脑功能分析方法,该方法包括:一、在从体素到体素基础上,获得能够确定脑激活区域的脑功能数据,和能够确定脑中质子弥散程度的弥散张量。二、在弥散张量基础上形成相邻体素间联系度估计值。On the one hand, the present invention provides a brain function analysis method, the method comprising: 1. On the basis of voxel to voxel, obtaining brain function data capable of determining brain activation regions, and obtaining brain function data capable of determining the degree of proton diffusion in the brain Diffusion tensor. Second, an estimated value of the connection degree between adjacent voxels is formed on the basis of the diffusion tensor.
另一方面,本发明还提供了一种脑功能分析程序,该程序使计算机获得可以确定脑激活区域的从体素到体素的脑功能数据;能够确定脑中质子弥散度的从体素到体素的弥散张量;在弥散张量基础上形成相邻体素间联系度估计值,并在该基础上分析脑数据。On the other hand, the present invention also provides a brain function analysis program, which enables a computer to obtain brain function data from voxel to voxel capable of determining brain activation regions; The diffusion tensor of a voxel; based on the diffusion tensor, an estimate of the degree of connectivity between adjacent voxels is formed, and brain data are analyzed on this basis.
附图说明Description of drawings
图1是本发明实施例1中脑功能分析仪器的构型示意图。Fig. 1 is a schematic diagram of the configuration of the brain function analysis instrument in Example 1 of the present invention.
图2是典型的fMRI检测方法示意图。Figure 2 is a schematic diagram of a typical fMRI detection method.
图3是典型的fMRI图(二维切片图),其中图3A是位于床上的头,图3B为组成头部二维横截面(二维切片图)的一个体素。Figure 3 is a typical fMRI image (two-dimensional slice image), in which Figure 3A is the head on the bed, and Figure 3B is a voxel that constitutes the two-dimensional cross-section (two-dimensional slice image) of the head.
图4是二维切片图中脑功能信息体素所对应的时间序列数据和弥散张量表。Figure 4 is the time series data and diffusion tensor table corresponding to the brain function information voxel in the two-dimensional slice map.
图5是图4中脑功能信息时间序列数据的一个例子,其中图5A为检测得到的实际数值,图5B为基于临界值,通过组合两个实际检测值获得的数值。Fig. 5 is an example of time series data of brain function information in Fig. 4, wherein Fig. 5A is the actual value obtained by detection, and Fig. 5B is the value obtained by combining two actual detection values based on the critical value.
图6是基于图4所示脑功能信息时间序列数据和弥散张量数据所得立体构型,其中图6A是位于床上的头,图6B是由图4脑功能信息中的时间序列数据和弥散张量数据生成k-th二维切片图像Sk的步骤。Figure 6 is the three-dimensional configuration based on the brain function information time series data and diffusion tensor data shown in Figure 4, where Figure 6A is the head on the bed, and Figure 6B is the time series data and diffusion tensor data in the brain function information in Figure 4. The step of generating k-th two-dimensional slice image Sk from quantitative data.
图7是由图6二维切片图像形成的三维头部图像,其中图7A是位于床上的头,图7B是通过收集二维切片图像Sk形成的三维头部图像。FIG. 7 is a three-dimensional head image formed from the two-dimensional slice images of FIG. 6, wherein FIG. 7A is the head on a bed, and FIG. 7B is a three-dimensional head image formed by collecting the two-dimensional slice images Sk.
图8是通过使用图1中脑功能分析仪器分析数据的步骤流程图。FIG. 8 is a flow chart of steps for analyzing data by using the brain function analyzing apparatus in FIG. 1 .
图9显示了本发明数据预处理技术,其中图9A显示了在与一体素相邻的两个体素均被认为是灰质的区域中的数据预处理;图9B显示了在与一体素相邻的两个体素中只有一个被认为是灰质的区域中的数据预处理;图9C显示了在与一体素相邻的两个体素均不被认为是灰质的区域中的数据预处理。Fig. 9 shows the data preprocessing technology of the present invention, wherein Fig. 9A shows the data preprocessing in the region where two voxels adjacent to a voxel are considered to be gray matter; Data preprocessing in a region where only one of the two voxels is considered gray matter; Figure 9C shows data preprocessing in a region where neither of the two voxels adjacent to the voxel is considered gray matter.
图10是本发明实施例2中脑功能分析仪器的构型示意图。Fig. 10 is a schematic diagram of the configuration of the brain function analysis instrument in Example 2 of the present invention.
图11是通过使用图10中脑功能分析仪器分析数据的步骤流程图。FIG. 11 is a flow chart of steps for analyzing data by using the brain function analyzing apparatus in FIG. 10 .
图12是通过使用图10中数据平滑方法实现的平滑技术。FIG. 12 is a smoothing technique implemented by using the data smoothing method in FIG. 10 .
图13为实施例2修饰例中脑功能分析仪器构型示意图。Fig. 13 is a schematic diagram of the configuration of the brain function analysis instrument in the modified example of Example 2.
图14为使用图13中脑功能分析仪器进行数据分析的步骤流程图。FIG. 14 is a flow chart of steps for data analysis using the brain function analysis instrument in FIG. 13 .
图15为本发明实施例3中脑功能分析仪器构型示意图。Fig. 15 is a schematic diagram of the configuration of the brain function analysis instrument in Example 3 of the present invention.
图16为使用图15中脑功能分析仪器进行数据分析的步骤流程图。FIG. 16 is a flow chart of steps for data analysis using the brain function analysis instrument in FIG. 15 .
图17为使用图15的聚集装置300的聚集技术,其中,图17A显示了聚集处理前联系度矢量值,图17B显示了聚集处理后联系度矢量值。Fig. 17 is an aggregation technique using the
图18为实施例3修饰例中脑功能分析仪器构型示意图。Fig. 18 is a schematic diagram of the configuration of the brain function analysis instrument in the modified example of Example 3.
图19为使用图18中脑功能分析仪器进行数据分析的步骤流程图。FIG. 19 is a flow chart of steps for data analysis using the brain function analysis instrument in FIG. 18 .
图20为本发明实施例4中脑功能分析仪器构型示意图。Fig. 20 is a schematic diagram of the configuration of the brain function analysis instrument in Example 4 of the present invention.
图21为使用图20中脑功能分析仪器进行数据分析的步骤流程图。FIG. 21 is a flow chart of steps for data analysis using the brain function analysis instrument in FIG. 20 .
图22为实施例4修饰例中脑功能分析仪器构型示意图。Fig. 22 is a schematic diagram of the configuration of the brain function analysis instrument in the modified example of Example 4.
图23为使用图22中脑功能分析仪器进行数据分析的步骤流程图。FIG. 23 is a flow chart of steps for data analysis using the brain function analysis instrument in FIG. 22 .
图24显示了脑在声音刺激下进行简单的重复时,通过不同的脑功能分析方法所得到的结果,其中,图24A和24B显示了使用SPM的T-检测的结果(图24A中T-检测的临界值被修正,而图24B中T-检测的临界值并未被修正)。图24C为组合使用SPM和跟踪成像法的脑功能分析法所得到的分析结果。图24D为使用本发明实施例1中的脑功能分析法所得到的分析结果。Figure 24 shows the results obtained by different brain function analysis methods when the brain is subjected to simple repetitions under sound stimulation, wherein Figures 24A and 24B show the results of T-detection using SPM (T-detection in Figure 24A The critical value of is corrected, while the critical value of T-detection in Fig. 24B is not modified). Fig. 24C shows the analysis results obtained by the brain function analysis method using the combination of SPM and tracking imaging method. Fig. 24D is an analysis result obtained by using the brain function analysis method in Example 1 of the present invention.
具体实施方式Detailed ways
本发明的特征在于通过非介入性检测设备,如MRI或类似设备在从体素到体素基础上获取脑功能数据及弥散张量数据,进而确定脑激活区域位置,根据弥散张量数据形成相邻体素间的联系度估计值,同时利用该估计值分析脑功能数据。在不同分析技术中,如何考虑上述所说的脑功能数据中相邻体素的联系度估计值,及如何使用该估计值可以有所不同。The present invention is characterized in that brain function data and diffusion tensor data are obtained on a voxel-to-voxel basis through non-invasive detection equipment, such as MRI or similar equipment, and then the location of the brain activation area is determined, and a phase is formed according to the diffusion tensor data. The degree of connection between adjacent voxels was estimated, and the estimated value was used to analyze brain function data. In different analysis techniques, how to consider the estimated value of the connection degree of adjacent voxels in the brain function data mentioned above, and how to use the estimated value may be different.
因此,以下实施例将结合附图对本发明进行详细描述。Therefore, the following embodiments will describe the present invention in detail with reference to the accompanying drawings.
实施例一Embodiment one
图1为本发明实施例一中脑功能分析仪器构造示意图。本发明在实施例一中提出了一种脑功能分析仪器10,其带有以下配置:脑功能数据获取装置1,用于获得MRI设备50测得的脑功能数据中原始时间序列数据ρ′(l,m,k,i)(如:等式(3));弥散张量数据获取装置2,用于获得MRI设备50测得的弥散张量数据D(l,m,k)(如:等式(2));数据预处理装置3,用于预处理脑功能数据获取装置1获取的脑功能信息原始时间序列数据ρ′(l,m,k,i);体素间联系度计算装置4,用于根据弥散张量数据获取法2获得的弥散张量数据D(l,m,k)来计算代表相邻体素联系度的联系度矢量(如:

在此,MRI设备50是由以下部件组成:一磁性组件,该组件带有能够产生静磁场,进而引起核磁共振的静磁场线圈,和能够发出高频共振波从而检测共振信号的高频线圈,和能够产生梯度磁场,进而在共振信号中加入位置信息编码的梯度磁场线圈,或类似部件,和用于控制激活这些线圈的系统,或类似系统,其中,根据操作人员的要求,MRI设备50产生不同的fMRI数据(与血液流量相关的脑功能信息的原始时间序列数据ρ′(l,m,k,i),与神经纤维走向相关的弥散张量D(l,m,k),或类似数据),并将这些数据传输给脑功能分析仪器10。请注意,本发明并非一定需要通过MRI设备50获得脑功能信息的原始时间序列数据ρ′(l,m,k,i),也可以通过其它非介入性检测设备获得该数据,如PET,通过它也可以获得多种有关脑功能的数据。Here, the
同时,对于图像显示装置8,有多种显示设备可用,例如:阴极射线管(CRT)显示器,TFT液晶显示器,等离子显示器,或类似设备,或者是各种打印机,例如:喷墨打印机,激光打印机,或类似设备。另外,存储装置9由,例如:RAM(随机存取存储器),ROM(只读内存)或类似设备组成。另外,存储装置9的主存储和次存储是相互独立分开的,因此,主存储中的内容可以存放在例如光盘中,如硬盘,floppy软盘(注册商标),或是只读CD-ROMs,磁带,存储芯片或者类似设备。Meanwhile, for the
本实施例中,虽然脑功能分析仪器10使用的显示装置包括的主要形成装置10A,图像显示装置8和存储装置9是组合在一起的,但是图像显示装置8,或者图像显示装置8和存储装置9,也可以与主要形成装置10A分开来用,作为独立的图像显示单元和存储单元。在任何组合方法中,脑功能分析仪器10都是由电脑来完成。另外,CPU 100从存储装置9中读取脑功能分析程序,控制上述装置2到装置9中的每一个步骤。In this embodiment, although the display device used by the brain
这里所说的电脑是指一种能够根据预先设定的标准处理具有一定结构的输入信息,然后构建和输出处理结果,例如普通的电脑,超级电脑,主机,工作站,微型电脑,服务器,或类似设备都包括在其中。另外,也可以使用一种系统(例如分布式计算机系统),其中包括两台或更多台电脑通过网络连接(如:内部网,局域网,广域网),或由其组合组成的联系网络相互连接。The computer mentioned here refers to a computer that can process input information with a certain structure according to preset standards, and then construct and output the processing results, such as ordinary computers, supercomputers, mainframes, workstations, microcomputers, servers, or similar Equipment is included. In addition, a system (such as a distributed computer system) can also be used, which includes two or more computers connected to each other through a network connection (such as: intranet, local area network, wide area network), or a contact network consisting of a combination thereof.
另外,为了增强对本发明的理解,图2至图7对本发明的脑功能分析流程进行了概括性的描述。图2显示了典型的fMRI检测方法。图3显示了典型的fMRI图像(二维切片图像),图3A为位于床上的头,图3B显示了组成头部二维横截面(二维图像)的体素。In addition, in order to enhance the understanding of the present invention, Fig. 2 to Fig. 7 give a general description of the brain function analysis process of the present invention. Figure 2 shows a typical fMRI detection method. Figure 3 shows a typical fMRI image (2D slice image), with Figure 3A showing the head on a bed, and Figure 3B showing the voxels that make up a 2D cross-section of the head (2D image).
例如,在某个实施例中,我们让研究对象完成一项任务(如:让手指轻轻拍打),与这项任务相关的脑区域位置通过fMRI检测被确定。在图2所示的例子中,一套程序在一次测量中被重复三次,该程序是由一段时间T内的任务和相同长度时间T内的休息组成。这里,水平线为时间轴,其中“ON”表示任务时间,“OFF”表示休息时间。通常在一个实验中,fMRI进行几十次检测。虽然在本实验中,fMRI进行了24次检测,但是任务开始和结束时的检测图像一般不被使用。这是考虑到检测时间的滞后性。所以,这就意味着有效的fMRI检测实际只进行了18次(相应的线为18条粗线)。ti(i=1,2,...,24)表示各个实际检测时间。以下内容中,ti将只以i表示(i=1,2,...,I)(分离的正整数)。For example, in one embodiment, we ask the research subject to perform a task (such as: let the finger tap lightly), and the location of the brain region related to this task is determined by fMRI detection. In the example shown in Fig. 2, a program consisting of a task for a period T followed by a rest period of the same length T was repeated three times during one measurement. Here, the horizontal line is the time axis, where "ON" represents task time and "OFF" represents rest time. Typically in an experiment, fMRI performs dozens of detections. Although fMRI performed 24 detections in this experiment, the detection images at the beginning and end of the task were generally not used. This is in consideration of the hysteresis of the detection time. So, this means that a valid fMRI test is actually performed only 18 times (the corresponding line is 18 thick lines). ti (i=1, 2, . . . , 24) represents each actual detection time. In the following content, ti will only be represented by i (i=1, 2, . . . , I) (separated positive integers).
图3B是通过fMRI检测获得的二维切片图像Sk。这里的K表示实验中获得的二维切片图像数量。在常规fMRI检测中,我们一般可以获得20至30张二维切片图像(图片中,K=20至30)。虽然对图3B中的二维切片图像Sk(k=1,2...K)只是做了表面性的描述,但是它们却是由三维立体像素,又称体素(voxel)所组成的。虽然由64×64体素组成的二维切片图像作为一个整体显示在一张图片中,但是该二维切片图像也可以被分为不同数量体素。虽然二维切片图像Sk中的任何一个体素都可以通过两个分离的变量l和m表达为(l,m),但是它也可以通过在预定规则下对其设定一个数进而只用一分离正变量j表示。从数学的角度,我们可以在预定规则下得到j和(l,m)一一对应关系(对于(Sk)来说,j≡(l,m))。在本实例中,由于l的上限L和m的上限M都是64(L=64,M=64),所以导致了j=1,2,...,4096。在以下内容中,这些表示方法都将被适当地使用。另外,图3B中的圆圈表示头部横截面的轮廓。FIG. 3B is a two-dimensional slice image Sk obtained by fMRI detection. K here represents the number of 2D slice images obtained in the experiment. In conventional fMRI detection, we can generally obtain 20 to 30 two-dimensional slice images (in the picture, K=20 to 30). Although the two-dimensional slice images Sk (k=1, 2...K) in FIG. 3B are only superficially described, they are composed of three-dimensional pixels, also known as voxels. Although a two-dimensional slice image composed of 64×64 voxels is displayed in one picture as a whole, the two-dimensional slice image may also be divided into different numbers of voxels. Although any voxel in the two-dimensional slice image Sk can be expressed as (l, m) by two separate variables l and m, it can also be expressed as (l, m) by setting a number to it under a predetermined rule and then using only one voxel Separate the positive variable j denoted. From a mathematical point of view, we can obtain a one-to-one correspondence between j and (l, m) under predetermined rules (for (Sk), j≡(l, m)). In this example, since the upper limit L of l and the upper limit M of m are both 64 (L=64, M=64), j=1, 2, . . . , 4096 result. In the following content, these representation methods will be used appropriately. In addition, the circles in Fig. 3B represent the profile of the cross-section of the head.
图4表示了通过脑功能数据获取装置1获得的,并经过数据预处理装置3预处理后的(将在后面描述)构成二维切片图像Sk的体素j的脑功能信息时间序列数据ρ′(j,k,i)(≡ρk(j,i))和通过弥撒张量数据获取装置2得到的D(j,k)(≡Dk(j))。如背景技术所述,当弥散加权图像通过DTI方法生成后,也可同时从ST脉冲序列图像中获得二维切片图像Sk的脑功能信息原始时间序列数据ρ′(l,m,k,i)(≡ρ′k(l,m,i))和弥散张量D(l,m,k)(≡Dk(l,m))。该ST脉冲序列图像是在SE脉冲前后加入STG脉冲用于检测弥散而获得的。ρk(j,i)代表对原始时间序列数据ρ′k(l,m,i)进行先设预定预处理后(将在后面描述)获得的脑功能信息时间序列数据。就是说,图中的ρk(j,i)代表二维切片图像Sk中体素j在某一时间点i上的脑功能信息。同时Dk(j)代表二维切片图像Sk中某一体素j的弥散张量信息。ρk(j,i)特指数量,Dk(j)在矩阵中由等式(2)代表。他们可以是如等式(4)中所示的值,如:Fig. 4 shows the brain function information time series data ρ' of voxel j constituting the two-dimensional slice image Sk obtained by the brain function
由于弥散张量是如本实例所示的典型的对称张量(非对角线元素具有对称性),其大体拥有六个部分。另外,图中的CLASS表示该任务是否被完成,“ON(=1)”和“OFF(=0)”分别代表“ON”和“OFF”,如图2所示。Since the diffusion tensor is a typical symmetric tensor (the off-diagonal elements have symmetry) as shown in this example, it generally has six parts. In addition, CLASS in the figure indicates whether the task is completed, and "ON (=1)" and "OFF (=0)" represent "ON" and "OFF" respectively, as shown in FIG. 2 .
图5是图4表示的脑功能信息时间序列数据ρk(j,i)的一个实例的表格。虽然图5(A)中脑功能信息ρk(j,i)的实际时间序列数据是连续数值,但是一旦“4000”被设定为激活临界值之后,该数据可在预处理时被进一步二元化,即体素值大于该临界值的处于激活“A”状态,而小于该临界值的处于非激活“I”状态,如图5(B)所示。Fig. 5 is a table showing an example of brain function information time-series data ρk(j, i) shown in Fig. 4 . Although the actual time-series data of brain function information ρk(j, i) in Figure 5(A) is a continuous value, once “4000” is set as the activation threshold, the data can be further binary in preprocessing That is, the voxel value greater than the critical value is in the active "A" state, while the voxel value smaller than the critical value is in the inactive "I" state, as shown in Figure 5(B).
图6为图4中弥散张量Dk(j)和脑功能信息时间序列数据ρk(j,i)的立体构型图。其中图6A显示了置于床上的研究对象的头部。图6B显示了通过图4脑功能信息时间序列数据和弥散张量生成k-th二维切片图像Sk的步骤。图6B中体素j1和j2上的五边形标记表示每个体素内部空间(即体素的梯度场和张量场),它们对应图4的脑信息时间序列数据和弥散张量。Fig. 6 is a three-dimensional configuration diagram of the diffusion tensor Dk(j) and brain function information time series data ρk(j, i) in Fig. 4 . Figure 6A shows the head of the subject placed on the bed. Fig. 6B shows the steps of generating the k-th two-dimensional slice image Sk from the brain function information time series data and diffusion tensor in Fig. 4 . The pentagon marks on voxels j1 and j2 in Figure 6B indicate the internal space of each voxel (ie, the gradient field and tensor field of the voxel), which correspond to the brain information time series data and diffusion tensor in Figure 4 .
例如:在背景技术所述的SPM中,可进行如下预处理:For example: in the SPM described in the background technology, the following preprocessing can be performed:
(a)重排:下面的图像与上面的二维切片图像排列一致(如,S1)。这样可以补偿检测过程中头部移动带来的位置偏差,去除相应的错误信号。(a) Rearrangement: The lower image is aligned with the upper 2D slice image (eg, S1). In this way, the position deviation caused by the head movement during the detection process can be compensated, and the corresponding error signal can be removed.
(b)空间标准化:为了对多个研究对象收集数据并进行比较,我们将每个研究对象的数据调整为Talairach标准脑。(b) Spatial normalization: In order to collect and compare data for multiple subjects, we adjusted the data of each subject to the Talairach standard brain.
(c)平滑化:Gaussian型过滤器被用于过滤原始带噪音的时间序列数据。这样可以在不降低空间分辨率的情况下提高分析的灵敏度。(c) Smoothing: Gaussian type filters are used to filter the original noisy time series data. This increases the sensitivity of the analysis without reducing the spatial resolution.
然后,对于通过MRI设备50获得的脑功能信息原始时间序列数据ρ′k(l,m,i),我们使用多种不同的检测方法检测其中的每一个体素。而对于由多个研究对象组成的不同小组,我们在各组间进一步通过对象的个人数据检测其与任务相联系的脑激活区域。Then, for the original time series data ρ′k(l, m, i) of brain function information obtained by the
另外,在SPM中,我们事先建立了一个激活预测模型,该模型与经过上述方法预处理后的功能数据的时间序列数据ρk(j,i)(=ρk(l,m,i))的相配程度需要看不使用弥散张量Dk(l,m)的一般线性模型所得的估计参数。In addition, in SPM, we have established an activation prediction model in advance, which is matched with the time series data ρk(j, i) (=ρk(l, m, i)) of the functional data preprocessed by the above method The degree needs to look at the estimated parameters obtained without using the general linear model of the diffusion tensor Dk(l,m).
同时,在本发明中,除了上述所说的预处理以外,我们还对使用通过弥散张量获取装置2获得的弥散张量Dk(j)(=Dk(l,m))对表达脑功能信息的原始时间序列数据ρ′k(l,m,i)进行(d)型预处理。该预处理方法将在以下内容中详细描述。随后,对使用弥散张量Dk(j)(=Dk(l,m))预处理的表达脑功能信息的原始时间序列数据ρ′k(l,m,i)进行数据处理,该处理方法将在以下内容中详细描述。由此产生某图像显示目标的二维图像ak(j)(=ak(l,m))。At the same time, in the present invention, in addition to the above-mentioned preprocessing, we also use the diffusion tensor Dk (j) (=Dk (l, m)) obtained by the diffusion
除了i-th值外,
接下来,在步骤S60中,图像生成装置7生成图片,其中拥有正回归系数(即正关联关系)的体素被设置为偏向白色,拥有负回归系数(即负关联关系)的体素被设置为偏向黑色。例如,基于上述计算得到的回归系数
另外,可以显示体素值频率在直方图中为前5%或更高的值为灰色图像,或者可以根据预设规则生成全色图像。In addition, gray images with voxel value frequencies in the top 5% or higher in the histogram can be displayed, or full-color images can be generated according to preset rules.
随后,在步骤S70中,图像显示装置8显示上述立体图像。Subsequently, in step S70, the
如上所述,在实施例一中,除了对根据MRI设备测得的反映脑功能信息时间序列数据所作的误差评估以外,估计值也包括基于MRI设备测得的弥散张量数据对空间方向上连续性的评估。估计值也进行了非参数线性回归分析,所得到的回归系数是用于图像的显示,从而使脑激活区域的位置可以被确定,同时还考虑到脑激活区域间的连接结构。As mentioned above, in
虽然在S20中进行了(d)型预处理,而不是本实验中普通的(a)到(c)型预处理,但是(d)型预处理也可以不用,这在以下实施例也是同样的。Although the (d) type pretreatment is carried out in S20, instead of the common (a) to (c) type pretreatment in this experiment, the (d) type pretreatment can also be omitted, which is also the same in the following examples .
虽然在实施例一中,等式(23)用于计算数据估计值,但是我们可以根据本发明目的采用的分析方法计算各种不同的估计值。因此,在以下几个对实施例一的修饰中,为了避免重复,我们只是描述其与实施例一不同的部分。Although in
<实施例一的修饰例1><
在实施例一中,数据分析装置6在S50步中使用线性回归方程(等式(19))进行非参数型回归分析。但是,更严格的说,回归表达可以通过一般n维方程式进行,如:二次方程式,三次方程式,或类似方程式。在进行这样的非线性回归分析时,我们可以使用神经网络模型。典In the first embodiment, the data analysis device 6 uses the linear regression equation (equation (19)) to perform non-parametric regression analysis in step S50. However, more strictly speaking, the regression expression can be performed by general n-dimensional equations, such as quadratic equations, cubic equations, or similar equations. When doing such a nonlinear regression analysis, we can use a neural network model. canon
值得注意的是,为了简化的目的,我们以二维切片图像作为一个例子,但实际上图7A和7B所示的头部立体图形数据ak(j)(=a(j,k)=a(n))是三维数据分析。使用弥散张量数据Dk(j)的数据处理也被用于那个实例中,以下将作详细介绍。这里的“n”是代表体素位置的独立正数变量,在预定规则下,立体构形中的所有体素都有一个相应的指定值。虽然代表二维切片图形的在X,Y坐标上的位置变量j和代表第三维方向(z方向)的变量k在图片中被分别说明,但是在数学上,它等同于上述所说的单一变量“n”(n≡(j,k))。请注意,使用单一变量“n”和在X,Y,Z轴上使用三个变量(j,l,k)来代表同一个三维体素在以下内容中都将被应用到(n≡(l,m,k)≡(j,k))。It should be noted that, for the purpose of simplification, we take a two-dimensional slice image as an example, but in fact the head stereo graphic data ak(j)(=a(j,k)=a( n)) is a three-dimensional data analysis. Data processing using the diffusion tensor data Dk(j) was also used in that example and will be described in detail below. Here "n" is an independent positive variable representing the position of a voxel, under a predetermined rule, all voxels in the stereo configuration have a corresponding assigned value. Although the position variable j on the X and Y coordinates representing the two-dimensional slice graph and the variable k representing the third dimension direction (z direction) are illustrated separately in the picture, mathematically, it is equivalent to the single variable mentioned above "n" (n≡(j,k)). Note that using a single variable "n" and using three variables (j, l, k) on the X, Y, Z axes to represent the same 3D voxel will be applied to (n≡(l , m, k)≡(j, k)).
以下我们将具体描述在以上假定条件下使用图1所示脑功能分析仪器10进行的数据分析方法。图8是使用图1所示脑功能分析仪器10分析数据的步骤流程图。Below we will specifically describe the data analysis method performed using the brain
在步骤S10中,通过脑功能数据获取装置1获得MRI设备50检测得到的表达脑功能信息的原始时间序列数据ρ′(l,m,k,i),同时通过弥散张量信息获取装置2获得MRI设备50检测得到的弥散张量D(l,m,k)。In step S10, the brain function
下一步,通过数据预处理装置3进行各种预处理,例如位置补偿,去除噪音,或如类似上述SPM(a)到(c)的预处理方法,用于处理在上述S20中获得的表达脑信息的原始时间序列数据ρ′(l,m,k,i)。In the next step, various preprocessing is performed by the
在以上同一步骤中,为了对上述常规预处理后的表达脑功能信息时间序列数据ρ′(l,m,k,i)作进一步(d)型预处理(数据转化为神经信号),可使用数据预处理装置3进行计算,例如使用以上获得的弥散张量D(l,m,k)在符合弥散张量D(l,m,k)的本征等式(5)的本征矢量(
为了简单起见,以下我们假设|λ1|≥|λ2|≥|λ3|,最大本征值λ1相应的本征矢量(
另外,本征矢量的基准应当通过1标准化。In addition, the eigenvector The benchmark should be normalized by 1.
随后,在以上同一步骤中,数据预处理装置3,就某个体素(l,m,k)而言,首先确定一对应方向矢量的相邻体素,该相邻体素与体素(l,m,k)本征矢量
我们假设满足该条件的相邻体素是(l+1,m+1,k)。那么由体素(l,m,k)决定的该相邻体素的带有点对称关系的另一相邻体素就被确定了,在此称为体素(l-1,m-1,k),如图9所示。因为体素(l+1,m+1,k)和(l-1,m-1,k)与体素(l,m,k)本征矢量
如果是如图9(C)所示的情况,那么与体素(l,m,k)相关的体素(l+1,m+1,k)和(l-1,m-1,k)可以被认为是走方相同的神经纤维体素。If it is the case shown in Figure 9(C), then voxel (l+1, m+1, k) and (l-1, m-1, k) related to voxel (l, m, k) ) can be considered as the same nerve fiber voxel.
接下来在同一步骤中,数据预处理装置3根据以下三种不同情况改写体素(l,m,k)的表达脑功能信息的时间序列数据ρ′(l,m,k,i)。Next, in the same step, the
(情况1)根据预先设定的脑解剖学数据(通过MRI设备50获得的加权图像T1)(参见图9(A)),体素(l+1,m+1,k)和(l-1,m-1,k)都被认为是灰质(神经元细胞体:图片中表示为G)。(Case 1) According to preset brain anatomy data (weighted image T1 obtained by MRI device 50) (see FIG. 9(A)), voxel (l+1, m+1, k) and (l- 1, m-1, k) are all considered gray matter (neuron cell bodies: indicated as G in the picture).
在这种情况下,体素(l,m,k)的表达脑功能信息时间序列数据ρ′(l,m,k,i)的数值将根据下式改写:In this case, the value of time series data ρ′(l, m, k, i) expressing brain function information at voxel (l, m, k) will be rewritten according to the following formula:
(情况2)根据预先设定的脑解剖学数据(通过MRI设备50获得的加权图像T1)(参见图9(B)),体素(l+1,m+1,k)(或者体素(l-1,m-1,k))被认为是灰质。(Case 2) According to preset brain anatomy data (weighted image T1 obtained by MRI device 50) (see FIG. 9(B)), voxel (l+1, m+1, k) (or voxel (l-1,m-1,k)) is considered as gray matter.
在这种情况下,体素(l,m,k)的表达脑功能信息时间序列数据ρ′(l,m,k,i)的数值将根据下式改写:In this case, the value of time series data ρ′(l, m, k, i) expressing brain function information at voxel (l, m, k) will be rewritten according to the following formula:
ρ(l,m,k,i)=ρ′(l+1,m+1,k,i)(orρ′(l-1,m-1,k,i)).… (7)ρ(l, m, k, i) = ρ'(l+1, m+1, k, i)(or ρ'(l-1, m-1, k, i)).... (7)
(情况3)根据预先设定的脑解剖学数据(通过MRI设备50获得的加权图像T1)(参见图9(C)),体素(l+1,m+1,k)和(l-1,m-1,k)都不被认为是灰质(即被认为白质(神经纤维:图片中表示为W))。(Case 3) According to the preset brain anatomy data (weighted image T1 obtained by MRI equipment 50) (see FIG. 9(C)), voxels (l+1, m+1, k) and (l- 1, m-1, k) are not considered as gray matter (i.e. considered as white matter (nerve fibers: indicated as W in the picture)).
在这种情况下,体素(l,m,k)的表达脑功能信息时间序列数据ρ′(l,m,k,i)的数值将根据下式改写:In this case, the value of time series data ρ′(l, m, k, i) expressing brain function information at voxel (l, m, k) will be rewritten according to the following formula:
所有的体素都将经过这种处理。因此,被认为是灰质的体素(灰质体素)中表达脑功能信息的时间序列数值可以如图9(A)和(B)下部图像所示,该数据值可被反映(传输)给相邻的被认为是白质的体素(白质体素)的表达脑功能信息的时间序列数值。另外,当被认为是白质的体素如图9(C)中下部图像所示彼此相邻时,这些体素中反映脑功能的数将被平滑处理。该预处理可以提高后续步骤的效果。All voxels will undergo this processing. Therefore, time-series values expressing brain function information in voxels considered as gray matter (gray matter voxels) can be reflected (transmitted) to relevant Neighboring voxels considered to be white matter (white matter voxels) express time-series values of brain function information. In addition, when voxels considered to be white matter are adjacent to each other as shown in the lower image in Fig. 9(C), numbers reflecting brain functions in these voxels will be smoothed. This preprocessing can improve the performance of subsequent steps.
注意(d)型预处理并不局限于上述所说的实例。但是与灰质体素相邻并从灰质体素中接受反映脑功能信息的时间序列数值的白质体素可以按上述类似步骤进一步将数值传递给邻近的白质体素。此外,当灰质体素中反映脑功能信息的时间序列数值通过上述步骤传递到白质体素时,一加权数值可根据弥散张量D(l,m,k)进行传递。另外,在上述步骤中被改写的白质体素值和原始的白质体素值之间较大的值可以被设定为该白质体素的值。Note that type (d) preprocessing is not limited to the above mentioned examples. But white matter voxels adjacent to gray matter voxels and receiving time-series values reflecting brain function information from gray matter voxels can further transmit values to adjacent white matter voxels following similar steps above. In addition, when the time series values reflecting brain function information in the gray matter voxels are transmitted to the white matter voxels through the above steps, a weighted value can be transmitted according to the diffusion tensor D(l, m, k). In addition, the greater value between the white matter voxel value rewritten in the above steps and the original white matter voxel value may be set as the value of the white matter voxel.
接下来,在步骤S30中,基于上述所说的弥散张量,Next, in step S30, based on the aforementioned diffusion tensor,
使用体素间联系度计算装置4,计算两相邻体素联系度矢量,Use inter-voxel connection degree calculation device 4 to calculate two adjacent voxel connection degree vectors,
该联系度矢量可从下式所得:The connection degree vector can be obtained from the following formula:
在此,等式(12)中的每个组份都可如等式(13)所定义,Here, each component in equation (12) can be defined as equation (13),
在以下内容中,这被称为相邻体素间平均弥散度矢量。标记α为满足不等式(14)的参数。
0≤α≤1,… (14)0≤α≤1,... (14)
在等式(13)中,等式(16)是代表质子弥散度的矢量(以下被称为弥散度矢量),其中第一组份Dl(l,m,k)代表质子在体素(l,m,k)X轴方向上的弥散度,第二组份Dm(l,m,k)代表质子在体素(l,m,k)Y轴方向上的弥散度,第三组份Dk(l,m,k)代表质子在体素(l,m,k)Z轴方向上的弥散度。In Equation (13), Equation (16) is a vector representing proton dispersion (hereinafter referred to as the dispersion vector), where the first component Dl(l, m, k) represents the proton in the voxel (l , m, k) the dispersion in the X-axis direction, the second component Dm(l, m, k) represents the dispersion of protons in the voxel (l, m, k) Y-axis direction, the third component Dk (l, m, k) represents the dispersion of protons in the Z-axis direction of the voxel (l, m, k).
这里所说的X,Y和Z方向假定和图7显示的方向相一致。在等式(9)中,弥散张量被假定为对称张量。The X, Y and Z directions mentioned here are assumed to be consistent with the directions shown in FIG. 7 . In equation (9), the diffusion tensor is assumed to be a symmetric tensor.
使用具有上述假设的弥散度矢量

需要注意的是在本实施例中,虽然在倾斜方向上相邻的体素(如体素(l,m,k)和体素(l+1,m+1,k))的联系度没有被直接考虑,但是其已经通过垂直方向上的体素(体素(l+1,m,k)或者体素(l,m+1,k))被间接考虑了。显然,我们也可以设置成直接考虑倾斜方向上相邻的体素的联系度。It should be noted that in this embodiment, although the connection degree of adjacent voxels in the oblique direction (such as voxel (l, m, k) and voxel (l+1, m+1, k)) has no is considered directly, but it has been considered indirectly via voxels in the vertical direction (voxel (l+1, m, k) or voxel (l, m+1, k)). Obviously, we can also set it to directly consider the connection degree of adjacent voxels in the oblique direction.
弥散度矢量
(I)当被应用于椭圆形的模型中,(I) when is applied to the elliptical model,
这里的|D|代表由等式(9)代表的矩阵的行列式。Here |D| represents the determinant of the matrix represented by Equation (9).
(II)使用由等式(9)代表的矩阵的对角元素Dll(l,m,k),Dmm(l,m,k)和Dkk(l,m,k),可以得到以下等式:(II) Using the diagonal elements Dll(l, m, k), Dmm(l, m, k) and Dkk(l, m, k) of the matrix represented by equation (9), the following equations can be obtained:
Dl(l,m,k)=|Dll(l,m,k)|,Dm(l,m,k)=|Dmm(l,m,k)|and Dk(l,m,k)=|Dkk(l,m,k)|Dl (l, m, k)=|Dll (l, m, k)|, Dm (l, m, k)=|Dmm (l, m, k)|and Dk (l, m , k)=|Dkk (l, m, k)|
… (18)... (18)
(III)使用一代表弥散各向异性的指标,弥散各向异性典型代表形式包括下式所示的部分各向异性:(III) Using an index representing the diffusion anisotropy, the typical representative form of the diffusion anisotropy includes the partial anisotropy shown in the following formula:
和相对各向异性:and relative anisotropy:
弥散度矢量
这里的DAV是Here DAV is
(IV)另外,可根据预先设定的脑解剖数据(通过MRI设备50获得的T1加权图像)确定脑白质体素和灰质体素,然后上述涉及的(I)的弥散度用于白质体素,而将其它弥散度矢量(如:以上提到的(II)或(III))用于灰质体素。(IV) In addition, brain white matter voxels and gray matter voxels can be determined according to pre-set brain anatomical data (T1-weighted images obtained by MRI equipment 50), and then the above-mentioned diffusion degree of (I) is used for white matter voxels , while other diffusivity vectors (eg (II) or (III) mentioned above) are used for gray matter voxels.
如上所述,作为本发明中的弥散度矢量
另外,除了与α参数相关的不等式(14)以外,α参数也可以被设置为在白质体素和灰质体素间转换。比如,在灰质体素中拥有一个大的值,而在白质体素中拥有一个小的值。In addition, in addition to the inequality (14) related to the alpha parameter, the alpha parameter can also be set to switch between white matter voxels and gray matter voxels. For example, having a large value in a gray matter voxel and a small value in a white matter voxel.
此外,除了等式(11)的联系度矢量
另外,为了突出神经纤维的走向,可以提高等式(11)或者(22)中联系度矢量
另外,通过将这些组分数值乘以a得到的值可能用于白质体素中,通过将这些组分数值乘以b得到的值可能用于灰质体素中。此外,只有这些组分中最大的组分才可以用上述方法突出。还有,只有拥有大于或者等于{cl(l,m,k)+cm(l,m,k)+ck(l,m,k)}/3数值的组分才可以用上述方法突出。In addition, values obtained by multiplying these component values by a may be used in white matter voxels, and values obtained by multiplying these component values by b may be used in gray matter voxels. Furthermore, only the largest of these components can be highlighted with the method described above. Also, only components with a value greater than or equal to {cl(l, m, k)+cm(l, m, k)+ck(l, m, k)}/3 can be highlighted by the above method.
联系度矢量
之后,在步骤S40,为了根据步骤S20中预处理后的反映脑功能信息的时间序列数据ρ(l,m,k,i)和步骤S40中计算得到的联系度矢量
这里的标记i为时间,标记l,m和k分别为代表体素在X轴,Y轴,Z轴方向上位置的变量。请注意,实际中图7所示的立体构型体素中可能有体素不代表脑(神经),与其相关的l,m,k需被去除。同时,
这里的
虽然如上述所说的,等式(23)通过相邻体素间的连续性推算出了估计值,但是该估计值也可以通过相邻体素间的平滑性推算出。Although, as stated above, Equation (23) derives the estimated value from the continuity between adjacent voxels, the estimated value can also be derived from the smoothness between adjacent voxels.
本实施例中,以非参数回归分析作为数据分析技术的基础在于,当解释后的变量

通常在非参数回归分析中,我们通过假定解释后变量

这里右边第一项表示解释后变量在每个时间i的预测结果

然而如图5(A)所示,我们不能就解释后变量

在此,我们将对等式(23)进行解释。右边第一项表示解释后变量

第二到第四项表示相邻体素对解释后变量
另外,在本实施例中,由体素间联系度计算装置4计算得到的联系度矢量
由于这些组分分别是平均弥散度矢量
接下来,在步骤S50中,数据分析装置6将通过计算来确定在S40步中形成的数据估计值Q的极值。在本实施例中,我们计算获得了使等式(23)中数据估计值Q最小化的回归系数
这里为了简便起见,我们从等式(23)改写数据估计值Q″为:Here, for simplicity, we rewrite the data estimate Q″ from Equation (23) as:
其中,n是代表体素位置的独立的正数变量,所有具有三维构型的体素都被给予一预先指定的数值,从而被重新编排为一维,该变量与三维显示变量(l,m,k)一一对应。另外,为了简化目的,我们设置为L=M=K,因此体素的数量为L3。同时,当所有的体素都以这种方法在一维方向上重排后,系数C(n)代表体素n和相邻体素n′的联系度。该系数是根据等式(11)的连接矢量
例如,当只限于图3(B)中的二维切片图像Sk时,与n=130体素相邻的体素有四个:n=127,129,131,257。例如:根据S30步计算的联系度矢量
在这里,联系度是由Here, the linkage degree is given by


该实例中,通过使用最小平方法,回归系数
其中,X为拥有ρ(n,i)组分的L3xI矩阵,


型的神经网络模型包括由输入层,中间层,和输出层组成的多层次神经网络。The type neural network model includes a multi-layer neural network composed of an input layer, an intermediate layer, and an output layer.
在本修饰例的步骤S40中,数据估计值形成装置5形成估计值,其中基于体素间联系度计算装置4获得的联系度矢量
随后,在步骤S50中,使用误差后续增值法或类似方法,通过数据分析装置6进行分析从而确定估计值的最小值,而后步骤S60中,图片生成装置7生成输入(脑功能信息的时间序列数据)和输出的敏感度(即输入值的改变对输出值的影响),从而生成类似于实施例一的显示图像。然后,在S70步中,图片显示装置8显示上述生成的立体图像。Subsequently, in step S50, the minimum value of the estimated value is determined through analysis by the data analysis device 6 by using the error subsequent increment method or similar methods, and then in step S60, the picture generation device 7 generates input (time series data of brain function information) ) and the sensitivity of the output (that is, the influence of the change of the input value on the output value), so as to generate a display image similar to the first embodiment. Then, in step S70, the
这使我们有可能获得与实施例一相似的效果。This makes it possible for us to obtain an effect similar to that of
<实施例一修饰例2><Example 1
在步骤S40中,数据估计值形成装置5使用实施例一中的反映脑信息的时间序列数据ρ(l,m,k,i)作为解释变量,
该估计值的形成是通过使用反比例关系,即使用
其中给出了下列限制条件:where the following constraints are given:
随后在步骤S50中,使用交叉证实方法,通过数据分析装置6确定最佳值κ,从而确定上述估计值Q″′的最小值,使用概率性搜寻算法如:起源算法(Genetic Algoritm),确定回归系数
随后在步骤S60中,根据体素的脑功能数据ρ(l,m,k),通过图像生成装置7生成一个作为图像显示的数值,该数值通过不同分析所得结果被确定为重要的。然后,在S70中,通过图像显示装置8显示以上生成的立体图像。Then in step S60, based on the voxel-wise brain function data ρ(l, m, k), an image displaying value is generated by the image generation device 7, which value has been determined to be important by the results of various analyzes. Then, in S70 , the stereoscopic image generated above is displayed on the
这使我们有可能获得与实施例一相似的效果。This makes it possible for us to obtain an effect similar to that of
<实施例一修饰例3><Example 1 Modified Example 3>
在步骤S40中,数据估计值形成装置5使用实施例一中的反映脑信息的时间序列数据ρ(l,m,k,i)作为解释变量,

这使我们有可能获得与实施例一相似的效果。This makes it possible for us to obtain an effect similar to that of
<实施例一修饰例4><Example 1 Modification 4>
实施例一S50中使用等式(24)的线性回归等式,通过数据分析装置6进行非参数型回归分析,也可以使用分类分析技术,如:判别分析(非专利文献8:Story of multivariate analysis″,T.Arima,S.Ishimura,Tokyo Tosho,1987),定量II(非专利文献9),决策树(非专利文献10:″Data analysis by A.I.″,J.R.Quinlan,Toppan,1995),支撑矢量机(非专利文献11:″Introduction to support vector machine″,NelloCristianini and John Shawe-Taylor,Kyoritsu shuppan,2005)或者类似技术作为分析技术。Use the linear regression equation of equation (24) in the embodiment one S50, carry out non-parametric regression analysis by data analysis device 6, also can use classification analysis technology, such as: discriminant analysis (Non-Patent Document 8: Story of multivariate analysis ", T.Arima, S.Ishimura, Tokyo Tosho, 1987), quantitative II (non-patent literature 9), decision tree (non-patent literature 10: "Data analysis by A.I.", J.R.Quinlan, Toppan, 1995), support vector machine (Non-Patent Document 11: "Introduction to support vector machine", Nello Cristianini and John Shawe-Taylor, Kyoritsu shuppan, 2005) or similar technology as an analysis technique.
在任何情况下,使用反映脑功能信息时间序列数据ρ(l,m,k,i)作为解释变量,使用任务和休息的时间序列数据作为外部标准,通过各种辨别方程式,决策树或类似方程式对数据进行分类。在本修饰例步骤S40中,通过数据估计值形成装置5形成估计值,其中于步骤S30中计算得到的联系度矢量
随后在步骤S50中,使用每个分析技术,通过数据分析装置6进行数据分析。如果估计值出现上述改变,普通的解决方案将不适用,因此可以使用交叉证实法,通过数据分析装置6确定优化κ值,使用概率性搜寻算法进行数据分析。Then in step S50, data analysis is performed by the data analysis device 6 using each analysis technique. If the above-mentioned changes occur in the estimated value, the ordinary solution will not be applicable, so the cross-validation method can be used to determine the optimal κ value through the data analysis device 6, and a probabilistic search algorithm can be used for data analysis.
随后在S60中,根据体素的脑功能数据ρ(l,m,k),通过图像生成装置7生成一个用于图像显示数值,该数值通过上述不同分析结果被确定是重要的。然后,在步骤S70中,通过图像显示装置8显示以上生成的立体图像。Then in S60, according to the brain function data ρ(l, m, k) of the voxel, a value for image display is generated by the image generation device 7, which value is determined to be important through the above-mentioned different analysis results. Then, in step S70 , the stereoscopic image generated above is displayed by the
这使我们有可能获得与实施例一相似的效果。This makes it possible for us to obtain an effect similar to that of
<实施例一修饰例5><Example 1 Modified Example 5>
当使用实施例一步骤S50中等式(24)的线性回归等式,通过数据分析装置6进行非参数回归分析,独立组份分析也可以被用作一种数据分析技术。(非专利文献12:″Detailed explanation of IndependentComponent Analysis Novel world of signal analysis″,Aapo Hyvarinenet al.,Tokyo Denki University Press 2005)。When using the linear regression equation of equation (24) in step S50 of the first embodiment, non-parametric regression analysis is performed by the data analysis device 6, independent component analysis can also be used as a data analysis technique. (Non-Patent Document 12: "Detailed explanation of Independent Component Analysis Novel world of signal analysis", Aapo Hyvarine et al., Tokyo Denki University Press 2005).
在本修饰例中,数据估计值形成装置5在步骤S40中基于体素间联系度计算装置4获得的联系度矢量
在本修饰例中,根据独立成份分析,分析反映脑功能信息时间序列数据ρ(l,m,k,i)中的“空间独立性”条件被更改为“基于弥散张量信息的联系度的空间独立性”。独立组份分析有几种特定技术,但是在使用交叉关联度最小化的技术时,交叉关联度其实并不是被最小化了,而是在联系度的基础上使其更接近估计值。结果,具有较大联系度的体素间的交叉关联度变成了“独立程度”,而具有较小联系度(或没有关联度)的体素间的交叉关联度被最小化,与联系度的估计值更相近,更确切的讲,例如:在评估方程中,基于联系度的估计值的加权因子被设置于平方总数的每一个值,该评估方程使关联矩阵中的非对角元素的平方总和最小化。当联系度越大,加权因子越小。In this modified example, according to the independent component analysis, the "spatial independence" condition in the time series data ρ(l, m, k, i) reflecting brain function information is changed to "the degree of connection based on the diffusion tensor information". spatial independence". There are several specific techniques for independent component analysis, but when using the technique of minimizing cross-correlation, the cross-correlation is not actually minimized, but brought closer to the estimated value based on the degree of association. As a result, the degree of cross-correlation between voxels with a large degree of connection becomes "independent degree", while the degree of cross-correlation between voxels with a small degree of connection (or no degree of connection) is minimized, and the degree of connection The estimated value of is closer, more precisely, for example: In the evaluation equation, the weighting factor of the estimated value based on the degree of connection is set to each value of the square total, and the evaluation equation makes the off-diagonal elements of the incidence matrix The sum of squares is minimized. When the connection degree is larger, the weighting factor is smaller.
在随后的步骤S50中,结合上述形成的估计值,通过分析装置6进行独立组份分析。其中,通过使用交叉证实方法确定优化κ值,同时通过概率性搜寻算法如起源算法进行数据分析。In the subsequent step S50, the analysis device 6 performs independent component analysis in combination with the estimated values formed above. Among them, the optimal κ value is determined by using a cross-validation method, and data analysis is performed by a probabilistic search algorithm such as the origin algorithm.
随后在步骤S60中,通过图像生成装置7生成上述获得的独立组分显示图像。然而,由于上述分析产生了许多独立组分,因此需要从所有的行矢量中提取与“任务/休息”关联值最高的行矢量。Then in step S60 , the above obtained independent component display image is generated by the image generating device 7 . However, since the above analysis produced many independent components, it was necessary to extract the row vector with the highest value associated with "task/rest" from all the row vectors.
在随后的步骤S70中,通过图像显示装置8显示上述形成的立体图像。In the subsequent step S70 , the stereoscopic image formed above is displayed by the
这使我们有可能获得与实施例一相似的效果。This makes it possible for us to obtain an effect similar to that of
请注意,除了主要的组分分析以外,作为从反映脑功能信息时间序列数据中提取预设主要组份的提取技术的因素分析和定量III,但不是上述的独立组份分析,也可以以上述相似的方式进行分析。Please note that in addition to principal component analysis, factor analysis and quantification III, which are extraction techniques for extracting preset principal components from time-series data reflecting brain function information, but not independent component analysis above, can also be analyzed in a similar manner.
[实施例二][Example 2]
图10是本发明实施例二中脑功能分析仪器构造示意图。实施例二中的脑功能分析仪器20装备有体素间联系度计算装置24,而不是体素间联系度计算装置4,还有实施例一中脑功能分析仪器10的数据估计值形成装置5和数据分析装置6,数据估计值形成装置25,数据平滑装置200和数据分析装置26。对于与实施例一中相同的配置,其符号也相同,因此之后将不做重复描述。请注意,虽然脑功能分析仪器20使用显示控制台模式,其中本实施例中的主要形成装置20A,图形显示装置8,存储装置9被组合在一起,但是也可以使用如下配置:将图形显示装置8,或者图形显示装置8和存储装置9,和主要形成装置20A分开,分别作为独立的图像显示单元和储存单元。Fig. 10 is a schematic diagram of the structure of the brain function analysis instrument in
依照实施例一详细描述的方式,从弥散张量数据获取装置2获取的弥散张量数据D(l,m,k)(等式(9))中计算出平均弥散度矢量(等式(12))后,体素间联系度计算装置24计算联系度矢量

数据平滑装置200包括一个加权平均过滤器,使用体素间联系度计算装置24计算得到的联系度矢量
数据分析装置26对由数据平滑装置200利用如SPM或相似技术平滑处理后的数据进行数据分析。The data analyzing means 26 performs data analysis on the data smoothed by the data smoothing means 200 using techniques such as SPM or the like.
图11是脑功能分析仪器20根据图10所示实施例二进行数据分析的流程图。FIG. 11 is a flowchart of data analysis performed by the brain
在步骤S100中,脑功能数据获取装置1获取由MRI设备50测得的脑功能信息原始时间序列数据ρ′(l,m,k,i)。同一步骤中,弥散张量信息获取装置2获取由MRI设备50测得的弥散张量数据D(l,m,k)。In step S100 , the brain function
接着,在步骤S110中,数据预处理装置3对在步骤S100中获得的脑功能信息原始时间序列数据ρ′(l,m,k,i)进行如实施例一所述的(a)到(d)型预处理,进而产生脑功能信息时间序列数据ρ(l,m,k,i)。Next, in step S110, the
接着,在步骤S120中,体素间联系度计算装置24按照实施例一详细介绍的方法,根据步骤S100中获得的弥散张量数据D(l,m,k)初步计算平均弥散度矢量Next, in step S120, the inter-voxel
接着,根据等式(31)计算联系度矢量

接着,在步骤S130中,数据平滑装置26根据等式(32),使用步骤S120中计算获得的联系度矢量
此处,w和W为加权系数,该加权系数经过标准化以满足以下等式(33):Here, w and W are weighting coefficients, which are normalized to satisfy the following equation (33):
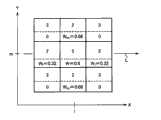
图12描述了实施一使用的一数据平滑技术,同时列出了二维切片图像Sk在位置(l,m)的9个体素的脑功能信息时间序列数据ρk(l,m,i)。在该例子中,ρk(l,m,i)=5,ρk(l-1,m,i)=ρk(l-1,m-1,i)=ρk(l,m-1,i)=ρk(l,m+1,i)=ρk(l+1,m,i)=2,and ρk(l+1,m-1,i)=ρk(l-1,m+1,i)=ρk(l+1,m+1,i)=3,此处,ρk(l,m-1,i),ρk(l,m+1,i),ρk(l-1,m,i),ρk(l+1,m,i)用来平滑其中的ρk(l,m,i)。同时,假设一种满足D ′k(l,m,k)=0的情况(也就是说在Z方向上不存在质子发散),和D′l(l,m,k)=0.8、D′m(l,m,k)=0.2,w=0.4,W=0.6,在这种情况下,联系度矢量
这一处理是针对二维切片图像Sk中所有体素的脑功能信息时间序列数据ρ(l,m,k,i)进行的,经过对该数据的平滑处理,使得所有方向(也就是平均弥散度矢量
另外,如等式(5)所述,只有与最大本征值λM相应的本征矢量
接着,在步骤S140中,数据分析装置26用SPM或相似的分析技术对在步骤S140中经过平滑的脑功能信息的时间序列数据ρ(l,m,k,i)进行数据分析。Next, in step S140, the
接着,在步骤S150中,图像生成装置7根据数据分析装置26分析的结果生成颜色图像,如灰色或全彩图。Next, in step S150 , the image generation device 7 generates a color image, such as a gray or full-color image, according to the analysis result of the
其后,在步骤S160中,图像显示装置8立体显示上述生成的图像。Thereafter, in step S160, the
如上所述,在实施例二中,从MRI设备中获得的脑功能信息时间序列数据依据从MRI设备获得的弥散张量数据计算得到的联系度矢量进行平滑处理,在考虑脑激活区域之间连接结构的同时,确定脑激活区域。As mentioned above, in the second embodiment, the brain function information time series data obtained from the MRI equipment is smoothed according to the connection degree vector calculated from the diffusion tensor data obtained from the MRI equipment, and the connection between brain activation regions is considered. Simultaneously with the structure, regions of brain activation are identified.
需要指出的是,等式(31)的联系度矢量
此外,上述分析清楚地表明在本实施例中的数据平滑处理技术并不依赖于某一特定的数据分析技术。In addition, the above analysis clearly shows that the data smoothing technology in this embodiment does not depend on a specific data analysis technology.
<实施例二修饰例><Modification of Example 2>
在实施例二中,尽管步骤S140使用SPM或相似技术进行的数据分析在后,步骤S130依据弥散张量数据D(l,m,k)计算得到的联系度矢量
因而,我们将对上述实施例二的修饰例进行描述。为避免重复,我们在以下内容中只描述与实施例二不同的部分。Therefore, we will describe a modified example of the second embodiment above. In order to avoid repetition, we only describe the parts different from the second embodiment in the following content.
图13是一个符合实施例二的修饰例的脑功能分析仪器构造示意图。尽管本修饰例的脑分析仪器20′的配置与实施例二的仪器配置基本相似,但不同的是数据平滑装置200和数据分析装置26被互相调换了。因此,由脑功能分析仪器20′进行的数据分析程序与实施例二中的不同。注意,尽管脑功能分析仪器20′采用了显示控制台模式,其中主要形成装置20A′、图像显示装置8和存储装置9在本实例中是组合在一起的,其也可能采用另外一种构造,即图像显示装置8或图像显示装置8和图像存储装置9从主要形成装置20A′中分离出来分别作为独立的图像显示单元和存储单元。Fig. 13 is a schematic diagram of the structure of a brain function analysis instrument according to a modified example of the second embodiment. Although the configuration of the
图14是图13中脑功能分析仪器20′进行数据分析程序的流程图。在本修饰例中,数据分析装置26′首先在步骤S121中使用SPM或相似分析技术对数据预处理装置3预处理后的脑功能信息时间序列数据ρ(l,m,k,i)进行数据分析。接着,在步骤S131中,通过体素间联系度计算装置24,按照与实施例二中相似的方法计算如等式(31)所示的联系度矢量
接着,在步骤S141中,数据平滑装置200′利用等式(32)按照与实施例二中相似的方法对脑功能数据ρ(l,m,k)进行平滑处理,该数据由数据分析装置26′进行分析产生的。接着,在步骤S150中,图像生成装置7根据预设的处理方法生成有关上述平滑处理数据ρ(l,m,k)的图像颜色,如灰色或全彩图像。Next, in step S141, the data smoothing device 200' uses equation (32) to perform smoothing processing on the brain function data ρ(l, m, k) in a manner similar to that in
此后,在步骤S160中,图像显示装置8立体显示上述产生的图像。Thereafter, in step S160, the
因此,本修饰例获得与实施例二相似的结果。Therefore, this modified example obtains a result similar to that of Example 2.
[实施例三][Embodiment three]
图15是本发明实施例三的脑功能分析仪器的构造示意图。实施例三的脑功能分析仪器30包括如下配置:体素间联系度计算装置34,而不是体素间联系度计算装置4,数据估计值形成装置5,实施例一中脑功能分析仪器10的数据分析装置6,聚集装置300和数据分析装置36。与实施例一配置相同的,其符号也相同,下文将省略重复的内容。注意,尽管脑功能分析仪器30采用了显示控制台模式,其中主要形成装置30A、图像显示装置8和存储装置9在本实例中是组合在一起的,其也可能采取如下配置:图像输出装置8,或图像输出装置8和图像存储装置9从主要形成装置30A中分离出来分别作为独立的图像显示单元和存储单元。Fig. 15 is a schematic diagram of the structure of the brain function analysis instrument according to the third embodiment of the present invention. The brain
通过弥散张量数据获取装置2,根据实施例一所述的方法获得的弥散数据D(l,m,k)(等式(9))计算出平均弥散度矢量

聚集装置300使用由体素间联系度计算装置34计算得出的联系度矢量
数据分析装置36利用SPM或相似分析技术对数据预处理装置3预处理后的脑功能信息时间序列数据ρ(l,m,k,i)进行数据分析。该数据分析同时使用聚集装置300聚集获得的体素组(群)为单位。The
图16是图15所示实施例三中脑功能分析仪器30进行数据分析的流程图。FIG. 16 is a flow chart of data analysis performed by the brain
在步骤S200中,脑功能数据获取装置1获取MRI设备50测得的脑功能信息原始时间序列数据ρ′(l,m,k,i)。同时,弥散张量信息获取装置2获取MRI设备50测得的弥散张量数据D(l,m,k)。In step S200 , the brain function
接着,在步骤S210中,数据预处理装置3对在步骤S200中获得的脑功能信息原始时间序列数据ρ′(l,m,k,i)进行如实施例一所述的(a)到(d)型预处理,进而产生脑功能信息时间序列数据ρ(l,m,k,i)。Next, in step S210, the
接着,在步骤S220中,体素间联系度计算装置34根据在实施例一所述方式,首先从在步骤S200中获得的弥散张量数据D(l,m,k)中计算出平均弥散度矢量
接着,如等式(36)所示,计算出联系度矢量该矢量为根据平均弥散度矢量
此处,
接着,在步骤S230中,通过聚集装置300聚集体素,其中在步骤S220中计算得到的联系度矢量的各要素Sl(l,m,k),Sm(l,m,k)和Sk(l,m,k)的值分别在X轴、Y轴和Z轴方向变为正数。Next, in step S230, the voxels are aggregated by the
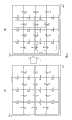
图17为使用图15所示聚集装置300的聚集技术图解,并显示二维切片图像Sk的16个体素。图17(A)中相邻体素间的箭头值代表平均弥散度矢量在X轴或Y轴方向的值。如果等式(37)的常数矢量的每一要素的值分别设定为hl=hm=3和hk=0,联系度矢量
此时,通过有次序的连接相邻体素,其中联系度矢量
由于联系度矢量
接着,在步骤S240中,数据分析装置36使用SPM或相似分析对在步骤S210中预处理后的脑功能信息时间序列数据ρ(l,m,k,i)进行数据分析,该数据分析覆盖了步骤S230中聚集的每一体素组(束)。在那种情况下则需要对一个聚集束或类似聚集等同物内的脑功能信息时间序列数据进行平均化处理。Next, in step S240, the
接着,在步骤S250中,根据步骤S240分析后的数据
之后,在步骤S260中,图像显示装置8显示步骤S250产生的立体图像。After that, in step S260, the
如上所述,在实施例三中,由MRI设备获取的脑功能信息时间序列数据根据该设备获取的弥散张量数据被聚集成束,而后对各个束相应的脑功能信息时间序列数据进行分析。这样就能在确定脑激活功能区域的同时也考虑到脑激活功能区域间联系。As mentioned above, in the third embodiment, the time-series data of brain function information acquired by the MRI equipment is aggregated into bundles according to the diffusion tensor data acquired by the equipment, and then the time-series data of brain function information corresponding to each bundle is analyzed. In this way, the connection between brain activation function areas can be considered while determining the brain activation function area.
需要指出的是,等式(36)的联系度矢量
另外,如等式(5)所述,只有与最大本征值λM相应的本征矢量
此外,上述分析清楚地表明了本实施例中的聚集处理技术并不依赖于一个具体的数据分析技术。In addition, the above analysis clearly shows that the aggregation processing technology in this embodiment does not depend on a specific data analysis technology.
<实施例三的修饰例1><
虽然在实施例三中,首先使用根据步骤S230中获得的弥散张量数据D(l,m,k)计算联系度矢量
我们将对上述实施例三中的修饰例进行阐述。为避免重复,下文只阐述那些与实施例三中不同的内容。We will describe the modified examples in the third embodiment above. In order to avoid repetition, only those contents different from those in Example 3 are described below.
图18是实施例三修饰例中的脑功能分析仪器的结构示意图。虽然本修饰例的脑功能分析仪器30′的结构基本上与实施例三相同,但是它们区别在于聚集装置300和数据分析装置36被调换了。因此,由脑功能分析仪器30′执行的数据分析程序与实施例三不同。注意,尽管脑功能分析仪器30′采用了显示控制台模式,其中主要形成装置30A′、图像显示装置8和存储装置9在本实例中是组合在一起的,其也可能采用如下配置:图像显示装置8,或图像显示装置8和图像存储装置9从主要形成装置30A′中分离出来分别作为独立的图像显示单元和存储单元。Fig. 18 is a schematic structural diagram of the brain function analysis instrument in the modified example of the third embodiment. Although the structure of the brain
图19是图18所示脑功能分析仪器30′执行数据分析程序的流程图。本修饰例步骤S221中,数据分析装置36’首先使用SPM或相似技术对由数据预处理装置3预处理后的脑功能信息时间序列数据ρ(l,m,k,i)进行数据分析。接着,在步骤S231中,体素间联系度计算装置34以与实施例三中相似的方式计算等式(36)中的联系度矢量
接着,在步骤S241中,聚集装置300′采用与实施例三相似的方式根据由数据分析装置36′分析获得的脑功能数据ρ(l,m,k)对图17所示体素进行聚集。接着,在步骤S250中,图像生成装置7根据聚集的脑功能数据基于预设方法,生成颜色图像,如灰色或全彩图像。Next, in step S241, the clustering device 300' clusters the voxels shown in Fig. 17 according to the brain function data ρ(l, m, k) analyzed and obtained by the data analysis device 36' in a manner similar to that of the third embodiment. Next, in step S250, the image generation device 7 according to the gathered brain function data Generate color images, such as gray or full-color images, based on preset methods.
此后,在步骤S260中,图像显示装置8显示上述生成的立体图像。Thereafter, in step S260, the
因此,本修饰例获得了与实施三相似的结果。Therefore, this modified example obtains a result similar to that of
<实施例三修饰例2><Example 3 Modified Example 2>
使用SPM或相似分析技术在对由数据预处理装置3预处理后的脑功能信息时间序列数据ρ(l,m,k,i)进行数据分析后,使用实施例三修饰例1中体素间联系度计算装置34计算出的联系度矢量
因此本修饰例将描述使用决策树(分类分析技术的一种)作为数据分析技术的情况。比如,当使用决策树同时又使用解释变量(属性)作为脑功能信息时间序列数据ρ(l,m,k),使用外部标准(任务)作为图4中任务和休息时间序列数据时,不必要的属性(体素)就可以被除去,同时只保留那些必需的属性(体素)。这样,通过使用联系度矢量
比如,上述实例可以如下步骤进行:(1)选定某一特定体素,(2)对体素周围联系度不低于某一定值的体素进行聚集,(3)重复程序(2)一直到联接度低于该定值的体素全部被去除,(4)如果仍有其它体素存在,这些体素将被选出,然后回到处理程序(2)。For example, the above example can be carried out in the following steps: (1) select a specific voxel, (2) gather the voxels whose connection degree around the voxel is not lower than a certain value, (3) repeat the procedure (2) keep All the voxels whose connection degree is lower than the fixed value are removed, (4) if there are still other voxels, these voxels will be selected, and then return to the processing procedure (2).
接着,在步骤S250中,图像生成装置7基于预设的方法生成上述聚集的脑功能数据
此后,在步骤S260中,图像显示方式8显示上述生成的立体图像。Thereafter, in step S260, the
因此,本修饰例获得了与实施三相似的结果。Therefore, this modified example obtains a result similar to that of
[实施例四][embodiment four]
图20是实施例四中的脑功能分析仪器的结构示意图。实施例四的脑功能分析仪器40包括如下配置:体素间联系度计算装置44(而不是体素间联系度计算装置4),数据估计值形成装置5,实施例一中脑功能分析仪器10的数据分析装置6,和数据测试装置400。与实施例一配置相同的,其符号也相同,下文将省略重复的内容。注意,尽管脑功能分析仪器40采用了显示控制台模式,其中主要形成装置40A、图像显示装置8和存储装置9在本实例中是组合在一起的,其也可能采取如下配置:图像显示装置8,或图像显示装置8和图像存储装置9从主要形成装置40A中分离出来分别作为独立的图像显示单元和存储单元。Fig. 20 is a schematic structural diagram of the brain function analysis instrument in the fourth embodiment. The brain
体素间联系度计算装置44计算联系度矢量

数据测试装置400根据体素间联系度计算装置44计算获得的联系度矢量
图21是图20所示脑功能分析仪器40执行数据分析程序的流程图。FIG. 21 is a flow chart of the data analysis program executed by the brain
在步骤S300中,脑功能数据获取装置1获取由MRI设备50测得的脑功能信息原始时间序列数据ρ′(l,m,k,i),同一步骤中,弥散张量信息获取装置2获取同样由MRI设备50测得的弥散张量数据D(l,m,k)。In step S300, the brain function
接着,在步骤S310中,数据预处理装置3对在步骤S300中获得的脑功能信息原始时间序列数据ρ′(l,m,k,i)进行如实施例一所述的(a)到(d)型预处理,从而产生脑功能信息时间序列数据ρ(l,m,k,i)。Next, in step S310, the
接着,在步骤S320中,通过体素间联系度计算装置44计算联系度矢量
用于调整参考值(测试值、重要性级别或类似数值)。例如:对每一个体素的脑功能信息时间序列数据ρ(l,m,k,i)进行Z测试,该数据在步骤S310根据在该步骤获得的弥散张量数据作为等式(12)所示平均弥散度矢量的函数进行了预处理。Used to adjust reference values (test values, importance levels, or similar). For example: carry out Z test to the brain function information time-series data ρ (l, m, k, i) of each voxel, this data is obtained as equation (12) in step S310 according to the diffusion tensor data obtained in this step mean diffusivity vector function is preprocessed.
接着,在步骤S330中,通过数据测试装置400对每一个体素在步骤S310中预处理过的脑功能信息时间序列数据ρ(l,m,k,i)进行Z测试,进而计算一个Z分值。接着,同一步骤中,利用一个带高Z分值的体素(例如,以体素(l,m,k))作为参考点,参考点周围(26个方向)的一体素(如体素(l+1,m,k))带有的重要性级别值为a(l+1,m,k),该值被降低为如等式(39)所示:Next, in step S330, a Z test is performed on the brain function information time series data ρ(l, m, k, i) preprocessed in step S310 for each voxel by the
a′(l+1,m,k)={1-αTi(l,m,k)}a(l+1,m,k) …(39)a'(l+1, m, k)={1-αTi (l, m, k)}a(l+1, m, k) ... (39)
此处,α是一依赖于根据步骤S320中计算获得的联系度矢量
接着,在步骤S340中,图像生成装置7对被在步骤S330中根据修正后的重要性级别被认定为在图像数据中具重要性的体素的脑功能数据ρ(l,m,k)生成一个值。Next, in step S340, the image generating device 7 generates the brain function data ρ(l, m, k) of the voxels identified as important in the image data according to the corrected importance levels in step S330. a value.
接着,在步骤S350中,图像显示装置8显示步骤S340中生成的立体图像数据。Next, in step S350, the
注意,尽管测试重要性级别的值是根据上述弥散张量数据获取装置2获得的弥散张量数据D(l,m,k)计算得出等式(38)中的联系度矢量
比如,在每一体素的任务图像和休息图像之间执行Z测试。任务图像是指执行某特定任务的图像(比如在图2中由粗线代表的图像1到3),休眠图像是指未执行任务的图像(比如在图2中由粗线代表的图像5到7)。在这种情况下,体素(l,m,k)的Z分值(Z测试的测试值)通常由以下等式(40)代表:For example, perform a Z-test between the task and rest images at each voxel. Task images refer to images that perform a specific task (such as
此处,Mt(l,m,k)代表任务图像的脑功能信息时间序列数据ρ(l,m,k,i)的平均值;Mc(l,m,k)代表休息图像的脑功能信息时间序列数据ρ(l,m,k,i)的平均值;σt(l,m,k)代表任务图像的脑功能信息时间序列数据ρ(l,m,k,i)的标准偏差,σc(l,m,k)代表休息图像的脑功能信息时间序列数据ρ(l,m,k,i)的标准偏差。在这一前提下,如果z=0,可以说任务图像的脑功能信息时间序列数据ρ(l,m,k,i)的平均值与休息图像的脑功能信息时间序列数据ρ(l,m,k,i)的平均值没有区别。如果Z=1,则意味着任务图像的脑功能信息时间序列数据ρ(l,m,k,i)的平均值与休息图像的脑功能信息时间序列数据ρ(l,m,k,i)的平均值由于时间序列数据的变化而变大了。从这一趋势中可见带高值Z分值的体素是与任务相关的激活区域。Here, Mt(l, m, k) represents the mean value of the brain function information time series data ρ(l, m, k, i) of the task image; Mc(l, m, k) represents the brain function information of the rest image The average value of time series data ρ(l, m, k, i); σt(l, m, k) represents the standard deviation of time series data ρ(l, m, k, i) of brain function information of task images, σc (l, m, k) represents the standard deviation of the brain function information time series data ρ(l, m, k, i) of the resting images. Under this premise, if z=0, it can be said that the average value of the brain function information time series data ρ(l, m, k, i) of the task image and the brain function information time series data ρ(l, m) of the rest image , k, i) means no difference. If Z=1, it means that the average value of the brain function information time series data ρ(l, m, k, i) of the task image and the brain function information time series data ρ(l, m, k, i) of the rest image The mean value of has become large due to changes in the time series data. From this trend it can be seen that voxels with high Z-scores are task-related activation regions.
正是因此,使用在步骤S320中计算获得的等式(38)的联系度矢量
b(l,m,k)在步骤S330中被修改为:b(l, m, k) is modified in step S330 as:
b′(l,m,k)={1+βTl(l,m,k)}b(l,m,k) …(42)b'(l, m, k)={1+βTl (l, m, k)}b(l, m, k) ... (42)
此处,β是一依赖于步骤S320通过等式(38)计算所得联系度矢量
接着,在步骤S340中,图像生成装置7根据在所有体素的一般重要性级别基础上被认为是图像数据中重要的体素的脑功能数据ρ(l,m,k)生成一个值。然后,在步骤S350中,图像显示装置8显示步骤S340生成的立体图像数据。Next, in step S340, the image generating means 7 generates a value based on the brain function data p(l, m, k) of voxels considered important in the image data on the basis of the general importance levels of all voxels. Then, in step S350, the
如上所述,在实施例四中,在MRI设备获得的弥散张量的基础上,用于检测MRI设备获得的脑功能信息时间序列数据的参考值(测试值或重要性级别)在每个体素的基础上得到了调整。这样可以在考虑脑激活区域之间连接结构的同时,确定脑激活区域。As mentioned above, in the fourth embodiment, on the basis of the diffusion tensor obtained by the MRI device, the reference value (test value or importance level) used to detect the brain function information time series data obtained by the MRI device is set at each voxel adjusted on the basis of This allows the identification of brain activation regions while taking into account the connection structure between brain activation regions.
实施例四的修饰例Modification of Embodiment 4
在实施例四中,当对每一体素的脑功能信息时间序列数据ρ(l,m,k,i)执行不同的数据测试(比如T测试、F测试或Z测试)时,数据测试的参考值(测试值、重要性级别或类似数值)被运用弥散张量数据获取装置2获得的弥散张量数据计算得出的联系度矢量
接着,在本修饰例中,我们考虑使用联系度矢量
需要说明的是,为避免重复,仅对那些与实施例四不同的部分进行描述。It should be noted that, in order to avoid repetition, only those parts that are different from Embodiment 4 will be described.
图22为实施例4修饰例中脑功能分析仪器构型示意图。本修饰例的脑功能分析仪器40′的配置不同如下:数据测试装置400′和数据分析装置46′取代了实施例四中的数据测试装置400。Fig. 22 is a schematic diagram of the configuration of the brain function analysis instrument in the modified example of Example 4. The configuration of the brain function analysis instrument 40' in this modified example is different as follows: the data testing device 400' and the data analyzing device 46' replace the
数据分析装置46′为每一个体素对脑功能数据获取装置1获取的由数据预处理装置3预处理的脑功能信息时间序列数据ρ(l,m,k,i)进行数据分析,该分析使用如传统分类、回归和相关性的分析技术。The data analysis device 46' performs data analysis on the brain function information time series data ρ(l, m, k, i) preprocessed by the
数据测试装置400′使用依据联系度矢量
图23是图22中脑功能分析仪器执行数据分析的流程图。FIG. 23 is a flowchart of data analysis performed by the brain function analysis instrument in FIG. 22 .
在步骤S360中,数据分析装置46′针对每一个体素的,对其由经脑功能数据获取装置1获取的经数据预处理装置3预处理过的脑功能信息时间序列数据ρ(l,m,k,i)进行数据分析,该分析使用如传统分类、回归和相关性的分析技术。In step S360, the data analysis device 46' for each voxel, the brain function information time series data ρ(l, m) preprocessed by the
1.分类分析技术(判别分析、决策树、支撑矢量机或相类似技术)。1. Classification analysis techniques (discriminant analysis, decision tree, support vector machine or similar techniques).
1-1:在判别分析的情况下,数据分类是通过多种判定函数来进行的,同时,使用解释性变量作为脑功能信息时间序列数据ρ(l,m,k,i),外部标准作为任务和休息的时间序列数据。1-1: In the case of discriminant analysis, data classification is performed by multiple decision functions, and at the same time, explanatory variables are used as brain function information time series data ρ(l, m, k, i), and external standards are used as Time series data of task and rest.
1-2:在决策树的情况下,数据分类是用决策树来进行的,同时使用解释性变量(属性)作为任务和休息的时间序列数据,并通过分散脑功能信息时间序列数据ρ(l,m,k,i)形成几个类别,作为外部标准。1-2: In the case of decision trees, data classification is performed using decision trees while using explanatory variables (attributes) as task and rest time-series data, and by dispersing brain function information time-series data ρ(l , m, k, i) form several categories as external criteria.
2.回归分析装置(使用多种函数(线性,非线性)进行回归分析)。2. Regression analysis device (regression analysis using various functions (linear, nonlinear)).
2-1:在线性回归分析情况下,数据分析是通过一个线性回归等式来进行的,同时使用解释性变量作为任务和休息,解释后变量作为脑功能信息时间序列数据ρ(l,m,k,i)。2-1: In the case of linear regression analysis, the data analysis is carried out through a linear regression equation, while using explanatory variables as task and rest, and post-explanatory variables as brain function information time series data ρ(l, m, k, i).
3.相关性分析技术(一种利用估算模型(函数)和实际数据之间相关性的技术)。3. Correlation analysis technique (a technique that utilizes the correlation between the estimated model (function) and actual data).
数据分析通过利用预设的模型(比如,输入一种刺激则产生脑功能信息时间序列数据的函数)和脑功能信息的实际时间序列数据ρ(l,m,k,i)之间的相关性来进行的。Data analysis by using the correlation between the preset model (for example, a function that inputs a stimulus to generate time series data of brain function information) and the actual time series data of brain function information ρ(l, m, k, i) to carry out.
接着,从步骤S320到步骤S331(与实施例四相似),数据测试装置400′对在步骤S360中获得的结果是否具有统计学重要性进行测试。同时,测试的参考值(测试值,重要性级别或类似数值)利用联系度矢量
例如,当对分类分析技术获得的结果进行f测试时,f测试将对在步骤S360中每一体素获得的结果进行测试,产生一个f值。接着,在同一步骤中,使用带高f值的体素(如体素(l,m,k))作为参考点,参考点周围(26个方向)的一体素(如体素(l+1,m,k))的重要性级别的a(l+1,m,k)值可根据步骤S230中计算出的联系度矢量
在回归分析技术的情况下,临界值(与重要性级别相对应)可以按上述方法调整,同样,在相关性分析技术的情况下,相关性的临界值可以按照上述方法进行调整。In the case of the regression analysis technique, the critical value (corresponding to the importance level) can be adjusted as described above, and similarly, in the case of the correlation analysis technique, the critical value of the correlation can be adjusted as described above.
接着,在步骤S340中,图像生成装置7根据在步骤S330中修正过的重要性级别而被认定为图像数据中重要体素的脑功能数据ρ(l,m,k)生成一个值。Next, in step S340, the image generating device 7 generates a value according to the brain function data ρ(l, m, k) of voxels identified as important voxels in the image data according to the importance level corrected in step S330.
接着,在步骤S350中,图像显示装置8立体显示步骤S340中生成的图像数据。Next, in step S350, the
因此,本修饰例获得了与实施四相似的结果。Therefore, this modified example obtains a result similar to that of Embodiment 4.
以上描述的实例仅仅是一些范例,本发明并不仅限于此。The examples described above are just examples, and the present invention is not limited thereto.
比如,在每一个实例中,计算相邻体素联系度步骤可以紧随获取脑功能数据和弥散张量数据步骤。For example, in each instance, the step of calculating the degree of connection between adjacent voxels may be followed by the step of obtaining brain function data and diffusion tensor data.
另外,至于数据分析技术,使用子波分析、逻辑回归分析或相类似分析。Also, as a data analysis technique, wavelet analysis, logistic regression analysis, or the like is used.
此外,也可以把实施例二或实施例三合并于实施例一。首先,当实施例二并入实施例一时,仅需引入一个配置,在该配置中,图1显示的脑功能分析仪器10另外带有与图10或13显示的数据平滑装置200或200′具有相同功能的数据平滑装置。接着,必要的是,在数据分析装置6确定一个回归系数以使实施例一步骤S50中的数据估计值Q最小化后,使用上述数据平滑装置对回归系数值进行各向异性地平滑处理。结果,生成图像的白质(神经纤维)的活跃度有可能比实施例一中获得的图像更突出。In addition,
同时,当实施例三并入实施例一时,仅需引入一个配置,其中,图1显示的脑功能分析仪器10进一步带有与图15或18显示的聚集装置300或300′具有相同功能的聚集装置。接着,必要的是,在数据分析装置6决定一个回归系数以使实施例一步骤S50中的数据估计值Q最小化后,使用上述聚集装置处理回归系数值以聚集各体素。结果,生成图像的白质(神经纤维)的活跃度有可能比实施例一中获得的图像更突出。At the same time, when
此外,从上述实例的结果可以看出,通过进一步使用弥散张量数据D(l,m,k),也有可能扩展白质体素的激活区域。技术基本上与跟踪成像分析技术相似。In addition, as can be seen from the results of the above examples, it is also possible to expand the activation area of white matter voxels by further using the diffusion tensor data D(l, m, k). The technique is basically similar to that of tracking imaging analysis.
进一步讲,也可能以把上述技术(回归分析、相关性、分类、独立组份分析、测试或类似技术)仅仅应用于白质体素来捕获白质的激活。Further, it is also possible to capture white matter activation by applying the above-mentioned techniques (regression analysis, correlation, classification, independent component analysis, testing or similar techniques) to white matter voxels only.
同时,虽然我们在每个实施例的实验中都假定了整体设计,但是本发明也可以应用于与事件相关的fMRI。Also, although we assumed a holistic design in the experiments of each example, the invention can also be applied to event-related fMRI.
另外,本发明适用于联系度分析。联系度分析包括多种技术,比如在SEM(结构等式模型)(协方差结构分析)的情况下,相关性和测试分析被应用在其计算中,但本发明在那种情况下也是适用的,平滑和聚集处理也同样适用。In addition, the present invention is applicable to connection degree analysis. Linkage analysis includes techniques such as in the case of SEM (Structural Equation Modeling) (Structural Analysis of Covariance), correlation and test analysis are applied in its calculation, but the present invention is also applicable in that case , smoothing and clustering also apply.
神经元和神经纤维之间的连接信息可以从上述弥散张量数据中获得的,但如果连接信息(知识)可以从解剖结构上获知,那也是可以使用的。Connection information between neurons and nerve fibers can be obtained from the aforementioned diffusion tensor data, but if connection information (knowledge) can be known from anatomical structures, that can also be used.
除了上述描述的实例外,如果不偏离本发明的主题,其他各种实施方式也是可能的,本发明的范围仅限制于权利要求。Besides the examples described above, various other embodiments are possible without departing from the subject matter of the invention, the scope of which is limited only by the claims.
最后,利用本发明脑功能分析方法的脑功能分析效果将会被显示。图24显示了主体在声音刺激下执行简单重复任务时脑功能分析的结果。在实验中,重复其听到的来自耳机的声音被定义为任务,主体不思考或尽可能地不思考被定义为休息。任务的音量数(测量频率)设定为48,休息的音量数(测量频率)设定为60,未被用来分析的音量数(测量频率)设为12(参见图2)。另外,TR(重复时间与图2中音宽相对应)设定为5000毫秒。主体的数量为8人,在SPM和本发明的脑功能分析方法中都获得优异结果的主体的分析结果将在下文列出。Finally, the effect of brain function analysis using the brain function analysis method of the present invention will be shown. Figure 24 shows the results of a brain function analysis of subjects performing a simple repetitive task under sound stimulation. In the experiment, repeating what they heard from the earphone was defined as the task, and the subject not thinking or thinking as much as possible was defined as the rest. The number of volumes (frequency of measurement) for the task was set to 48, the number of volumes (frequency of measurement) for rest was set to 60, and the number of volumes (frequency of measurement) not used for analysis was set to 12 (see Figure 2). In addition, TR (the repetition time corresponds to the sound width in Fig. 2) is set to 5000 milliseconds. The number of subjects was 8, and the analysis results of the subjects who obtained excellent results in both SPM and the brain function analysis method of the present invention will be listed below.
图24A和24B都显示了使用SPM的T测试的结果,其中图24A显示了T测试临界值被修正过的分析结果,图24B显示了T测试临界值没有被修正过的分析结果。图24C显示综合SPM和跟踪成像分析技术进行的分析结果,图24D显示了使用本发明实施例一的脑功能分析方法的分析结果。注意,位置补偿、标准化和平滑处理是作为SPM的预处理程序来进行的。滤波的半值宽度设定为9毫米。另外,dTV作为弥散张量分析的软件用于跟踪成像。Both Figures 24A and 24B show the results of the T-test using SPM, wherein Figure 24A shows the analysis results with the T-test cutoff value corrected, and Figure 24B shows the analysis results without the T-test cutoff value correction. FIG. 24C shows the analysis results of the combined SPM and tracking imaging analysis techniques, and FIG. 24D shows the analysis results of the brain function analysis method of Example 1 of the present invention. Note that position compensation, normalization and smoothing are performed as preprocessing procedures of SPM. The half-value width of the filter was set to 9 mm. In addition, dTV is used as a diffusion tensor analysis software for tracking imaging.
从解剖学上已知,Wernicke区(感官语言中枢)和Broca区(运动语言中枢)在简单重复过程中被激活,且二者由一束叫做弓形纤维束的神经纤维相连。该弓形纤维束在说话时被使用。It is known anatomically that Wernicke's area (sensory language center) and Broca's area (motor language center) are activated during simple repetitions and that the two are connected by a bundle of nerve fibers called the arcuate tract. This arcuate fiber bundle is used when speaking.
图24A显示,使用SPM时,当临界值被修正时,Wernicke区和Broca区的活动不能被检测到。图24B显示,当使用SPM且T测试的临界值未被修正时,二区域的活动可以被检测到,但连接二区域的弓形纤维束不能被检测到。与这些结果相比,如果利用结合SPM和跟踪成像的分析技术,如图24C所示,不仅韦尼克氏区(Wernicke Area)和卜洛柯区(Broca’s Area)还有弓形纤维束本身都可以被检测到。Figure 24A shows that when using SPM, activity in Wernicke's and Broca's areas could not be detected when the cutoff was corrected. Figure 24B shows that when SPM was used and the cut-off value of the T-test was not modified, the activity of the two regions could be detected, but the arcuate fiber bundles connecting the two regions could not be detected. In contrast to these results, if an analysis technique combining SPM and tracking imaging is used, as shown in Fig. 24C, not only the Wernicke Area and Broca's Area but also the arcuate fiber tract itself can be identified. detected.
同时,当使用本发明实施例一的脑功能分析方法时,除能够发现图24D中显示的二区域和连接二区域的弓形纤维外,还可以检测到弓形纤维束激活(在神经纤维中的脉冲传送形成弓形纤维束激活)。At the same time, when using the brain function analysis method of
此外,在结合SPM和跟踪成像的分析技术中,分析人员需事先确定神经纤维的一个跟踪起点和一个跟踪终点以用来跟踪神经纤维(在本例中为弓形纤维束)。因此,在神经纤维的跟踪起点和跟踪终点不能事先确定时(比如在某任务中,灰质的活动区域没有事先决定),该技术将无法使用。与此相对应,根据本发明实施例一的脑功能分析方法,有可能检测出图24D显示的神经纤维的活性,尽管神经纤维的跟踪起点和跟踪终点不能事前确定。In addition, in the analysis technique combining SPM and tracking imaging, the analyst needs to determine in advance a tracking start point and a tracking end point of the nerve fiber for tracking the nerve fiber (in this case, the arcuate fiber bundle). Therefore, when the tracking start point and tracking end point of nerve fibers cannot be determined in advance (for example, in a certain task, the active area of gray matter is not determined in advance), this technology will not be applicable. Correspondingly, according to the brain function analysis method of
工业应用industrial application
如上所述,根据本发明能够确定激活的脑功能区域,即使分析者并未事先确定神经纤维的起点和终点,仍有可能确定神经纤维(脑活动区域之间的连接结构)进而可能确定神经纤维的激活(神经纤维中的脉冲传输),因此为医学诊断和治疗高度脑功能紊乱如痴呆症,失语证、精神分裂症或类似症状提供了极其有效的脑功能分析装置和脑功能分析程序。As described above, according to the present invention, it is possible to determine the activated brain functional area, and even if the analyst does not determine the start and end points of the nerve fiber in advance, it is still possible to determine the nerve fiber (connection structure between brain active areas) and then it is possible to determine the nerve fiber Activation (pulse transmission in nerve fibers), thus providing an extremely effective brain function analysis device and brain function analysis program for medical diagnosis and treatment of high-level brain dysfunction such as dementia, aphasia, schizophrenia or similar symptoms.
Claims (18)
Translated fromChineseApplications Claiming Priority (3)
| Application Number | Priority Date | Filing Date | Title |
|---|---|---|---|
| JP2005298236 | 2005-10-12 | ||
| JP298236/2005 | 2005-10-12 | ||
| PCT/JP2006/320078WO2007043462A1 (en) | 2005-10-12 | 2006-10-06 | Brain function analysis method and brain function analysis program |
Publications (2)
| Publication Number | Publication Date |
|---|---|
| CN101287410Atrue CN101287410A (en) | 2008-10-15 |
| CN101287410B CN101287410B (en) | 2013-09-11 |
Family
ID=37942705
Family Applications (1)
| Application Number | Title | Priority Date | Filing Date |
|---|---|---|---|
| CN2006800380625AActiveCN101287410B (en) | 2005-10-12 | 2006-10-06 | Brain function analysis method and brain function analysis device |
Country Status (6)
| Country | Link |
|---|---|
| US (1) | US8059879B2 (en) |
| EP (1) | EP1946701B1 (en) |
| JP (1) | JP4308871B2 (en) |
| KR (1) | KR100971936B1 (en) |
| CN (1) | CN101287410B (en) |
| WO (1) | WO2007043462A1 (en) |
Cited By (12)
| Publication number | Priority date | Publication date | Assignee | Title |
|---|---|---|---|---|
| CN101912263A (en)* | 2010-09-14 | 2010-12-15 | 北京师范大学 | Real-time fMRI data processing system based on detection of brain functional network components |
| CN102973279A (en)* | 2012-12-18 | 2013-03-20 | 哈尔滨工业大学 | Near-infrared brain-machine interface signal detection method integrating independent component analysis and least square method |
| CN104207776A (en)* | 2014-08-22 | 2014-12-17 | 南昌大学 | Comprehensive magnetic resonance imaging device and method |
| CN104323776A (en)* | 2014-10-23 | 2015-02-04 | 中国科学院深圳先进技术研究院 | Brain function magnetic resonance imaging method and system |
| CN104571533A (en)* | 2015-02-10 | 2015-04-29 | 北京理工大学 | Device and method based on brain-computer interface technology |
| CN105069307A (en)* | 2015-08-19 | 2015-11-18 | 大连理工大学 | Multi-subject fMRI data analysis method combining ICA and shift invariant CPD |
| CN105816170A (en)* | 2016-05-10 | 2016-08-03 | 广东省医疗器械研究所 | Wearable NIRS-EEG based schizophrenia early detection evaluation system |
| CN106793971A (en)* | 2014-09-17 | 2017-05-31 | 株式会社日立制作所 | MR imaging apparatus |
| CN106940803A (en)* | 2017-02-17 | 2017-07-11 | 平安科技(深圳)有限公司 | Correlated variables recognition methods and device |
| CN109830286A (en)* | 2019-02-13 | 2019-05-31 | 四川大学 | Brain function magnetic resonance code energy imaging method based on nonparametric statistics |
| CN115825831A (en)* | 2022-12-30 | 2023-03-21 | 江苏力磁医疗设备有限公司 | Magnetic resonance diffusion weighted imaging method and magnetic resonance imaging system for infants |
| CN116523857A (en)* | 2023-04-21 | 2023-08-01 | 首都医科大学附属北京友谊医院 | Hearing state prediction device and method based on diffusion tensor image |
Families Citing this family (25)
| Publication number | Priority date | Publication date | Assignee | Title |
|---|---|---|---|---|
| WO2009146388A1 (en) | 2008-05-28 | 2009-12-03 | The Trustees Of Columbia University In The City Of New York | Voxel-based methods for assessing subjects using positron emission tomography |
| WO2010048438A1 (en)* | 2008-10-22 | 2010-04-29 | The Trustees Of Columbia University In The City Of New York | Images of language-sensitive neurocircuitry as a diagnostic for autism |
| US8666475B2 (en) | 2008-10-22 | 2014-03-04 | The Trustees Of Columbia University In The City Of New York | Images of language-sensitive neurocircuitry as a diagnostic for autism |
| US8467585B2 (en)* | 2010-10-21 | 2013-06-18 | Genenal Electric Company | Methods and apparatus to analyze computed tomography scan data |
| US20120163689A1 (en)* | 2010-12-28 | 2012-06-28 | Boettger Joachim | Method and device for visualizing human or animal brain segments |
| KR101401969B1 (en)* | 2013-02-20 | 2014-06-30 | 한양대학교 산학협력단 | The method and apparatus for obtaining nerve fiber structure information of a target object using a mri system |
| JP6707330B2 (en)* | 2015-09-10 | 2020-06-10 | キヤノンメディカルシステムズ株式会社 | Image processing apparatus and magnetic resonance imaging apparatus |
| TWI639830B (en)* | 2017-03-17 | 2018-11-01 | 長庚大學 | Method for identifying neurological diseases using magnetic resonance imaging images |
| TWI651688B (en)* | 2017-03-17 | 2019-02-21 | 長庚大學 | Method for predicting clinical severity of neurological diseases using magnetic resonance imaging images |
| US11723579B2 (en) | 2017-09-19 | 2023-08-15 | Neuroenhancement Lab, LLC | Method and apparatus for neuroenhancement |
| US11717686B2 (en) | 2017-12-04 | 2023-08-08 | Neuroenhancement Lab, LLC | Method and apparatus for neuroenhancement to facilitate learning and performance |
| US12280219B2 (en) | 2017-12-31 | 2025-04-22 | NeuroLight, Inc. | Method and apparatus for neuroenhancement to enhance emotional response |
| US11273283B2 (en) | 2017-12-31 | 2022-03-15 | Neuroenhancement Lab, LLC | Method and apparatus for neuroenhancement to enhance emotional response |
| US11364361B2 (en) | 2018-04-20 | 2022-06-21 | Neuroenhancement Lab, LLC | System and method for inducing sleep by transplanting mental states |
| EP3581090A1 (en)* | 2018-06-11 | 2019-12-18 | Koninklijke Philips N.V. | Electrical properties tomography mapping of conductivity changes |
| EP3849410A4 (en) | 2018-09-14 | 2022-11-02 | Neuroenhancement Lab, LLC | SLEEP ENHANCEMENT SYSTEM AND METHOD |
| EP3657393A1 (en)* | 2018-11-20 | 2020-05-27 | Koninklijke Philips N.V. | Determination of a further processing location in magnetic resonance imaging |
| JP7321703B2 (en)* | 2018-12-19 | 2023-08-07 | 富士フイルムヘルスケア株式会社 | Image processing device and magnetic resonance imaging device |
| US11786694B2 (en) | 2019-05-24 | 2023-10-17 | NeuroLight, Inc. | Device, method, and app for facilitating sleep |
| GB201913481D0 (en)* | 2019-09-18 | 2019-10-30 | Institute Of Cancer Res Royal Cancer Hospital | Diffusion-weighted magnetic resonance imaging |
| CN111081351B (en)* | 2019-12-02 | 2024-02-20 | 北京优脑银河科技有限公司 | Brain functional map drawing method and system |
| US11733332B2 (en) | 2019-12-09 | 2023-08-22 | Nous Imaging, Inc. | Systems and method of precision functional mapping-guided interventional planning |
| CN111753947B (en)* | 2020-06-08 | 2024-05-03 | 深圳大学 | Resting state brain network construction method, device, equipment and computer storage medium |
| US11151456B1 (en) | 2021-01-08 | 2021-10-19 | Omniscient Neurotechnology Pty Limited | Predicting brain data using machine learning models |
| US11666266B2 (en)* | 2021-10-05 | 2023-06-06 | Omniscient Neurotechnology Pty Limited | Source localization of EEG signals |
Family Cites Families (4)
| Publication number | Priority date | Publication date | Assignee | Title |
|---|---|---|---|---|
| JPH0947438A (en)* | 1995-08-07 | 1997-02-18 | Hitachi Ltd | Activation area identification method |
| JP2004081657A (en) | 2002-08-28 | 2004-03-18 | Ge Medical Systems Global Technology Co Llc | Method for extracting fibrous image, image processing device, and magnetic resonance imaging systems |
| US7627370B2 (en)* | 2004-10-20 | 2009-12-01 | Marks Donald H | Brain function decoding process and system |
| US7894903B2 (en)* | 2005-03-24 | 2011-02-22 | Michael Sasha John | Systems and methods for treating disorders of the central nervous system by modulation of brain networks |
- 2006
- 2006-10-06USUS12/089,855patent/US8059879B2/enactiveActive
- 2006-10-06JPJP2007539917Apatent/JP4308871B2/enactiveActive
- 2006-10-06EPEP06811405.7Apatent/EP1946701B1/enactiveActive
- 2006-10-06CNCN2006800380625Apatent/CN101287410B/enactiveActive
- 2006-10-06KRKR1020087011215Apatent/KR100971936B1/enactiveActive
- 2006-10-06WOPCT/JP2006/320078patent/WO2007043462A1/enactiveApplication Filing
Cited By (21)
| Publication number | Priority date | Publication date | Assignee | Title |
|---|---|---|---|---|
| CN101912263A (en)* | 2010-09-14 | 2010-12-15 | 北京师范大学 | Real-time fMRI data processing system based on detection of brain functional network components |
| CN102973279A (en)* | 2012-12-18 | 2013-03-20 | 哈尔滨工业大学 | Near-infrared brain-machine interface signal detection method integrating independent component analysis and least square method |
| CN102973279B (en)* | 2012-12-18 | 2014-09-17 | 哈尔滨工业大学 | Near-infrared brain-machine interface signal detection method integrating independent component analysis |
| CN104207776A (en)* | 2014-08-22 | 2014-12-17 | 南昌大学 | Comprehensive magnetic resonance imaging device and method |
| CN106793971A (en)* | 2014-09-17 | 2017-05-31 | 株式会社日立制作所 | MR imaging apparatus |
| CN104323776A (en)* | 2014-10-23 | 2015-02-04 | 中国科学院深圳先进技术研究院 | Brain function magnetic resonance imaging method and system |
| CN104571533B (en)* | 2015-02-10 | 2018-03-13 | 北京理工大学 | A kind of apparatus and method based on brain-computer interface technology |
| CN104571533A (en)* | 2015-02-10 | 2015-04-29 | 北京理工大学 | Device and method based on brain-computer interface technology |
| CN105069307A (en)* | 2015-08-19 | 2015-11-18 | 大连理工大学 | Multi-subject fMRI data analysis method combining ICA and shift invariant CPD |
| CN105069307B (en)* | 2015-08-19 | 2018-04-10 | 大连理工大学 | A kind of combination independent component analysis and the more subject functional magnetic resonance imaging data analysis methods for moving constant specification Multidimensional decomposition technique |
| CN105816170B (en)* | 2016-05-10 | 2019-03-01 | 广东省医疗器械研究所 | Schizophrenia early detection assessment system based on wearable NIRS-EEG |
| CN105816170A (en)* | 2016-05-10 | 2016-08-03 | 广东省医疗器械研究所 | Wearable NIRS-EEG based schizophrenia early detection evaluation system |
| CN106940803A (en)* | 2017-02-17 | 2017-07-11 | 平安科技(深圳)有限公司 | Correlated variables recognition methods and device |
| CN106940803B (en)* | 2017-02-17 | 2018-04-17 | 平安科技(深圳)有限公司 | Correlated variables recognition methods and device |
| CN109830286A (en)* | 2019-02-13 | 2019-05-31 | 四川大学 | Brain function magnetic resonance code energy imaging method based on nonparametric statistics |
| CN109830286B (en)* | 2019-02-13 | 2022-09-30 | 四川大学 | Brain function magnetic resonance encoding energy imaging method based on nonparametric statistics |
| CN115825831A (en)* | 2022-12-30 | 2023-03-21 | 江苏力磁医疗设备有限公司 | Magnetic resonance diffusion weighted imaging method and magnetic resonance imaging system for infants |
| CN115825831B (en)* | 2022-12-30 | 2025-07-01 | 江苏力磁医疗设备有限公司 | Magnetic resonance diffusion weighted imaging method and magnetic resonance imaging system for infants and young children |
| CN116523857A (en)* | 2023-04-21 | 2023-08-01 | 首都医科大学附属北京友谊医院 | Hearing state prediction device and method based on diffusion tensor image |
| CN116523857B (en)* | 2023-04-21 | 2023-12-26 | 首都医科大学附属北京友谊医院 | Hearing state prediction device and method based on diffusion tensor image |
| US12183002B2 (en) | 2023-04-21 | 2024-12-31 | Beijing Friendship Hospital, Capital Medical University | Hearing state prediction apparatus and method based on diffusion tensor image |
Also Published As
| Publication number | Publication date |
|---|---|
| KR20080058475A (en) | 2008-06-25 |
| CN101287410B (en) | 2013-09-11 |
| US20090279762A1 (en) | 2009-11-12 |
| JPWO2007043462A1 (en) | 2009-04-16 |
| EP1946701B1 (en) | 2013-08-21 |
| KR100971936B1 (en) | 2010-07-23 |
| US8059879B2 (en) | 2011-11-15 |
| WO2007043462A1 (en) | 2007-04-19 |
| EP1946701A4 (en) | 2009-11-18 |
| JP4308871B2 (en) | 2009-08-05 |
| EP1946701A1 (en) | 2008-07-23 |
Similar Documents
| Publication | Publication Date | Title |
|---|---|---|
| CN101287410B (en) | Brain function analysis method and brain function analysis device | |
| Blezek et al. | Atlas stratification | |
| Mokhtari et al. | Decoding brain states using backward edge elimination and graph kernels in fMRI connectivity networks | |
| US10736538B2 (en) | Method and computer differentiating correlation patterns in functional magnetic resonance imaging | |
| CN112233086A (en) | Method and device for classification and identification of fMRI data based on functional connectivity of brain regions | |
| CN101706561A (en) | Clustering method for functional magnetic resonance images | |
| CN117612735A (en) | Structure-constrained white matter function network construction method and system | |
| US10789713B2 (en) | Symplectomorphic image registration | |
| Nguyen et al. | Morphological component analysis of functional mri brain networks | |
| Li et al. | Global PDF-based temporal non-local means filtering reveals individual differences in brain connectivity | |
| Yang et al. | Functional clustering of whole brain white matter fibers | |
| Harrison et al. | Graph-partitioned spatial priors for functional magnetic resonance images | |
| Ji et al. | MR image segmentation and bias field estimation using coherent local and global intensity clustering | |
| Tabelow et al. | Accurate localization of brain activity in presurgical fMRI by structure adaptive smoothing | |
| Calhoun et al. | ICA for fusion of brain imaging data | |
| Hallgrímsson et al. | Spatial coherence of oriented white matter microstructure: Applications to white matter regions associated with genetic similarity | |
| Khademi | Medical image processing techniques for the objective quantification of pathology in magnetic resonance images of the brain | |
| Polzehl et al. | Structural adaptive smoothing: Principles and applications in imaging | |
| Liu et al. | Spatial regularization of functional connectivity using high-dimensional markov random fields | |
| Shams et al. | Multisubject activation detection in fMRI by testing correlation of data with a signal subspace | |
| Parmar | Machine learning in functional magnetic resonance neuroimaging analysis | |
| Khademi et al. | Accurate pathology segmentation in FLAIR MRI for robust shape characterization | |
| Clement | Analysis techniques for diffusion tensor imaging data | |
| Radwan et al. | A comparison of fMRI presurgical mapping techniques with intraoperative brain mapping-based validation | |
| Tripoliti et al. | Recent developments in computer methods for fMRI data processing |
Legal Events
| Date | Code | Title | Description |
|---|---|---|---|
| C06 | Publication | ||
| PB01 | Publication | ||
| C10 | Entry into substantive examination | ||
| SE01 | Entry into force of request for substantive examination | ||
| C14 | Grant of patent or utility model | ||
| GR01 | Patent grant |