CN101031796A - System and method for producing chemical or biochemical signals - Google Patents
System and method for producing chemical or biochemical signalsDownload PDFInfo
- Publication number
- CN101031796A CN101031796ACNA2005800251992ACN200580025199ACN101031796ACN 101031796 ACN101031796 ACN 101031796ACN A2005800251992 ACNA2005800251992 ACN A2005800251992ACN 200580025199 ACN200580025199 ACN 200580025199ACN 101031796 ACN101031796 ACN 101031796A
- Authority
- CN
- China
- Prior art keywords
- signal
- noise
- sample
- time
- domain signal
- Prior art date
- Legal status (The legal status is an assumption and is not a legal conclusion. Google has not performed a legal analysis and makes no representation as to the accuracy of the status listed.)
- Granted
Links
Images


Classifications
- G—PHYSICS
- G01—MEASURING; TESTING
- G01N—INVESTIGATING OR ANALYSING MATERIALS BY DETERMINING THEIR CHEMICAL OR PHYSICAL PROPERTIES
- G01N37/00—Details not covered by any other group of this subclass
- G01N37/005—Measurement methods not based on established scientific theories
- A—HUMAN NECESSITIES
- A61—MEDICAL OR VETERINARY SCIENCE; HYGIENE
- A61P—SPECIFIC THERAPEUTIC ACTIVITY OF CHEMICAL COMPOUNDS OR MEDICINAL PREPARATIONS
- A61P35/00—Antineoplastic agents
- A—HUMAN NECESSITIES
- A61—MEDICAL OR VETERINARY SCIENCE; HYGIENE
- A61P—SPECIFIC THERAPEUTIC ACTIVITY OF CHEMICAL COMPOUNDS OR MEDICINAL PREPARATIONS
- A61P43/00—Drugs for specific purposes, not provided for in groups A61P1/00-A61P41/00
- G—PHYSICS
- G01—MEASURING; TESTING
- G01F—MEASURING VOLUME, VOLUME FLOW, MASS FLOW OR LIQUID LEVEL; METERING BY VOLUME
- G01F1/00—Measuring the volume flow or mass flow of fluid or fluent solid material wherein the fluid passes through a meter in a continuous flow
- G01F1/66—Measuring the volume flow or mass flow of fluid or fluent solid material wherein the fluid passes through a meter in a continuous flow by measuring frequency, phase shift or propagation time of electromagnetic or other waves, e.g. using ultrasonic flowmeters
- G—PHYSICS
- G01—MEASURING; TESTING
- G01F—MEASURING VOLUME, VOLUME FLOW, MASS FLOW OR LIQUID LEVEL; METERING BY VOLUME
- G01F1/00—Measuring the volume flow or mass flow of fluid or fluent solid material wherein the fluid passes through a meter in a continuous flow
- G01F1/56—Measuring the volume flow or mass flow of fluid or fluent solid material wherein the fluid passes through a meter in a continuous flow by using electric or magnetic effects
Landscapes
- Health & Medical Sciences (AREA)
- Physics & Mathematics (AREA)
- Life Sciences & Earth Sciences (AREA)
- Chemical & Material Sciences (AREA)
- General Health & Medical Sciences (AREA)
- General Physics & Mathematics (AREA)
- Analytical Chemistry (AREA)
- Biochemistry (AREA)
- Immunology (AREA)
- Pathology (AREA)
- Animal Behavior & Ethology (AREA)
- General Chemical & Material Sciences (AREA)
- Medicinal Chemistry (AREA)
- Nuclear Medicine, Radiotherapy & Molecular Imaging (AREA)
- Organic Chemistry (AREA)
- Pharmacology & Pharmacy (AREA)
- Chemical Kinetics & Catalysis (AREA)
- Public Health (AREA)
- Veterinary Medicine (AREA)
- Electromagnetism (AREA)
- Fluid Mechanics (AREA)
- Engineering & Computer Science (AREA)
- Bioinformatics & Cheminformatics (AREA)
- Investigating Or Analyzing Materials By The Use Of Magnetic Means (AREA)
- Measuring Or Testing Involving Enzymes Or Micro-Organisms (AREA)
- Investigating Or Analysing Biological Materials (AREA)
- Measurement And Recording Of Electrical Phenomena And Electrical Characteristics Of The Living Body (AREA)
- Measurement Of The Respiration, Hearing Ability, Form, And Blood Characteristics Of Living Organisms (AREA)
- Medicines That Contain Protein Lipid Enzymes And Other Medicines (AREA)
- Pharmaceuticals Containing Other Organic And Inorganic Compounds (AREA)
- Apparatus Associated With Microorganisms And Enzymes (AREA)
- Measuring Magnetic Variables (AREA)
Abstract
Translated fromChineseDescription
Translated fromChinese技术领域technical field
本发明涉及用于产生化学或生物信号的装置和效应,该化学或生物信号能产生一种或多种化学或生物效应剂的作用。The present invention relates to devices and effects for producing chemical or biological signals capable of producing the action of one or more chemical or biological effectors.
背景技术Background technique
在化学和生化领域中可接受的范例之一是化学或生化效应剂,例如分子,通过多种物理化学力,例如离子、电荷或者分散力,或者通过电荷诱导的键的共价的分裂或者形成,与靶系统相互作用。这些作用力可以包括在效应剂或靶系统中的振动或旋转能模式。One of the accepted paradigms in the fields of chemistry and biochemistry is the covalent cleavage or formation of chemical or biochemical effectors, such as molecules, by various physicochemical forces, such as ionic, charge, or dispersion forces, or by charge-induced bonds , to interact with the target system. These forces can include vibrational or rotational energy modes in the effector or target system.
因此,例如,当药物分子被施予生物体时,药物的作用包括其与目标成分的相互作用,例如膜,酶或者核酸成分,从而产生或者触发一连串药物的关联反应。同样的,如果将酶加入至生物底物中,该酶能够通过一些类型的空间配位与底物相互作用,系统中存在的能量模式被转换成活化状态或激活状态,这导致共价键的分裂或形成。Thus, for example, when a drug molecule is administered to an organism, the action of the drug includes its interaction with target components, such as membranes, enzymes or nucleic acid components, thereby generating or triggering a cascade of drug-related reactions. Likewise, if an enzyme is added to a biological substrate, the enzyme is able to interact with the substrate through some type of steric coordination, and the energy mode present in the system is converted into an active or active state, which results in a covalent Split or form.
这个范例的显而易见的必然结果是在效应物-靶系统中,对目标环境中的效应剂的需求。可是,不知道或者不了解的是该需求是否与效应物的实际存在有关,或者至少对于某些效应物功能,这是否可以归因于表征效应物的能量模式的存在。如果效应物功能可以通过某些特有的能量模式,至少部分地被模拟,它可能通过使系统暴露于表征效应物的某些模式而在靶系统中“模拟”效应剂的作用。如果这样,自然会出现以下问题:什么效应物-分子能量模式是有效的,它们怎样可以转换成可测量的信号形式,以及这些信号怎样用来作用于靶系统,更确切地说,至少模仿在靶系统中的分子的某些效应物功能。An obvious corollary of this paradigm is the requirement for an effector in the target environment in an effector-target system. What is not known or understood, however, is whether this requirement is related to the actual presence of effectors, or at least for some effector functions, whether this can be attributed to the presence of energy patterns that characterize effectors. If effector function can be mimicked, at least in part, by certain characteristic energy patterns, it is possible to "mimic" the effector's action in a target system by exposing the system to certain patterns that characterize the effector. If so, the following questions naturally arise: what effector-molecular energy patterns are available, how they can be converted into measurable signal forms, and how these signals can be used to act on target systems, more precisely, to at least mimic the Certain effector functions of molecules in target systems.
通过将靶系统暴露于特征性效应物-分子信号来实现效应物-分子功能,而不需要效应剂的实际存在,这种可能性有许多重要的应用。通过将生物体暴露于药物特异性信号,可以替代通过使用药物治疗生物体,能实现同样的作用。在纳米制造领域,现在可以通过将表征多化合价效应物分子的信号引入该组装系统来催化和促进自组装模式,所述效应物分子能够促进需要的自组装模式。The possibility to achieve effector-molecule functions by exposing target systems to characteristic effector-molecule signals without requiring the physical presence of effectors has many important applications. Instead of treating the organism with a drug, the same effect can be achieved by exposing the organism to a drug-specific signal. In the field of nanofabrication, it is now possible to catalyze and promote self-assembly modes by introducing into the assembly system signals characterizing multivalent effector molecules capable of promoting the desired self-assembly modes.
本发明描述了通过表征效应物分子的低频信号的转换,在已知对效应物应答的系统中获得效应物特异性结果的装置和方法。The present invention describes devices and methods for obtaining effector-specific results in systems known to respond to effectors through the conversion of low frequency signals that characterize effector molecules.
发明内容Contents of the invention
一方面,本发明包括一种化学或生化制剂在对该制剂产生应答的系统中产生作用的方法。实际的方法中,该系统被放置在电磁转换器的磁场区域中,将低频,时域信号施加于电磁转换器,该信号的特征是在谱分析中呈现大量制剂特异性谱峰。这些谱峰从通过以下方法生成的低频,时域信号的频谱中识别:(i)将这种化学或生化制剂放置在兼有磁屏蔽和电磁屏蔽的容器中,并且(ii)在时域信号谱线中有效产生这样可识别的谱峰的噪声水平,将噪声注入样本的同时,记录样本中的低频,时间相关信号。该样本暴露于转换器产生的磁场,以所施加的信号功率,并且持续足以对该系统产生制剂特异性效应的时间周期。In one aspect, the invention includes a method of producing an effect of a chemical or biochemical agent in a system responsive to the agent. In a practical approach, the system is placed in the magnetic field region of an electromagnetic transducer to which a low-frequency, time-domain signal is applied, which is characterized by a large number of formulation-specific peaks in spectral analysis. These spectral peaks are identified from the spectrum of a low-frequency, time-domain signal generated by (i) placing the chemical or biochemical agent in a container that is both magnetically and electromagnetically shielded, and (ii) in the time-domain signal The level of noise in the spectral line that effectively produces such identifiable spectral peaks, injects noise into the sample while simultaneously recording the low-frequency, time-correlated signal in the sample. The sample is exposed to the magnetic field generated by the transducer, at the applied signal power, and for a period of time sufficient to produce an agent-specific effect on the system.
在一个普通的实施例中,施加于转换器的时域信号通过以下步骤产生:(i)将这样的化学或生化制剂放置于兼有磁屏蔽和电屏蔽的容器中,并且(ii)在时域信号谱线中有效产生这样可识别的谱峰的噪声水平,将噪声注入样本的同时,记录样本中的低频时间相关信号。该方法中的步骤(ii)可以包括步骤:(a)在给定的噪声振幅将噪声注入样本;(b)记录由叠加在注入噪声上的样本源辐射组成的电磁时域信号,以及(c)在选定的噪声水平范围内的多个噪声水平,重复步骤(a)和(b),以及(d)分析通过产生时域信号的谱线而生成的多个时域信号,并且基于谱线中的信息,识别最优的制剂特异性时域信号。In one general embodiment, the time-domain signal applied to the transducer is generated by (i) placing such chemical or biochemical agent in a container that is both magnetically and electrically shielded, and (ii) at time To effectively generate such identifiable spectral peaks in the spectral line of the domain signal, the noise level is injected into the sample while simultaneously recording the low frequency time-correlated signal in the sample. Step (ii) in the method may comprise the steps of: (a) injecting noise into the sample at a given noise amplitude; (b) recording an electromagnetic time-domain signal consisting of sample source radiation superimposed on the injected noise, and (c ) multiple noise levels within the selected noise level range, repeat steps (a) and (b), and (d) analyze multiple time-domain signals generated by generating spectral lines of the time-domain signal, and based on the spectral The information in the line identifies the optimal formulation-specific time-domain signal.
以如下步骤将噪声注入样本的噪声源(iia)包括功率可调的高斯噪声发生器和Helmholz线圈,并且其从噪声发生器接收直到1伏特范围内的所选噪声输出信号。The noise source (iia) that injects noise into the sample in the following steps comprises a power-tunable Gaussian noise generator and a Helmholz coil, and it receives a selected noise output signal from the noise generator up to a range of 1 volt.
分析步骤(d)可以用以下步骤之一实现:Analysis step (d) can be achieved by one of the following steps:
(i)生成直方图,其对于dc至8khz的范围内的所选频率范围上的每一个事件箱(event bin)f,示出每箱(bin)中的事件计数的数量,与超过给定阈值的箱的数量有关的得分;并且根据该得分选择时域信号,其中f是对时域信号采样的、分配给直方图的采样率。(i) Generate a histogram showing, for each event bin (event bin) f over a selected frequency range in the range dc to 8khz, the number of event counts in each bin (event count) compared to more than a given A score related to the number of bins of the threshold; and a time-domain signal is selected according to the score, where f is the sampling rate assigned to the histogram for sampling the time-domain signal.
(ii)使时域信号自相关,在dc至8khz范围之内的所选的频率范围内,生成自相关信号的FFT(傅立叶变换),将与超过平均噪声值的峰的数量相关的得分分配给FFT信号,并且根据该得分选择时域信号。并且(ii) Autocorrelate the time domain signal, generate an FFT (Fourier Transform) of the autocorrelated signal over a selected frequency range in the range dc to 8khz, assign a score related to the number of peaks above the average noise value The FFT signal is given, and the time domain signal is selected based on this score. and
(iii)计算多个定义的时间段中的每个上的时域信号的一系列傅立叶谱,在所选的在dc和8kHz之间的频率范围内,对傅立叶谱求平均;将与超过平均噪声值的峰的数量相关的得分分配给平均FFT信号,并且根据该得分选择时域信号。(iii) Compute a series of Fourier spectra of the time-domain signal over each of a plurality of defined time periods, averaging the Fourier spectra over a selected frequency range between dc and 8 kHz; A score related to the number of peaks of the noise value is assigned to the averaged FFT signal, and the time domain signal is selected according to this score.
使用与超导量子干涉仪(Squid)耦合的梯度计可以实现记录信号,所述注入包括将噪声注入梯度计。Recording the signal can be achieved using a gradiometer coupled to a superconducting quantum interferometer (Squid), the injection comprising injecting noise into the gradiometer.
系统可应答的制剂可以是一种配体,该配体能够通过配体特异性非共价相互作用,在生物学系统中与抗-配体细胞靶产生相互作用。A system-responsive agent may be a ligand capable of interacting with an anti-ligand cellular target in a biological system through ligand-specific non-covalent interactions.
为使基因或基因簇上调或下调,该制剂可以是能够与基因启动子相互作用的化合物,并且低频时域信号通过记录该化合物的低频时域信号而产生。典型的化合物是l(+)阿拉伯糖,其中基因包括细菌lac操纵子。To up-regulate or down-regulate a gene or gene cluster, the agent may be a compound capable of interacting with a gene promoter, and the low frequency time domain signal is generated by recording the low frequency time domain signal of the compound. A typical compound is l(+)arabinose, where the gene includes the bacterial lac operon.
为了产生可测量的生物学系统的抑制或生长以及生存,该制剂可以是能够与生物学系统生长和生存所需要的酶相互作用的化合物,以竞争性抑制所述酶。低频时域信号可以通过记录化合物的低频,时域信号产生。一种典型的制剂是甘胺酸磷酸盐(glyphosphate),并且靶酶为植株中的5-烯醇式丙酮莽草酸酯-3-磷酸(EPSP)合酶。另一个典型的制剂是phepropeptin D,靶酶是与真核细胞内的蛋白体结合的蛋白水解酶。To produce measurable inhibition or growth and survival of the biological system, the agent may be a compound capable of interacting with an enzyme required for the growth and survival of the biological system to competitively inhibit said enzyme. A low-frequency time-domain signal can be generated by recording the low-frequency, time-domain signal of a compound. A typical agent is glycine phosphate (glyphosphate), and the target enzyme is 5-enolpyruvylshikimate-3-phosphate (EPSP) synthase in plants. Another typical agent is phepropeptin D, which targets proteolytic enzymes that bind to proteosomes in eukaryotic cells.
在治疗哺乳动物癌症的使用中,该制剂可以从其中之一选择(a)微管蛋白结合制剂,其中细胞靶是染色体微管纺锤体;(b)蒽环类抗生素(anthracycline),其细胞靶为双链DNA;(c)拓扑异构酶抑制剂,其中细胞靶为拓扑异构酶;(d)抗代谢剂,其细胞靶为细胞代谢所必需的酶;(e)免疫抑制素,其细胞靶为免疫应答细胞;以及(f)抑癌蛋白,其靶为细胞核内的DNA复制结构。典型的微管蛋白结合制剂为紫杉醇或者紫杉醇类似物。典型的抑癌因子为p53。For use in the treatment of mammalian cancers, the agent may be selected from one of (a) tubulin-binding agents, wherein the cellular target is the chromosomal microtubule spindle; (b) anthracyclines, whose cellular target (c) topoisomerase inhibitors, wherein the cellular target is topoisomerase; (d) antimetabolites, whose cellular targets are enzymes necessary for cell metabolism; (e) immunosuppressants, whose The cellular target is an immune response cell; and (f) a tumor suppressor protein, which targets a DNA replication structure within the nucleus. A typical tubulin-binding agent is paclitaxel or a paclitaxel analog. A typical tumor suppressor is p53.
电磁转换器可以包括定义开口内部的线圈绕组,其中样本被放置在绕组的开口内部中。在另一个具体实施例中,转换器包括将被植入生物学系统的可植入线圈,例如,邻近的脉管区域。The electromagnetic transducer may comprise a coil winding defining an open interior, wherein the sample is placed in the open interior of the winding. In another specific embodiment, the transducer comprises an implantable coil to be implanted in a biological system, eg, an adjacent vascular region.
可以选择在有效产生所选择的磁场强度的功率水平施加MIDS信号,该磁场强度在1-200mG(毫高斯)范围之内,优选10-100mG,更优选30-80mG。暴露可以通过间歇的MIDS信号的1小时或更多的周期的暴露来实现,例如在治疗期暴露12小时,不暴露12小时。The MIDS signal may optionally be applied at a power level effective to produce a selected magnetic field strength in the range of 1-200 mG (milligauss), preferably 10-100 mG, more preferably 30-80 mG. Exposure may be achieved by periodic exposure to MIDS signals of one hour or more, for example 12 hours of exposure and 12 hours of non-exposure during the treatment period.
另一方面,本发明包括一种用于产生化学或生化制剂对制剂系统的作用的装置,所述系统应答于这种制剂。该装置包括(a)用于存储低频时域信号的存储设备,该信号的特征是在谱分析中呈现大量制剂特异性谱峰,其中制剂特异性谱峰从以下方法产生的低频时域信号的谱线中识别:In another aspect, the invention includes a device for producing the effect of a chemical or biochemical agent on an agent system that is responsive to such agent. The apparatus comprises (a) a storage device for storing a low-frequency time-domain signal characterized by presenting a plurality of formulation-specific spectral peaks in spectral analysis, wherein the formulation-specific spectral peaks are derived from the low-frequency time-domain signal generated by Identification in the spectral line:
(i)将这样的化学或生化制剂放置于具有磁屏蔽和电磁屏蔽的容器中,并且(i) place such chemical or biochemical agent in a magnetically and electromagnetically shielded container, and
(ii)当在时域信号谱线中有效产生可识别的谱峰的噪声水平将噪声注入样本的同时,记录来自样本的低频时域信号,并且(ii) recording a low-frequency time-domain signal from the sample while injecting noise into the sample at a noise level effective to produce identifiable spectral peaks in the time-domain signal spectral lines, and
装置中还包括(b)电磁转换器,其定义了活性磁场(active magnetic field)的区域,该活性磁场在电磁信号被施加于转换器并且样本被放置在其中的时候产生,以及(c)放大器有效地将存储设备连接到转换器上,以将信号施加给转换器,以所施加的信号功率并且持续一段时间周期,该时间周期足以在系统中对该系统产生制剂特异性效应,这样放置在转换器的活性磁场区域内。Also included in the apparatus are (b) an electromagnetic transducer defining a region of an active magnetic field generated when an electromagnetic signal is applied to the transducer and a sample is placed therein, and (c) an amplifier Effectively coupling the storage device to the transducer to apply a signal to the transducer at the power of the signal applied and for a period of time sufficient to produce an agent-specific effect in the system on the system such that placed in within the active magnetic field area of the converter.
电磁转换器可以包括线圈绕组和适于将样本放入其中的开口内部。在一个实施例中,转换器是具有一对对齐的电磁线圈的Helmholz线圈,这一对电磁线圈定义了它们中间的暴露的位置,其中样本,例如对象,被放置在该位置中。在另一个实施例中,转换器包括可植入的线圈。The electromagnetic transducer may include a coil winding and an open interior adapted to place a sample therein. In one embodiment, the transducer is a Helmholz coil with a pair of aligned electromagnetic coils defining an exposed location between them in which a sample, such as an object, is placed. In another embodiment, the transducer includes an implantable coil.
存储设备可以在远离转换器和放大器的位置,并且信号从远离的位置传送到转换器。The storage device may be located remotely from the converter and amplifier, and the signal is transmitted to the converter from the remote location.
根据另一个方面,提供了化学或生化活性制剂的低频时域信号,其特征是在谱分析中呈现大量制剂特异性谱峰,其中制剂特异性谱峰从以下方法产生的低频时域信号的谱线中识别:According to another aspect, there is provided a low-frequency time-domain signal of a chemically or biochemically active agent, characterized by presenting a large number of agent-specific spectral peaks in spectral analysis, wherein the agent-specific spectral peaks are derived from the spectrum of the low-frequency time-domain signal generated by In-line identification:
(i)将这样的化学或生化制剂放置于具有磁屏蔽和电磁屏蔽的容器中,并且(i) place such chemical or biochemical agent in a magnetically and electromagnetically shielded container, and
(ii)当在时域信号谱线中有效产生可识别的谱峰的噪声水平将噪声注入样本的同时,记录来自样本的低频时域信号。(ii) A low frequency time domain signal from the sample is recorded while noise is injected into the sample at a level of noise effective to produce a identifiable spectral peak in the time domain signal spectral line.
该信号本身可以通过以下步骤产生:The signal itself can be generated by the following steps:
(i)将这样的化学或生化制剂放置于具有磁屏蔽和电磁屏蔽的容器中,并且(i) place such chemical or biochemical agent in a magnetically and electromagnetically shielded container, and
(ii)当在时域信号谱线中有效产生可识别的谱峰的噪声水平将噪声注入样本的同时,记录来自样本的低频时域信号。以及(ii) A low frequency time domain signal from the sample is recorded while noise is injected into the sample at a level of noise effective to produce a identifiable spectral peak in the time domain signal spectral line. as well as
当将下述本发明的详细描述与附图结合起来阅读时,本发明的这些以及其他的目的和特征将有更完整的体现。These and other objects and features of the invention will more fully emerge from the following detailed description of the invention when read in conjunction with the accompanying drawings.
附图说明Description of drawings
图1是依据本发明的一个实施例形成的分子电磁信令检测装置的一个实施例的立体图;1 is a perspective view of an embodiment of a molecular electromagnetic signaling detection device formed according to an embodiment of the present invention;
图2是图1所示的法拉第笼及其内容物的放大的详图;以及Figure 2 is an enlarged detail view of the Faraday cage shown in Figure 1 and its contents; and
图3是图1和2中所示的衰减管之一的放大的横断面图;Figure 3 is an enlarged cross-sectional view of one of the attenuation tubes shown in Figures 1 and 2;
图4是图2所示的法拉第笼及其内容物的横断面图;Figure 4 is a cross-sectional view of the Faraday cage shown in Figure 2 and its contents;
图5是图1至图4所示的本发明的可选择的实施例的横断面图;Figure 5 is a cross-sectional view of an alternative embodiment of the present invention shown in Figures 1 to 4;
图6是这里所述的Helmholtz变压器的支撑线圈的框架的放大详图;Figure 6 is an enlarged detail view of the frame supporting the coils of the Helmholtz transformer described herein;
图7是可选择的电磁辐射检测系统的图;Figure 7 is a diagram of an optional electromagnetic radiation detection system;
图8是包括在上述附图的检测系统中的处理单元的图;Figure 8 is a diagram of a processing unit included in the detection system of the preceding figures;
图9是图8之外另一个可选择的处理单元的图;Fig. 9 is a diagram of another optional processing unit besides Fig. 8;
图10是本系统执行的信号检测和处理的流程图;Fig. 10 is the flowchart of the signal detection and processing carried out by this system;
图11A是第一个样本辐射的谱线;Figure 11A is the spectral line radiated by the first sample;
图11B是第二个样本辐射的谱线;Figure 11B is the spectral line radiated by the second sample;
图12A和12B是饱和NaCl样本在500-530Hz之间的谱区内的谱图,其通过对非相关的时域样本信号进行傅立叶变换(12A),并且对互相关的样本谱进行傅立叶变换而产生(12B);Figures 12A and 12B are spectrograms of saturated NaCl samples in the spectral region between 500-530 Hz obtained by Fourier transforming (12A) the uncorrelated time-domain sample signals and Fourier transforming the cross-correlated sample spectra generate(12B);
图13A和13B是烷基醚硫酸盐样本在500-530Hz之间的谱区中的谱图,其通过对非相关的时域样本信号进行傅立叶变换(13A),并且对互相关的样本谱进行傅立叶变换而产生(13B);Figures 13A and 13B are spectrograms of an alkyl ether sulfate sample in the spectral region between 500-530 Hz by Fourier transforming (13A) the uncorrelated time-domain sample signal and performing a cross-correlated sample spectrum Produced by Fourier transform (13B);
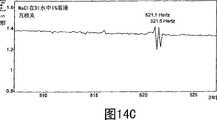
图14A-14F是样本去离子水(14A),饱和的NaCl溶液(14B),1%NaCl去离子水溶液(14C);饱和的NaBr样本(14D),烷基醚硫酸盐去离子水溶液(14E),以及无样本(14F)在500-530Hz之间的谱区中的谱线;Figures 14A-14F are sample deionized water (14A), saturated NaCl solution (14B), 1% NaCl deionized water solution (14C); saturated NaBr sample (14D), alkyl ether sulfate deionized water solution (14E) , and no-sample (14F) spectral lines in the spectral region between 500-530 Hz;
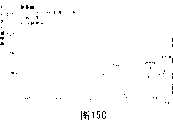
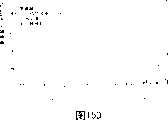
图15A-15F是氨基酸样本溶液1∶100wt每体积(15A)以及增大稀释到1∶10,000(15B),1∶1百万(15C),1∶1亿(15D),1∶1百亿(15E和15F),在500和535Hz之间的谱区中的谱线,其中图15A-15E中的频谱是通过50秒记录和40分钟相关而产生的,并且图15F中的频谱由12小时相关的4:25分记录生成;15A-15F are amino acid sample solution 1:100wt per volume (15A) and increased dilution to 1:10,000 (15B), 1:1 million (15C), 1:100 million (15D), 1:10 billion (15E and 15F), spectral lines in the spectral region between 500 and 535 Hz, where the spectra in Figures 15A-15E were generated by 50-second recordings and 40-minute correlations, and the spectra in Figure 15F were generated by 12-hour Related 4:25 minutes record generation;
图16是示意图,显示了分子电磁信令检测装置的可选择的实施例;Figure 16 is a schematic diagram showing an alternative embodiment of a molecular electromagnetic signaling detection device;
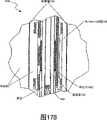
图17A是图16的可选择实施例的横断面图;Figure 17A is a cross-sectional view of the alternative embodiment of Figure 16;
图17B是图17A的部分放大图;Figure 17B is a partially enlarged view of Figure 17A;
图18是图17B的横断面等距视图;Figure 18 is a cross-sectional isometric view of Figure 17B;
图19是图9的可选择的处理单元的图;Figure 19 is a diagram of an optional processing unit of Figure 9;
图20显示了用于本发明直方图谱图方法的数据流的高级流程图;Figure 20 shows a high-level flow diagram of the data flow for the histogram-spectrogram method of the present invention;
图21是依据本发明生成谱图直方图的算法的流程图;以及Figure 21 is a flowchart of an algorithm for generating a spectrogram histogram according to the present invention; and
图22A-22D是取自四个不同的噪声功率水平的样本的频谱的直方图;22A-22D are histograms of spectra taken from samples at four different noise power levels;
图23A-23C是用于拍摄显示用于生成和显示谱图直方图的用户界面的电脑屏幕;23A-23C are photographs of computer screens showing a user interface for generating and displaying spectrogram histograms;
图24是根据本发明方法的第二实施例的用于识别最优时域信号的步骤的流程图;FIG. 24 is a flow chart of the steps for identifying an optimal time-domain signal according to a second embodiment of the method of the present invention;
图25A-25E显示了包含40%除草剂复合物的样本的时域信号部分(25A),来自图25A中的样本的自相关的时域信号的FFT,所述时域信号在噪声水平70.9-dbm(25B),74.8-dbm(25C和25D),以及78.3-dbm(25E)记录;Figures 25A-25E show the time-domain signal portion (25A) of a sample comprising 40% herbicide complex, FFT of the autocorrelated time-domain signal from the sample in Figure 25A at a noise level of 70.9- dbm(25B), 74.8-dbm(25C and 25D), and 78.3-dbm(25E) records;
图26是图25中样本的自相关得分和噪声设置的对比图;Fig. 26 is a comparison diagram of autocorrelation scores and noise settings of samples in Fig. 25;
图27,图24是根据本发明方法的第三实施例识别最优时域信号的步骤的流程图;Fig. 27 and Fig. 24 are flowcharts of the steps of identifying the optimal time-domain signal according to the third embodiment of the method of the present invention;
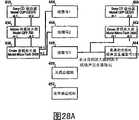
图28A显示了典型的转换试验中的转换仪器的布置;以及图28B和28C显示了典型的转换试验中使用的转换线圈和容器(28B);以及转换线圈在振动台上的布置(28C);Figure 28A shows the arrangement of the switching apparatus in a typical switching test; and Figures 28B and 28C show the switching coil and container (28B) used in a typical switching test; and the layout of the switching coil on the shaking table (28C);
图29A-29B显示了Helmholz线圈转换器中的磁场作为线圈(29A);螺管转换器(29B)和改良的螺管转换器(29C)之间的位置的函数的图;Figures 29A-29B show plots of the magnetic field in a Helmholz coil transducer as a function of position between the coil (29A); the solenoid transducer (29B) and the modified solenoid transducer (29C);
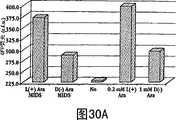
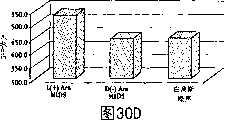
图30A-30E显示了AraL_(+)-可诱导绿色荧光蛋白在E线圈中对不同的刺激的应答,包括MIDS AraL(+)信号;Figures 30A-30E show AraL_(+)-inducible GFP responses to different stimuli in E-coils, including MIDS AraL(+) signals;
图31显示了应答不同刺激的茎长的箱式图,包括除草剂的MIDS信号(31A),茎细胞长的概率图(31B),以及同样实验中茎长的经验CDF(31C);Figure 31 shows a boxplot of stem length in response to different stimuli, including the MIDS signal of the herbicide (31A), a probability plot of stem cell length (31B), and the empirical CDF of stem length in the same experiment (31C);
图32A和32B是甜豌豆芽没有暴露(32A)和暴露(32B)于MIDS除草剂信号的照片;Figures 32A and 32B are photographs of sweet pea sprouts not exposed (32A) and exposed (32B) to the MIDS herbicide signal;
图33显示了不同的刺激对于茎长的影响,包括生长刺激物MIDS信号,表达为茎长应答刺激的箱式图;Figure 33 shows the effects of different stimuli on stem length, including the growth stimulator MIDS signal, expressed as a box plot of stem length response to stimuli;
图34是显示了用生化抑制剂或MIDS信号治疗1.5小时之后20S蛋白体活性的抑制(深色条)和治疗之后20小时化验的抑制(浅色条)的条状图;以及Figure 34 is a bar graph showing inhibition of 20S proteosome activity (dark bars) after 1.5 hours of treatment with biochemical inhibitors or MIDS signaling and inhibition of
图35A和35B在小鼠中显示了肿瘤重量变化的百分比,作为用肿瘤组织接种后天数的函数,小鼠以40或60mG,单独用赋形剂,紫杉醇,或紫杉醇MIDS信号治疗(Fig.35A);以及同样的4组动物的肿瘤重量变化的百分比(图35B)。Figures 35A and 35B show the percentage change in tumor weight as a function of days after inoculation with tumor tissue in mice treated with vehicle, paclitaxel alone, or paclitaxel MIDS signal at 40 or 60 mG (Fig. 35A ); and the percentage change in tumor weight for the same 4 groups of animals ( FIG. 35B ).
在所有特征部件或技术的表述中,参考标号中,第一次引入部件的附图标号是最显著的。In the expression of all characteristic components or techniques, among the reference numerals, the reference numerals of the components introduced for the first time are the most prominent.
具体实施方式Detailed ways
I.定义I. Definition
下列术语具有下述的定义除非另外指出:The following terms have the following definitions unless otherwise indicated:
“呈现分子转动(molecular rotation)的样本”是指样本材料,其可以是气体,液体或固体形式(固体金属除外)其中一个或多个分子化合物或原子离子组成或出现在呈现转动的样本中。"A sample exhibiting molecular rotation" means a sample material, which may be in gaseous, liquid, or solid form (other than solid metals) of which one or more molecular compounds or atomic ions consist of or are present in a sample exhibiting rotation.
“磁屏蔽”是指由于屏蔽材料的导磁性抑制或阻止磁通量的通过的屏蔽。"Magnetic shielding" means shielding that inhibits or prevents the passage of magnetic flux due to the magnetic permeability of the shielding material.
“电磁屏蔽”是指,例如,标准法拉第电磁屏蔽。"Electromagnetic shielding" means, for example, standard Faraday electromagnetic shielding.
“时域信号”或“时序信号”是指具有随着时间改变的瞬时信号特性的信号。A "time-domain signal" or "time-series signal" refers to a signal that has instantaneous signal characteristics that vary over time.
“样本源辐射”是指来自样本分子运动的磁通量的发射,例如磁场中分子偶极子的旋转。"Sample source radiation" refers to the emission of magnetic flux from the motion of sample molecules, such as the rotation of molecular dipoles in a magnetic field.
“高斯噪声”表示具有高斯功率分布的随机噪声。"Gaussian noise" means random noise with a Gaussian power distribution.
“稳定的高斯白噪声”表示没有可预报的将来的分量的随机高斯噪声。"Stable white Gaussian noise" means random Gaussian noise with no predictable future components.
“均匀噪声”表示具有恒定振幅的噪声。"Uniform noise" means noise with a constant amplitude.
“频域谱”是指时域信号的傅立叶频率曲线。"Frequency domain spectrum" refers to the Fourier frequency curve of a time domain signal.
“谱分量”是指在时域信号里的单一或重复的性质,它可以由频率,振幅,和/或相畴测量。典型的谱分量是指存在于频域中的信号。"Spectral component" refers to a single or repetitive property in a time-domain signal that can be measured by frequency, amplitude, and/or phase domain. Typical spectral components refer to signals that exist in the frequency domain.
“相似的样本”,参考第一样本,是指相同的样本或与第一样本具有基本相同样本成分的样本。A "similar sample", with reference to a first sample, means the same sample or a sample having substantially the same sample composition as the first sample.
“法拉第笼”是指由于不必要的电磁辐射而提供了至地面的电路径的电磁屏蔽结构,借此使电磁环境平静。A "Faraday cage" refers to an electromagnetic shielding structure that provides an electrical path to ground due to unwanted electromagnetic radiation, thereby calming the electromagnetic environment.
“谱特征得分”是指以制剂特异性谱峰的数量和/或振幅为基础的得分,所述数量和/或振幅通过在对已经由适当方法处理过的制剂或样本记录的时域信号中,观察可选择的低频范围,例如,DC到1kHz或DC到8kHz,所述例如在这里描述的三种方法中的一种,从而揭示制剂或样本特有的可辨认的谱特征。"Spectral feature score" means a score based on the number and/or amplitude of formulation-specific spectral peaks as measured in a time-domain signal recorded for a formulation or sample that has been processed by an appropriate method. , observing a selectable low frequency range, eg, DC to 1 kHz or DC to 8 kHz, such as one of the three methods described herein, thereby revealing identifiable spectral features specific to the formulation or sample.
“最优制剂特异性时域信号”是指具有最大值或接近最大值的谱特征得分的时域信号。"Optimal formulation-specific time-domain signal" refers to the time-domain signal with a spectral feature score at or near a maximum.
“MIDS”或“分子查询和数据系统”是指从样本记录的时域信号,且包含样本相关的在信号的谱分析中显而易见的谱峰。MIDS信号优选最优的或被增强,如下面详细描述。MIDS信号还可以是通过结合和/或过滤个体样本时域信号来构成,如在这里描述的。"MIDS" or "Molecular Interrogation and Data System(R) " refers to a time-domain signal recorded from a sample and containing sample-related spectral peaks evident in spectral analysis of the signal. The MIDS signal is preferably optimized or enhanced, as described in detail below. MIDS signals may also be constructed by combining and/or filtering individual sample time-domain signals, as described herein.
II.用于产生和处理低频时域信号的装置II. Apparatus for generating and processing low-frequency time-domain signals
在下面详细描述的是一种用于检测,处理,和呈现所关注的样本的低频电磁辐射或信号的系统和方法。在一种实施方式中,一种已知的白噪声或高斯噪声信号被引入至样本中。高斯噪声配置成容许来自样本的电磁辐射被信号检测系统充分检测到。检测的信号组在一起处理以确保重复率和统计关联性。所得到的辐射图案或频谱可以作为一种特殊的物质显示,储存,和/或识别。Described in detail below is a system and method for detecting, processing, and presenting low frequency electromagnetic radiation or signals of a sample of interest. In one embodiment, a known white or Gaussian noise signal is introduced into the samples. Gaussian noise is configured to allow electromagnetic radiation from the sample to be adequately detected by the signal detection system. Detected signal groups were processed together to ensure repeatability and statistical correlation. The resulting radiation pattern or spectrum can be displayed, stored, and/or identified as a particular substance.
下列描述提供了对本发明的完全理解的特定细节和实施本发明实施例的具体细节。然而,本领域技术人员将理解没有这些细节也可以实践本发明。在其它的情况中,公知的结构和功能没有在细节中显示或描述,以避免不必要的模糊对本发明实施方式的描述。The following description provides specific details for a thorough understanding of the invention and specific details for implementing an embodiment of the invention. However, it will be understood by those skilled in the art that the present invention may be practiced without these details. In other instances, well-known structures and functions have not been shown or described in detail to avoid unnecessarily obscuring the description of the embodiments of the invention.
如下列内容中说明的,本发明的实施方式直接提供了一种用于低域值分子电磁信号的可重复检测和记录的装置和方法。磁屏蔽的法拉第笼屏蔽了样本材料和来自外部电磁信号的探测装置。在磁屏蔽的法拉第笼里,线圈注入白噪声或高斯噪声,非铁的托盘固定住样本,以及梯度计检测低域值分子电磁信号。该装置还包括超导量子干涉器件(“SQUID”)和前置放大器。Embodiments of the present invention directly provide an apparatus and method for reproducible detection and recording of low-threshold molecular electromagnetic signals, as illustrated in the following. A magnetically shielded Faraday cage shields the sample material and the detection device from external electromagnetic signals. Inside a magnetically shielded Faraday cage, coils inject white or Gaussian noise, a nonferrous tray holds the sample, and gradiometers detect low-threshold molecular electromagnetic signals. The device also includes a superconducting quantum interference device ("SQUID") and a preamplifier.
通过放置样本在磁屏蔽的法拉第笼里接近噪声线圈和梯度计来使用该装置。白噪声被穿过噪声线圈注入并且被调整直至分子电磁信号通过随机共振而增强。增强的分子电磁信号,被来自法拉第笼的外界干扰和噪声线圈产生的磁场所屏蔽,然后被梯度计和SQUID检测和测量。该信号随后被放大且传送至任何适当的记录或测量仪器。The device is used by placing the sample in a magnetically shielded Faraday cage close to the noise coil and gradiometer. White noise is injected through the noise coil and tuned until the molecular electromagnetic signal is enhanced by stochastic resonance. The enhanced molecular electromagnetic signal, shielded by external disturbances from the Faraday cage and the magnetic field generated by the noisy coil, is then detected and measured by the gradiometer and SQUID. This signal is then amplified and sent to any suitable recording or measuring instrument.
参考图1,显示有屏蔽结构10,其在由外向内的方向包括导电线笼16,它是磁屏蔽,和内部导电线笼18和20,它们提供了电磁屏蔽。在另一个实施方式里,外部磁屏蔽由具有铝-镍合金涂层的固体镀铝材料形成,并且由两个内壁结构提供电磁屏蔽,每一个由固体铝形成。Referring to FIG. 1, there is shown a shielding
参考图2,法拉第笼10在顶端是开口的,并且包括侧开口12和14。法拉第笼10还由三个铜网笼16,18和20组成,三者互相紧靠。铜网笼16,18和20中的每一个都通过在每个笼子之间的介电屏障(没有显示)和其它笼电绝缘。Referring to FIG. 2 ,
侧开口12和14还包括衰减管22和24,当将笼的内部从外干扰源隔离时提供通向法拉第笼10内部的通道。参考图3,衰减管24是由三个铜网管26,28和30组成,三者互相紧靠。外部的铜网笼16,18和20各自分别电连接至铜网管26,28和30中的一个。衰减管24还由顶盖32覆盖,顶盖有洞34。衰减管22相似地由铜网管26,28和30组成,但不包括顶盖32。
还是参考图2,低密度非铁样本托盘50安装在法拉第笼10内部。安装样本托盘50使得可以穿过衰减管22和侧开口12从法拉第笼10移除样本托盘。三根杆52,其中的每一根在长度上都大于从法拉第笼10的中心垂直轴到衰减管22最外缘的距离,附着在样本托盘50上。三根杆52适于与衰减管22内部曲线相一致,以便于样本托盘50可以通过使杆在衰减管中静止来放置在法拉第笼10的中心。在所示的实施方式中,样本托盘50和杆52可由玻璃纤维环氧树脂制造。对于那些本领域的技术人员而言很容易想到样本托盘50和杆52可由其它非铁材料制造,并且托盘可以通过别的方法安在法拉第笼10里,例如通过一根单独的杆。Still referring to FIG. 2 , a low density
还是参考图2,安装在法拉第笼10里且在样本托盘50上面的是低温的杜瓦瓶(Dewar flask)100。在公开的实施方式中,杜瓦瓶100适于安装在法拉第笼10顶部的开口中,并且是由Tristan Technologies公司制造的型号BMD-6的液体氦杜瓦瓶。杜瓦瓶100用玻璃纤维环氧树脂合成物制造。带有非常狭窄视野的梯度计110安装在杜瓦瓶100里适当的位置以便它的视野环绕样本托盘50。在所示的实施方式里,梯度计110是第一级轴检测线圈,标称直径1厘米,有2%的差额,并且由超导体形成。梯度计可以是平面梯度计以外的任意形式的梯度计。梯度计110连接至一种低温直流超导量子干扰设备(“SQUID”)120的输入线圈。在公开的实施方式中,SQUID是由Tristan Technologies公司制造的型号LSQ/20LTS dc的SQUID。那些本领域的技术人员可以意识到在不背离本发明实质和范围时也可以使用高温或交流SQUID。在可选实施方式中,SQUID 120包括噪声抑制线圈124。Still referring to FIG. 2 , mounted within the
当测量磁场时,公开的梯度计110和SQUID 120的组合具有5微特斯拉/√赫兹的灵敏度。The combination of the disclosed
SQUID 120的输出连接到由Tristan Technologies公司制造的型号SP的低温电缆130。低温电缆130能够经受住杜瓦瓶100内部和外部的温度并且将信号从SQUID 120传送至磁通锁定环140,它安装在法拉第笼10和杜瓦瓶100的外部。公开的实施方式中的磁通锁定环140是由Tristan Technologies公司制造的iFL-301-L磁通锁定环。The output of the
参考图1,磁通锁定环140还放大且输出从SQUID 120经由高级输出电路142至iMC-303 iMAGSQUID控制器150接收的信号。磁通锁定环140还通过型号CC-60的6米光导纤维合成物连接电缆144连接至SQUID控制器150。光导纤维连接电缆144和SQUID控制器150由TristanTechnologies公司制造。控制器150安装在磁屏蔽笼40的外部。光导纤维连接电缆144承载从SQUID控制器150到磁通锁定环140的控制信号,这进一步降低了对需要测量的信号的电磁干扰的可能性。对于本领域技术人员在不背离本发明实质和范围的情况下可以使用其它的磁通锁定环,连接电缆,以及Squid控制器是显而易见的。Referring to FIG. 1 , flux locked
SQUID控制器150还包括高分辨率模拟-数字转换器152,用于输出数字化信号的标准GP-IB总线154,和用于输出模拟信号的BNC连接器156。在所示实施方式里,BNC连接器穿过接插线162连接双线示波器160。The
参考图2,当样本托盘完全插进法拉第笼10时,二元Helmholtz变压器60安装在样本托盘50的任一边。在所示实施方式里,Helmholtz变压器60的线圈绕组62和64被设计成在直流电至50千赫范围内操作,具有25千赫的中心频率和8.8兆赫的自振频率。在所示的实施方式里,线圈绕组62和64通常外形上是矩形的且大约8英尺高4英尺宽。可以使用其它的Helmholtz线圈形状,但应该有满足如下要求的形状和大小,即梯度计110和样本托盘50放置在Helmholtz线圈产生的磁场内。线圈绕组62和64中的每一个安装在两个低密度非铁框架66和68中的一个上。框架66和68互相铰链连接并由支架70支撑。框架66和68可滑动地附着在支架70上以允许与杜瓦瓶100的较低部分有关的框架的垂直运动。框架的运动允许对Helmholtz变压器60的线圈绕组62和64进行调节以改变梯度计110所接受的白噪声的振幅。支架70搁置在上面或被粘上,例如,用环氧树脂粘合在法拉第笼10的底部上。在所示的实施方式中,框架66和68以及支架70由玻璃纤维环氧树脂制成。在不背离本发明实质和范围的情况下,可以在样本托盘50周围使用变压器或线圈的其它布置。Referring to FIG. 2 ,
参考图4,显示了法拉第笼和其内含物的横断面图,显示了与杜瓦瓶100和法拉第笼10有关的Helmholtz变压器60的绕组62。注意图4中的样本托盘50和样本200的定位。Referring to FIG. 4 , a cross-sectional view of the Faraday cage and its contents is shown, showing the
参考图5,显示了可选择的实施方式,其中Helmholtz线圈绕组62和64按垂直方向固定,并且附加噪声线圈300置于样本托盘50下面。附加噪声线圈300的绕组基本上垂直对着Helmholtz变压器60的垂直绕组62和64,并且附加噪声线圈300的绕组因此基本上与法拉第笼10的底部平行定向。Referring to FIG. 5 , an alternative embodiment is shown in which the
在这个可选择的实施方式里,噪声将由相同的双绞线(未示出)馈送到噪声线圈300,如供应Helmholtz线圈一样。噪声源由用于提供噪声给Helmholtz线圈的相同的噪声发生器发起。噪声将在经由附加输出连接的噪声发生器处,或经由从输出连接到噪声发生器的平衡分离器被取样。在附加噪声线圈300处的噪声信号的衰减将穿过可调的RF信号衰减电路,其中许多在商业上可用,或者经由合适的定值RF衰减滤波器的串连。In this alternative embodiment, the noise would be fed to the
参考图6,可以看见支撑Helmholtz变压器60的线圈的框架的细节;图6的参照点是从图4视图旋转90度,并且省略了法拉第笼10。框架66和68布置为基本在垂直位置显示Helmholtz线圈的线圈绕组并且互相平行。框架66’和68’示出了关于连接框架的铰链连接的轴的框架的旋转,以便布置Helmholtz变压器的线圈绕组成为彼此不平行的关系。Referring to Figure 6, details of the frame supporting the coils of the
还是参考图1,振幅可调的白噪声发生器80在磁屏蔽笼40的外部,并且由电缆82通过滤波器90电连接到Helmholtz变压器60。参考图3,电缆82穿过侧开口12,衰减管24,并且经洞34穿过顶盖32。电缆82是同轴电缆,其还包括被内外磁屏蔽86和88分别围绕的铜导体84的双绞线。在其它的实施方式中,导体可以是任何非磁性的导电材料,例如银或金。内外磁场屏蔽86和88终止在顶盖32,留下双绞线84横跨在图1中所示的从末端顶盖到Helmholtz变压器60的剩余距离。当如图1所示外部磁屏蔽电连接到磁屏蔽笼40时,内部磁屏蔽86穿过顶盖32电连接到法拉第笼16。Still referring to FIG. 1 ,
参考图1,白噪声发生器80能产生近似均匀的噪声,其频谱穿过从0到100千赫的频谱。在所示实施方式里,滤波器90滤出在50千赫之上的噪声,但在不背离本发明实质和范围的情况下,可以使用其它频率范围。Referring to FIG. 1, the
白噪声发生器80还可以通过接插线164电连接到双线示波器160的其它输入端。The
参考图1,2和3,需要测量的物质样本200被放置在样本托盘50上并且样本托盘放置在法拉第笼10里。在第一个实施方式里,白噪声发生器80用来注入白噪声穿过Helmholtz变压器60。噪声信号在梯度计110中产生感应电压。梯度计110中的感应电压随后被检测到且经SQUID 120放大,来自SQUID的输出通过磁通锁定环140被进一步放大,并且被传送到SQUID控制器150,然后传送到双线示波器160。双线示波器160还可以用于显示由白噪声发生器80生成的信号。Referring to FIGS. 1 , 2 and 3 , a
白噪声信号通过改变白噪声发生器80的输出和旋转围绕样本200的Helmholtz变压器60来调整,如图2所示。关于框架66和68的铰链连接的轴的Helmholtz变压器60的旋转改变它关于梯度计110的相位。取决于所期望的相位改变,框架66和68的铰链连接允许当围绕样本托盘50旋转约30到40度时绕组62和64保持彼此平行。铰链连接还允许绕组62和64旋转超出平行多达大约60度,以便改变由Helmholtz变压器60生成的磁场关于梯度计110的信号定相。例如,典型的相位调整包括这种平行以外的方向,即使在特定的环境下可能优选其它方向,以调节不规则形状的样本200。噪声被施加并调整直至被检测的噪声超过分子电磁辐射30到35分贝。在这个噪声水平,噪声呈现出通过公知的随机共振现象的分子电磁信号的特征。当反映经梯度计110检测的信号的示波器迹线不同于反映直接来自白噪声发生器80的信号的迹线时,可观察到所寻找的(sought)随机产物。在可选择的实施方式中,信号可被记录和/或经任何商业上可用的仪器处理。The white noise signal is adjusted by varying the output of the
在一个可选择的实施方式里,检测分子电磁信号的方法还包括穿过SQUID 120的噪声抑制线圈124注入与Helmholtz变压器60处施加的原始噪声信号有180°相位差的噪声。当反映由梯度计110检测的信号的示波器迹线变成非随机的,那么可以观察到所寻找的随机产物。In an optional embodiment, the method for detecting molecular electromagnetic signals further includes injecting noise with a phase difference of 180° from the original noise signal applied at the
不管噪声如何注入和调整,当谱峰值增加时随机产物还是可以通过观察确定。谱峰值可由示波器160上的线性曲线或数值,或由其它公知的测量设备观察到。Regardless of how the noise is injected and tuned, random artifacts can still be determined visually as spectral peaks increase. Spectral peaks can be observed as linear curves or values on an
本发明的实施方式提供了一种用于检测没有外界干扰的极低域值分子电磁信号的方法和装置。它们还提供了那些易被各种信号记录和处理仪器使用的格式的信号的输出。Embodiments of the present invention provide a method and apparatus for detecting extremely low-threshold molecular electromagnetic signals without external interference. They also provide the output of those signals in a format easily used by various signal recording and processing instruments.
目前参考图7,显示了上面附图所示的分子电磁辐射检测和处理系统的一种可选择的实施方式。系统700包括检测单元702,其耦合到处理单元704。虽然处理单元704在检测单元702的外部显示,但至少处理单元的一部分可定位在检测单元里面。Referring now to FIG. 7, an alternative embodiment of the molecular electromagnetic radiation detection and processing system shown in the above figures is shown.
检测单元702,如图7横断面图所示,包括多个互相嵌套或同轴的元件。样本室或法拉第笼706嵌套在金属笼708里面。样本室706和金属笼708中的每一个可由铝材料构成。样本室706可以维持为真空并且可以控制温度为预先设定的温度。金属笼708配置成如低通滤波器的功能。The
在样本室706和金属笼708之间以及环绕样本室706的是一组平行加热线圈或元件710。一个或多个温度传感器711也位于加热元件710和样本室706附近。例如,四个温度传感器可以置于围绕样本室706外部的不同位置。加热元件710和温度传感器711配置成维持样本室706内部的某一温度。Between the
屏蔽712环绕着金属笼708。屏蔽712配置成为样本室706提供附加磁场屏蔽或隔离。屏蔽712可由导线或其它磁场屏蔽材料组成。当由样本室706和/或金属笼708提供了充分的屏蔽时,屏蔽712是可任意选择的。
围绕屏蔽712的是带G10绝缘体的低温层716。低温剂可以是液体氦。低温层716(也称为低温杜瓦瓶)处于4开尔文温度的操作温度。围绕低温层716的是外部屏蔽718。外部屏蔽718由镍合金组成并且配置成磁屏蔽层。沿着笛卡儿坐标系的三个直角平面,由检测单元702提供的磁屏蔽总数大约-100dB,-100dB和-120dB。Surrounding the
上述各种元件是通过气隙或介电屏障(未示出)彼此电隔离的。还应该明白为了减少叙述,元件没有显示出相对于彼此的大小。The various components described above are electrically isolated from each other by air gaps or dielectric barriers (not shown). It should also be understood that in order to reduce the description, elements are not shown in size relative to each other.
样本架720可手工或用机械放置在样本室706里面。样本架720可以从样本室706的顶端降低,升高,或移除。样本架720由不导入涡电流(Eddycurrent)和内部分子转动显示很少或没有的材料组成。举例来说,样本架720可由高品质玻璃或硬质玻璃(Pyrex)组成。The
检测单元702配置成处理固体,液体或气体样本。在检测单元702中可以利用各种样本架。例如,取决于样本的大小,可以利用较大的样本架。举另一个例子来说,当样本对空气起反应时,样本架可配置成密封的或围绕样本形成空气密封。在另一个例子中,当样本处于气态时,样本可以不用样本架720而引入样本室706里面。对这样的样本,样本室706维持真空。在样本室706顶部的真空密封721帮助维持真空和/或调节样本架720。The
感测线圈722和感测线圈724,还可以指如检测线圈,分别被设置在样本架720的上面和下面。感测线圈722,724的线圈绕组配置成在直流(DC)至大约50千赫范围内运操作,具有25千赫的中心频率和8.8兆赫的自共振频率。感测线圈722,724是二阶导数形式,并被配置成达到大约100%的耦合。在一种实施方式里,线圈722,724通常外形上是矩形并且由G10接线柱固定在位置上。线圈722,724起二阶导数梯度计的作用。The
Helmholtz线圈726和728可垂直放置在屏蔽712和金属笼708之间,如在此处说明的。线圈726和728中的每一个可以彼此独立地上升或下降。线圈726和728,还指白噪声或高斯噪声发生线圈,处于室温和环境温度。由线圈726,728产生的噪声为大约0.10高斯。
来自样本的辐射和线圈722,724之间的耦合程度可以通过改变样本架720相对于线圈722,724的位置,或改变线圈726,728中的一个,或两者相对于样本架720的位置而改变。The degree of coupling between the radiation from the sample and the
处理单元704与线圈722,724,726和728电耦合在一起。处理单元704指定由线圈726,728将白噪声或高斯噪声注入样本。处理单元104也接收线圈722,724的感应电压,它来自和注入的高斯噪声混合的样本的电磁辐射。
参考图8,使用本发明的方面的处理单元包括样本托盘840以允许插入和移除样本842,法拉第笼844和Helmholtz线圈746。SQUID/梯度计检测器组件848被放置在低温杜瓦瓶850里面。磁通锁定环852耦合在SQUID/梯度计检测器组件848和SQUID控制器854之间,SQUID控制器854可以是由Tristan提供的型号iMC-303 iMAG的多路控制器。Referring to FIG. 8 , a processing unit utilizing aspects of the present invention includes a sample tray 840 to allow insertion and removal of samples 842 , a Faraday cage 844 and a Helmholtz coil 746 . The SQUID/gradiometer detector assembly 848 is placed inside a cryogenic Dewar 850 . Flux locked loop 852 is coupled between SQUID/gradiometer detector assembly 848 and SQUID controller 854, which may be a model iMC-303 iMAG multiplex controller offered by Tristan.
模拟噪声发生器856给锁相环858提供噪声信号(如上所述)。锁相环的X-轴输出被供给Helmholz线圈846,并且可能被衰减,例如20dB。锁相环的y-轴输出经信号分离器860分离。y-轴输出的一部分被输入在SQUID的噪声消除线圈,它对于梯度计有单独的输入。y-轴信号的其它部分被输入示波器862中,例如像Tektronix TDS 3000b(例如,3032b型号)的具有傅立叶函数的模拟/数字示波器。就是说,锁相环的x-轴输出驱动Helmholz线圈,并且y-轴输出,以转换的形式,被分离输入SQUID和示波器。因而,锁相环起信号转换器的作用。示波器迹线被用于监控模拟噪声信号,例如,用于测定何时达到足够产生非平稳谱分量的噪声水平。模拟磁带记录器或记录设备864,与控制器854耦合,记录从该设备输出的信号,并且优选是宽频(例如,50kHz)记录器。PC控制器866可以是经由,例如,RS 232端口与控制器854通过接口连接的基于MS Windows的PC。Analog noise generator 856 provides a noise signal to phase locked loop 858 (as described above). The X-axis output of the phase locked loop is fed to a Helmholz coil 846 and may be attenuated, eg 20dB. The y-axis output of the PLL is split by signal splitter 860 . Part of the y-axis output is fed to the SQUID's noise cancellation coil, which has a separate input for the gradiometer. The other part of the y-axis signal is input into an oscilloscope 862, such as an analog/digital oscilloscope with a Fourier function like a Tektronix TDS 3000b (eg, model 3032b). That is, the x-axis output of the PLL drives the Helmholz coil, and the y-axis output, in the form of a switch, is split into the SQUID and the oscilloscope. Thus, the phase locked loop acts as a signal converter. Oscilloscope traces are used to monitor analog noise signals, for example, to determine when a noise level is reached sufficient to produce non-stationary spectral components. An analog tape recorder or recording device 864, coupled to the controller 854, records the signal output from the device and is preferably a broadband (eg, 50 kHz) recorder. The PC controller 866 may be a MS Windows-based PC that interfaces with the controller 854 via, for example, an RS 232 port.
在图9中,显示了处理单元的另一种实施方式的示意图。双相锁定放大器202配置成提供第一信号(例如,“X”或噪声信号)给线圈726,728和第二信号(例如,“y”或噪声消除信号)给超导量子干扰设备(SQUID)206的噪声消除线圈。放大器202配置成不用外部引用而锁定并且可以是PerkinsElmer型号7265 DSP的锁定放大器。该放大器以“虚拟方式”工作,其中它锁定原始基准频率,然后移除基准频率以允许它自由运转并锁定“噪声”。In Fig. 9, a schematic diagram of another embodiment of a processing unit is shown. The dual-phase lock-in amplifier 202 is configured to provide a first signal (e.g., an "X" or noise signal) to the
模拟噪声发生器200是和放大器202电耦合的。发生器200配置成产生或感应经由放大器202在线圈726,728的模拟高斯白噪声。举例来说,发生器200可以是由General Radio制造的型号1380。
阻抗变换器204在SQUID 206和放大器202之间电耦合。阻抗变换器204配置成提供在SQUID 206和放大器202之间的阻抗匹配。Impedance transformer 204 is electrically coupled between SQUID 206 and amplifier 202. Impedance transformer 204 is configured to provide impedance matching between SQUID 206 and amplifier 202.
SQUID 206的噪声消除特征可被开启或关闭。当噪声消除特征开启时,SQUID 206能够消除或使来自被检测辐射的注入噪声分量无效。为了提供噪声消除,到线圈726,728的第一信号是超过所寻找的要被检测的分子电磁辐射20dB或35dB的噪声信号。在这个水平,注入的噪声呈现出通过随机共振的分子电磁信号的特征。到SQUID 206的第二信号是噪声消除信号,并从振幅足以无效SQUID输出端噪声的第一信号转换而来(例如,关于第一信号的相位超出180度)。The noise cancellation feature of the SQUID 206 can be turned on or off. When the noise cancellation feature is turned on, the SQUID 206 can cancel or nullify injected noise components from the detected radiation. To provide noise cancellation, the first signal to the
SQUID 206是低温直流元件SQUID。举例来说,SQUID 206可以是由Tristan Technologies公司制造的型号LSQ/20LTS直流SQUID。可选择地,可使用高温或交流SQUID。组合的线圈722,724(例如,梯度计)和SQUID206(统称SQUID/梯度计检测组件)具有大约5微特斯拉/√赫兹的磁场测量灵敏度。线圈722,724中的感应电压被SQUID 206检测和放大。SQUID 206的输出电压是大约在0.2-0.8微伏范围里的电压。SQUID 206 is a low temperature DC component SQUID. By way of example, SQUID 206 may be a model LSQ/20LTS DC SQUID manufactured by Tristan Technologies. Alternatively, high temperature or AC SQUIDs can be used. The combined coils 722, 724 (eg, gradiometers) and SQUID 206 (collectively, the SQUID/gradiometer detection assembly) have a magnetic field measurement sensitivity of approximately 5 microTesla/√Hz. Induced voltages in
SQUID 206的输出是SQUID控制器208的输入。SQUID控制器208配置成控制SQUID 206的操作状态并进一步调节所检测的信号。举例来说,SQUID控制器208可以是由Tristan Technologies公司制造的iMC-303 iMAG多路SQUID控制器。The output of SQUID 206 is the input of SQUID controller 208. SQUID controller 208 is configured to control the operating state of SQUID 206 and further condition the detected signal. SQUID controller 208 may be, for example, an iMC-303 iMAG multi-channel SQUID controller manufactured by Tristan Technologies.
SQUID控制器208的输出被输入放大器210。放大器210配置成提供在0-100dB范围内的增益。当噪声消除节点在SQUID 206处开启时,提供了大约20dB的增益。当SQUID 206没有提供噪声消除时,提供了大约50dB的增益。The output of SQUID controller 208 is input into amplifier 210 . Amplifier 210 is configured to provide a gain in the range of 0-100 dB. When the noise cancellation node is turned on at SQUID 206, a gain of approximately 20dB is provided. When the SQUID 206 does not provide noise cancellation, it provides about 50dB of gain.
放大的信号被输入记录器或存储设备212。记录器212配置成将模拟放大信号转化成数字信号并存储该数字信号。在一种实施方式里,记录器212存储8600个数据点每赫兹并且能处理2.46Mbits/秒。举例来说,记录器212可以是Sony数字录音磁带(DAT)记录器。使用DAT记录器,原信号或数据集可被传送至第三方以按需求显示或进行特定处理。The amplified signal is input to a recorder or storage device 212 . The recorder 212 is configured to convert the analog amplified signal into a digital signal and store the digital signal. In one embodiment, the recorder 212 stores 8600 data points per Hertz and is capable of processing 2.46 Mbits/second. Recorder 212 may be, for example, a Sony digital audio tape (DAT) recorder. Using a DAT recorder, the raw signal or data set can be transferred to a third party for display or specific processing on demand.
低通滤波器214对来自记录器212的数字化数据集进行滤波。低通滤波器214是模拟滤波器并且可以是Butterworth滤波器。截止频率大约在50kHz。Low pass filter 214 filters the digitized data set from recorder 212 . Low pass filter 214 is an analog filter and may be a Butterworth filter. The cutoff frequency is around 50kHz.
接着带通滤波器216对那些经过滤波的数据集进行滤波。带通滤波器216配置成具有频带宽度在DC到50kHz之间的数字滤波器。带通滤波器216可适用于不同的频带宽度。Those filtered data sets are then filtered by bandpass filter 216 . The bandpass filter 216 is configured as a digital filter having a frequency bandwidth between DC and 50 kHz. The bandpass filter 216 is applicable to different frequency bandwidths.
带通滤波器216的输出被输入傅立叶变换处理器218。傅立叶变换处理器218配置成把在时域里的数据集转换成在频域里的数据集。傅立叶变换处理器218执行快速傅立叶变换(FFT)类型的转换。The output of the bandpass filter 216 is input to a Fourier transform processor 218 . Fourier transform processor 218 is configured to convert a data set in the time domain to a data set in the frequency domain. Fourier transform processor 218 performs a Fast Fourier Transform (FFT) type of transform.
经傅立叶变换的数据集是相关和对比处理器220的输入。记录器212的输出也输入到处理器220。处理器220配置成使数据集和先前记录的数据集相关,确定阈值,以及执行噪声消除(当SQUID 206没有提供噪声消除时)。处理器220的输出是代表样本的分子低频电磁辐射谱的最终数据集。The Fourier transformed data set is the input to the correlation and comparison processor 220 . The output of recorder 212 is also input to processor 220 . Processor 220 is configured to correlate the dataset with previously recorded datasets, determine thresholds, and perform noise cancellation (when noise cancellation is not provided by SQUID 206). The output of processor 220 is a final data set representing the molecular low frequency electromagnetic radiation spectrum of the sample.
用户接口(UI)222,例如图形用户接口(GUI),也可以连接到至少滤波器216和处理器220以指定信号处理参数。滤波器216,处理器218,和处理器220可当硬件,软件,或固件应用。例如,滤波器216和处理器218可以应用在一个或多个半导体芯片中。处理器220可以是在计算设备中应用的软件。A user interface (UI) 222, such as a graphical user interface (GUI), may also be connected to at least filter 216 and processor 220 for specifying signal processing parameters. Filter 216, processor 218, and processor 220 may be implemented as hardware, software, or firmware. For example, filter 216 and processor 218 may be implemented in one or more semiconductor chips. Processor 220 may be software implemented in a computing device.
放大器以“虚拟方式”工作,其中它锁定至原始基准频率,然后移除基准频率以允许其自由运转和锁定“噪声”。模拟噪声发生器(General Radio生产的,真正的模拟噪声发生器)对Helmholz和噪声消除线圈分别需要20dB和45-dB的衰减。The amplifier works in a "virtual mode" where it locks to the original reference frequency and then removes the reference frequency to allow it to run free and lock to "noise". The analog noise generator (manufactured by General Radio, a true analog noise generator) requires 20-dB and 45-dB attenuation for the Helmholz and noise-canceling coils, respectively.
Helmholz线圈可以具有百分比1/100th差额(balance of 1/100th of a percent)的大约1立方英寸的最佳点(sweet spot)。在可选择的实施方式里,Helmholtz线圈既可以垂直移动,也能旋转移动(围绕垂直通路),以及以圆形形状从平行到展开。在一个实施方式里,SQUID,梯度计,和驱动变换器(控制器)分别具有1.8,1.5和0.3微亨值。Helmholz线圈在最佳点可以具有0.5高斯/安培的灵敏度。Helmholz coils may have a sweet spot of about 1 cubicinch with a balance of 1/100th of a percent. In alternative embodiments, the Helmholtz coils can move both vertically and rotationally (around a vertical pathway), and from parallel to spread out in a circular shape. In one embodiment, the SQUID, gradiometer, and drive transducer (controller) have values of 1.8, 1.5, and 0.3 microhenry, respectively. A Helmholz coil may have a sensitivity of 0.5 gauss/ampere at the sweet spot.
对于随机响应大约需要10到15微伏。通过注入噪声,系统已经提高了SQUID设备的灵敏度。没有噪声的SQUID设备具有大约5毫微微特斯拉的灵敏度。该系统已经能够通过注入噪声和使用随机共振响应改善灵敏度25到35dB,总计近乎增长1,500%。For a random response you need about 10 to 15 microvolts. By injecting noise, the system has increased the sensitivity of the SQUID device. A SQUID device without noise has a sensitivity of about 5 femtotesla. The system has been able to improve sensitivity by 25 to 35 dB by injecting noise and using stochastic resonance response, a total increase of nearly 1,500 percent.
在接收和记录来自系统的信号之后,计算机,例如主计算机,超级计算机或高性能计算机进行预处理和后处理,这样通过使用Systat Software ofRichmond CA制造的Autosignal软件产品,用于预处理,而用Flexpro软件产品进行后处理。Flexpro是由Dewetron公司提供的数据(统计)分析软件。下列方程式或选项可以在Autosignal和Flexpro产品中使用。After receiving and recording the signals from the system, a computer, such as a mainframe computer, a supercomputer or a high-performance computer, performs pre-processing and post-processing, such that by using the Autosignal software product manufactured by Systat Software of Richmond CA, for pre-processing, and with Flexpro The software product performs post-processing. Flexpro is a data (statistical) analysis software provided by Dewetron Corporation. The following equations or options can be used in Autosignal and Flexpro products.
正变换positive transformation
逆变换inverse transform
FFT算法FFT algorithm
最精确的N使用Temperton的质因数FFT(C.Temperton,″Implementation of a Self-Sorting In-Place Prime Factor FFT Algorithm,Journalof Computation Physics,v.58,p.283,1985)。The most accurate N uses Temperton's prime factor FFT (C. Temperton, "Implementation of a Self-Sorting In-Place Prime Factor FFT Algorithm, Journal of Computation Physics, v.58, p.283, 1985).
数据锥度窗口(Data Tapering Windows):Data Tapering Windows:
[cs4 BHarris min]0.35875-0.48829*cos(2*Pi*i/(n-1))+0.14128*cos(4*Pi*i/(n-1))-0.01168*(6*Pi*i/(n-1)),i=0.n-1[cs4 BHarris min]0.35875-0.48829*cos(2*Pi*i/(n-1))+0.14128*cos(4*Pi*i/(n-1))-0.01168*(6*Pi*i/ (n-1)), i=0.n-1
[矩形]没有可用的固定形状锥度(示波器)[Rectangular] No fixed shape taper available (scope)
量值:sqrt(Re*Re+Im*Im)[Re=实分量,Im=虚分量]Quantity: sqrt(Re*Re+Im*Im)[Re=real component, Im=imaginary component]
振幅:2.0*sqrt(Re*Re+Im*Im)/nAmplitude: 2.0*sqrt(Re*Re+Im*Im)/n
db,分贝:10.0*log10(Re*Re+Im*Im)db, decibel: 10.0*log10(Re*Re+Im*Im)
平均重复采样(replicates)Average repeated sampling (replicates)
重复采样是基于符合1e-8分数精度内的X-值的。Oversampling is based on X-values that fit within 1e-8 fractional precision.
基准减法(reference subtraction):Reference subtraction:
基准信号减法(基线噪声)是在Y轴(振幅)沿着X(时间)轴的每一点(通路)上执行的。负数Y值然后归零。Baseline signal subtraction (baseline noise) is performed at each point (passage) along the Y-axis (amplitude) along the X (time) axis. Negative Y values are then zeroed.
互相关:Correlation:
函数使用求和法和积分来计算互相关函数。因为信号是瞬态的,该相关函数使用直接的乘法和积分进行计算。位于源通路(数据序列)之外的计算所需的所有数值被置为0。t<0的点也要被计算。The function computes the cross-correlation function using summation and integration. Because the signal is transient, the correlation function is computed using straightforward multiplication and integration. All values required for calculations located outside the source channel (data sequence) are set to zero. Points with t<0 are also counted.
傅立叶显著性水平:Fourier significance level:
蒙特卡洛数据适合于参数模型。其中数据大小N是唯一因数,使用单变量TableCurve 2D参数模型。对于分段FFT,其中段大小和重叠(overlap)是附加的影响,应用三元Chebyshev多项式。这些是在Autosignal下选择的选项。一个可以具有单独分析的数据集,或者可以以重叠方式分析,在重叠方式中数据集一将被分析,然后数据集一的后半部分和数据集二的前半部分,然后数据集二,然后后半部分。Monte Carlo data were fit to parametric models. Where the data size N is the only factor, a univariate TableCurve 2D parametric model is used. For segmented FFTs, where segment size and overlap are additive effects, a ternary Chebyshev polynomial is applied. These are the options selected under Autosignal. A data set that can have separate analyzes or can be analyzed in an overlapping fashion where data set one is analyzed, then the second half of data set one and the first half of data set two, then data set two, then the latter half portion.
图10显示了系统100执行的信号检测和处理的流程图。当样本是关注样本时,执行至少四个信号检测或数据运行(run):第一个数据运行在没有样本的时间t1,第二个数据运行在有样本的时间t2,第三个数据运行在有样本的时间t3,以及第四个数据运行在没有样本的时间t4。执行和采集来自多于一个数据运行的数据集增加了最后的(例如,相关的)数据集的准确性。在四个数据运行中,系统100的参数和条件是保持不变的(例如,温度,放大的倍数,线圈的位置,噪声信号,等等)。FIG. 10 shows a flowchart of signal detection and processing performed by
在方框300,适当的样本(或如果它是第一或第四数据运行,没有样本),放置在系统100里。所给样本,在没有注入噪声的情况下,在振幅等于或小于大约0.001微特斯拉时发出DC-50kHz范围内的电磁辐射。为了捕获这些低辐射,在方框301注入白高斯噪声。At
在方框302,线圈722,724检测表示样本辐射和注入噪声的感应电压。感应电压包括作为数据运行持续时间的时间的函数的连串的电压值(振幅和相位)。数据运行可持续2-20分钟并且因此,与数据运行对应的数据集包括2-20分钟的作为时间的函数的电压值。At
在方框304,当感应电压正在被检测时注入的噪声被消除了。当SQUID206的噪声消除特征关闭时此方框被省略了。At
在方框306,数据集的电压值放大达20-50dB,这取决于噪声消除是否在方框304发生。在方框308,放大的数据集经历模拟-数字(A/D)转换并且存储在记录器212中。数字化的数据集可包括数百万的数据行。At
在将所获取的数据集存储之后,在方框310执行检查以判断是否已经出现至少四个对于样本的数据运行(例如,已经获取至少四个数据集)。如果已经获得对于所给样本的四个数据集,那么在方框312发生低通滤波。否则,启动下一个数据运行(返回方框300)。After the acquired data sets are stored, a check is performed at
在对数字化数据集进行低通滤波(方框312)和带通滤波(方框314)之后,数据集被转换成位于傅立叶变换方框316处的频域。After low-pass filtering (block 312 ) and band-pass filtering (block 314 ) the digitized data set, the data set is converted to the frequency domain at
接下来,在方框318,相似数据集在每一个数据点彼此相关。例如,与第一数据运行相应的第一数据集(例如,基线或环境噪声数据运行)和与第四数据运行相应的第四数据集(例如,另一个噪声数据运行)彼此互相关。如果在给定频率处的第一数据集的振幅值和在给定频率处的第四数据集的振幅值相同,那么,所给定频率的相关值或数值将是1.0。可选择地,相关值的范围可以设定在0-100之间。这样的相关或比较也会发生在第二和第三数据运行(例如,样本数据运行)。因为所获取的数据集被存储,当剩余的数据运行完成时它们可在稍后被访问。Next, at
当SQUID 206没有提供噪声消除时,那么预定的阈值水平被应用于每个相关的数据集以消除统计上无关的相关值。可以使用许多种阈值,取决于数据运行的长度(数据运行越长,获取的数据的准确性越高)和样本实际辐射谱与其它类型样本的可能相似性。除阈值水平之外,相关性被平均。阈值和平均相关性的使用导致注入的噪声分量在所得到的相关数据集中变得很小。When SQUID 206 does not provide noise removal, then a predetermined threshold level is applied to each correlated data set to eliminate statistically irrelevant correlation values. A number of threshold values can be used, depending on the length of the data run (the longer the data run, the more accurate the data acquired) and the likely similarity of the sample's actual radiation spectrum to other types of samples. Correlations are averaged except for threshold levels. The use of thresholding and average correlation causes the injected noise component to become small in the resulting correlated dataset.
如果在SQUID 206提供了噪声消除,那么阈值和平均相关性的使用不是必需的。If noise cancellation is provided at SQUID 206, then the use of threshold and average correlation is not necessary.
一旦两个样本数据集已经被定义成相关的样本数据集并且两个噪声数据集已经被定义成相关的噪声数据集,那么相关的噪声数据集被从相关的样本数据集减去。得到的数据集是最终的数据集(例如,代表样本辐射谱的数据集)(方框320)。Once the two sample data sets have been defined as correlated sample data sets and the two noise data sets have been defined as correlated noise data sets, the correlated noise data sets are subtracted from the correlated sample data sets. The resulting data set is the final data set (eg, a data set representing the radiation spectrum of the sample) (block 320).
因为每赫兹具有8600数据点以及最终的数据集能够具有DC-50kHz频率范围内的数据点,最终的数据集可包括数百百万行的数据。每一行的数据可包括频率、振幅、相位和相关值。Since there are 8600 data points per hertz and the final data set can have data points in the DC-50kHz frequency range, the final data set may include hundreds of millions of rows of data. The data for each row may include frequency, amplitude, phase and correlation values.
在图11A和11B中,显示了样本辐射谱的例子。图11A显示了与饱和氯化钠溶液样本的频谱相应的傅立叶曲线400。图11B显示了与酶样本的频谱相应的傅立叶曲线500。In Figures 1 IA and 1 IB, examples of sample radiation spectra are shown. FIG. 11A shows a
参考图16,上述系统的另一个可选择实施方式现在描述为系统1600。总的来说,在这里描述的代替方式和可选择的实施方式本质上和前面描述的实施方式相似,并且相同的参考号通常指共同的元件和功能。只有在结构或操作中的明显差别会详细描述。Referring to FIG. 16 , another alternative embodiment of the system described above is now described as
二阶导数梯度计显示为1602,靶样本放置在上下配对线圈之间。样本两侧的两个内部线圈互相补偿,而两个外部线圈(顶部和底部线圈)各自互相补偿,并且与两个内部线圈相对。这样的排列允许从样本提取更多的信号和改进噪声抑制。A second derivative gradiometer is shown at 1602 with the target sample placed between the upper and lower paired coils. The two inner coils on either side of the sample compensate each other, while the two outer coils (top and bottom coils) each compensate each other and are opposite the two inner coils. Such an arrangement allows more signal to be extracted from the sample and improved noise suppression.
虽然下面在附图中显示和描述更多细节,系统1600采用了同心元件序列和沿着中心轴延伸进杜瓦瓶的排列。步进电动机1604允许将样本轴向地放置在这种同心元件的排列里面。具体地,样本可以放置在梯度计1602中间所期望的位置。Although shown and described in more detail below in the figures,
同样地,测微调整机构1606,例如机械测微计或步进电动机,允许Helmholtz线圈可以相对系统中的元件对准(例如样本和梯度计)。象Helmholtz线圈这样的调整辅助系统1600的制造和校准,也允许在系统里面磁场的精确对准,例如提供关于梯度计1602的均匀磁场。它也可能对提供磁场梯度的场偏移(field off set)或改变有用,从而产生更好的随机结果,以抵消系统中的噪声,或提供其它益处。Likewise,
图17A,17B,和18更清楚地显示出系统1600里面元件的同心排列,其中样本管轴向地延伸穿过低通滤波金属屏蔽1802(例如不锈钢合金)的中心以使2kHz以下的信号通过。外部磁场(MU)屏蔽围绕着梯度计,Helmholtz线圈和样本。系统1600的排列关于图通常是一目了然的。17A, 17B, and 18 more clearly show the concentric arrangement of components within the
随机白噪声发生器,型号1381,由General Radio制造,如上所述,可以被由Noise/Com制造的可编程高斯白噪声发生器取代。这样的发生器采用两个输出端,一个从另一个转化而来。一个输出端可被连接至Helmholtz线圈,同时另一个(转化的)输出端连接至上述的SQUID噪声消除线圈。The Random White Noise Generator, Model 1381, manufactured by General Radio, as described above, may be replaced by a Programmable White Gaussian Noise Generator manufactured by Noise/Com. Such a generator uses two outputs, one transformed from the other. One output can be connected to a Helmholtz coil, while the other (inverted) output is connected to the SQUID noise cancellation coil described above.
同样地,如图19所示,上述Tektronix数字示波器可以被由StanfordResearch Systems制造的双通道动态信号分析器1902,型号SR785取代。这个信号分析器可以通过采样多重时域信号并对经过多频域FFT’s的它们求平均来处理输入信号。这可能导致所有非随机信号分量的全频谱频域记录。可能发生的其它变化包括用数字通用光盘(DVD)记录器1904替代数字录音磁带存储系统。此外,可以使用由Keithley制造的数据采集板1906,型号3801,它运行软件以生成直方图,如下所述。Likewise, as shown in FIG. 19, the Tektronix digital oscilloscope described above can be replaced by a two-channel
在图19中所示的可选择实施方式里,噪声消除线圈1908连接在梯度计和SQUID之间。(虽然显示了一阶导数梯度计,也可以使用二阶导数梯度计,例如在图16中所示的。)虽然没有在图19中显示,但反向(inverted)的噪声通路(关于施加给Helmholtz线圈的噪声反向)可适用于噪声消除线圈1908(且可首次穿过阻抗变换器,其衰减噪声,例如,45dB)。在可选择的实施方式里,未示出,噪声消除线圈可放置在SQUID 120里面,SQUID输入线圈和输出线圈之间。In an alternative embodiment shown in Figure 19, a noise cancellation coil 1908 is connected between the gradiometer and the SQUID. (While a first derivative gradiometer is shown, a second derivative gradiometer, such as that shown in Figure 16, could also be used.) Although not shown in Figure 19, the inverted (inverted) noise path (with The noise inverse of the Helmholtz coil) may be applied to the noise canceling coil 1908 (and may first pass through an impedance transformer, which attenuates the noise, eg, by 45dB). In an alternative embodiment, not shown, a noise canceling coil may be placed inside the
III.产生最优时域信号的方法III. Methods for Generating Optimal Time-Domain Signals
根据本发明的一方面,已经发现在对于给定样本获得的低频时域信号中,样本相关的频谱特征可通过记录样本在噪声水平范围上的时域信号而实现最优化,噪声水平是在信号记录期间注入样本的噪声的功率增益。记录的信号随后被处理以显示频谱信号特征,并且选择具有最优频谱特征得分的时域信号,如下详述的。最优或接近最优的时域信号的选择是有用的,因为已经发现,并且根据本发明,用最优时域信号转换化学或生物学系统可产生比用非最优时域信号给出更强和更加可预测的响应。从另一种方式来看,当靶系统由样本信号转换时,选择最优(或接近最优)时域信号有益于获得可靠,可检测的样本效应。According to an aspect of the invention, it has been found that in a low-frequency time-domain signal obtained for a given sample, the spectral characteristics associated with the sample can be optimized by recording the time-domain signal of the sample over a range of noise levels, where the noise level is between the signal Power gain for noise injected into the sample during recording. The recorded signal is then processed to reveal spectral signal features, and the time-domain signal with the best spectral feature score is selected, as detailed below. The selection of an optimal or near-optimal time domain signal is useful because it has been found, and in accordance with the present invention, that converting a chemical or biological system with an optimal time domain signal can produce better results than that given by a non-optimal time domain signal. Stronger and more predictable responses. Viewed in another way, when the target system is transformed by the sample signal, it is beneficial to select an optimal (or near-optimal) time-domain signal to obtain reliable, detectable sample effects.
一般而言,在其上典型地记录时域信号的注入噪声水平的范围是在约0到1伏特之间,典型地,或可选择地,注入的噪声优选超过要检测的所寻找的分子电磁辐射约30到35分贝之间,例如,在70-80-dbm范围内。被记录的样本数量,即,在其上时域信号被记录的噪声水平的区间的数量可以从10-100或更多变化,典型地,并且无论如何,在足够小的区间上,以便于识别最优信号。例如,噪声发生器水平的功率增益可在50 20mV区间上变化。如将要在下面看见的,当信号的频谱特征得分相对于注入噪声水平绘图时,曲线显示在几个不同噪声水平上延伸的波峰,当噪声水平增幅适当小时。In general, the injected noise level over which the time-domain signal is typically recorded is in the range of about 0 to 1 volt, typically, or alternatively, the injected noise preferably exceeds the electromagnetic field of the molecule sought to be detected. The radiation is between about 30 and 35 decibels, for example, in the 70-80-dbm range. The number of samples recorded, i.e., the number of noise-level intervals over which the time-domain signal is recorded, can vary from 10-100 or more, typically, and in any event, over sufficiently small intervals for easy identification optimal signal. For example, the power gain of the noise generator level can be varied over the 50-20mV interval. As will be seen below, when the spectral feature score of a signal is plotted against the injected noise level, the curve shows peaks extending over several different noise levels, when the noise level increases appropriately small.
本发明思考了用于计算所记录的时域信号的频谱特征得分的三种不同方法。这些是(1)直方图箱方法(histogram bin method),(2)产生自相关信号的FFT,和(3)将FFT平均,以及这些方法中的每一个在下面详细叙述。The present invention contemplates three different methods for computing the spectral feature score of the recorded time-domain signal. These are (1) the histogram bin method, (2) generate the FFT of the autocorrelation signal, and (3) average the FFT, and each of these methods is described in detail below.
即使没有特别地描述,也会明白每一种方法可以以手工方式执行,其中用户估计频谱特征得分所基于的频谱,所述每种方法使得为下一次记录进行噪声水平调整,并测定当达到峰值得分时,或它可以以自动化的或半自动化的方式执行,其中噪声水平的连续增长和/或频谱特征得分的评估,由驱动计算机的程序执行。Even if not specifically described, it will be understood that each method can be performed in a manual manner, wherein the user estimates the spectrum on which the spectral feature score is based, each of which causes noise level adjustments to be made for the next recording, and determines when the peak scoring, or it may be performed in an automated or semi-automated manner, wherein the continuous increase of the noise level and/or the evaluation of the spectral feature score is performed by a program driving the computer.
A.产生频谱信息的直方图方法A. Histogram method for generating spectral information
图20是在产生频谱信息的直方图方法中的高级数据流程图。从SQUID获取的数据(框2002)或存储的数据(框2004)被当作16bit WAV数据(框2006)保存,并被转换成双精度浮点数据(框2008)。转换后的数据可被保存(框2010)或显示为原波形(框2012)。转换后的数据随后传送到下述参考图21的并由框2014标记的傅立叶分析表明的算法。直方图可显示在2016。可选择地,以及将在下面描述,转换后的数据可传送到两个附加算法中的一个,用于识别在时域信号中的频谱特征。Figure 20 is a high level data flow diagram in the histogram method of generating spectral information. Data retrieved from SQUID (block 2002) or stored (block 2004) is saved as 16bit WAV data (block 2006) and converted to double precision floating point data (block 2008). The converted data may be saved (block 2010) or displayed as a raw waveform (block 2012). The transformed data is then passed to the algorithm described below with reference to FIG. 21 and indicated by Fourier analysis labeled
参考图21,直方图算法的总流程图采用离散采样的时域信号并使用傅立叶分析将其转换成频域频谱,以便进一步分析。时域信号从ADC(模拟/数字转换器)获取,并存储在2102指示的缓存器中。样本长是SampleDuration秒,并以每秒SampleRate个样本进行采样,因而提供SampleCount(SampleDuration*SampleRate)个样本。如Nyquist定义的,可从信号恢复的FrquencyRange被定义为SampleRate的一半。因而,如果时序信号以每秒10000样本被采样,FrquencyRange为0Hz到5kHz。可使用的一种傅立叶算法是基数2的实数快速傅立叶变换(RFFT),它具有可选择的2直到216的功率频域分辨率(FFTSize)。只要FrquencyRange维持在8kHz或以下,选择8192个FFTSize,从而提供足够的分辨率以使每赫兹至少具有一频谱箱(frequency bin)。SampleDuration应该足够长以便SampleCount>(2*)FFTSize*10以确保可靠的结果。Referring to FIG. 21 , a general flowchart of the histogram algorithm takes a discretely sampled time-domain signal and converts it into a frequency-domain spectrum using Fourier analysis for further analysis. The time domain signal is obtained from an ADC (Analog/Digital Converter) and stored in a buffer indicated by 2102 . The sample length is SampleDuration seconds and is sampled at SampleRate samples per second, thus providing SampleCount(SampleDuration*SampleRate) samples. The FrequencyRange recoverable from the signal is defined as half of the SampleRate, as defined by Nyquist. Thus, if the timing signal is sampled at 10000 samples per second, the FrequencyRange is 0Hz to 5kHz. One Fourier algorithm that can be used is the radix-2 real Fast Fourier Transform (RFFT), which has a selectable frequency domain resolution (FFTSize) of 2 up to216 . As long as the FrequencyRange remains at or below 8kHz, 8192 FFTSizes are chosen to provide enough resolution to have at least one frequency bin per Hertz. SampleDuration should be long enough so that SampleCount>(2*)
因为FFT只能在某个时间作用于FFTSize个样本上,程序必须在样本上连续地执行FFT,并将结果一起平均以得到最终频谱。如果选择对于每个FFT略过(skip)FFTSize个样本,那么会引起1/FFTSize^0.5的统计误差。如果,然而,选择由一半FFTSize输入的FFT覆盖,那么这种误差将被减少到1/(0.81*2*FFTSize)^0.5。这使误差从0.0110485435减少至0.0086805556。关于误差和相关分析的附加信息一般而言,参见Bendat &Piersol,″Engineering Applications of Correlation and Spectral Analysis″,1993。Because the FFT can only be applied to FFTSize samples at a time, the program must continuously perform the FFT on the samples and average the results together to get the final spectrum. If one chooses to skip FFTSize samples for each FFT, then a statistical error of 1/FFTSize^0.5 will be incurred. If, however, one chooses to cover the FFT with half the FFTSize input, then this error will be reduced to 1/(0.81*2*FFTSize)^0.5. This reduces the error from 0.0110485435 to 0.0086805556. For additional information on error and correlation analysis in general, see Bendat & Piersol, "Engineering Applications of Correlation and Spectral Analysis", 1993.
在所给窗口上执行FFT之前,数据锥度滤波器可应用于避免由于采样混叠导致的频谱遗漏。该滤波器可选自作为举例的Rectangular(没有滤波器),Hamming,Hanning,Bartlett,Blackman和Blackman/Harris之间。Before performing an FFT on a given window, a data taper filter can be applied to avoid spectral omission due to sample aliasing. The filter can be chosen between Rectangular (no filter), Hamming, Hanning, Bartlett, Blackman and Blackman/Harris as examples.
在典型方法中,如在框2104中所示的,我们已经选择8192用于变量FFTSize,它是我们一次操作的时域样本数量,也是FFT输出的离散频率数量。注意FFTSize=8192是分辨率,或者是在由采样率指定的范围内的箱数。变量n,指示执行了多少离散RFFT’s(实数FFTs),其通过将SampleCount除以FFTSize*2,FFT箱数,来设定。为了进行产生切合实际的结果的算法,数n应该至少为10到20(尽管其它值是可能的),其中更多可能优选拾取较弱信号。这意味着对于所给SampleRate和FFTSize,SampleDuration必须足够长。计数器m,它从0数到n,被初始化为0,并且如框2104所示的。In a typical approach, as shown in block 2104, we have chosen 8192 for the variable FFTSize, which is the number of time domain samples we operate at one time, and the number of discrete frequencies at which the FFT outputs. Note that FFTSize=8192 is the resolution, or number of bins in the range specified by the sample rate. The variable n, indicating how many discrete RFFT's (real FFTs) were performed, is set by dividing SampleCount by FFTSize*2, the number of FFT bins. For an algorithm that produces realistic results, the number n should be at least 10 to 20 (although other values are possible), with more likely to prefer picking up weaker signals. This means that the SampleDuration must be long enough for a given SampleRate and FFTSize. A counter m, which counts from 0 to n, is initialized to 0, and is shown in block 2104.
程序首先确立了三个缓存器:用于FFTSize直方图箱的缓存器2108,其将在每个箱频率累积计数;用于在每个箱频率的平均功率的缓存器2110,以及含有每个m的FFTSize个拷贝样本的缓存器2112。The program first establishes three buffers: a buffer 2108 for the FFTSize histogram bins, which will accumulate counts at each bin frequency; a buffer 2110 for the average power at each bin frequency, and containing Buffer 2112 of FFTSize copies of samples.
程序初始化直方图和阵列(框2113),且在2114将波形数据的FFTSize个样本复制入缓存器2112,并对该波形数据(框2115)执行RFFT。FFT被归一化,使得最高振幅是1(框2116),且从归一化信号确定所有FFTSize个箱的平均功率(框2117)。对于每个箱频率,在这个频率的来自FFT的归一化值被添加到缓存器2108的每个箱(框2118)。The program initializes the histogram and array (block 2113), and at 2114 copies FFTSize samples of the waveform data into buffer 2112, and performs an RFFT on the waveform data (block 2115). The FFT is normalized such that the highest amplitude is 1 (block 2116), and the average power over all FFTSize bins is determined from the normalized signal (block 2117). For each bin frequency, the normalized value from the FFT at that frequency is added to each bin of buffer 2108 (block 2118).
在框2119中程序随后察看在每个箱频率的功率,相对于从上面计算的平均功率。如果功率在平均功率的特定因数小正数(在0和1之间)内,那么它被计数并且相应的箱在16在直方图缓存器增加。否则它被丢弃。In block 2119 the program then looks at the power at each bin frequency, relative to the average power calculated from above. If the power is within a small positive number (between 0 and 1 ) of a certain factor of the average power, it is counted and the corresponding bin is incremented at 16 in the histogram buffer. Otherwise it is discarded.
注意进行比较的平均功率仅用于此FFT实例。增强的,即使较慢的算法可能采用两条途径通过数据并在设定直方图水平之前计算所有时间的平均值。与小正数的比较帮助表示对频率箱足够显著的功率值。或者在扩展的方面,采取小正数的方程式帮助回答这个问题,“在这个频率在这个时间有信号吗?”如果答案是有,它可能导致两种情况中的一种:(1)仅这一次陷入这个箱的平稳噪声,或者(2)实数低水平周期信号,它近乎每次发生。因而,直方图计数将清除噪声冲击(hit),并且提高低水平信号冲击。因此,平均和小正数因数允许选择被认为显著的最小功率水平。Note that the average powers being compared are for this FFT instance only. An enhanced, even slower algorithm might take two passes through the data and calculate the average over all times before setting the histogram levels. Comparisons with small positive numbers help represent power values significant enough for frequency bins. Or in terms of extensions, taking small positive numbers in the equation helps answer the question, "Is there a signal at this frequency at this time?" If the answer is yes, it can lead to one of two situations: (1) only this Once stuck in this bin of stationary noise, or (2) real low-level periodic signals, it occurs nearly every time. Thus, the histogram count will clean up noise hits and increase low level signal hits. Thus, mean and small positive factors allow selection of the minimum power level considered significant.
计数器m在框2120增值,并且上述过程被重复用于每个WAV数据的n集合直到m等于n(框2121)。在每个循环,在2118,每个箱的平均功率被添加到相关联的箱,并且当满足在2114的功率振幅条件时,每个直方图箱增加一。Counter m is incremented at block 2120, and the above process is repeated for each n-set of WAV data until m equals n (block 2121). At each cycle, at 2118 , the average power of each bin is added to the associated bin, and when the power amplitude condition at 2114 is met, each histogram bin is incremented by one.
当已经考虑过数据的所有n个周期时,每个箱里的平均功率通过将在每个箱中的总累积平均功率除以n来确定,显示周期的总数(框2122)和结果(框2123)。除了结构噪声存在的地方,例如,DC=0或在60Hz的倍数,每个箱的平均功率将是一些相对较低的数值。这被表示在图22A-D(在400,600,700,和900mV产生的直方图)显示的曲线中。图22A-22D的曲线只显示了一部分的直方图箱,即从7953Hz到8533Hz的频谱。如图22A和22B所示,没有分别在注入噪声的400mV或600mV可见的随机事件。然而,如图22C所示,在700mV,可见的随机事件是明显的。此后,如图22D所示,在900mV,随机事件消失了。When all n cycles of the data have been considered, the average power in each bin is determined by dividing the total cumulative average power in each bin by n, displaying the total number of cycles (block 2122) and the result (block 2123 ). Except where structured noise exists, eg, DC = 0 or at multiples of 60 Hz, the average power per bin will be some relatively low value. This is represented in the curves shown in Figures 22A-D (histograms generated at 400, 600, 700, and 900 mV). The plots of Figures 22A-22D show only a portion of the histogram bins, namely the spectrum from 7953 Hz to 8533 Hz. As shown in Figures 22A and 22B, there are no random events visible at 400 mV or 600 mV of the injected noise, respectively. However, as shown in Figure 22C, at 700 mV, a visible random event is evident. Thereafter, as shown in Figure 22D, at 900 mV, the random event disappeared.
在每个箱中,由上述步骤产生的直方图包含,在那个频率的功率超过(小正数*整个FFT输出量的平均功率)的次数在0和n之间的计数。如果箱计数由于非结构化噪声增大,那么噪声将会随着时间的过去被分配在所有频率箱,因此在给定箱中总数不是很多。如果在所给频率有一致的信号,将存在于每个n时间段,并因此具有接近n的箱计数。大振幅的噪声,例如60赫兹和它的谐波都具有高箱计数以及高平均功率。我们能求这些频率,和我们所感兴趣的具有较低平均功率,但高箱计数的那些之间的微分。In each bin, the histogram produced by the above steps contains, between 0 and n, counts of the number of times the power at that frequency exceeds (small positive number * average power over the entire FFT output). If the bin count increases due to unstructured noise, then the noise will be distributed over time across all frequency bins, so the total number in a given bin is not very high. If there is a consistent signal at a given frequency, it will be present every n time periods, and thus have bin counts close to n. Large amplitude noises such as 60 Hz and its harmonics have high bin counts and high average power. We can differentiate between these frequencies, and those of our interest that have lower average power, but high bin counts.
图22A-22D显示了由在四种不同噪声功率输入的方法产生的直方图。如图所示,该程序可将在每个频率的平均功率显示为垂直线条。直方图箱计数可表示为连接的上部线。如果功率被认为是“低”(例如少于平均值/3),并且直方图具有特定的计数,那么连线可在功率线条峰值和直方图线条峰值之间变成可见的。由连线突出显示的箱可能作为低能量分子频谱的候选。Figures 22A-22D show the histograms produced by the method at four different noise power inputs. As shown, the program displays the average power at each frequency as a vertical line. Histogram bin counts can be represented as connected upper lines. If the power is considered "low" (eg, less than average/3), and the histogram has a certain count, then a line may become visible between the peak of the power line and the peak of the histogram line. Boxes highlighted by connecting lines are likely candidates for low-energy molecular spectra.
从图22A-22D和上述内容可以理解,在产生有意义的直方图中使用了两个值得注意的设定,即,直方图,其显示了与被询问的样本相关的随机共振效应。首先是供给样本的噪声功率水平(该情况下,高斯白噪声)。如果功率水平太低,那么噪声水平不足以产生随机共振并且箱直方图仅反映噪声。如果功率输入太高,对于每个箱计算的平均功率水平较高并且随机事件无法分辨。从这次研究中,最优噪声水平是在700mV左右,尽管真正的最优条件还可通过将该方法应用于信号来确定,该信号以在许多较小的在大约650和750mV之间的增量的信号增益来记录。As can be appreciated from Figures 22A-22D and the foregoing, two noteworthy settings were used in producing meaningful histograms, namely, histograms showing stochastic resonance effects associated with the sample being interrogated. The first is the noise power level (in this case Gaussian white noise) fed to the samples. If the power level is too low, then the noise level is insufficient to generate stochastic resonance and the bin histogram reflects only noise. If the power input is too high, the average power level calculated for each bin is high and random events cannot be resolved. From this study, the optimum noise level is around 700mV, although true optimum conditions can also be determined by applying the method to signals that scale in many small increments between approximately 650 and 750mV. The amount of signal gain to record.
在该方法中的频谱特征得分通过计数随机事件的数量来确定,所述随机事件高于与这样的值相应的箱计数,该值在没有随机事件发生时是统计学上高于该箱的平均噪声的值。在图22A-22C所示的曲线中,该平均箱计数等于或略高于沿频谱轴线分布的显而易见的随机峰值,具体地,如图22A-22C中所示的。在最优噪声增益处(图22A),可观测到许多明显高于该水平的箱峰值,这些峰值可在选定的频率区间上计数,例如DC-1kHz或DC-8kHz,由此确定相应时域信号的频谱特征得分。The spectral feature score in this method is determined by counting the number of random events above the bin count corresponding to a value that is statistically above the mean for that bin when no random events occur. The value of the noise. In the curves shown in Figures 22A-22C, the average bin count is equal to or slightly above the apparently random peaks distributed along the spectral axis, specifically as shown in Figures 22A-22C. At the optimal noise gain (Fig. 22A), many bin peaks are observed that are significantly above this level, and these peaks can be counted over a selected frequency interval, such as DC-1kHz or DC-8kHz, from which the corresponding timing can be determined. The spectral feature score of the domain signal.
在该方法中的关键设置是噪声增益和小正数值。该值决定了将被用于区分平均值上的事件的功率值。在值为1处,由于功率不可能高于平均功率,因此没有事件被检测到。当小正数趋近0时,事实上每个值被放在箱中。在0和1之间,典型地在给出占结构化噪声总箱计数约20-50%的箱计数的值处,小正数具有最大“频谱特征(spectral character)”,这意味着随机共振事件将能够从纯噪声中最大受益。The key settings in this method are noise gain and small positive values. This value determines the power value that will be used to distinguish events on the mean. At a value of 1, no event is detected since the power is unlikely to be higher than the average power. As small
因此,在实施本发明时,可以在噪声输入中系统地增加功率增益,例如在0和1V之间50mV的增量,和在每个功率设置,调整小正数直到观测到具有明确定义的峰值的直方图。在例如被处理样本表现为20秒的时间区间处,用于每一不同功率和小正数的全部处理时间将约为25秒。当观测到明确定义的信号时,可重新定义功率设置或小正数或其两者,直到产生最优直方图,这意味着产生了具有最大可分辨峰值数量的直方图。Thus, in practicing the invention, one can systematically increase the power gain in the noise input, for example in 50mV increments between 0 and 1V, and at each power setting, adjust small positive numbers until a well-defined peak is observed Histogram of . At a time interval where the processed samples represent, for example, 20 seconds, the total processing time for each different power and small positive number will be approximately 25 seconds. When a well-defined signal is observed, either the power setting or the small positive number or both can be redefined until an optimal histogram is produced, meaning a histogram with the maximum number of resolvable peaks produced.
在该算法中,在低频由于噪声的全面出现(如环境噪声),许多箱将被充填,与之相关的直方图表现为低频。从而,系统可以简单地忽略低于给定频率(例如低于1kHz)的箱,但是在更高的频率仍然表现出足够的箱值,以确定样本间独有的信号签名(signal signature)。In this algorithm, at low frequencies due to the full presence of noise (eg ambient noise), many bins will be filled and the histogram associated with them will appear at low frequencies. Thus, the system can simply ignore bins below a given frequency (e.g. below 1 kHz), but still exhibit enough bin values at higher frequencies to determine a signal signature unique between samples.
任选地,由于小正数变量的目的是适应在每个周期确定的不同平均功率水平,因此程序自身能够采用预先定义的使平均功率水平与小正数的最优值相关的函数来自动调整小正数。Optionally, since the purpose of the small positive variable is to accommodate different average power levels determined at each cycle, the program itself can automatically adjust using a pre-defined function that relates the average power level to the optimal value of the small positive small positive number.
类似地,在每一功率设置中,程序能够比较峰高,并自动调整噪声功率设置,直到在直方图中可观测到最优峰高或特征。Similarly, at each power setting, the program can compare the peak heights and automatically adjust the noise power setting until an optimal peak height or feature is observable in the histogram.
虽然小正数值对于所有频率可以是固定值,但其也可通过采用频率相关值(frequency-dependent value)来考虑,以调整用于可在低频,例如DC-1,000,观测到的更高值的平均能量。频率相关小正数因数可通过例如对大量低频FFT区域求平均,并确定小正数值来确定,该小正数值可调整平均值至与在更高频率观测到的那些可比较的值。While small positive values can be fixed for all frequencies, they can also be taken into account by taking frequency-dependent values to adjust for higher values that can be observed at low frequencies, such as DC-1,000. average energy. A frequency dependent small positive factor can be determined by, for example, averaging a large number of low frequency FFT regions and determining a small positive value that adjusts the average to values comparable to those observed at higher frequencies.
参考图23A-23C,显示了用于产生直方图的用户界面的例子。滑动条2302决定样本波形片段的长度,例如长达300-600秒,并可使用户在波形内有效拖动。框2304允许用户设定Nyquist频率,例如5、10或20kHz,并还提供临近的重置按钮。滑动条2306使用户可以移动直方图基线,而60Hz检验框2308使用户可以用垂线(如图23C中所示)识别60Hz箱和所有相关的60Hz的谐波。当选定获取按钮2312时,软件从样本中生成或获取波形,例如图23B中所示。当选定fft按钮2310时,软件生成直方图(histogramplot),如图23C中所示。Referring to Figures 23A-23C, examples of user interfaces for generating histograms are shown. The slider bar 2302 determines the length of the sample waveform segment, for example up to 300-600 seconds, and enables the user to effectively drag within the waveform. Block 2304 allows the user to set the Nyquist frequency,
B.自相关信号的FFTB. FFT of autocorrelation signal
在第二个用于确定频谱特征得分的常规方法中,在选定噪声记录的时域信号是自相关的,采用自相关信号的快速傅立叶变换(FFT)来生成频谱特征图,即,在该频率域中的信号图。然后使用FFT对在选定频率范围内,例如DC-1kHz或DC-8kHz,高于平均噪声水平的频谱信号数量评分。In the second conventional method for determining the spectral feature score, the time-domain signal at a selected noise record is autocorrelated, and a fast Fourier transform (FFT) of the autocorrelated signal is employed to generate the spectral feature map, i.e., at the A plot of a signal in the frequency domain. The FFT is then used to score the amount of spectral signal above the average noise level in a selected frequency range, eg DC-1kHz or DC-8kHz.
图24是根据该第二个实施方式,在对记录的时域信号评分时,执行步骤的流程图。时域信号如上所述被采样、数字化和滤波(框402),其在噪声水平上的增益设置为初始水平,如在404。图25A显示了典型的样本化合物时域信号,在该情况下除草剂甘胺酸磷酸盐(RoundupR),在这里显示的片段在时间区间14.08-14.16秒上被采用。然后采用标准自相关算法对时域信号进行自相关,如在408,并采用标准FFT算法生成该自相关函数的FFT,如在410。Figure 24 is a flowchart of the steps performed when scoring the recorded time-domain signal according to this second embodiment. The time domain signal is sampled, digitized, and filtered (block 402 ) as described above, with its gain over noise level set to an initial level, as at 404 . Figure 25A shows a typical sample compound time domain signal, in this case the herbicide glycine phosphate (RoundupR ), the fragment shown here was taken over the time interval 14.08-14.16 seconds. The time domain signal is then autocorrelated, as at 408, using a standard autocorrelation algorithm, and an FFT of the autocorrelation function is generated, as at 410, using a standard FFT algorithm.
采用FFT图,例如图25B-25D中所示的,通过计数统计学上大于在自相关FFT中观测到的平均噪声的谱峰数量对该图评分,如在414。通过416和406逻辑关系,重复该过程,直至记录了峰值得分,即直到随着噪声增益增加,给定信号得分开始下降。在418记录下峰值得分,且程序或用户从422处的时域信号文档中选择对应于峰值得分的信号(框420)。Taking an FFT plot, such as that shown in FIGS. 25B-25D , the plot is scored, as at 414 , by counting the number of spectral peaks that are statistically greater than the average noise observed in the autocorrelation FFT. By the logic of 416 and 406, this process is repeated until a peak score is recorded, ie until the score for a given signal starts to decrease as the noise gain increases. The peak score is recorded at 418, and the program or user selects the signal corresponding to the peak score from the time domain signal file at 422 (block 420).
在图25B-25D中的一系列自相关FFT曲线阐明了该方法包括的信号分析。在70.9-dbm(图22B)噪声水平,观测到极少高于背景噪声的峰值(最高表示60周期噪声)。在74.8-dbm最优噪声水平(图25C和25D),其在相同噪声水平表示不同的记录,通过DC-8kHz频率范围,观测到大量统计学上高于平均噪声的峰值。这些峰值中的一些在78.3-dbm的更高噪声增益处不显著或者已经消失。The series of autocorrelation FFT plots in Figures 25B-25D illustrate the signal analysis involved in this method. At the 70.9-dbm (FIG. 22B) noise level, very few peaks above the background noise were observed (the highest representing 60-cycle noise). At the 74.8-dbm optimal noise level (FIGS. 25C and 25D), which represent different recordings at the same noise level, a large number of peaks statistically higher than the average noise were observed across the DC-8kHz frequency range. Some of these peaks are insignificant or have disappeared at the higher noise gain of 78.3-dbm.
当这些信号的频谱特征得分作为噪声设置的函数绘制出来时,如图26所示,在约75-dbm的噪声设置处观测到峰值得分。从该图中,选择与峰值得分对应的时域信号。When the spectral feature scores of these signals were plotted as a function of the noise setting, as shown in Figure 26, peak scores were observed at a noise setting of about 75-dbm. From this plot, select the time-domain signal corresponding to the peak score.
如上,该实施方式可以以手工方式实施,其中用户手工调整噪声设定增量,手动分析(计数峰值)FFT频谱图,并采用峰值得分识别一个或更多最优时域信号。任选地,该步骤的一个或更多方面可以自动实施。As above, this embodiment can be implemented in a manual manner, where the user manually adjusts the noise setting increments, manually analyzes (counts peaks) the FFT spectrogram, and uses the peak scores to identify one or more optimal time domain signals. Optionally, one or more aspects of this step can be automated.
C.平均FFTC. Average FFT
在另一个确定谱峰值得分的实施方式中,在每个噪声增益处平均多个如10-20个时域信号的FFT,以生成谱峰图,并如上计算得分。In another embodiment for determining a spectral peak score, multiple, eg, 10-20, FFTs of time domain signals are averaged at each noise gain to generate a spectral peak map, and the score is calculated as above.
图27是根据该第三实施方式在对记录的时域信号评分中,执行的步骤的流程图。时域信号如上被采样、数字化和滤波(框424),其在噪声水平上的增益设置为初始水平,如在426。然后在每一噪声增益处,在428,程序生成一系列时域信号的FFT,并且这些图在430被平均化。采用平均后的FFT图,通过计数统计学上大于在平均后的FFT中观测到的平均噪声的谱峰的数量进行评分,如在432、434。通过436和437的逻辑,重复该操作,直到记录下峰值得分,即直到随着噪声增益增加,给定信号得分开始下降。在438记录峰值得分,并且程序或用户从442处的时域信号文档中选择对应于峰值得分的信号(框440)。Fig. 27 is a flowchart of the steps performed in scoring the recorded time-domain signal according to the third embodiment. The time domain signal is sampled, digitized, and filtered as above (block 424 ), with its gain over noise level set to an initial level, as at 426 . Then at each noise gain, at 428 , the program generates a series of FFTs of the time domain signal, and the plots are averaged at 430 . Using the averaged FFT plot, scoring is performed by counting the number of spectral peaks that are statistically greater than the average noise observed in the averaged FFT, eg at 432,434. By the logic of 436 and 437, this operation is repeated until the peak score is recorded, ie until the given signal score starts to drop as the noise gain increases. The peak score is recorded at 438, and the program or user selects the signal corresponding to the peak score from the time domain signal file at 442 (block 440).
如上,该方法可以以手工、半自动或全自动模式实施。As above, the method can be carried out in manual, semi-automatic or fully automatic mode.
D.其他谱分析方法D. Other spectral analysis methods
出于识别制剂特异性谱峰的目的,这部分简要的考虑了用于时域信号谱分析的其它方法。如上所述,系统利用在随机共振试验中得到的声音文件作为输入,输出频率、振幅,和成分的正弦曲线(content sinusoid)的相位。系统可采用软件程序,称为“寻峰器(peakfinder)”,其依次采用其它软件包,例如Octave和Pd,前述两种都是开放源代码的(open-source)和目前得到支持的软件平台。For the purpose of identifying formulation-specific peaks, this section briefly considers other methods for spectral analysis of time-domain signals. As mentioned above, the system uses sound files obtained in stochastic resonance experiments as input and outputs the frequency, amplitude, and phase of the content sinusoids. The system may employ a software program called a "peakfinder" which in turn employs other software packages such as Octave and Pd, both of which are open-source and currently supported software platforms .
另外,可使用两个环境变量:PF_TMP,其指定临时目录;和PF_BASE,其指定寻峰器(peakfinder)文件夹的位置。如果没有PF_BASE,peakfinder.sh脚本会试图根据自身调用推定它(假定其作为绝对路径名被调用)。输入文件为立体声声音文件,采用44100的标准采样率。文件格式可以是“wav”、“au”或“aiff”,为16、24或32比特样本帧。输出文件为指定一个正弦曲线的ASCII文件。例如:
这里,第一字段是以基本分析频率为单位的频率,解释见下,第二字段是以赫兹为单位的频率,第三是输入声音文件本身单位中正弦曲线的峰值,第四和第五是正弦曲线的余弦和正弦分量的振幅,复数振幅的实数和虚数部分。当然,该值可由实分量和虚分量推出。第一字段没有物理意义,其用于调试目的。Here, the first field is the frequency in units of the fundamental analysis frequency, explained below, the second field is the frequency in Hertz, the third is the peak value of the sinusoid in the unit of the input sound file itself, and the fourth and fifth are The amplitudes of the cosine and sine components of the sine curve, the real and imaginary parts of the complex amplitude. Of course, this value can be derived from the real and imaginary components. The first field has no physical meaning, it is used for debugging purposes.
在白噪声中用于确定单一正弦曲线振幅和频率的技术是极大似然(ML)方法,其已被扩展为多重正弦曲线。该方法假定正弦曲线数量预先已知。找到非预定的正弦曲线数量的问题在数学上很难处理,但可以通过假定所讨论的正弦曲线在频率上充分独立的方式来处理。此外,需要一种方法来区分正弦曲线的存在和不存在。A technique used in white noise to determine the amplitude and frequency of a single sinusoid is the maximum likelihood (ML) method, which has been extended to multiple sinusoids. This method assumes that the number of sinusoids is known in advance. The problem of finding an unpredetermined number of sinusoids is mathematically intractable, but can be handled by assuming that the sinusoids in question are sufficiently independent in frequency. Additionally, a method is needed to distinguish the presence and absence of sinusoids.
通过研究白噪声中的单一正弦曲线开始以下分析,并发展到分析多重正弦曲线和非白(如粉色)噪声问题。给定以下所测量的信号:The following analysis begins by studying a single sinusoid in white noise, and progresses to analyzing multiple sinusoids and non-white (such as pink) noise problems. Given the following measured signal:
x[n],n=0,……,N,x[n],n=0,...,N,
该(离散时间)非归一化傅立叶变换定义为:The (discrete-time) unnormalized Fourier transform is defined as:
其中k是以该分析的基础频率为单位的频率;每样本2π/N弧度。k不必是整数;在实际操作中k的额外数值可根据需要用零-填充(zero-padding)信号填充。在假定存在单一正弦曲线时,其最可能频率由下式给出:where k is the frequency in units of the base frequency for this analysis; 2π/N radians per sample. k need not be an integer; additional values of k may be padded with zero-padding signals as desired in practice. Assuming the existence of a single sinusoid, its most likely frequency is given by:
k=arg max|FT{x[n}(k)|.k=arg max|FT{x[n}(k)|.
换句话说,最佳估计值就是简单的k值,其能够使傅立叶变换量最大。然后,系统确定该k的估计值是否对应一个真实的正弦曲线或仅为随机波动。为此,需要分析无效假设以确定x[n]是否仅含白噪声,例如具有平均值0和RMS振幅σ。在每一个点k的傅立叶变换都是N个独立随机变量的和,每一个等于样本x[n]的单位量复数倍,因此傅立叶变换每一点的平均数仍然为0,标准偏差为

另一方面,具有峰值振幅a和频率k(通常以2π/N为单位)的实数值正弦曲线具有aN/2的傅立叶变换量。为得到

该方法用零填充记录的声音文件(介于2和4的因数之间,取决于两个指数中的下一个(next power of two)),然后报告超过振幅阈值的峰值。峰值定义为与其周围相比,相对于给定k值具有更大量,并具有至少20个临近k值的量值的一半(约为20π/NHz,或1/3Hz频带,对一分钟的样本)。This method pads the recorded sound file with zeros (by a factor between 2 and 4, depending on the next power of two), and then reports peaks that exceed the amplitude threshold. A peak is defined as having a greater magnitude relative to a given k value than its surroundings, and having half the magnitude of at least 20 neighboring k values (approximately 20π/NHz, or 1/3Hz frequency band, for a one-minute sample) .
如果存在几个正弦曲线,如果所提供的它们的频率彼此相差大于20π/N,上述方法应该可以分别分辨出它们;在计算出的傅立叶变换上,每个正弦曲线的影响在远离谱峰以k频率为单位的振幅上下降了2/3πk。If there are several sinusoids, the above method should be able to resolve them separately if their frequencies are provided that differ from each other by more than 20π/N; on the computed Fourier transform, the contribution of each sinusoid is at k The amplitude in units of frequency drops by 2/3πk.
为补偿非白噪声信号,需要估算测量信号的频谱包络。噪声可假定为是在每一狭窄频率范围内(如上的20π/N)的局部白噪声,并根据该选定的频率范围逐渐改变σ值。另外一个问题是要确定注入的噪声样本能否从试验的测量的输出中减去。在这种情况下,通过简单与上述两者相关的可测量传递函数,即使是非线性的,也可使用该传递函数的估计从所测的信号中移除大量噪声。其也可提高方法的灵敏度。To compensate for non-white noise signals, it is necessary to estimate the spectral envelope of the measured signal. The noise can be assumed to be local white noise in each narrow frequency range (20π/N as above), and gradually change the value of σ according to the selected frequency range. Another issue is to determine whether the injected noise samples can be subtracted from the measured output of the experiment. In this case, by simply relating a measurable transfer function to both of the above, even if non-linear, an estimate of this transfer function can be used to remove a significant amount of noise from the measured signal. It can also increase the sensitivity of the method.
E.复合信号E. Composite signal
如前文记载中所示的,该系统使用户可以创建可用于治疗疾病的波形,或者在生物学系统中诱发反应。可以得到由两种或更多化合物生成的波形或谱系。然后这两个信号可以被合并以形成单一信号,该合并的信号具有上述两个单一信号的特性。例如如果该两个源信号涉及两种具有不同治疗特性的不同化合物,那么其结果是,得到的合并信号应具有该两种化合物合并的治疗特性。然后可对该合并信号操作,从而移除已发现与生物学系统中副作用或负反应有关的频率分量。在已知感兴趣的频谱分量的振幅和频率条件下,该合并信号可很容易从公知的合成器技术生成。As shown in the previous documentation, the system allows users to create waveforms that can be used to treat disease, or to elicit responses in biological systems. Waveforms or spectra generated by two or more compounds can be obtained. These two signals can then be combined to form a single signal which has the properties of the two single signals described above. For example, if the two source signals relate to two different compounds with different therapeutic properties, it follows that the resulting combined signal should have the combined therapeutic properties of the two compounds. This combined signal can then be manipulated to remove frequency components that have been found to be associated with side effects or negative responses in biological systems. Given the amplitude and frequency of the spectral components of interest, this combined signal can be easily generated from well-known synthesizer techniques.
任选地,如果该两种化合物在生物学系统中产生类似应答,那么可以比较从上述化合物生成的两种信号,以识别与产生生物学作用相关的共有频率分量。随后可以生成只包含与生物学作用有关的那些频率分量的第三信号。从而,可以比较某些缓解疼痛药物的信号,来识别其共有频率组分,随后生成用于传输、存储或应用在生物学系统中的最终信号。事实上,该系统允许构建出新的信号,其不直接基于从一种或多种化合物生成的信号。相反,该系统允许生成只在需要的频率具有峰值的信号,在该频率处这种峰值具有在生物学系统中需要的结果。因此,这种合成信号与已经存在的化合物无关。Optionally, if the two compounds elicit a similar response in a biological system, the two signals generated from the compounds can be compared to identify common frequency components associated with producing a biological effect. A third signal containing only those frequency components relevant to the biological effect can then be generated. Thus, the signals of certain pain-relieving drugs can be compared to identify their common frequency components and subsequently generate the final signal for transmission, storage or application in biological systems. In fact, this system allows the construction of new signals that are not directly based on signals generated from one or more compounds. Instead, the system allows the generation of signals that have peaks only at the desired frequencies where such peaks have desirable consequences in biological systems. Therefore, this synthetic signal is not related to compounds that are already present.
IV.转换靶样本IV. Transforming Target Samples
该部分记载了用优化低频时域信号转换样本的设备和方法(A部分),和在一些生物学样本上实施的转换试验(B部分)。用于转换的样本表现出被很好地表征,并对化学或生化制剂具有容易探测的应答,且该转换信号是该化学或生化制剂的优化时域信号。This section describes devices and methods for transforming samples with optimized low-frequency time-domain signals (Part A), and transformation experiments performed on some biological samples (Part B). The sample used for the conversion appears to be well characterized and has an easily detectable response to the chemical or biochemical agent, and the converted signal is an optimized time-domain signal for the chemical or biochemical agent.
A.转换装置和方案A. Conversion device and scheme
图28A显示了根据本发明的使用制剂特异性信号转换样本的仪器的设计图。该特殊设计可以容纳五种不同样本,包括保存在转换线圈内和暴露于电磁信号中的的三种样本444、446和448,用作控制的样本450,和用作化学诱导(chemical-induction)对照的样本452。如将要在图28C中看到的,在诱导期,典型地将样本在相同摇动、温度和湿度条件下,置于混合台上并保持在那里。Figure 28A shows a schematic diagram of an instrument for converting samples using formulation-specific signals according to the present invention. This particular design can accommodate five different samples, including three
制剂特异性信号的转换通过“播放”样本的优化制剂特异性信号来实现,该信号记录于CD上,并通过前置放大器456和音频放大器458播放在CD上记录的454。如图所示,该信号通过不同通道提供给电磁线圈444和446。在一个实施方式中,使用Sony Model CDP CE375 CD播放器。播放器的通道1与Adcom Pre Amplifier Model GFP 750的CD输入1连接。通道2与Pre Amplifier Model GFP 750的CD输入2连接。CD可被记录为播放来自每个通道的同样的信号。任选地,CD也可记录为播放来自每个通道的不同的信号。样本448的线圈作为在每次试验中的控制端,主要用于产生白噪声场。例如GR模拟噪声发生器为该线圈提供白高斯噪声源。任选地,该线圈可用于经第二Crown放大器播放任何预记录的转换信号。Conversion of the formulation-specific signal is accomplished by "playing" the sample's optimized formulation-specific signal, recorded on a CD, and playing 454 the recorded on CD through a
CD播放器和前置放大器间的电缆是标准RCA音频连接线缆(6英尺)。Adcom Pre Amplifier Model GFP 750接收从Sony CD播放器输出的信号,并充分放大以驱动Crown放大器。任选地,还可以配置前置放大器接收来自其他源的转换信号,例如来自Sound Blaster PC board。前置放大器和Crown放大器之间的电缆是标准RCA音频连接电缆,其在每条电缆(3英尺)的一端装配有到1/4电话插头的RCA用于连接Crown放大器。该Crown放大器型号Micro-Tech 2400,立体声系统(每条通道1000瓦)收到来自前置放大器的信号,并将信号水平充分提升至能够驱动转换线圈。连接Crown放大器和转换线圈的电缆为在每端带有香蕉(banana)插头的14型标准铜音频电缆。香蕉插头使用固定螺钉机械连接于电缆上。The cable between the CD player and the preamplifier is a standard RCA audio connection cable (6ft). The Adcom Pre Amplifier Model GFP 750 receives the output signal from the Sony CD player and amplifies it sufficiently to drive the Crown amplifier. Optionally, the preamplifier can also be configured to accept converted signals from other sources, such as from the Sound Blaster PC board. The cables between the preamplifiers and the Crown amps were standard RCA audio connection cables fitted with RCA to 1/4 phone plugs on one end of each cable (3 feet) for connection to the Crown amps. The Crown amp, model Micro-Tech 2400, stereo system (1000 watts per channel) receives the signal from the preamp and boosts the signal level enough to drive the transducing coil. The cables connecting the Crown amplifiers to the switching coils are
化学诱导控制样本置于带有混合台的VWR紧凑培养器内,并维持其温度与转换线圈一致。Chemically induced control samples were placed in a VWR compact incubator with a mixing station and maintained at the same temperature as the switching coil.
图28B显示了样本转换仪器466,例如由任意图28A中样本444、446和448表示的那些。该仪器包括装有电磁铁470的室468,和用于监测室内条件,例如温度的各种探测器。电磁铁位于基底474上,包括常规环形铁磁体芯和线绕组。Figure 28B shows a
在一个实施方式中,线圈由American Magnetics设计和生产,以提供线圈间均衡的性能。每个线圈由416转#8规格的正方形铜磁体线组成,用搪瓷覆盖,并有约2″的空气芯。每个线圈在11赫兹在10安培RMS在10瓦RMS且温度上升不超过15摄氏度下,可在中心产生约1500高斯。无诱导对照组。将无诱导对照组样本置于带有混合台的VWR紧凑培养器内,并维持其温度与转换线圈一致。In one embodiment, the coils are designed and manufactured by American Magnetics to provide balanced performance between coils. Each coil consists of 416 turns of #8 gauge square copper magnet wire, covered with enamel, and has an approximately 2" air core. Each coil operates at 11 Hz at 10 amps RMS at 10 watts RMS and does not exceed a temperature rise of 15 degrees Celsius 1500 gauss can be generated in the center. No induction control group. Place the no induction control group sample in a VWR compact incubator with a mixing table and maintain its temperature consistent with the switching coil.
线圈由两英寸高四英寸宽的PVC支撑体474支撑。将一系列1 7/8英寸的OD PVC管切成不同的垂直长度,以使得能够将样本容易的定位在每个线圈中央。样本由线圈顶部插入,并停留在PVC定位管(未示出)中。线圈和基底用快速干燥的环氧树脂固定在外壳上。线圈柱和RF输入连接器间的连接通过用铝钉、螺母和垫片将4英寸长14规格铜标准线机械连接于线圈而形成。其他端用60%焊料焊接于RF输入连接器。RF探测器由焊接在插入式(male)BNC连接器绝缘中柱的单一6英寸长12规格铜线构成。RF探测器在每一端均使用由BNC连接器安装的RG 6同轴电缆,连接在Stanford Research Systems的型号SR 785 2的通道动态信号分析器上。The coil is supported by a
使用Sensatronics型号E4的温度监视器监视全部三个线圈和培养器的温度。将传感器分接于每个屏蔽外壳的外壁和培养器内壁。(探测器为Sensatronics Stanford的型号的温度探测器)探测器电缆也由Sensatronics提供,以匹配探测器和监视器。The temperature of all three coils and the incubator was monitored using a Sensatronics model E4 temperature monitor. Tap the sensor on the outer wall of each shielded enclosure and the inner wall of the incubator. (The detector is a Sensatronics Stanford model temperature detector.) The detector cable is also supplied by Sensatronics to match the detector and monitor.
图28C显示了混合台的布局,其中三个样本室,例如室466,由单独混合台支持,例如台486,上述全部设备均由支持台488支撑,该支持台位于屏蔽室或外壳490内,在转换试验期间维持屏蔽室或外壳为恒定的温度和湿度。Figure 28C shows a layout of a mixing station where three sample chambers, such as
该屏蔽外壳的例子是大小为10×10×10英寸,由125英寸6061 T6铝板制成,例如由Rowe Air Manufacturing,Marysville,Washington生产的。An example of such a shielded enclosure is 10 x 10 x 10 inches in size and made of 125 inch 6061 T6 aluminum sheet, such as that produced by Rowe Air Manufacturing, Marysville, Washington.
在图29A阐述的第二个常规实施方式中,转换线圈为Helmholz线圈。理想的Helmholz线圈由具有相同半径的两个共轴循环电流回路构成,彼此分离一个半径。也就是说,该回路为I分离的,且I=r。由线圈产生并以特斯拉为单位的在Helmholtz线圈轴线上任意点产生的磁场Bx由下面的方程给出,其中磁场方向与回路平面垂直。In a second conventional embodiment illustrated in Figure 29A, the switching coils are Helmholz coils. An ideal Helmholz coil consists of two coaxial circulating current loops with the same radius, separated from each other by a radius. That is, the loop is I separated, and I=r. The magnetic fieldBx produced by the coil and measured in Tesla at any point on the axis of the Helmholtz coil is given by the following equation, where the direction of the magnetic field is perpendicular to the plane of the loop.
在该方程中,m0是磁导率常数(1.26×10⁻⁶H/m),i为导线中的电流,单位为安培,r为电流回路的半径,单位为米,g是x/r的比值,其中x为从Helmholtz线圈中心的轴线距离,r为线圈半径。In this equation, m0 is the permeability constant (1.26×10⁻⁶ H/m), i is the current in the wire in amperes, r is the radius of the current loop in meters, and g is x/r where x is the axis distance from the center of the Helmholtz coil and r is the coil radius.
如图29A所示,由每个线圈产生的磁场叠加,从而在线圈中央得到了相对大的均匀磁场。线圈也可以为正方形或矩形,其中根据公知原理,线圈分离以在线圈间形成均匀磁场。As shown in Fig. 29A, the magnetic fields generated by each coil are superimposed, resulting in a relatively large uniform magnetic field in the center of the coil. The coils may also be square or rectangular, where the coils are separated to create a uniform magnetic field between the coils according to known principles.
图29B和29C显示了适用于本发明的可选择转换线圈。图29B中的转换器494是长螺线管,例如长达数英尺。螺线管内的磁场平行于螺线管轴线,并在螺线管内恒定,在螺线管外趋于零(在接近无限长的螺线管内)。该有限长的线圈只有在其中心附近才具有充分均匀的磁场。因此,通过将样本放置于线圈的中央,当用MIDS信号为线圈供能时,在样本上可以形成基本均匀的磁场。Figures 29B and 29C show alternative switching coils suitable for use with the present invention. The
通过向螺线管上增加额外匝数,例如在图29C的螺线管496上增加额外的匝数500,可增加线圈末端的额外磁场强度,以补偿在其末端的线圈磁场下降。By adding extra turns to the solenoid, such as 500 extra turns on
在另一个其他实施方式中,转换线圈可以是很小的可植入铁磁体线圈,在这种情况下,可以是一种脉管内限制线圈(vascular stent coil),其可通过附着于线圈相对两端的电极或通过远程感应系统接收转换信号,在所述远程感应系统中,电磁体被放置在与患者胸腔相对的体表附近,且该信号被诱导传输到植入线圈上。In yet other embodiments, the switching coil may be a very small implantable ferromagnetic coil, in this case, a vascular confinement coil (vascular stent coil) that can be The transduced signal is received by electrodes at the end or by a remote induction system in which an electromagnet is placed near the body surface opposite the patient's chest and the signal is induced to be transmitted to an implanted coil.
B.转换研究B. Conversion Research
以下B1-B6部分是对用于阐述本发明的方法的样本/制剂系统的详细说明,该系统包括:(1)具有可由L-(+)阿拉伯糖(+)诱导的lac操纵子的阿拉伯糖诱导型细菌系统;(2)茎长增长可由于除草剂甘胺酸磷酸盐的存在而受到抑制的甜豌豆植株;(3)茎长增长可通过使用植株激素赤霉酸受到刺激的甜豌豆植株;(4)涉及蛋白体活性的phepropetin D抑制,和在没有信号的情况下活性恢复的体外系统;(5)在小鼠动物模型系统中,通过暴露于紫杉醇治疗癌症;和(6)在小鼠动物模型系统中,通过暴露于肿瘤抑制剂肽p53的癌症治疗。Parts B1-B6 below are detailed descriptions of the sample/preparation system used to illustrate the method of the present invention, the system comprising: (1) arabinose with a lac operon inducible by L-(+) arabinose (+) Inducible bacterial system; (2) sweet pea plants whose stem growth can be inhibited by the presence of the herbicide glycine phosphate; (3) sweet pea plants whose stem growth can be stimulated by the use of the plant hormone gibberellic acid (4) phepropetin D inhibition involving proteosome activity, and an in vitro system for activity restoration in the absence of signaling; (5) cancer treatment by exposure to paclitaxel in a mouse animal model system; and (6) in a small Cancer therapy by exposure to the tumor suppressor peptide p53 in a murine animal model system.
获得各样本材料的MIDS信号的详细方法以及以MIDS信号转换生物学系统的详细方法分别详细的记载于下面的例1和2中。The detailed method of obtaining the MIDS signal of each sample material and the detailed method of converting the biological system with the MIDS signal are described in detail in Examples 1 and 2 below, respectively.
B1.通过L(+)阿拉伯糖MIDS诱导细菌lac操纵子B1. Induction of bacterial lac operon by L(+) arabinose MIDS
细菌中的阿拉伯糖操纵子是严谨调节的系统,由基因产物控制下的启动子、araC及其同类诱导物、L-阿拉伯糖、糖组成。异源蛋白质表达可受具有阿拉伯糖和araC基因的质粒的严密控制,其既是启动子的正调节剂也是负调节剂。诱导机制涉及在连接阿拉伯糖之后,araC基因与DNA元素的结合特性的变构变化。The arabinose operon in bacteria is a tightly regulated system consisting of a promoter under the control of a gene product, araC and its cognate inducer, L-arabinose, a sugar. Heterologous protein expression can be tightly controlled by plasmids with arabinose and araC genes, which are both positive and negative regulators of the promoter. The mechanism of induction involves an allosteric change in the binding properties of the araC gene to DNA elements following attachment of arabinose.
用于本研究的化学传感器系统已知对L(+)阿拉伯糖形式具有选择性,而D(-)阿拉伯糖不能诱导araC-PBAD启动子依赖型诱导和报道分子(reporter)GFP uv蛋白质的表达,尽管它们具有相同经验式和类似的结构。因此,该系统和相关的化合物提供了一组理想的工具,用以评估经再现恢复的这些类似的分子特征的分子发射信号(MIDS)而转换的任何基因表达的特异性。The chemosensor system used in this study is known to be selective for the L(+) arabinose form, whereas D(-) arabinose cannot induce araC-PBAD promoter-dependent induction and expression of the reporter GFP uv protein , although they have the same empirical formula and similar structures. Thus, this system and related compounds provide an ideal set of tools to assess the specificity of any gene expression switched by molecular emission signals (MIDS) that reproducibly restore these similar molecular features.
如以下例1中所详述的那样产生L(+)阿拉伯糖和D(-)阿拉伯糖的最优信号。简要地,通过改变注入的噪声水平和用于信号恢复的材料的物理浓度,优化用于随机共振产物的信号。衍生自等摩尔的阿拉伯糖异构体溶液的测量结果的优化SR信号产物的比较存在显著区别。恢复的MIDS信号被认为存在显著区别,并对于两种不同的阿拉伯糖异构体而言是截然不同的。这些结果表明,恢复的分子发射信号对这两种具有相同化学组成和经验式的分子的化学结构很敏感。这两种异构体的区别仅在于与己糖环连接的四个羟基的顺-反排列不同。Optimal signals for L(+) arabinose and D(-) arabinose were generated as detailed in Example 1 below. Briefly, the signal for stochastic resonance products is optimized by varying the injected noise level and the physical concentration of materials used for signal recovery. A comparison of the optimized SR signal products derived from measurements of equimolar solutions of arabinose isomers was markedly different. The recovered MIDS signal was found to be significantly different and distinct for the two different arabinose isomers. These results indicate that the recovered molecular emission signal is sensitive to the chemical structure of these two molecules with the same chemical composition and empirical formula. These two isomers differ only in the cis-trans arrangement of the four hydroxyl groups attached to the hexose ring.
利用例2中详述的转换装置和方案,将细菌样本暴露于L(+)阿拉伯糖和D(+)阿拉伯糖的MIDS信号。简要地,在一个典型的试验中,用1-3滴pBAD-GFPuv转化的JM109过夜培养物接种50ml新鲜的LB/amp,所述JM109被培养于含100-500μg/ml的氨卞青霉素钠的Luria肉汤中。将其充分混合,将其中10ml转移至25ml的三角瓶中,并添加0.1ml参比化学诱导剂(D或L阿拉伯糖)的100×原液至所需终浓度。将这些接种的培养物放置在转换线圈内,或置于振动台上用作对照。多数情况下,转换需要通过过夜培养进行。Bacterial samples were exposed to the MIDS signal of L(+) arabinose and D(+) arabinose using the switching apparatus and protocol detailed in Example 2. Briefly, in a typical assay, 50 ml of fresh LB/amp were inoculated with 1-3 drops of an overnight culture of pBAD-GFPuv-transformed JM109 grown in ampicillin sodium at 100-500 μg/ml in Luria broth. Mix it thoroughly, transfer 10ml of it to a 25ml Erlenmeyer flask, and add 0.1ml of a 100× stock solution of a reference chemical inducer (D or L arabinose) to the desired final concentration. These inoculated cultures were placed in a switching coil, or placed on a shaker table for use as controls. In most cases, transformation requires overnight incubation.
将五个独立实验的OD测量数据绘制于图30A-30E中。图30A中的图表示GFP应答于MIDS信号和化学制剂本身的诱导。如所见,MIDS L(+)阿拉伯糖信号的诱导效果,和0.2mM L(+)阿拉伯糖相当,并远远大于对D(-)阿拉伯糖MIDS信号或D(-)阿拉伯糖化合物的响应。在不存在MIDS信号或阿拉伯糖化合物时,只可观察到很小的诱导。图30B的数据表明对这两种MIDS信号有类似的效果。在这头两个试验中,只使用了两个线圈。非MIDS控制器独立地置于一个培养器内而不摇动,将该培养器的温度与线圈温度进行手工匹配。将线圈在使用的电流和电压下电阻加热。从而在L(+)和D(-)MIDS样本间采用相关的差值测量。该对照仅表明了该系统正确的化学应答,不能用于定量。OD measurements from five independent experiments are plotted in Figures 30A-30E. The graph in Figure 30A shows the induction of GFP in response to the MIDS signal and the chemical itself. As can be seen, the induction of the MIDS L(+) arabinose signal was comparable to that of 0.2 mM L(+) arabinose and was much greater than the response to the D(-) arabinose MIDS signal or the D(-) arabinose compound . In the absence of the MIDS signal or the arabinose compound, only a small induction was observed. The data in Figure 30B show similar effects for these two MIDS signals. In these first two experiments, only two coils were used. The non-MIDS controller was placed independently without shaking in an incubator whose temperature was manually matched to the coil temperature. The coil is resistively heated at the applied current and voltage. A correlated difference measure is thus employed between the L(+) and D(-) MIDS samples. This control only demonstrates the correct chemical response of the system and cannot be used for quantification.
绘制于图30C-30F中的三个试验均显示:使用L(+)MIDS信号的诱导远远大于使用D(-)MIDS信号或白噪声控制。这些数据证明了从同源化学诱导剂L(+)-阿拉伯糖而非无活性的化学异构体D(-)阿拉伯糖恢复的MIDS信号对araC-PBAD操纵子的特异性转换。由于仅在立体化学上不同,参比化学制剂在组成上是相同的,因此该系统表现出是转换特异性的良好模型。显然,该生物学系统对结构具有选择性。在进行的试验中,连续过夜再现得到了非常一致的15-20%的L相对于D MIDS信号的相对诱导。在一个试验中,在Surestha等的化学诱导方案中所使用的3.5小时的较短的诱导期,得到了7.8%的明显的相对诱导,接近于背景水平。The three experiments plotted in Figures 30C-30F all showed that the induction with the L(+) MIDS signal was much greater than with the D(-) MIDS signal or the white noise control. These data demonstrate specific switching of the araC-PBAD operon by MIDS signaling recovered from the cognate chemical inducer L(+)-arabinose but not the inactive chemical isomer D(-)arabinose. This system appears to be a good model for switch specificity since the reference chemical formulations are compositionally identical, differing only in stereochemistry. Clearly, this biological system is selective for structure. In the experiments performed, serial overnight reproduction gave a very consistent relative induction of 15-20% of the L to D MIDS signal. In one experiment, the shorter induction period of 3.5 hours used in the chemical induction protocol of Surestha et al. resulted in an apparent relative induction of 7.8%, close to background levels.
在实验条件下,生长和诱导均需相当长的时间。这些数据与MIDS再现可影响操纵子开启通路,以实现基因的特异性诱导的观念相一致。可能的作用位点可能位于与araC蛋白质相互作用的L(+)阿拉伯糖MIDS中,以诱导其模拟L(+)阿拉伯糖结合状态,然后可导致基因诱导。这一模型不需要形成任何化学键,但可能变构地影响该系统。Under the experimental conditions, both growth and induction required a considerable amount of time. These data are consistent with the notion that MIDS reappearance can affect operon-on pathways to achieve gene-specific induction. A possible site of action might be located in the L(+)arabinose MIDS that interacts with the araC protein to induce its mimic L(+)arabinose bound state, which could then lead to gene induction. This model does not require the formation of any chemical bonds, but may affect the system allosterically.
B2.通过甘胺酸磷酸盐MIDS抑制茎细胞生长B2. Inhibition of Stem Cell Growth by Glycine Phosphate MIDS
单聚体植株酶5-烯醇式丙酮莽草酸酯-3-磷酸(EPSP)合酶(EPSPS)是烯醇式丙酮转移酶类中两种酶中的一种。配体结合使酶依据诱导契合(induced-fit)机制,由开放状态转化为紧缩的闭合状态。EPSP合酶参与到莽草酸途径中,通过利用磷酸烯醇式丙酮酸(PEP)将莽草酸-3-磷酸(S3P)转化为5-乙醇式丙酮-3-莽草酸磷酸,其是在细胞中产生的大量芳香族化合物包括芳香族氨基酸的前体。已经报道在该途径中产生的化合物构成了多达35%或更多的植株干重。在哺乳动物、鱼、爬行动物、鸟和昆虫中不存在这种酶的事实,使之成为抗生素和除草剂的良好靶。The monomeric plant enzyme 5-enolpyruvylshikimate-3-phosphate (EPSP) synthase (EPSPS) is one of two enzymes in the class of enolacetonetransferases. Ligand binding converts the enzyme from an open state to a tight closed state by an induced-fit mechanism. EPSP synthase is involved in the shikimate pathway by utilizing phosphoenolpyruvate (PEP) to convert shikimate-3-phosphate (S3P) into 5-ethanolacetone-3-shikimate phosphate, which is found in cells The large number of aromatic compounds produced includes precursors of aromatic amino acids. Compounds produced in this pathway have been reported to constitute as much as 35% or more of the dry weight of the plant. The fact that this enzyme is absent in mammals, fish, reptiles, birds and insects makes it a good target for antibiotics and herbicides.
合成化合物草甘膦(glyphosate、N-phosphonomethylglycine),除草剂Roudup中的活性成分作为该酶的竞争性抑制剂,有效地关闭了芳香族氨基酸生物合成以及衍生于这些氨基酸的其他芳香族化合物的合成。甘胺酸磷酸盐是一种结合于PEP-结合位点的过渡态类似物(磷酸盐和甲酸盐离子模拟PEP含氧碳正离子的活性基团)。草甘膦呈现出对EPSP合酶的高特异性,不完全结合于UDP-N-乙酰氨基葡萄糖烯醇式丙酮转移酶(MurA),烯醇丙酮转移酶类中仅有的另一种酶。The synthetic compound glyphosate (glyphosate, N-phosphonomethylglycine), the active ingredient in the herbicideRoudup® acts as a competitive inhibitor of this enzyme, effectively shutting down the biosynthesis of aromatic amino acids and of other aromatic compounds derived from these amino acids. synthesis. Glycine phosphate is a transition state analog that binds to the PEP-binding site (phosphate and formate ions mimic the active groups of PEP oxycarbenium ions). Glyphosate exhibits high specificity for EPSP synthase, with incomplete binding to UDP-N-acetylglucosamine enolacetone transferase (MurA), the only other enzyme in the enolacetone transferase class.
采用以下方法部分中详述的系统仪器和方案,如上述部分II和III中记载的那样获得甘胺酸磷酸盐的优化的固有发射信号(MIDS)。在一个实验中,将优化的甘胺酸磷酸盐MIDS信号施加于潮湿介质支持的豌豆芽,在37℃,100%湿度下施加超过72小时的信号。各种控制包括(1)无信号,(2)化学Roundup,和(3)白噪声信号。暴露给刺激物1小时后测量茎长,每组中含有5-50个萌芽。The optimized intrinsic emission signal (MIDS) for glycine phosphate was obtained as described in Sections II and III above, using the system instrumentation and protocol detailed in the Methods section below. In one experiment, the optimized glycine phosphate MIDS signal was applied to wet medium supported pea sprouts for over 72 hours at 37 °C with 100% humidity. Various controls included (1) no signal, (2) chemical Roundup(R) , and (3) white noise signal. Stem length was measured 1 hour after exposure to the irritant, and each group contained 5-50 sprouts.
图31显示了四个实验组的每一组的茎长的条形图,其中每个条的上边界线和下边界线分别代表茎长的最大值和最小值,中间线代表该组茎长的平均值。如图所示,无论化学甘胺酸磷酸盐还是甘胺酸磷酸盐MIDS信号均有效地抑制了植株中茎的生长,然而白噪声控制对茎生长的影响很小或没有影响。Figure 31 shows the bar graphs of the stem lengths of each of the four experimental groups, where the upper and lower borderlines of each bar represent the maximum and minimum stem lengths, respectively, and the middle line represents the stem length of the group. average value. As shown, both chemical glycine phosphate and glycine phosphate MIDS signals effectively inhibited stem growth in plants, whereas white noise control had little or no effect on stem growth.
图32A和32B提供了更多甘胺酸磷酸盐MIDS信号对豌豆芽样本的影响的图形证据。图32A是在没有任何化学或MIDS信号处理的条件下,生长72小时的豌豆芽的图。相同生长期的豌豆芽,但是暴露给刺激物1小时后,显示出明显的受干扰和异常生长的迹象。Figures 32A and 32B provide more graphical evidence of the effect of the glycine phosphate MIDS signal on pea sprout samples. Figure 32A is a graph of pea sprouts grown for 72 hours without any chemical or MIDS signal treatment. Pea sprouts at the same growth stage, but 1 hour after exposure to the irritant, showed clear signs of disturbance and abnormal growth.
B3.通过赤霉素MIDS刺激茎细胞生长B3. Stimulation of stem cell growth by gibberellin MIDS
时序电磁信号模拟特异性生物活性分子的生物活性能力也已经利用赤霉酸-3(GA-3)在甜豌豆芽上得到证明。赤霉酸(赤霉酸钾,也称为MegaGrow)是一种天然存在的植株生长调节剂,其可导致多种效应包括在某些情况下刺激种子萌芽。GA-3天然存在于许多物种种子中,可通过在桶中培养赤酶菌(Gibberella Fujikuroi)真菌培养物,然后提取和提纯GA-3进行商业化生产。在GA-3溶液中预浸渍的种子可以在很多情况下,使得多种类型的高度休眠的种子快速萌芽,否则这些种子将需要冷处理,后熟或老化,或其他延长的预处理。The ability of temporal electromagnetic signals to mimic the bioactivity of specific bioactive molecules has also been demonstrated on sweet pea sprouts using gibberellic acid-3 (GA-3). Gibberellic acid (potassium gibberellic acid, also known as MegaGrow(R )) is a naturally occurring plant growth regulator that causes a variety of effects including, in some cases, stimulation of seed germination. GA-3 occurs naturally in the seeds of many species and can be produced commercially by growing Gibberella Fujikuroi fungal cultures in barrels, followed by extraction and purification of GA-3. Seeds presoaked in GA-3 solutions can, in many cases, enable rapid germination of many types of highly dormant seeds that would otherwise require cold treatment, post-ripening or aging, or other prolonged pretreatments.
将大量生长调节剂赤霉酸(.001%)放置在1.5cc Pyrex样本瓶中,并临近第一衍生物超导磁场梯度计(derivative super conducting gradiometer)放置。频率范围为DC-2000Hz的白高斯噪声电流经16匝Helmholtz线圈传播,产生与梯度计轴线正交的B-场(B-Field)定向的磁场。假定该噪声信号促进了用梯度计测量的赤霉酸的分子电磁(磁)辐射的随机信号特征的形成。如上述,以WAV格式记录和存储该随机信号。给每个信号提供独有的控制数字。A bulk of the growth regulator gibberellic acid (.001%) was placed in a 1.5cc Pyrex sample bottle adjacent to a derivative superconducting gradiometer. A white Gaussian noise current with a frequency range of DC-2000Hz is propagated through a 16-turn Helmholtz coil to generate a B-field oriented magnetic field orthogonal to the gradiometer axis. It is assumed that this noise signal contributes to the formation of the stochastic signal characteristic of molecular electromagnetic (magnetic) radiation of gibberellic acid measured with a gradiometer. As described above, the random signal is recorded and stored in the WAV format. Unique control numbers are provided for each signal.
对上述记录的生长调节剂的信号进行后处理,以识别只属于激动剂的频谱,并通过使用IFFT转化为WAV文件。创建了五个研究组,每组均由从Sun Grown Inc.,San Diego获得的活体甜豌豆芽组成。以促进甜豌豆萌芽的方式将豆芽放在湿纸巾上准备各研究组。The signals of the growth regulators recorded above were post-processed to identify agonist-only spectra and converted to WAV files by using IFFT. Five study groups were created, each consisting of live sweet pea sprouts obtained from Sun Grown Inc., San Diego. Each study group was prepared by placing sprouts on wet paper towels in a manner that promotes sweet pea sprouting.
这五组是:(1)无影响对照组(在适当的光、水和通风条件下自然发芽);(2)生长调节剂GA-3组(用生长调节剂处理萌芽);(3)经噪声线圈施加白高斯白噪声;(4)生长调节剂辐射组(对萌芽应用从步骤1记录的生长调节剂);和(5)生长调节剂辐射组(噪声移除-IFFT,即将记录的生长调节剂信号进行后处理以仅包括激动剂独有的频谱,然后再显萌芽)。These five groups are: (1) no effect control group (germinate naturally under appropriate light, water and ventilation conditions); (2) growth regulator GA-3 group (germinate with growth regulator treatment); (3) Noise coil applied with white Gaussian noise; (4) growth regulator radiation set (growth regulator recorded from
信号源为步骤1中产生的WAV文件,将其转化为模拟信号,并使用配置的低频RF放大器放大,以向手性缠绕(hand wound)的4英寸(ID)特斯拉线圈提供具有足够强度和质量的信号;将组3、4和5安置在转换器上方。采用适当的电磁屏蔽使各组彼此隔离。提供适当的光、热量和通风,以促进所有组健康生长。除非更早地得到动态结果,否则每组研究的持续时间为72小时。转换器是18英寸直径的改进型Helmholz,使萌芽位于线圈核心的中央。The signal source is the WAV file generated in
研究结果绘制于图33中,表明了上述1-4组的平均茎长。如图所示,相对于自由生长对照组(组1)、白噪声(组3),甚至赤霉酸(组2),赤霉酸的MIDS信号(组4)的平均茎长显著增加。The results of the study are plotted in Figure 33, showing the mean stem lengths for groups 1-4 above. As shown, the mean stem length of the MIDS signal of GA (group 4) was significantly increased relative to the free-growing control group (group 1), white noise (group 3), and even GA (group 2).
B4.通过phepropeptin D MIDS抑制蛋白体的活性B4. Inhibition of proteosome activity by phepropeptin D MIDS
使用温和去垢剂(SDS)激活20S蛋白体酶。通过被激活的酶对底物Suc-Leu-Leu-Val-Tyr-AMC的剪切释放出荧光AMC分子,其可通过在380nm激发AMC,并在460nm检测荧光对该分子进行监测。蛋白体活性被phepropeptin D抑制。Activate 20S proteosome enzymes with a mild detergent (SDS). Cleavage of the substrate Suc-Leu-Leu-Val-Tyr-AMC by the activated enzyme releases a fluorescent AMC molecule that can be monitored by exciting AMC at 380 nm and detecting fluorescence at 460 nm. Proteosome activity is inhibited by phepropeptin D.
在第一个研究中,按照上面以及实施例中记载的完全相同的方法,测定了phepropeptin D及其抑制蛋白体活性的MIDS信号的能力,其通过测定底物Suc-Leu-Leu-Val-Tyr-AMC的转化出现的荧光信号测定。In the first study, phepropeptin D and its ability to inhibit the MIDS signal of proteosome activity were determined in exactly the same way as described above and in the examples by measuring the substrate Suc-Leu-Leu-Val-Tyr - Determination of the fluorescent signal arising from the transformation of AMC.
20S蛋白体检测试剂盒(EMD Biosciences Cat#539158)适于使用终容积200μl的试管类型。采用例3中详细记载的方法建立9个样本。阳性对照样本#2设定为700,其他所有测量均相对于该样本进行。化学抑制剂将20S蛋白体的活性抑制到小于未受抑制的活性的20%。当处理1.5小时后进行检测时,衍生自phepropeptin D样本的MIDS场使20S蛋白体酶活性下降至小于36%。The 20S Proteosome Assay Kit (EMD Biosciences Cat#539158) is suitable for use in a tube type with a final volume of 200 μl. Nine samples were established using the method detailed in Example 3. Positive
在后续研究中,将样本在室温下过夜培养(20小时),以确定是否底物会继续转化为荧光产物。如果MIDS信号抑制20S蛋白体且所述酶从场中移除后仍然保留活性,则相对于其他含有与化学抑制剂的样本及无抑制剂的对照,暴露给MIDS的样本的活性增加了。In a follow-up study, the samples were incubated overnight (20 hours) at room temperature to determine whether the conversion of the substrate to the fluorescent product continued. If MIDS signaling inhibits the 20S proteosome and the enzyme retains activity after removal from the field, the activity of the samples exposed to MIDS is increased relative to other samples containing chemical inhibitors and controls without inhibitors.
下表中给出的结果表明,如通过对荧光计的灵敏水平下降所指示的那样,阳性对照持续上升。相对于持续增加的阳性对照,化学抑制剂的活性变得更加明显。MIDS样本是唯一一个在20小时后活性增加的样本。后处理信号表明1小时30分钟培养后最初探测到的抑制,在将样本从场中移除后不再存在。下表中给出的结果绘制于图34中。The results presented in the table below show that the positive control continued to rise as indicated by the drop in sensitivity level to the fluorometer. The activity of the chemical inhibitors becomes more pronounced relative to the increasing positive control. The MIDS sample was the only one with an increase in activity after 20 hours. The post-treatment signal indicated inhibition initially detected after 1
%归一化的荧光% normalized fluorescence
1小时30分钟 20小时后 will be
阴性对照 0 0
阳性对照 100 100
ALLN 4.97479 2.645832ALLN 4.97479 2.645832
PheD 18.12605 16.97173PheD 18.12605 16.97173
PheD+MIDS 34.63866 27.7141PheD+MIDS 34.63866 27.7141
MIDS 38.45378 66.3626MIDS 38.45378 66.3626
B5.利用紫杉醇MIDS治疗癌症B5. Using Paclitaxel MIDS to Treat Cancer
该研究在人乳腺肿瘤的标准小鼠异种移植模型中,评估了紫杉醇转换分子发射信号的生长抑制潜力。紫杉醇是一种已在临床上获证的细胞毒性制剂,其通过与由聚合微管蛋白组成的细胞骨架元素的微管蛋白亚单位非共价结合以避免其分解,从而阻止细胞分裂并引发编程性细胞死亡而特异性地发挥作用。因此,紫杉醇对最初结合之后具有增加效应的蛋白质单体具有别构效应,从而影响较大的大分子结构。细胞毒素效应在快速分裂的癌细胞中更加明显。紫杉醇的作用机制在与靶微管蛋白分子结合后,不需要形成或破坏共价键。试验设计和条件详述于例4中。This study assessed the growth inhibitory potential of paclitaxel-switching molecular signaling in a standard mouse xenograft model of human breast tumors. Paclitaxel is a clinically proven cytotoxic agent that prevents cell division and initiates programming by noncovalently binding to tubulin subunits, cytoskeletal elements composed of polymerized tubulin, to avoid their disassembly Sex cell death and specifically play a role. Thus, paclitaxel has an allosteric effect on protein monomers that have an increased effect after initial binding, thereby affecting larger macromolecular structures. Cytotoxic effects are more pronounced in rapidly dividing cancer cells. The mechanism of action of paclitaxel does not require the formation or breaking of covalent bonds after binding to target tubulin molecules. The experimental design and conditions are detailed in Example 4.
参考在图35A中绘制的数据,单个动物肿瘤大小的对比显示,在研究结束后(第36天)肿瘤生长在统计学上被显著抑制。在统计分析前,将从所有组中移除了超出标准偏差的两倍的范围的值定义为异常值(outlier)。在第36天,紫杉醇、40mG和60mG治疗分别抑制肿瘤生长43%、36%和38%。将40mG和60mG治疗与标准的化疗剂紫杉醇对比,所揭示的紫杉醇在这些治疗间没有差别,这表明在移除异常值后,40mG和60mG治疗表现出与紫杉醇治疗类似的功效。Referring to the data plotted in Figure 35A, a comparison of tumor size in individual animals showed a statistically significant inhibition of tumor growth at the end of the study (day 36). Values removed from all groups in a range exceeding two times the standard deviation were defined as outliers before statistical analysis. At day 36, paclitaxel, 40 mG and 60 mG treatment inhibited tumor growth by 43%, 36% and 38%, respectively. Comparing the 40mG and 60mG treatments with the standard chemotherapeutic agent paclitaxel revealed no difference between these treatments for paclitaxel, suggesting that after removing the outliers, the 40mG and 60mG treatments exhibited similar efficacy to the paclitaxel treatment.
在第36天的肿瘤重量的对比揭示,在紫杉醇对照组和40mG治疗组中,肿瘤重量也同样在统计上被明显抑制。紫杉醇、40mG和60mG分别抑制生长43%、36%和26%(图35B)。总之,40mG和60mG治疗均在MDA-MB-435人乳腺肿瘤模型中显示出类似的功效,而没有有害临床体征。36天后,将肿瘤大小和肿瘤重量与载体对照比较,两种治疗均获得了统计学显著性。然而,在统计分析中包括来自60mG治疗的两个异常值和来自40mG治疗的一个异常值,将会消除其统计学显著性。40mG和60mG治疗与紫杉醇治疗的对比,均显示没有显著区别,这说明治疗36天后具有类似的功效。A comparison of tumor weights at day 36 revealed that tumor weights were also statistically significantly suppressed in the paclitaxel control and 40 mG treatment groups. Paclitaxel, 40 mG and 60 mG inhibited growth by 43%, 36% and 26%, respectively (Fig. 35B). In conclusion, both 40mG and 60mG treatments showed similar efficacy in the MDA-MB-435 human breast tumor model without adverse clinical signs. After 36 days, tumor size and tumor weight were compared to vehicle controls, and statistical significance was achieved for both treatments. However, including two outliers from the 60 mG treatment and one from the 40 mG treatment in the statistical analysis would remove their statistical significance. Both 40mG and 60mG treatments compared with paclitaxel showed no significant difference, indicating similar efficacy after 36 days of treatment.
B6.通过p53 MIDS抑制肿瘤生长B6. Inhibition of tumor growth by p53 MIDS
采用MDA-MB-468人乳腺癌细胞系(line)测试Ant-p53pep的作用,所述细胞系含有内源p53-273His突变基因。该突变已作为p53基因中两个最常见突变点之一被报道,占高达所有p53突变的18%。Ant-p53pep对细胞成活力的影响通过台盼蓝排除进行初步检测。细胞成活力计数表明,在MDA-MB-468细胞中,具有30μm Ant-p53pep的处理5小时后活细胞减少了10倍。相反,用30μM肽处理5小时后,在良性wt p53乳腺上皮细胞系,MCF10-2A的成活力没有任何影响。The effect of Ant-p53pep was tested using the MDA-MB-468 human breast cancer cell line, which contains the endogenous p53-273His mutant gene. This mutation has been reported as one of the two most common mutation points in the p53 gene, accounting for up to 18% of all p53 mutations. The effect of Ant-p53pep on cell viability was initially detected by trypan blue exclusion. Cell viability counts showed a 10-fold reduction in viable cells after 5 h of treatment with 30 μM Ant-p53pep in MDA-MB-468 cells. In contrast, treatment with 30 μM peptide for 5 h did not have any effect on the viability of MCF10-2A in the benign wt p53 mammary epithelial cell line.
编程性(apoptotic)细胞死亡通过Annexin V与磷脂酰丝氨酸的结合被进一步证实。在许多细胞类型中,由于编程性细胞死亡的早期的膜不对称性缺失,磷脂酰丝氨酸被暴露给细胞外环境。用30μM Ant-p53pep经各种时间处理MDA-MB-468细胞,然后用Annexin V-FITC培养,并用流式细胞仪进行分析。结果表明与未处理对照相比,约35%的细胞在暴露给Ant-p53pep 30分钟后与Annexin V结合。Apoptotic cell death was further confirmed by the combination of Annexin V and phosphatidylserine. In many cell types, phosphatidylserine is exposed to the extracellular environment due to loss of membrane asymmetry early in apoptosis. MDA-MB-468 cells were treated with 30 μM Ant-p53pep for various times, then cultured with Annexin V-FITC, and analyzed by flow cytometry. The results showed that about 35% of cells bound Annexin V after exposure to Ant-p53pep for 30 min compared to untreated controls.
也在MDA-MB-231和MCF7细胞中观察到Annexin V结合,但在27sk细胞中没有观察到。MDA-MB-468细胞表现出特有的与编程性细胞死亡有关的形态学变化,包括膜出泡、细胞皱缩和核碎裂。肽处理的MCF 10-2A细胞的形态与对照组细胞类似。此外,用Ant-p53pep处理p53无效/无效乳腺癌细胞系、MDA-MB-453,没有表现出sub-G1 DNA含量或Annexin V结合的积聚。其他两个具有无效p53情形的细胞系,H1299(肺腺癌系)和Saos2(骨肉瘤系)也没有被Ant-p53pep诱导至编程性细胞死亡。Annexin V binding was also observed in MDA-MB-231 and MCF7 cells, but not in 27sk cells. MDA-MB-468 cells exhibit characteristic apoptosis-related morphological changes, including membrane blebbing, cell shrinkage, and nuclear fragmentation. The morphology of peptide-treated MCF 10-2A cells was similar to that of control cells. Furthermore, treatment of the p53 null/null breast cancer cell line, MDA-MB-453, with Ant-p53pep showed no accumulation of sub-G1 DNA content or Annexin V binding. Two other cell lines with a null p53 profile, H1299 (lung adenocarcinoma line) and Saos2 (osteosarcoma line), were also not induced to apoptosis by Ant-p53pep.
此外,用30μM Ant-p53pep处理MDA-MB-468细胞2小时,通过蛋白质印迹(western blof)产生了FLICE(p26)特有的截短的活性形式。这些数据说明,在Ant-p53pep处理的MDA-MB-468细胞中,编程性细胞死亡经Fas/APO-1信令途径调解,并导致FLICE活化。Furthermore, treatment of MDA-MB-468 cells with 30 μM Ant-p53pep for 2 hours produced a truncated active form specific to FLICE(p26) by western blof. These data demonstrate that in Ant-p53pep-treated MDA-MB-468 cells, apoptosis is mediated through the Fas/APO-1 signaling pathway and leads to FLICE activation.
在MIDS研究中,将培养的MCF10-2A细胞暴露于记录的用于Ant-p53肽溶液的MIDS信号。于60mG,将细胞暴露给1小时开1小时关的MIDS信号,共处理18小时。处理结束时,检查培养盘中的细胞数。28小时后观察到的细胞数相对于对照组(没有MIDS信号)观察到的细胞数显著下降(约为对照组细胞的50%)。In the MIDS study, cultured MCF10-2A cells were exposed to recorded MIDS signals for Ant-p53 peptide solutions. Cells were exposed to the MIDS signal for 1 hour on and 1 hour off at 60 mG for a total of 18 hours. At the end of the treatment, check the number of cells in the culture plate. The number of cells observed after 28 hours was significantly reduced (approximately 50% of control cells) relative to the number of cells observed in the control group (no MIDS signal).
C.MIDS制剂和化学或生化靶的的选择C. Selection of MIDS formulations and chemical or biochemical targets
上面记载的方法证明,当已知在细胞环境下,制剂本身与抗配体靶的非共价作用情况下,本发明对于很宽范围的配体生化制剂MIDS信号是可操作的。本发明的研究中的配体/抗配体靶的对包括与细菌系统中的lac操纵子相互作用的L(+)阿拉伯糖;均结合并抑制它们各自靶酶的两种酶抑制剂(甘胺酸磷酸盐和phepropeptin D);与染色体微管蛋白结构结合以抑制自组装微管蛋白结构的解离的紫杉醇;和肿瘤抑制剂肽p53,其与DNA以及可能的蛋白质靶的结合位点相互作用以诱发参与阻止细胞分裂的因子(例如p21)的表达,或涉及编程性细胞死亡的多种蛋白质(包括bax、Fas、FasL和DR5)的表达。The methods described above demonstrate that the present invention is operable for a wide range of ligand biochemical agent MIDS signals given the known non-covalent interaction of the agent itself with the anti-ligand target in the cellular context. The ligand/anti-ligand target pairs in the present study included L(+)arabinose, which interacts with the lac operator in bacterial systems; amino acid phosphate and phepropeptin D); paclitaxel, which binds to chromosomal tubulin structures to inhibit dissociation of self-assembled tubulin structures; and the tumor suppressor peptide p53, which interacts with the binding sites of DNA and possibly protein targets Acts to induce expression of factors involved in preventing cell division, such as p21, or expression of various proteins involved in apoptosis, including bax, Fas, FasL and DR5.
在这些情况中的每一情况中,实际配体通过非共价作用与其抗配体靶的相互作用,非共价作用可包括离子、疏水、分散,和/或氢键。基于这些观察结果,可以合理地推测到,其它系统也对配体MIDS信号显示出类似的应答,在所述其它系统中MIDS信号代表其生物学活动涉及与生物靶的(例如蛋白质和/或DNA靶的)非共价作用的配体。In each of these cases, the actual ligand interacts with its anti-ligand target through non-covalent interactions, which may include ionic, hydrophobic, dispersive, and/or hydrogen bonding. Based on these observations, it is reasonable to speculate that other systems display similar responses to ligand MIDS signaling, where MIDS signaling represents the interaction between biological targets (such as proteins and/or DNA). target) non-covalent ligands.
到目前为止,已经研究的一种配体/生物系统没有表现出统计学上有意义的MIDS信号应答。该情况涉及癌细胞应答系统,在该系统中MIDS信号是对于肿瘤坏死因子相关性编程性细胞死亡诱导的配体(TRAIL)蛋白质记录的低频时域信号。已知该蛋白质通过在细胞中诱导编程性细胞死亡途径抑制某些类型的癌细胞。该蛋白质的活性形式是一种具有配位锌(Zn)原子的三聚体,所述锌原子表现为参与了配体-受体相互作用,例如TRAIL蛋白与DR4和DR5细胞受体结合。众所周知,无论TRAIL化合物(具有配位锌原子的三聚物,且总分子量约为60K)多么复杂,MIDS信号不能反映所述三聚物或结合锌特征或者溶液中的TRAIL成分不能形成必需的配体复合物,均是导致不能观察到MIDS效应的原因。虽然如此,其结果对于选择用于实施所述方法的适当的效应物化合物具有指导意义,这将在下面研究。然而,TRAIL MIDS信号的结果确实证明了,将生物样本暴露于无活性MIDS信号的过程本身影响了系统的表现,因为在细胞暴露于该MIDS信号的过程中没有观察到癌细胞生长的有意义的变化。One ligand/biological system that has been studied so far has not shown a statistically significant MIDS signaling response. This scenario concerns cancer cell response systems where the MIDS signal is a low-frequency time-domain signal recorded for the tumor necrosis factor-related apoptosis-inducing ligand (TRAIL) protein. The protein is known to inhibit certain types of cancer cells by inducing the apoptosis pathway in cells. The active form of the protein is a trimer with coordinating zinc (Zn) atoms that appear to be involved in ligand-receptor interactions, such as the binding of TRAIL protein to DR4 and DR5 cellular receptors. It is well known that no matter how complex the TRAIL compound (trimer with coordinating zinc atoms, and a total molecular weight of about 60K) is, the MIDS signal cannot reflect the trimer or bound zinc characteristics or the TRAIL component in solution cannot form the necessary coordination. body complexes, are responsible for the failure to observe MIDS effects. Nonetheless, the results are instructive for the selection of appropriate effector compounds for carrying out the methods, as will be investigated below. However, the TRAIL MIDS signaling results do demonstrate that exposing the biological sample to an inactive MIDS signal itself affected the performance of the system, as no meaningful effect on cancer cell growth was observed during exposure of the cells to this MIDS signal. Variety.
已经研究了涉及共价键形成的一个配体/应答系统,但是没有明确的结果。该系统涉及将MIDS信号应用于抗细菌靶系统的β-内酰胺抗生素氨卞青霉素。已知β-内酰胺抗生素通过对细菌转肽酶中的丝氨酸残基共价修饰发挥至少部分作用。由于期望MIDS信号包括远低于共价键形成或破坏所需能量的相互作用的能量,因此如果其破坏或形成共价键所需机制不能在靶中引起制剂特异性反应的MIDS信号将是不被期望的。A ligand/response system involving covalent bond formation has been investigated, but with no definitive results. This system involves the application of MIDS signaling to the β-lactam antibiotic ampicillin against a bacterial target system. [beta]-lactam antibiotics are known to act at least in part through covalent modification of serine residues in bacterial transpeptidases. Since MIDS signals are expected to include interactions with energies well below the energies required for covalent bond formation or disruption, a MIDS signal would be undesirable if its mechanisms for breaking or forming covalent bonds cannot elicit an agent-specific response in the target. expected.
基于以上讨论的结果,下列指导原则将会有助于选择适于用作影响生物学系统的的MIDS信号的配体效应物化合物。Based on the results discussed above, the following guidelines will assist in the selection of ligand effector compounds suitable for use as MIDS signals affecting biological systems.
1.配体或效应物化合物应该通过非共价相互作用(例如,离子,疏水,分散,和/或氢键相互作用)与生物学靶相互作用;1. The ligand or effector compound should interact with the biological target through non-covalent interactions (e.g., ionic, hydrophobic, dispersed, and/or hydrogen bonding interactions);
2.配体或效应物化合物可以是一个相对较大的生物分子(如p53抑癌蛋白),但是产生MIDS信号的分子或复合物的溶液形式应为其生物学活性形式。因此,如果该生物学活性形式包括二聚体或三聚体结构,或配位金属键,则当记录MIDS信号时这些活性形式必须占主要地位。代表性的化合物是相对较小的有机分子或肽,例如,分子量小于1kD;2. The ligand or effector compound can be a relatively large biomolecule (such as p53 tumor suppressor protein), but the solution form of the molecule or complex that produces MIDS signal should be its biologically active form. Therefore, if the biologically active form includes dimeric or trimeric structures, or coordinate metal bonds, these active forms must predominate when recording MIDS signals. Representative compounds are relatively small organic molecules or peptides, e.g., less than 1 kD in molecular weight;
3.特别优选的化合物是那些克服已知的生物系统中化合物自身限制的化合物。特别地,如果化合物具有较差的药物动力学参数(例如,由于在靶肿瘤细胞中的多重药物抗性,或诱导P450药物代谢途径,或不能穿过血-脑屏障),则该化合物的MIDS信号输送可有效地克服这些限制;3. Particularly preferred compounds are those that overcome the inherent limitations of known compounds in biological systems. In particular, if a compound has poor pharmacokinetic parameters (for example, due to multidrug resistance in target tumor cells, or induction of P450 drug metabolism pathways, or inability to cross the blood-brain barrier), the MIDS of the compound Signaling can effectively overcome these limitations;
4.相似地,对于由于与化合物在体内蓄积或与药物分解成毒性代谢产物相关的非特异性毒性效应而具有不需要的或禁止的副作用的化合物,MIDS信号可望成为有益的替代。4. Similarly, MIDS signaling is expected to be a beneficial surrogate for compounds that have unwanted or prohibitive side effects due to nonspecific toxic effects associated with the accumulation of the compound in the body or with the breakdown of the drug into toxic metabolites.
一旦选择了制剂或样本,则会优选在与靶的相容的介质(例如水介质)中,以及在与靶系统中有效的浓度相似或更高的浓度下产生最优MIDS信号。MIDS信号随后被用于转换靶系统,在一个选定水平(例如,在40-60mG之间)播放信号一段足以产生制剂特异性效应的时间,例如24小时。观察到制剂特异性效应时,MIDS信号被识别为适用于本发明的转换方法。如果没有观察到制剂特异性效应,则可进一步优化该MIDS信号,例如,通过产生仅含有所述样本最显著的频谱分量的合成信号。Once a formulation or sample is selected, optimal MIDS signal will preferably be generated in a medium that is compatible with the target (eg, aqueous medium), and at a concentration similar to or higher than that effective in the target system. The MIDS signal is then used to switch the target system, playing the signal at a selected level (eg, between 40-60 mG) for a period of time sufficient to produce an agent-specific effect, eg 24 hours. When formulation-specific effects were observed, MIDS signals were identified as suitable for use in the switching method of the present invention. If no formulation-specific effects are observed, the MIDS signal can be further optimized, for example, by generating a composite signal containing only the most significant spectral components of the sample.
在识别适合的化合物或样本之后,可通过将靶系统(例如,体内或体外生物系统)以多个时间间隔中的每一个(例如,持续暴露或在一定时期内(典型地在12小时至一周或更多的时间内)交替暴露)暴露给处于多个信号水平(例如,10至100mG之间)中的每一个的MIDS信号,使所述化合物的(或样本的)MIDS信号效应最优化,,以确立最可行的处理剂量和方案。After identification of a suitable compound or sample, the target system (e.g., an in vivo or in vitro biological system) can be tested by subjecting the target system (e.g., to a biological system in vivo or in vitro) at each of a number of time intervals (e.g., sustained exposure or for a period of time (typically 12 hours to one week). or more during (alternating exposure) exposure to a MIDS signal at each of a plurality of signal levels (eg, between 10 and 100 mG) to optimize the MIDS signal effect of the compound (or sample), , to establish the most feasible treatment dose and regimen.
以下实例阐明了本发明的各种方法,但决非对本发明的范围的限制。The following examples illustrate various methods of the invention, but in no way limit the scope of the invention.
例1 MIDS信号获取方法Example 1 MIDS signal acquisition method
测量时,样本材料处于70至74华氏度之间的室温。样本温度的大范围变化可以使辐射的频率根据温度的升高和降低变得更高或更低。如果样本在高于或低于室温时被记录,应当记录测量前和测量后材料的温度,并注意加热或冷却的方法。When measured, the sample material is at room temperature between 70 and 74 degrees Fahrenheit. Wide variations in sample temperature can cause the frequency of the radiation to be higher or lower as the temperature increases and decreases. If samples are recorded above or below room temperature, the temperature of the material before and after the measurement should be recorded, noting the method of heating or cooling.
如果待测量的材料暴露于室内空气,应当记录测量时的大气湿度。如果待测量的材料暴露于室内空气,应当记录测量时大气压。如果样本被加压,压力以磅/平方英寸或英寸汞柱记录。If the material to be measured is exposed to room air, the atmospheric humidity at the time of measurement shall be recorded. If the material to be measured is exposed to room air, the atmospheric pressure at the time of measurement shall be recorded. If the sample is pressurized, the pressure is reported in psi or inches of mercury.
进行分子测量前后应当记录周围环境的电磁干扰。在后处理中,该数据将从样本数据中减去。Electromagnetic interference from the surrounding environment should be recorded before and after molecular measurements are taken. In postprocessing, this data will be subtracted from the sample data.
A.样本制备A. Sample Preparation
样本大小:0.8 to 1.5ccSample size: 0.8 to 1.5cc
样本容器:1cc或2cc平底三角瓶。Sample container: 1cc or 2cc flat-bottomed Erlenmeyer flask.
样本存储:样本被安全保存以用于不同条件下的多次测量。将样本储存在原先的三角样本瓶中,用无活性的螺纹瓶盖盖紧。Sample Storage: Samples are safely stored for multiple measurements under different conditions. Store samples in original Erlenmeyer vials, tightly capped with non-viable screw caps.
B.SQUID(超导量子干涉设备)参数设置B. SQUID (superconducting quantum interference device) parameter setting
冷却:使所有低温成分都达4开尔文的工作温度。Cooling: Bring all cryogenic components to a working temperature of 4 Kelvin.
启动:SQUID和SQUID控制器被启动并完成内部检测以确保正确操作。Startup: SQUID and the SQUID controller are started and perform internal checks to ensure proper operation.
调谐:将SQUID调至最优设置(0.4-0.8微伏输出电压,无白噪声注入)。Tuning: Tune the SQUID to optimal settings (0.4-0.8 microvolt output voltage, no white noise injection).
增益:100XGain: 100X
DC偏移量(offset):ZERODC offset (offset): ZERO
带宽:标准(50kHz)Bandwidth: Standard (50kHz)
滤波器:3Hz(高通)Filter: 3Hz (high pass)
C.噪声发生器C. Noise generator
信号类型:模拟高斯白噪声,或者均匀噪声(等幅)Signal type: Analog Gaussian white noise, or uniform noise (equal amplitude)
输出电压:从最小值到最大值开路输出电压3伏rms最小。施加的输出电压最初设置为零输出电压。Output Voltage: Open circuit output voltage from min to
X通道:连接至Helmholtz线圈用于噪声注入。X channel: connected to a Helmholtz coil for noise injection.
Y通道(反向的):连接至与梯度计串联的噪声消除线圈,在SQUID输入线圈之前(可选的)。Y channel (reverse): connected to the noise cancellation coil in series with the gradiometer, before the SQUID input coil (optional).
输出阻抗:50ohmsOutput impedance: 50ohms
D.谱分析D. Spectrum analysis
通过PCI数据采集板获取从MIDS输出的模拟信号(分子查询和数据系统)并且存储。WavGrab也被设计成与Noise Com型号UFX 9837的白噪声发生器串行连接。根据每一个后来的记录,当施加于Helm Holtz线圈的噪声的量增加时,样本被多次记录。一系列的记录从而形成不同噪声水平的单一靶样本。The analog signal output from the MIDS (Molecular Query and Data System) is acquired and stored through a PCI data acquisition board. The WavGrab is also designed for serial connection with a Noise Com white noise generator model UFX 9837. With each subsequent recording, samples were recorded multiple times as the amount of noise applied to the Helm Holtz coil was increased. A series of recordings are made to form a single target sample with different noise levels.
可替换地,可以使用用于信号获取的人工方法。Alternatively, manual methods for signal acquisition can be used.
E.随机生成E. Random generation
将样本台从SQUID检测器中移走(没有样本)。将小量增益施加给噪声发生器通道X。将噪声发生器通道Y的输出调整,以在SQUID输出端产生可能的最深的0值(deepest null possible)(任选白噪声消除)。噪声发生器的主增益控制减小至零。通过将样本槽滑至梯度计下的位置将样本嵌入检测器。监测平均傅立叶显示并注意基线的频谱(在感兴趣的带宽内)。当监测基线频谱中的改变的平均傅立叶显示时,主增益控制(噪声发生器)被进一步改进。Remove the sample stage from the SQUID detector (no sample). Apply a small amount of gain to Noise Generator Channel X. Adjust the output of Noise Generator Channel Y to produce the deepest null possible at the SQUID output (optional white noise cancellation). The master gain control of the noise generator is reduced to zero. Insert the sample into the detector by sliding the sample well into position under the gradiometer. Monitor the average Fourier display and note the spectrum of the baseline (within the bandwidth of interest). The master gain control (noise generator) was further improved when monitoring the average Fourier display of changes in the baseline spectrum.
当出现的明显的谱峰不是典型的基线频谱时,中断噪声增益的前进(advancement)并记录一段时序的辐射记录。When a distinct spectral peak appeared that was not typical of the baseline spectrum, the advancement of the noise gain was interrupted and a time-series radiation record was recorded.
F.后处理F. Post-processing
采集单分子靶的一些原始时序记录并以WAV格式存储。每一个记录代表在一定白噪声振幅范围上的一系列记录测量值之一。标记从单分子靶获得的所有原始时序记录用于批处理。该批中的每一个原始时序记录是自相关的。Several raw time-series records of single-molecule targets were acquired and stored in WAV format. Each record represents one of a series of recorded measurements over a range of white noise amplitudes. All raw time-series records obtained from single-molecule targets are labeled for batch processing. Each raw time series record in the batch is autocorrelated.
自相关函数被用于以下两个目的:The autocorrelation function is used for two purposes:
A.检测数据中的非随机性。A. Detecting non-randomness in data.
B.如果数据不是随机的,确定一个合适的时序模式。B. If the data is not random, determine an appropriate timing pattern.
将自相关时序与批量原始时序记录存储在一起用于进一步处理。该批中的每个自相关时序通过使用傅立叶变换被转换至频域。对于每个频域变换,计算Y轴穿过X轴(频率)中的所有数据点的RMS平均值(自相关得分)。对于每个频域变换,所有超出RMS平均值的Y轴异常值被列成表显示。列成表的批量中每一个时序记录的异常值总量被写成显示记录名称以及异常值计数的展开图(sheet)。最高的异常值得分的时序记录代表最佳的记录信号。Store autocorrelation time series together with batches of raw time series records for further processing. Each autocorrelation time series in the batch is converted to the frequency domain using a Fourier transform. For each frequency domain transform, the RMS mean (autocorrelation score) of all data points in the Y-axis passing through the X-axis (frequency) is calculated. For each frequency domain transform, all Y-axis outliers above the RMS mean are tabulated. The total amount of outliers for each time-series record in the tabulated batch is written as a sheet showing the name of the record along with the outlier count. The timing recording with the highest outlier score represents the best recorded signal.
例2Example 2
转换方法和条件Conversion methods and conditions
转换研究通过两组线圈完成。在第一个系统中,一对线圈包括由30规格的缠绕在25/8″外径的PVC芯的3″高的切面周围的铝线组成,缠绕成35X启动线圈的绕组的数量。这些线圈被放置在铝制法拉第箱(faraday box)5 1/2″×4″×8 3/4″(W×H×D)内以隔离用于交叉RF信号的样本。将两个箱放置在定轨振动台上通风转换培养。样本和线圈的温度用Craftsman型号82327非接触型红外摄氏温度计监测。(实验时,配对的RF白噪声控制是不适用的)。Conversion studies are done with two sets of coils. In the first system, a pair of coils consisted of 30 gauge aluminum wire wrapped around a 3" high cut face of a 25/8" OD PVC core, wound into 35X the number of windings of the starter coil. These coils were placed inside an
在三个以1″内径围起的28G绝缘铜的4″高的stock 4000-ft线轴的第二个设置中,塑料芯被直接用作转换线圈(″Mega线圈″)并且当第三个控制线圈被随机白噪声发生器驱动的时候,两个线圈被MIDS信号驱动。在这种情况中,全部三个线圈均在法拉第箱中隔离,并且通过在适于定轨振动器的6-ft板上隔离2ft独立安装。这确保全部三个样本全都用一个振动器以同样的速度摇动。将热敏电阻温度探测器也放置在每个最靠近样本的线圈的中心以实时读取温度。两组MIDS信号线圈设置均在最高输入电压设置时被驱动,直至它们的温度自缠绕的金属线电阻发热平衡于94-97附近。将样本放置于线圈的中心以经历最大以及最均匀的RF通量(电流设置的限制与采用控制RF通量的驱动电压加热相关)。In a second setup of three 4" high stock 4000-ft spools of 28G insulated copper surrounded by a 1" ID, the plastic core was used directly as the switching coil ("Mega Coil") and when the third controlled While the coils are driven by a random white noise generator, both coils are driven by MIDS signals. In this case, all three coils were isolated in a Faraday box and mounted independently by 2 ft of isolation on a 6-ft plate suitable for an orbital vibrator. This ensures that all three samples are shaken at the same speed with one shaker. A thermistor temperature probe was also placed at the center of each coil closest to the sample to read the temperature in real time. Both sets of MIDS signal coil settings were driven at the highest input voltage setting until their temperature self-wound wire resistance heating equilibrated around 94-97°F. Place the sample in the center of the coil to experience the largest and most uniform RF flux (limitations in current settings are related to heating with a drive voltage that controls RF flux).
实施例3Example 3
通过phepropeptin D MIDS抑制蛋白体活性Inhibition of proteosome activity by phepropeptin D MIDS
20S蛋白体酶检测试剂盒(EMD Biosciences Cat# 539158)适合于在200μl终体积规格的试管中使用。使用下列步骤准备九个样本:20S Proteasome Enzyme Assay Kit (EMD Biosciences Cat# 539158) is suitable for use in tubes with a final volume of 200μl. Prepare nine samples using the following steps:
1)稀释反应缓冲液(20×),将100μl用880μl的HPLC级水稀释,并加入20μl的100×激活缓冲液,稀释至终体积1ml。1) Dilute the reaction buffer (20×), dilute 100 μl with 880 μl of HPLC grade water, add 20 μl of 100× activation buffer, and dilute to a final volume of 1 ml.
2)将100μl经稀释的2×反应缓冲液加入每个无酶的对照试管。2) Add 100 μl of diluted 2× reaction buffer to each control tube without enzyme.
3)将20S蛋白体酶加入剩余的溶液中,将3.2μl加入至800μl的2×反应缓冲液中,分别取100μl加入剩下的7个试管。3) Add 20S proteasome enzyme to the remaining solution, add 3.2 μl to 800 μl of 2× reaction buffer, and add 100 μl to the remaining 7 test tubes.
4)向每个试管加入100μl水或水与抑制剂。4) Add 100 [mu]l of water or water and inhibitor to each tube.
5)在一个独立的试管中,用96μl HPLC级水稀释4μl的底物,并将10μl/试管的稀释底物加入到每一个反应试管中至终体积200μl。5) In a separate tube, dilute 4 μl of the substrate with 96 μl of HPLC grade water and add 10 μl/tube of the diluted substrate to each reaction tube to a final volume of 200 μl.
6)通过反复移液混合样本,将反应物在37℃培养2小时。暴露于MIDS场的样本在helmholtz线圈中培养,部分淹没在的传播60mG ACPhepropeptin D场的37℃水浴中。6) Mix the sample by repeated pipetting and incubate the reaction at 37°C for 2 hours. Samples exposed to MIDS fields were incubated in helmholtz coils partially submerged in a 37°C water bath propagating a 60 mG ACPhepropeptin D field.
7)通过荧光计(Turner Designs,Sunnyvale,CA-Model TD-700)量化并记录荧光。。7) Fluorescence was quantified and recorded by a fluorometer (Turner Designs, Sunnyvale, CA-Model TD-700). .
8)在图上以星号表示具有两个重复采样的样本。8) Samples with two replicates are indicated by an asterisk on the plot.
所述样本为:Said samples are:
1 24.91(Disc) 无酶对照组(阴性对照)1 24.91(Disc) No enzyme control group (negative control)
2 697.9(Disc) 无抑制剂(阳性对照)2 697.9(Disc) No inhibitor (positive control)
3 25.83(DiSc) 化学抑制剂ALLN3 25.83(DiSc) chemical inhibitor ALLN
4 105.6(Disc) 化学抑制剂Phepropeptin D4 105.6(Disc) Chemical inhibitor Phepropeptin D
5 79.35(Disc) 化学抑制剂Phepropeptin D+MIDS PhepropeptinD(60mG)5 79.35(Disc) Chemical Inhibitor Phepropeptin D+MIDS Phepropeptin D(60mG)
6 251.1(Disc) MIDS Phepropeptin D(60mG)6 251.1(Disc) MIDS Phepropeptin D(60mG)
7 519.3(Disc) 无抑制剂(阳性对照)7 519.3(Disc) No inhibitor (positive control)
8 21.96(Disc) 无酶对照组(阴性对照)8 21.96(Disc) No enzyme control group (negative control)
9 209.7(Disc) MIDS Phepropeptin D(60mG)9 209.7(Disc) MIDS Phepropeptin D(60mG)
该研究的结果在前面已经述及。The results of this study have been mentioned above.
实施例4Example 4
通过紫杉醇MIDS降低肿瘤生长Reduction of Tumor Growth by Paclitaxel MIDS
在玻璃样本架(Kimble自动注射瓶)上测量MIDS,通过(1)预制的临床用紫杉醇药水瓶中的纯净溶液,使用一个1ml的结核菌素注射器,以及22G注射针头,从多计量瓶中抽出0.7ml(无菌保藏并完全溶解,不往回注射),然后(2)将该0.7ml的紫杉醇制剂用于溶解额外的1mg药水瓶的紫杉醇,以增加紫杉醇与Cremophor的相对量。该研究被设计用于评价转换技术抑制体内人肿瘤小鼠模型异种移植模型中的肿瘤生长的功效,并将其功效与标准化学疗法治疗的进行比较,标准化学疗法治疗为将紫杉醇,5百万MDA-MB-435细胞,以悬浮液侧面皮下注射给无胸腺的裸鼠。从细胞移植的同一天(第一天)开始治疗。动物被指定为4组中的一组。在研究持续期间,每周2次监测各动物的肿瘤生长。一组采用紫杉醇治疗,两组采用转换治疗,还有一组采用紫杉醇载体治疗作为对照。MIDS was measured in glass sample holders (Kimble autoinjection vials) by (1) neat solution in pre-made clinical vials of paclitaxel, drawn from multi-dose vials using a 1ml tuberculin syringe, and 22G injection needle 0.7ml (preserved aseptically and dissolved completely, no back injection), then (2) this 0.7ml of paclitaxel formulation was used to dissolve an additional 1 mg vial of paclitaxel to increase the relative amount of paclitaxel to Cremophor(R). The study was designed to evaluate the efficacy of the switch technique in inhibiting tumor growth in an in vivo human tumor mouse model xenograft model and compare its efficacy to that of standard chemotherapy treatment consisting of paclitaxel, 5 million MDA-MB-435 cells were injected subcutaneously as a suspension laterally to athymic nude mice. Treatment started on the same day of cell transplantation (Day 1). Animals were assigned to one of 4 groups. Tumor growth in each animal was monitored twice weekly for the duration of the study. One group was treated with paclitaxel, two groups were treated with switch therapy, and one group was treated with paclitaxel vehicle as a control.
小鼠是无胸腺的BALB/c裸小鼠nu/nu。植入5百万乳腺癌肿瘤系MDA-MB-435(源自NCI的NCL标准,获自美国典型培养物保藏中心ATCC(Rockville,MD))。乳腺导管癌的生长不依赖雌激素。在研究持续期间,常规治疗组(各10只小鼠):只用载体、紫杉醇15mg/kg、腹腔注射每周两次共2周,MIDS转换组(各11只小鼠):在两个不同的能量水平。
将小鼠限制在直径2英尺的直角圆笼中,通过Tristan技术制成的螺管线圈,调节标准小鼠笼使得小鼠始终暴露于紫杉醇的MIDS再现。将一个治疗组中的所有小鼠放在一个笼子中,并在重复再现期间将其保持在大转换线圈的中心圆腔区域之内,同时喂食和给水。期间,测量肿瘤的体积,并在清理笼的时候,将笼从线圈中滑出。这样导致约占研究持续时间的80-90%的工作时间连续暴露。Mice were confined to 2-ft diameter right-angled round cages, and standard mouse cages were adjusted to reproduce MIDS where mice were consistently exposed to paclitaxel using solenoidal coils made of Tristan technology. All mice in a treatment group were housed in one cage and kept within the central lumen area of the large switching coil during repeated reproductions while being fed and watered. During this time, the volume of the tumor is measured and the cage is slid out of the coil while the cage is cleaned. This resulted in continuous work-time exposure for approximately 80-90% of the study duration.
虽然本发明描述了某些具体的实施方式和应用,但各种变形、修改和其他应用如所附权利要求所包含的一样包含在本发明的范围内。While this invention has described certain specific implementations and applications, variations, modifications and other applications are intended to be within the scope of this invention as encompassed by the appended claims.
Claims (30)
Translated fromChineseApplications Claiming Priority (9)
| Application Number | Priority Date | Filing Date | Title |
|---|---|---|---|
| US59154904P | 2004-07-27 | 2004-07-27 | |
| US60/591,549 | 2004-07-27 | ||
| US59300604P | 2004-07-30 | 2004-07-30 | |
| US60/593,006 | 2004-07-30 | ||
| US60296204P | 2004-08-19 | 2004-08-19 | |
| US60/602,962 | 2004-08-19 | ||
| US67408305P | 2005-04-21 | 2005-04-21 | |
| US60/674,083 | 2005-04-21 | ||
| PCT/US2005/026678WO2006073491A2 (en) | 2004-07-27 | 2005-07-27 | System and method for producing chemical or biochemical signals |
Publications (2)
| Publication Number | Publication Date |
|---|---|
| CN101031796Atrue CN101031796A (en) | 2007-09-05 |
| CN101031796B CN101031796B (en) | 2012-05-16 |
Family
ID=35787792
Family Applications (1)
| Application Number | Title | Priority Date | Filing Date |
|---|---|---|---|
| CN2005800251992AExpired - LifetimeCN101031796B (en) | 2004-07-27 | 2005-07-27 | System and method for producing chemical or biochemical signals |
Country Status (8)
| Country | Link |
|---|---|
| US (3) | US20070231872A1 (en) |
| EP (2) | EP1779122A4 (en) |
| JP (2) | JP4726900B2 (en) |
| CN (1) | CN101031796B (en) |
| AU (4) | AU2005323470A1 (en) |
| BR (2) | BRPI0512678B1 (en) |
| CA (2) | CA2573350C (en) |
| WO (2) | WO2006073491A2 (en) |
Cited By (6)
| Publication number | Priority date | Publication date | Assignee | Title |
|---|---|---|---|---|
| CN102692436A (en)* | 2012-06-11 | 2012-09-26 | 浙江工商大学 | Electrochemical detection method |
| CN108310655A (en)* | 2013-03-15 | 2018-07-24 | 纳特维斯公司 | For implementing to treat, such as the controller and flexible coil for the treatment of of cancer |
| CN116973563A (en)* | 2023-09-22 | 2023-10-31 | 宁波奥丞生物科技有限公司 | Immunofluorescence chromatography determination method and device based on quadrature phase-locked amplification |
| CN117977240A (en)* | 2024-02-27 | 2024-05-03 | 中国计量科学研究院 | Device and method for connecting superconducting quantum interference device and superconducting capture coil |
| CN119959168A (en)* | 2025-01-17 | 2025-05-09 | 久兴隆工程技术无锡有限公司 | Photoelectric gas monitoring device and method |
| CN120372259A (en)* | 2025-06-27 | 2025-07-25 | 北京清畅电力技术股份有限公司 | Misoperation identification method for high-voltage switch cabinet |
Families Citing this family (39)
| Publication number | Priority date | Publication date | Assignee | Title |
|---|---|---|---|---|
| US7668362B2 (en) | 2000-05-03 | 2010-02-23 | Aperio Technologies, Inc. | System and method for assessing virtual slide image quality |
| US8118754B1 (en) | 2007-11-15 | 2012-02-21 | Flynn Edward R | Magnetic needle biopsy |
| CA2573350C (en) | 2004-07-27 | 2014-05-13 | Nativis, Inc. | System and method for collecting, storing, processing, transmitting and presenting very low amplitude signals |
| US9964469B2 (en) | 2005-02-28 | 2018-05-08 | Imagion Biosystems, Inc. | Magnetic needle separation and optical monitoring |
| US8447379B2 (en) | 2006-11-16 | 2013-05-21 | Senior Scientific, LLC | Detection, measurement, and imaging of cells such as cancer and other biologic substances using targeted nanoparticles and magnetic properties thereof |
| AU2007321907A1 (en)* | 2006-11-20 | 2008-05-29 | Nativis, Inc. | Apparatus and method for transducing an in vitro or mammalian system with a low-frequency signal |
| DE102008019091A1 (en)* | 2008-04-16 | 2009-10-29 | Bmdsys Gmbh | Cryostat and biomagnetic measuring system with high frequency shielding |
| US8844298B2 (en) | 2008-11-18 | 2014-09-30 | S2 Corporation | Vibration reducing sample mount with thermal coupling |
| RU2518597C2 (en)* | 2008-12-19 | 2014-06-10 | Эском Холдингс Сок Лимитед | Method and system for monitoring signals from rotating machine shaft |
| RU2516201C2 (en)* | 2009-03-09 | 2014-05-20 | Эском Холдингз Сок Лимитед | Time domain electromagnetic interference monitoring method and system |
| US8307666B2 (en)* | 2009-03-27 | 2012-11-13 | S2 Corporation | Methods and apparatus for providing rotational movement and thermal stability to a cooled sample |
| WO2010117349A1 (en)* | 2009-04-08 | 2010-10-14 | Nativis, Inc. | Time-domain transduction signals and methods of their production and use |
| US20130165734A1 (en)* | 2009-04-08 | 2013-06-27 | Nativis, Inc. | Time-domain transduction signals and methods of their production and use |
| KR101012107B1 (en)* | 2009-04-22 | 2011-02-07 | 한국표준과학연구원 | Data Acquisition System of Multi-Channel SVID Signal |
| US8219574B2 (en) | 2009-06-22 | 2012-07-10 | Microsoft Corporation | Querying compressed time-series signals |
| US10194825B2 (en) | 2009-11-06 | 2019-02-05 | Imagion Biosystems Inc. | Methods and apparatuses for the localization and treatment of disease such as cancer |
| CN102695473B (en) | 2009-11-06 | 2015-09-23 | 纳米医学科学公司 | Detection, measurement and imaging of cells such as cancer cells and other biological matter using targeted nanoparticles and their magnetic properties |
| US20110195111A1 (en) | 2009-12-17 | 2011-08-11 | Nativis, Inc. | Aqueous compositions and methods |
| CN102043168B (en)* | 2010-10-15 | 2012-11-07 | 中国石油化工股份有限公司 | Method for carrying out simulation noise addition on digital signal |
| US9965250B2 (en)* | 2011-12-07 | 2018-05-08 | Quintessencelabs Pty Ltd. | Integrated quantum-random noise generator using quantum vacuum states of light |
| CA2879008A1 (en)* | 2012-07-11 | 2014-01-16 | Nativis, Inc. | Miniaturized molecular interrogation and data system |
| WO2015042688A1 (en)* | 2013-09-24 | 2015-04-02 | Enable Training And Consulting, Inc. | Systems and methods for remote learning |
| US9702846B2 (en) | 2013-11-08 | 2017-07-11 | Taiwan Semiconductor Manufacturing Company, Ltd. | Biosensor device and related method |
| US10132650B2 (en)* | 2015-01-22 | 2018-11-20 | Integrated Device Technology, Inc. | Apparatuses and related methods for detecting magnetic flux field characteristics with a wireless power transmitter |
| CN107250788B (en)* | 2015-02-16 | 2019-06-07 | 株式会社岛津制作所 | Noise level estimation method and determination data processing unit |
| WO2016141198A1 (en)* | 2015-03-05 | 2016-09-09 | Bio-Rad Laboratories, Inc. | Optimized spectral matching and display |
| US10602957B2 (en) | 2015-06-30 | 2020-03-31 | Varuna Biomedical Corporation | Systems and methods for detecting and visualizing biofields with nuclear magnetic resonance imaging and QED quantum coherent fluid immersion |
| JP6632901B2 (en) | 2016-02-03 | 2020-01-22 | サーパス工業株式会社 | Flow control device |
| WO2018052746A1 (en)* | 2016-09-19 | 2018-03-22 | Genovus Biotechnologies Inc. | System and method of delivering replicated therapeutic frequencies by pulsed electromagnetic field |
| WO2018089795A1 (en)* | 2016-11-10 | 2018-05-17 | Qoravita LLC | System and method for applying a low frequency magnetic field to biological tissues |
| CN108680770B (en)* | 2018-04-03 | 2023-08-22 | 中国科学院合肥物质科学研究院 | A general-purpose low-noise electrical measurement sample rod |
| US10641753B1 (en)* | 2018-10-25 | 2020-05-05 | The Boeing Company | Methods and systems for measuring concentrations of known components in gas samples using acoustic resonance |
| CA3097726A1 (en)* | 2019-11-01 | 2021-05-01 | James William Masten | Low-noise, large dynamic-range sensor for measuring current |
| WO2021236424A1 (en) | 2020-05-22 | 2021-11-25 | NearField Atomics Inc. | Systems for therapy delivery using near field magnetic induction devices |
| DE102020123072A1 (en) | 2020-09-03 | 2022-03-03 | Rosen Swiss Ag | Measuring method and measuring arrangement for interference suppression of a received signal of an EMAT converter |
| JP7529258B2 (en)* | 2020-11-04 | 2024-08-06 | 株式会社テイエルブイ | Wall thickness measurement system, wall thickness measurement method, wall thickness measurement program, and wall thickness measurement device |
| US12269484B2 (en) | 2021-02-26 | 2025-04-08 | NearField Atomics Inc. | Systems and methods to keep drivers, pilots, or others alert or focused by electromagnetic delivery of signals |
| US11633619B2 (en) | 2021-03-22 | 2023-04-25 | NearField Atomics Inc. | Systems and methods for measuring magnetic fields from solvated target molecules using a magnetoresistive sensor |
| CN116609402B (en)* | 2023-07-19 | 2023-09-15 | 中国地质大学(北京) | Method and system for identifying dielectric constant temperature effect of rock-soil body |
Family Cites Families (87)
| Publication number | Priority date | Publication date | Assignee | Title |
|---|---|---|---|---|
| US3443212A (en) | 1967-12-20 | 1969-05-06 | Atomic Energy Commission | Pulsed electromagnetic testing device with sampling means |
| US4031462A (en)* | 1975-07-07 | 1977-06-21 | Motorola, Inc. | Frequency spectrum analyzer |
| US4095168A (en)* | 1977-02-22 | 1978-06-13 | Varian Associates, Inc. | Rf pick-up coil circuit for a wide tuning range nuclear magnetic resonance probe |
| US4369226A (en) | 1979-03-19 | 1983-01-18 | California Institute Of Technology | Polyglutaraldehyde synthesis and protein bonding substrates |
| US4365303A (en)* | 1980-02-07 | 1982-12-21 | The Perkin-Elmer Corporation | Method and apparatus for determining the nature of an unknown chemical substance |
| US4751515A (en)* | 1980-07-09 | 1988-06-14 | Corum James F | Electromagnetic structure and method |
| EP0060392B1 (en) | 1981-03-06 | 1985-12-18 | Sodeco-Saia Ag | Coin testing apparatus |
| US4692685A (en)* | 1984-03-14 | 1987-09-08 | Blaze Kevin L | Electrical measuring apparatus, and methods for determining the condition or identity of biological material |
| DE3573018D1 (en)* | 1984-09-25 | 1989-10-19 | Richard Distl | Measurement arrangement for analysing electromagnetic radiation |
| FI851702A0 (en) | 1985-04-29 | 1985-04-29 | Labsystems Oy | FOERFARANDE OCH ANORDNING FOER UTFOERING IMMUNOBESTAEMNINGAR. |
| FR2598414B1 (en) | 1985-11-12 | 1988-10-14 | Centre Nat Rech Scient | PHARMACEUTICAL COMPOSITION CONTAINING HISPIDULIN OR A DERIVATIVE AND USE OF SUCH COMPOUNDS IN THE PREPARATION OF ANTI-ASTHMATIC COMPOSITIONS |
| US4682027A (en)* | 1986-04-25 | 1987-07-21 | Varian Associates, Inc. | Method and apparatus for sample confirmation in gas chromatography |
| CA2008009C (en)* | 1989-01-20 | 1994-05-03 | Hajime Hayashi | Apparatus for measuring magnetic field |
| FR2659553B1 (en) | 1990-03-13 | 1992-07-10 | Inst Nat Sante Rech Med | PROCESS FOR THE PREPARATION OF HOMEOPATHIC COMPOSITIONS FROM AN INITIAL SOLUTION CONTAINING AN ACTIVE SUBSTANCE. |
| FR2659740B1 (en) | 1990-03-13 | 1992-07-10 | Inst Nat Sante Rech Med | METHOD FOR CONTROLLING THE DILUTION AND CONTAMINATION OF HIGH DILUTION SOLUTIONS. |
| MY107650A (en)* | 1990-10-12 | 1996-05-30 | Exxon Res & Engineering Company | Method of estimating property and / or composition data of a test sample |
| US5254950A (en)* | 1991-09-13 | 1993-10-19 | The Regents, University Of California | DC superconducting quantum interference device usable in nuclear quadrupole resonance and zero field nuclear magnetic spectrometers |
| JPH0614899A (en)* | 1991-11-06 | 1994-01-25 | Mitsui Mining & Smelting Co Ltd | Brain magnetic field measurement device |
| US5311125A (en)* | 1992-03-18 | 1994-05-10 | Lake Shore Cryotronics, Inc. | Magnetic property characterization system employing a single sensing coil arrangement to measure AC susceptibility and DC moment of a sample |
| JPH05297089A (en)* | 1992-04-20 | 1993-11-12 | Sumitomo Electric Ind Ltd | Magnetic sensor |
| US5541413A (en)* | 1992-04-24 | 1996-07-30 | Thiokol Corporation | Acousto-optic tunable filter-based surface scanning system and process |
| US5305751A (en)* | 1992-06-04 | 1994-04-26 | Biomagnetic Technologies, Inc. | Measurement of liquid flows in a living organism |
| US5343147A (en)* | 1992-09-08 | 1994-08-30 | Quantum Magnetics, Inc. | Method and apparatus for using stochastic excitation and a superconducting quantum interference device (SAUID) to perform wideband frequency response measurements |
| US6028558A (en)* | 1992-12-15 | 2000-02-22 | Van Voorhies; Kurt L. | Toroidal antenna |
| FR2700628B1 (en) | 1993-01-21 | 1995-03-24 | Benvenistre Jacques | Method and device for transmitting in the form of a signal the biological activity of a carrier material to another carrier material, and for processing such a signal, and product obtained with such a method. |
| US5458142A (en)* | 1993-03-19 | 1995-10-17 | Farmer; Edward J. | Device for monitoring a magnetic field emanating from an organism |
| US5508203A (en)* | 1993-08-06 | 1996-04-16 | Fuller; Milton E. | Apparatus and method for radio frequency spectroscopy using spectral analysis |
| US7477053B2 (en)* | 1994-02-21 | 2009-01-13 | Carl Pinsky | Detection of electromagnetic fields |
| GB9403245D0 (en)* | 1994-02-21 | 1994-04-13 | Univ Manitoba | A device to monitor chemical reactions |
| US5583432A (en)* | 1994-04-11 | 1996-12-10 | Sci-Nostics Limited | Electrical method and apparatus for non-contact determination of physical and/or chemical properties of a sample, particularly of blood |
| US6020782A (en)* | 1994-05-25 | 2000-02-01 | The United States Of America As Represented By The Secretary Of The Navy | Noise assisted signal processor with nonlinearly coupled arrays of nonlinear dynamic elements |
| US5574369A (en)* | 1994-08-19 | 1996-11-12 | Hibbs; Andrew D. | Detection and communications device employing stochastic resonance |
| US5656937A (en)* | 1995-06-07 | 1997-08-12 | Conductus, Inc. | Low-noise symmetric dc SQUID system having two pairs of washer coils and a pair of Josephson junctions connected in series |
| US5696691A (en)* | 1995-06-29 | 1997-12-09 | The United States Of America As Represented By The Secretary Of The Navy | Self-adjusting statistical noise analyzer with interference suppression |
| US5734353A (en)* | 1995-08-14 | 1998-03-31 | Vortekx P.C. | Contrawound toroidal helical antenna |
| JP3473210B2 (en)* | 1995-08-31 | 2003-12-02 | 株式会社島津製作所 | Biomagnetic measurement device |
| US5789961A (en)* | 1996-06-28 | 1998-08-04 | The United States Of America As Represented By The Secretary Of The Navy | Noise- and coupling-tuned signal processor with arrays of nonlinear dynamic elements |
| JP3518184B2 (en)* | 1996-08-02 | 2004-04-12 | 株式会社日立製作所 | SQUID with integrated detection coil |
| US5944782A (en)* | 1996-10-16 | 1999-08-31 | Veritas Software Corporation | Event management system for distributed computing environment |
| JP3742998B2 (en)* | 1997-03-26 | 2006-02-08 | 住友電気工業株式会社 | Method and apparatus for detecting magnetic substance concentration |
| US5959548A (en)* | 1997-10-31 | 1999-09-28 | Halliburton Energy Services, Inc. | Electromagnetic signal pickup device |
| US6133734A (en)* | 1997-12-30 | 2000-10-17 | Schlumberger Technology Corporation | Method and apparatus for evaluating an earth formation using nuclear magnetic resonance techiques |
| JP3334599B2 (en)* | 1998-03-12 | 2002-10-15 | ティーディーケイ株式会社 | Method and apparatus for measuring magnetization direction of magnetoresistive element |
| US6196057B1 (en)* | 1998-04-02 | 2001-03-06 | Reliance Electric Technologies, Llc | Integrated multi-element lubrication sensor and lubricant health assessment |
| FR2777656B1 (en) | 1998-04-20 | 2000-06-16 | Digibio | METHOD FOR AMPLIFYING THE FORMATION OF LIGAND-RECEPTOR COMPLEXES AND USES THEREOF |
| FR2780651B1 (en) | 1998-07-01 | 2001-07-20 | Digibio | METHOD FOR ACTIVATING AN INACTIVE AND VERY LOW CONCENTRATION SOLUTION OF A BIOLOGICAL AND / OR CHEMICAL SUBSDETERMINE IN A SOLVENT |
| US6084242A (en) | 1998-07-06 | 2000-07-04 | Brown, Jr. Doyle S. | Method and device for stimulating the immune system and generating healing at the cellular level |
| US6159444A (en)* | 1998-09-11 | 2000-12-12 | The Regents Of The University Of California | NMR/MRI with hyperpolarized gas and high Tc SQUID |
| FR2783606B1 (en) | 1998-09-23 | 2000-11-24 | Digibio | METHOD AND SYSTEM FOR PRODUCING A SUBSTANCE OR SIGNAL HAVING A COAGULATING OR ANTICOAGULATING EFFECT. THERAPEUTIC APPLICATIONS OF SAID SUBSTANCE OR SIGNAL |
| FR2783605A1 (en)* | 1998-09-23 | 2000-03-24 | Digibio | Production of electromagnetic signals from a biological or chemical sample, characteristic of their active ingredients, which can then be transmitted to a remote location |
| JP3655753B2 (en)* | 1998-10-07 | 2005-06-02 | 日本電気株式会社 | Superconducting current measuring circuit and current measuring device using it |
| JP2002532690A (en)* | 1998-12-10 | 2002-10-02 | ユニバーシティー オブ メリーランド | Scanning single-electron transistor microscope for imaging objects at ambient temperature |
| US6323632B1 (en)* | 1999-08-13 | 2001-11-27 | Coulter International Corp. | Solid state RF oscillator-detector for flow cytometer |
| US6142681A (en)* | 1999-02-22 | 2000-11-07 | Vialogy Corporation | Method and apparatus for interpreting hybridized bioelectronic DNA microarray patterns using self-scaling convergent reverberant dynamics |
| US6136541A (en)* | 1999-02-22 | 2000-10-24 | Vialogy Corporation | Method and apparatus for analyzing hybridized biochip patterns using resonance interactions employing quantum expressor functions |
| US6411108B1 (en)* | 1999-11-05 | 2002-06-25 | Sensor Technologies, Inc. | Noncontact signal analyzer |
| US6285249B1 (en)* | 2000-01-21 | 2001-09-04 | The United States Of America As Represented By The Secretary Of The Navy | Controlled stochastic resonance circuit |
| US7130692B2 (en) | 2000-02-23 | 2006-10-31 | The Trustees Of The University Of Pennsylvania | Portable electrotherapy device for treating osteoarthritis and other diseases, defects and injuries of the knee joint |
| US6201821B1 (en)* | 2000-06-05 | 2001-03-13 | Agilent Technologies, Inc. | Coherent population trapping-based frequency standard having a reduced magnitude of total a.c. stark shift |
| CA2420749A1 (en)* | 2000-09-11 | 2002-03-21 | Berkshire Laboratories, Inc. | Spectral chemistry |
| US6586931B2 (en)* | 2001-04-20 | 2003-07-01 | Baker Hughes Incorporated | NMR logging in the earth's magnetic field |
| JP3757815B2 (en)* | 2001-04-27 | 2006-03-22 | 株式会社日立製作所 | Biomagnetic field measurement device |
| JP4193382B2 (en)* | 2001-07-19 | 2008-12-10 | 株式会社日立製作所 | Magnetic field measuring device |
| US6760674B2 (en)* | 2001-10-08 | 2004-07-06 | Microchip Technology Incorporated | Audio spectrum analyzer implemented with a minimum number of multiply operations |
| US6885192B2 (en)* | 2002-02-06 | 2005-04-26 | The Regents Of The University Of California | SQUID detected NMR and MRI at ultralow fields |
| US6687154B2 (en) | 2002-02-25 | 2004-02-03 | Aplus Flash Technology, Inc. | Highly-integrated flash memory and mask ROM array architecture |
| JP2005519742A (en)* | 2002-03-13 | 2005-07-07 | スリニバサン,ゴパラクリスナン | Process and synthesis equipment for molecular engineering and synthesis of materials |
| US6995558B2 (en) | 2002-03-29 | 2006-02-07 | Wavbank, Inc. | System and method for characterizing a sample by low-frequency spectra |
| US6724188B2 (en) | 2002-03-29 | 2004-04-20 | Wavbank, Inc. | Apparatus and method for measuring molecular electromagnetic signals with a squid device and stochastic resonance to measure low-threshold signals |
| JP2005523460A (en)* | 2002-04-19 | 2005-08-04 | ワブバンク インコーポレイテッド | Method, apparatus and system for sample detection based on low frequency spectral components |
| US9656096B2 (en) | 2003-12-05 | 2017-05-23 | Rio Grande Neurosciences, Inc. | Method and apparatus for electromagnetic enhancement of biochemical signaling pathways for therapeutics and prophylaxis in plants, animals and humans |
| CA2569202A1 (en) | 2004-05-28 | 2005-12-15 | Board Of Regents, The University Of Texas System | Multigene predictors of response to chemotherapy |
| US20060030896A1 (en) | 2004-07-09 | 2006-02-09 | Simon Bruce J | Pulsed electromagnetic field method of treatment of degenerative disc disease |
| CA2573350C (en) | 2004-07-27 | 2014-05-13 | Nativis, Inc. | System and method for collecting, storing, processing, transmitting and presenting very low amplitude signals |
| WO2006060653A2 (en) | 2004-11-30 | 2006-06-08 | Veridex Llc | Lung cancer prognostics |
| US7573264B2 (en) | 2005-11-28 | 2009-08-11 | The Regents Of The University Of California | Atomic magnetic gradiometer for room temperature high sensitivity magnetic field detection |
| US7575934B2 (en)* | 2006-07-07 | 2009-08-18 | Nativis, Inc. | Oriented magnetic particle-fluorescence detectable moiety compositions and methods of making and using the same |
| JP2010501172A (en) | 2006-08-25 | 2010-01-21 | オンコセラピー・サイエンス株式会社 | Prognostic markers and therapeutic targets for lung cancer |
| US7521928B2 (en) | 2006-11-07 | 2009-04-21 | Trustees Of Princeton University | Subfemtotesla radio-frequency atomic magnetometer for nuclear quadrupole resonance detection |
| AU2007321907A1 (en) | 2006-11-20 | 2008-05-29 | Nativis, Inc. | Apparatus and method for transducing an in vitro or mammalian system with a low-frequency signal |
| US8054073B2 (en) | 2008-05-21 | 2011-11-08 | Entanglement Technologies, Llc | Method and apparatus for implementing EIT magnetometry |
| WO2010117349A1 (en) | 2009-04-08 | 2010-10-14 | Nativis, Inc. | Time-domain transduction signals and methods of their production and use |
| US20130165734A1 (en) | 2009-04-08 | 2013-06-27 | Nativis, Inc. | Time-domain transduction signals and methods of their production and use |
| US8605282B2 (en) | 2009-05-08 | 2013-12-10 | Ben-Gurion University Of The Negev Research And Development Authority | Method and apparatus for high precision spectroscopy |
| US20110195111A1 (en) | 2009-12-17 | 2011-08-11 | Nativis, Inc. | Aqueous compositions and methods |
| CA2879008A1 (en) | 2012-07-11 | 2014-01-16 | Nativis, Inc. | Miniaturized molecular interrogation and data system |
| EP2968967A4 (en) | 2013-03-15 | 2016-08-17 | Nativis Inc | Controller and flexible coils for administering therapy, such as for cancer therapy |
- 2005
- 2005-07-27CACA2573350Apatent/CA2573350C/ennot_activeExpired - Lifetime
- 2005-07-27USUS11/632,340patent/US20070231872A1/ennot_activeAbandoned
- 2005-07-27EPEP05775797Apatent/EP1779122A4/ennot_activeWithdrawn
- 2005-07-27JPJP2007523767Apatent/JP4726900B2/ennot_activeExpired - Lifetime
- 2005-07-27WOPCT/US2005/026678patent/WO2006073491A2/enactiveApplication Filing
- 2005-07-27AUAU2005323470Apatent/AU2005323470A1/ennot_activeAbandoned
- 2005-07-27CACA2574616Apatent/CA2574616C/ennot_activeExpired - Lifetime
- 2005-07-27BRBRPI0512678-9Apatent/BRPI0512678B1/enactiveIP Right Grant
- 2005-07-27JPJP2007523775Apatent/JP5624708B2/ennot_activeExpired - Lifetime
- 2005-07-27WOPCT/US2005/026629patent/WO2006015038A2/enactiveApplication Filing
- 2005-07-27CNCN2005800251992Apatent/CN101031796B/ennot_activeExpired - Lifetime
- 2005-07-27AUAU2005269345Apatent/AU2005269345B2/ennot_activeExpired
- 2005-07-27BRBRPI0513910-4Apatent/BRPI0513910A/ennot_activeApplication Discontinuation
- 2005-07-27EPEP05856886Apatent/EP1792179A2/ennot_activeWithdrawn
- 2008
- 2008-09-11USUS12/209,088patent/US20090156659A1/ennot_activeAbandoned
- 2010
- 2010-11-26AUAU2010246466Apatent/AU2010246466A1/ennot_activeAbandoned
- 2011
- 2011-04-21AUAU2011201847Apatent/AU2011201847B2/ennot_activeExpired
- 2012
- 2012-07-20USUS13/555,025patent/US9417257B2/enactiveActive
Cited By (9)
| Publication number | Priority date | Publication date | Assignee | Title |
|---|---|---|---|---|
| CN102692436A (en)* | 2012-06-11 | 2012-09-26 | 浙江工商大学 | Electrochemical detection method |
| CN108310655A (en)* | 2013-03-15 | 2018-07-24 | 纳特维斯公司 | For implementing to treat, such as the controller and flexible coil for the treatment of of cancer |
| CN116973563A (en)* | 2023-09-22 | 2023-10-31 | 宁波奥丞生物科技有限公司 | Immunofluorescence chromatography determination method and device based on quadrature phase-locked amplification |
| CN116973563B (en)* | 2023-09-22 | 2023-12-19 | 宁波奥丞生物科技有限公司 | Immunofluorescence chromatography determination method and device based on quadrature phase-locked amplification |
| CN117977240A (en)* | 2024-02-27 | 2024-05-03 | 中国计量科学研究院 | Device and method for connecting superconducting quantum interference device and superconducting capture coil |
| CN119959168A (en)* | 2025-01-17 | 2025-05-09 | 久兴隆工程技术无锡有限公司 | Photoelectric gas monitoring device and method |
| CN119959168B (en)* | 2025-01-17 | 2025-09-12 | 久兴隆工程技术无锡有限公司 | Photoelectric gas monitoring device and method |
| CN120372259A (en)* | 2025-06-27 | 2025-07-25 | 北京清畅电力技术股份有限公司 | Misoperation identification method for high-voltage switch cabinet |
| CN120372259B (en)* | 2025-06-27 | 2025-09-12 | 北京清畅电力技术股份有限公司 | A method for identifying incorrect operation of high-voltage switchgear |
Also Published As
| Publication number | Publication date |
|---|---|
| WO2006015038A2 (en) | 2006-02-09 |
| US20070231872A1 (en) | 2007-10-04 |
| CA2573350C (en) | 2014-05-13 |
| BRPI0512678A (en) | 2008-04-01 |
| US9417257B2 (en) | 2016-08-16 |
| EP1779122A4 (en) | 2011-01-19 |
| BRPI0512678B1 (en) | 2018-02-14 |
| CA2574616A1 (en) | 2006-07-13 |
| WO2006073491A9 (en) | 2006-09-14 |
| AU2005323470A1 (en) | 2006-07-13 |
| WO2006073491A2 (en) | 2006-07-13 |
| BRPI0513910A (en) | 2008-05-20 |
| AU2011201847B2 (en) | 2013-09-26 |
| JP5624708B2 (en) | 2014-11-12 |
| US20130041201A1 (en) | 2013-02-14 |
| CN101031796B (en) | 2012-05-16 |
| AU2010246466A1 (en) | 2010-12-16 |
| EP1779122A2 (en) | 2007-05-02 |
| US20090156659A1 (en) | 2009-06-18 |
| WO2006015038A3 (en) | 2008-10-16 |
| CA2574616C (en) | 2019-04-30 |
| AU2011201847A1 (en) | 2011-05-19 |
| WO2006073491A3 (en) | 2007-03-08 |
| EP1792179A2 (en) | 2007-06-06 |
| CA2573350A1 (en) | 2006-02-09 |
| AU2005269345A1 (en) | 2006-02-09 |
| JP2008508523A (en) | 2008-03-21 |
| AU2005269345B2 (en) | 2010-08-26 |
| JP4726900B2 (en) | 2011-07-20 |
| JP2008507977A (en) | 2008-03-21 |
| WO2006015038A8 (en) | 2007-05-24 |
Similar Documents
| Publication | Publication Date | Title |
|---|---|---|
| CN101031796A (en) | System and method for producing chemical or biochemical signals | |
| KR20090106484A (en) | Apparatus and method for converting in vitro or mammalian systems into low frequency signals | |
| Renew et al. | Sensitive detection and localization of hydroxyl radical production in cucumber roots and Arabidopsis seedlings by spin trapping electron paramagnetic resonance spectroscopy | |
| Canellas et al. | Humic acids isolated from earthworm compost enhance root elongation, lateral root emergence, and plasma membrane H+-ATPase activity in maize roots | |
| Wang et al. | A quick isolation method for mutants with high lipid yield in oleaginous yeast | |
| Li et al. | Investigating the regulation of one-carbon metabolism in Arabidopsis thaliana | |
| WO2011075692A1 (en) | Aqueous compositions and methods | |
| CN1582400A (en) | Magnetic resonance spectroscopy to identify and classify microorganisms | |
| Weng et al. | Multi-element stable isotope Raman microspectroscopy of bacterial carotenoids unravels rare signal shift patterns and single-cell phenotypic heterogeneity | |
| Yang et al. | Metabolic discrimination of Catharanthus roseus calli according to their relative locations using 1H-NMR and principal component analysis | |
| Ye et al. | Biochemical synthesis of uniformly 13C-labeled diterpene hydrocarbons and their bioconversion to diterpenoid phytoalexins in planta | |
| WO2010117349A1 (en) | Time-domain transduction signals and methods of their production and use | |
| Tambunan et al. | Cultivation of Chlorella DPK-01 using audible sound (music) as a potential strategy for improving photobioreactor system | |
| Hu et al. | Mechanism of GA-mediated leaf sheath growth in rice: a proteomic approach | |
| Wang et al. | Effect of low frequency alternating magnetic field for erythritol production in Yarrowia lipolytica | |
| Khan et al. | LC–MS and GC-MS-based bioactive metabolites profiling of endophytic bacterium from Humulus lupulus and production of Indole-3-acetic acid. | |
| Hu et al. | Engineering Yarrowia lipolytica for Enhanced Gastrodin Production via High‐Throughput Screening and Transcriptomics‐Guided Optimization | |
| Bonomi et al. | Characterization, Properties and Applications | |
| Shah Bukhari et al. | Measurement of Intrinsic Physiological Membrane Noise in Cultured Living Cells | |
| Puač | Development, diagnostic and applications of radio-frequency plasma reactor | |
| Malkawi | Isolation and characterization of (-)-Jasmonic acid from corn kernels | |
| HK1130899A (en) | System and method for collecting, storing, processing, transmitting and presenting very low amplitude signals |
Legal Events
| Date | Code | Title | Description |
|---|---|---|---|
| C06 | Publication | ||
| PB01 | Publication | ||
| C10 | Entry into substantive examination | ||
| SE01 | Entry into force of request for substantive examination | ||
| C14 | Grant of patent or utility model | ||
| GR01 | Patent grant | ||
| CX01 | Expiry of patent term | ||
| CX01 | Expiry of patent term | Granted publication date:20120516 |